
Gastroretentive drug delivery outsourcing in Australia
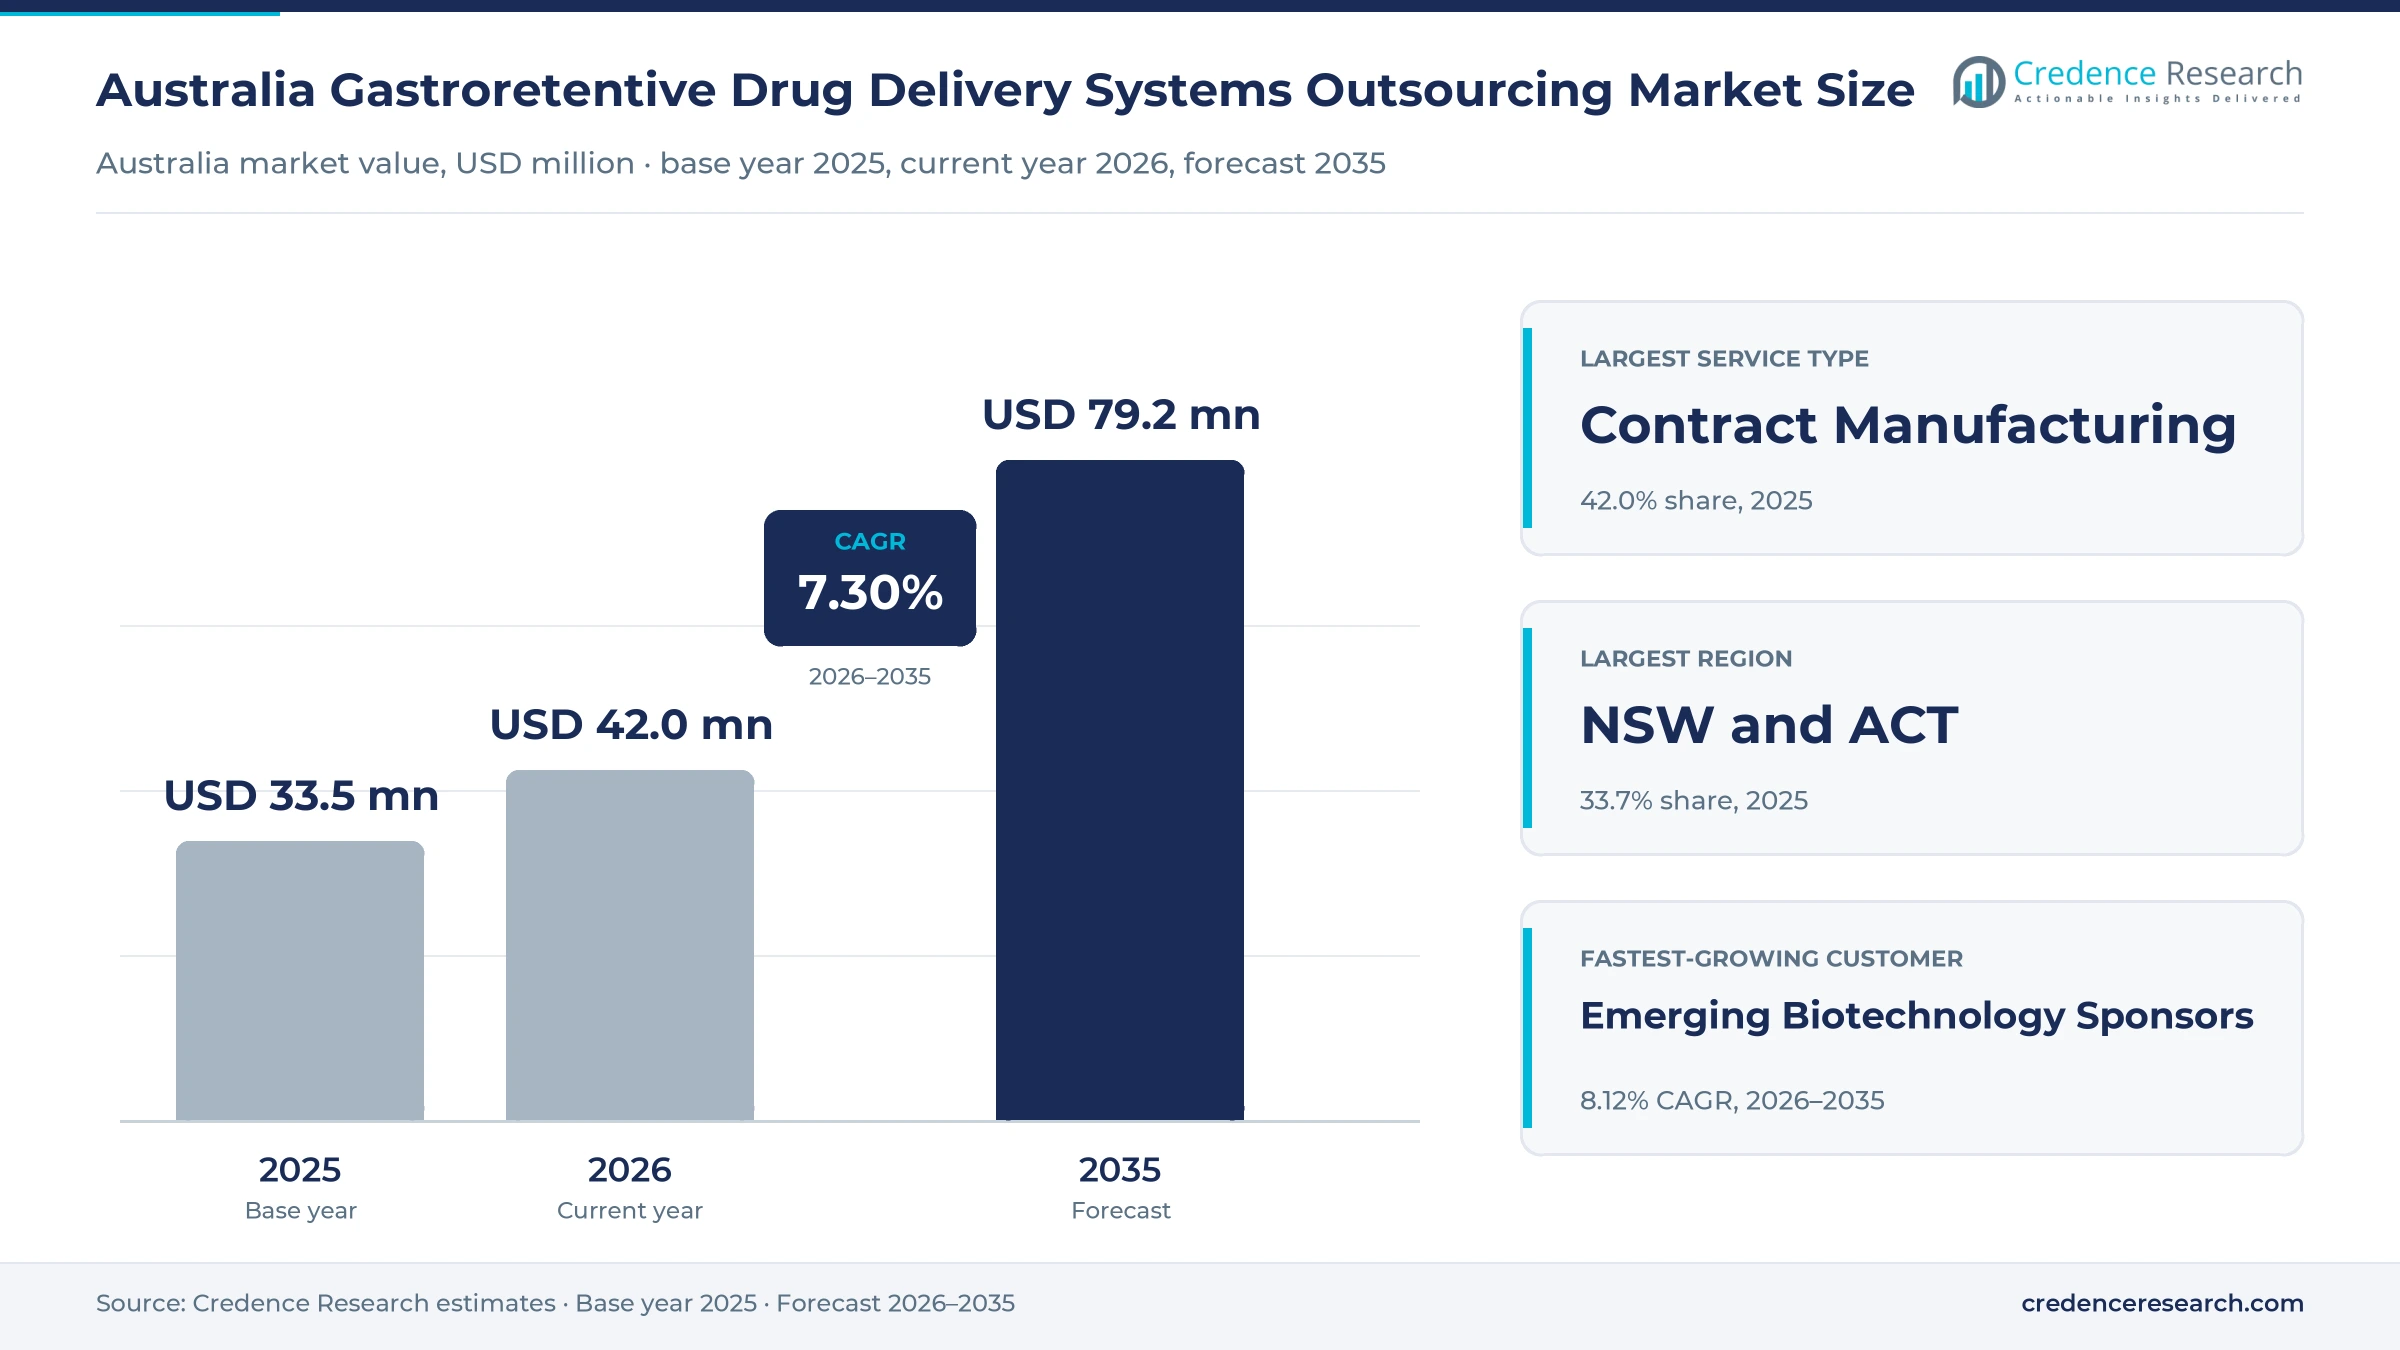
The Australia gastroretentive drug delivery systems outsourcing market was valued at USD 33.5 million in 2025 and is projected to increase from USD 42.0 million in 2026 to USD 79.2 million by 2035, registering a CAGR of 7.30% during 2026–2035. Demand comes from sponsors that need oral medicines to stay in the stomach longer, so drugs absorbed high in the gut reach patients with fewer daily doses. New South Wales and Australian Capital Territory held the largest regional share, 33.7% in 2025, because Sydney hosts the largest pool of business research spending and pharmaceutical head offices. Victoria and Tasmania is the fastest-growing region at 7.59% a year, as Melbourne combines oral dose manufacturing, clinical supply packaging and a leading pharmacy school. In turn, the trial notification pathway shapes buying, because sponsors can supply an unapproved product once a notification and fee are lodged, which rewards contract partners that deliver trial batches and quality documents quickly.
Which outsourced stomach-retention work does the estimate count?
The estimate measures fees that pharmaceutical, biotechnology, generic and public research sponsors pay to contract partners for formulation development, manufacturing, analytical testing, packaging and regulatory support of oral products designed to stay in the stomach. It counts floating, bioadhesive, swelling and other retention designs, whether the work is delivered in Australia, offshore or through a mix of both.
The estimate excludes sponsor work done in their own laboratories, sales of finished medicines, and conventional immediate-release or enteric tablets that do not rely on gastric retention. The value chain runs from sponsors through development and manufacturing partners to clinical supply packagers, which prepare trial and commercial packs for Australian sites and export markets.
Australia Gastroretentive Drug Delivery Systems Outsourcing Market Insights
- The Australia gastroretentive drug delivery systems outsourcing market was valued at USD 33.5 million in 2025 and is projected to reach USD 79.2 million by 2035, registering a CAGR of 7.30% during 2026–2035.
- New South Wales and Australian Capital Territory held a 33.7% share of 2025 value, because Sydney hosts the largest pool of business research spending.
- Contract Manufacturing led service types with a 42.0% share of 2025 value, because retention tablets need specialized compression, coating and release testing.
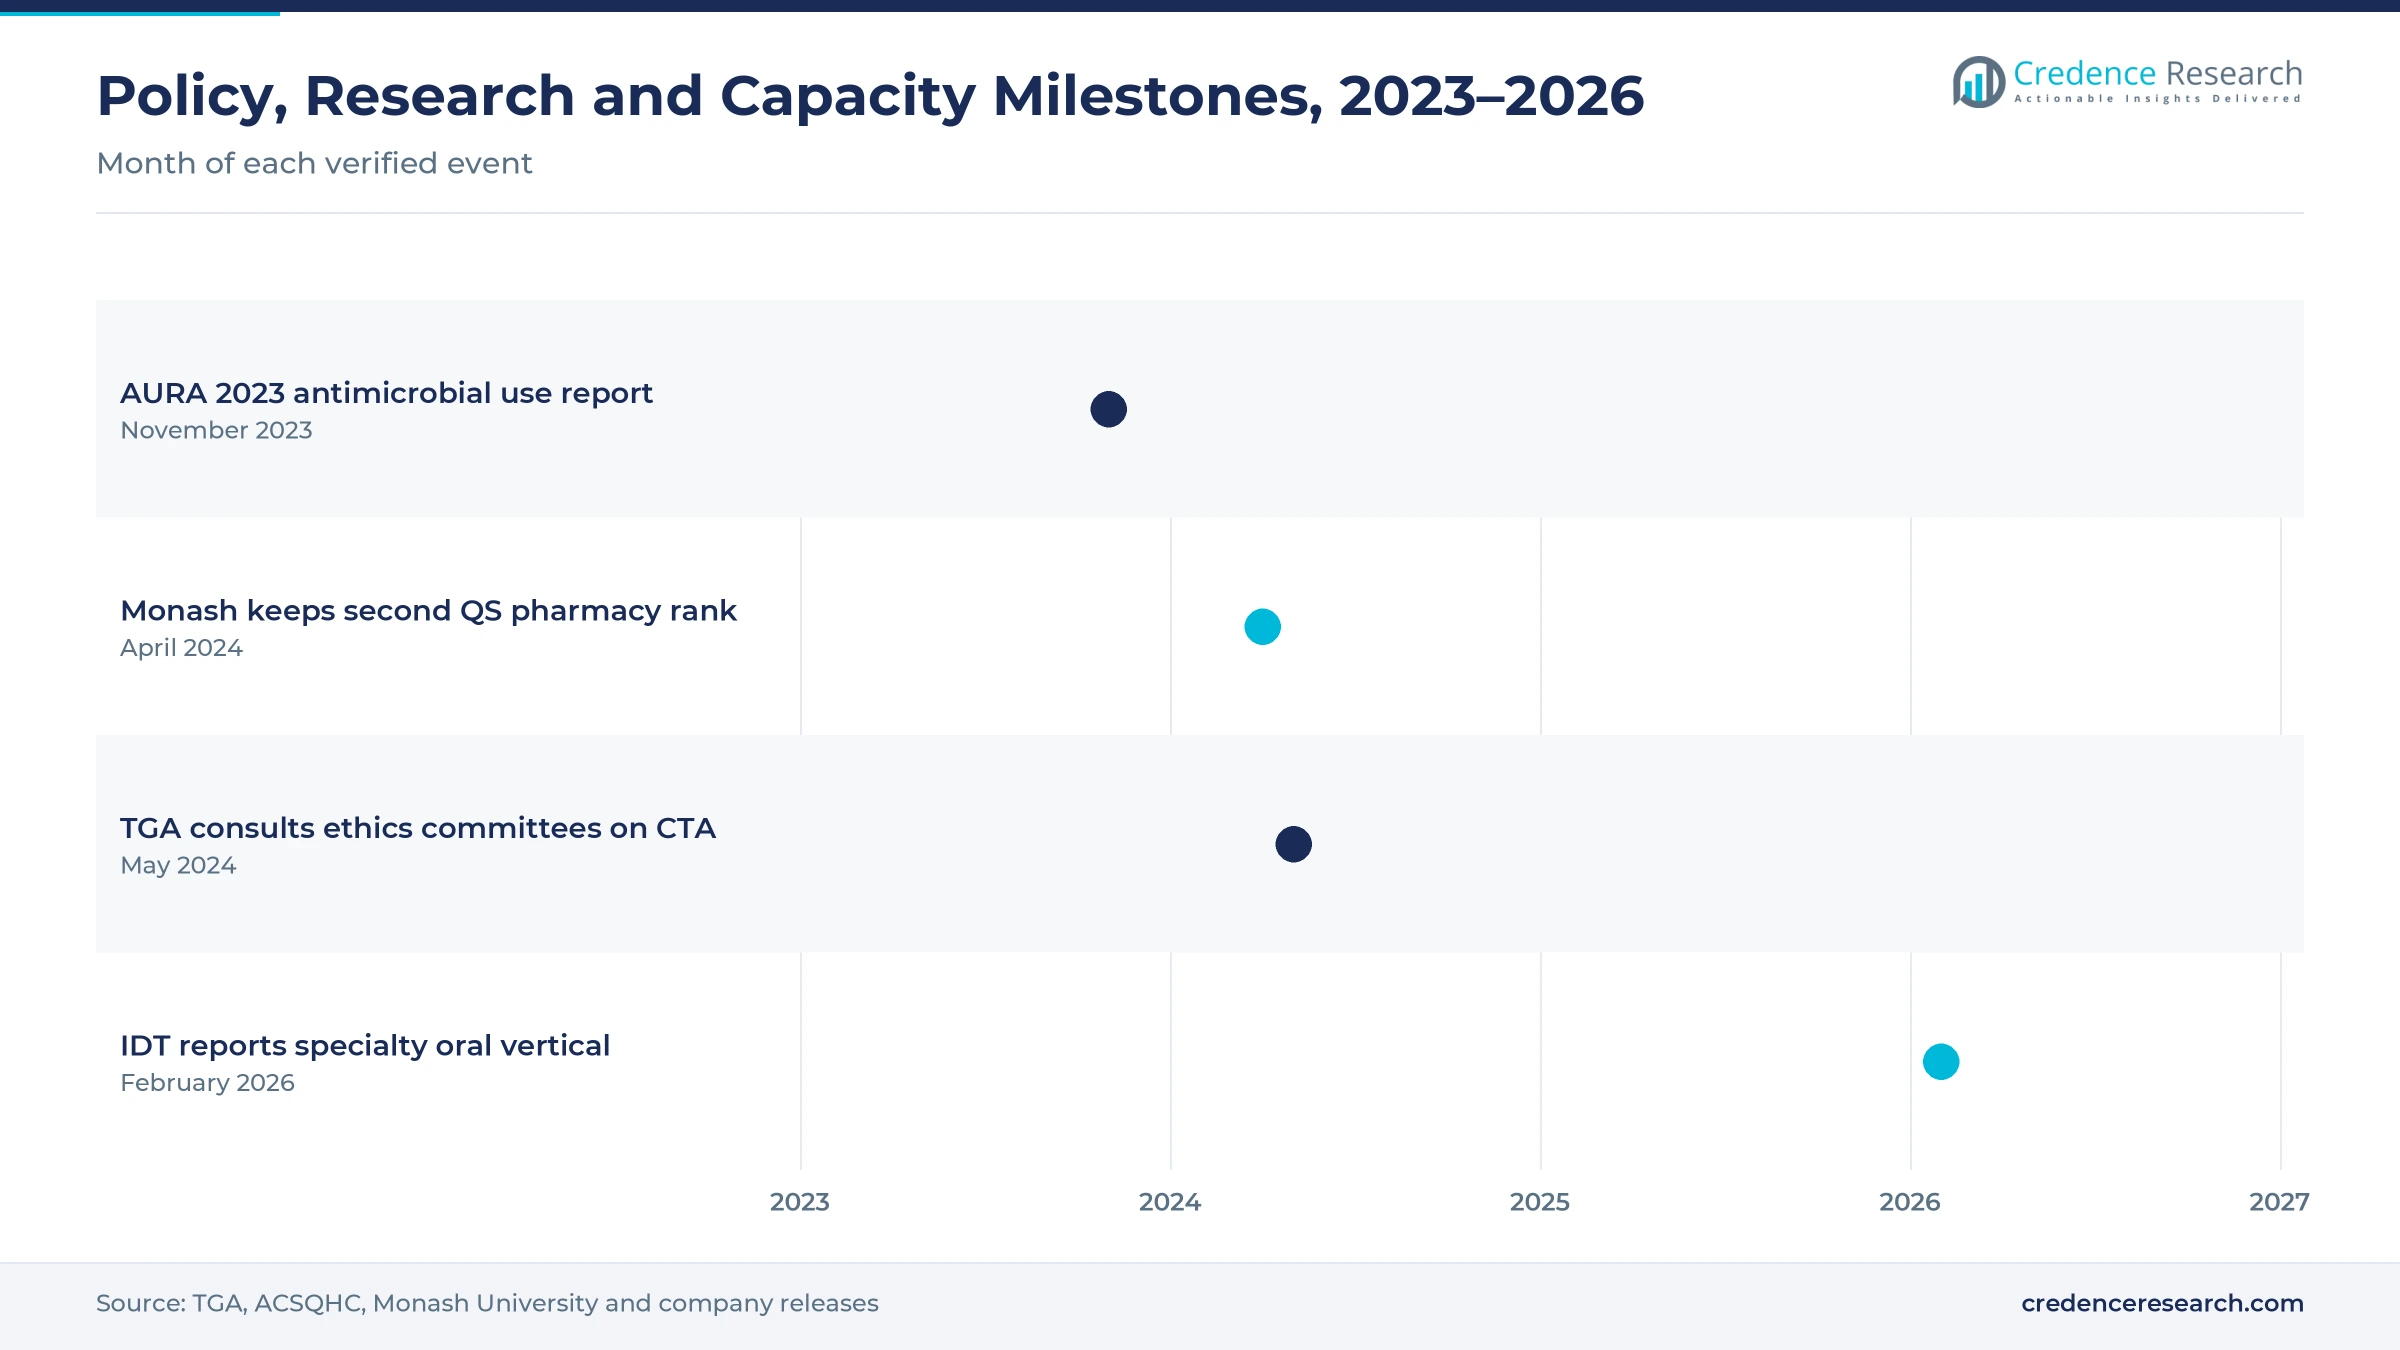
- IDT Australia reported in February 2026 that it now runs a specialty oral manufacturing vertical for capsules, tablets and liquid oral products.
- Emerging Biotechnology Sponsors grow fastest among customers at 8.12% a year, as small companies lean on outsourced partners for trial supply during 2026–2035.
Contract manufacturing leads as formulation work grows
Why does contract manufacturing hold the largest share?
Based on service type, the market is categorized into Formulation Development, Contract Manufacturing, Analytical and Quality Control Testing, and Packaging and Regulatory Support. Contract Manufacturing led with a 42.0% share of 2025 value, because retention tablets need specialized compression, coating and scale-up. Formulation Development grows fastest at 7.85% a year, as more sponsors bring early reformulation programs to Australian trials.
Which retention technology attracts the most outsourced work?
Based on technology, the market is categorized into Floating Systems, Bioadhesive Systems, Swelling and Expanding Systems, and Alternative Retention Systems. Floating Systems led with a 41.0% share of 2025 value, because gas-generating and low-density tablets use familiar excipients and equipment. Alternative Retention Systems grow fastest at 8.04% a year, as sponsors test unfolding and magnetic designs for longer residence times.
Which therapy areas generate the most programs?
Based on application, the market is categorized into Gastrointestinal Disorders, Neurological Disorders, Diabetes and Metabolic Disorders, Anti-Infective Therapy and Additional Therapeutic Applications. Gastrointestinal Disorders led with a 30.0% share of 2025 value, because acid and ulcer treatments act locally in the stomach. Neurological Disorders grow fastest at 7.84% a year, as once-daily dosing helps older patients on complex regimens.
Which sponsors buy most outsourced retention work?
Based on customer type, the market is categorized into Established Pharmaceutical Sponsors, Emerging Biotechnology Sponsors, Generic and Reformulation Sponsors, and Academic and Public Research Sponsors. Established Pharmaceutical Sponsors led with a 44.0% share of 2025 value, because they hold most marketed controlled-release brands. Emerging Biotechnology Sponsors grow fastest at 8.12% a year, because small companies rarely own oral manufacturing plants.
| Segment Group | Leading Sub-segment | Share, 2025 | Fastest-growing Sub-segment | CAGR, 2026–2035 |
|---|---|---|---|---|
| By Service Type | Contract Manufacturing | 42.0% | Formulation Development | 7.85% |
| By Technology | Floating Systems | 41.0% | Alternative Retention Systems | 8.04% |
| By Application | Gastrointestinal Disorders | 30.0% | Neurological Disorders | 7.84% |
| By Customer Type | Established Pharmaceutical Sponsors | 44.0% | Emerging Biotechnology Sponsors | 8.12% |
Request a Free Sample
Fill in your details and we'll send you a free sample report.
- Sample data tables & charts
- Research methodology
Chronic disease, trial access and tax offsets lift demand
Which patient pools make stomach-retention designs relevant?
Demand is selective, because gastric retention helps mainly drugs that are absorbed high in the gut or act inside the stomach, and Australia has large patient pools in exactly those areas. About 1.3 million people, or 5.3% of the population, had diabetes in 2022, according to the Australian Bureau of Statistics, and type 2 made up 87.6% of cases. The same survey found prevalence rising from 1.0% among people under 45 to 18.7% among those aged 75 and over. The Australian Commission on Safety and Quality in Health Care reported that 36.6% of Australians had at least one antimicrobial supplied in 2022. As a result, metabolic and anti-infective programs add steady volume, while Gastrointestinal Disorders still hold 30.0% of 2025 value.
How does clinical development infrastructure pull work in?
Australia's trial base gives sponsors a reason to develop and test retention products locally, which creates demand for formulation and clinical batch work close to the sites. More than 18,000 trials recruiting in Australia were registered between 2006 and 2020, according to a study in the Medical Journal of Australia hosted by the National Institutes of Health. Earlier-phase drug trials rose from 9% of registrations in 2006 to 40% in 2020, and 45% of all trials declared industry involvement. Monash University was ranked second in the world for pharmacy and pharmacology in the 2024 QS subject rankings, which supports local formulation science. In turn, Formulation Development grows fastest among service types at 7.85% a year.
How do the CTN and CTA trial schemes shape outsourcing?
Australia runs two schemes for supplying unapproved goods in trials, and both reward partners that deliver clean quality documentation quickly. Under the Clinical Trial Notification scheme, the Therapeutic Goods Administration does not evaluate trial data at notification, and recruitment does not need to wait for its acknowledgment. Under the Clinical Trial Approval scheme, the regulator evaluates quality, preclinical and early clinical safety data, usually in two rounds plus one request for information. The CTA scheme is mandatory for Class 4 biologicals, while sponsors choose the pathway for most oral products and must report supply at each CTA site within 28 days. The regulator consulted ethics committees on a review of the CTA scheme in May 2024. As a result, regulatory support is part of most retention programs.
Why do tax offsets and business R&D widen the buyer pool?
Federal tax support lowers the net cost of outsourced development, which lets small sponsors fund more formulation and clinical supply work. Companies with aggregated turnover below AUD 20 million receive a refundable offset equal to their company tax rate plus an 18.5% premium, according to the Australian Taxation Office. Business expenditure on research and development reached AUD 24.41 billion in 2023-24, up 18% from 2021-22, according to the Australian Bureau of Statistics. New South Wales accounted for 39% of that spending and Victoria for 28% in the same year. As a result, emerging biotechnology sponsors grow fastest among customers at 8.12% a year.
Global supply groups and onshore oral capacity reshape work
Why is clinical supply shifting into global service groups?
Australian clinical supply and oral dose assets are shifting into global service groups, which gives overseas sponsors one partner for Australian trials and later supply abroad. PCI Pharma Services completed its acquisition of Melbourne-based Pharmaceutical Packaging Professionals in March 2018 and planned to make Melbourne its Asia Pacific headquarters, according to Drug Development and Delivery. Catalent acquired Dee Why packaging firm Pharmapak in 2015 to add blister and bottle packing for oral medicines. Thermo Fisher runs a Patheon biologics site in Brisbane with single-use bioreactors from 250 to 2,000 liters, according to Patheon. In turn, Contract Manufacturing keeps 42.0% of 2025 value as sponsors buy integrated programs.
How is onshore specialty oral capacity emerging?
Onshore oral capacity is rising in a more specialized form, which matters for sponsors that want small retention batches made close to Australian trial sites. IDT Australia reported in February 2026 that it now runs three verticals, including specialty oral manufacturing of capsules, tablets and liquid oral products, according to Small Caps. The company described an end-to-end GMP offering that runs from clinical trial supply to commercial supply. Blackmores completed its acquisition of the Braeside soft-gel and tablet plant from Catalent in October 2019 for AUD 53 million, according to Australian Manufacturing, which said the site employs almost 300 staff and supplies about half of the group's tablet and capsule needs. As a result, Victoria and Tasmania, home to the Boronia and Braeside sites, already holds 24.6% of 2025 value.
Can national trial reform open more sponsor programs?
Trial reform offers an opening for partners that serve overseas biotechs, because faster site start-up shortens the wait between formulation work and the first dose. The Encouraging More Clinical Trials in Australia agreement provides AUD 13.6 million and runs until June 30, 2029, according to the federal financial relations portal. That funding supports the National One Stop Shop and national trial procedures across jurisdictions. Stakeholders have also called for clearer communication about the CTA pathway, which the regulator's ongoing review aims to address. Schedules are listed for seven states and territories, which shows broad agreement on the national approach. As a result, emerging biotechnology sponsors and their contract research partners gain a clearer route to Australian studies.
Is there room in neurological and novel retention programs?
Neurological therapies offer room for growth, because once-daily oral products can simplify treatment for older patients who take several medicines and struggle with frequent dosing. More than 150,000 people live with Parkinson's in Australia, and incidence rates rise 4% a year, according to Parkinson's Australia. Diabetes prevalence of 18.7% among people aged 75 and over adds more older patients who take several oral drugs a day. Sponsors exploring oral controlled-release technology increasingly test unfolding and expanding designs alongside floating tablets, because these can hold a dose in the stomach for longer periods. As a result, neurological disorders grow fastest at 7.84% a year, while alternative retention systems grow at 8.04%.
Small batches, formulation risk and offshore costs
How do small batch sizes limit local manufacturing economics?
Retention tablets for a country of Australia's size are made in small batches, which spreads equipment and validation costs across fewer units. As a result, sponsors often place commercial supply offshore even when development starts locally. Local partners respond by focusing on clinical batches, niche products and specialty orals, where speed and regulatory familiarity matter more than unit cost. This leaves Australian plants exposed when a product moves from trial to full commercial volume.
Why does formulation risk raise development costs?
Gastric retention depends on food intake, stomach emptying and patient posture, so formulations that work in the laboratory can behave differently in people. In turn, sponsors need more pilot batches, dissolution methods and early human studies before they commit to a design. These steps raise costs for small sponsors and delay decisions on manufacturing partners. Experienced partners respond by offering combined formulation, testing and clinical supply packages that shorten each iteration.
How does offshore delivery compete with local partners?
Global development groups with large oral dose plants in Asia, Europe and North America can quote lower prices for scale-up, which draws commercial work away from Australia. As a result, Australian partners compete mainly on speed to trial, local regulatory knowledge and smaller minimum batches. Offshore supply also adds shipping time and import paperwork for trial materials. Sponsors respond with hybrid models that keep clinical supply local and move commercial volumes abroad.
Why does approval reform still leave timing uncertainty?
Trial start-up still depends on ethics and governance reviews across several jurisdictions, which can delay the first clinical batch orders that partners plan around. The national reform agreement lists executed schedules for seven jurisdictions, and the ACT is not yet listed. In turn, sponsors may phase formulation work cautiously until site approvals are clear. Partners respond by starting method and stability work early, so trial batches are ready when sites open.
NSW and ACT lead while Victoria and Tasmania grow fastest
| Region | Value, 2025 (USD million) | Share, 2025 | CAGR, 2026–2035 |
|---|---|---|---|
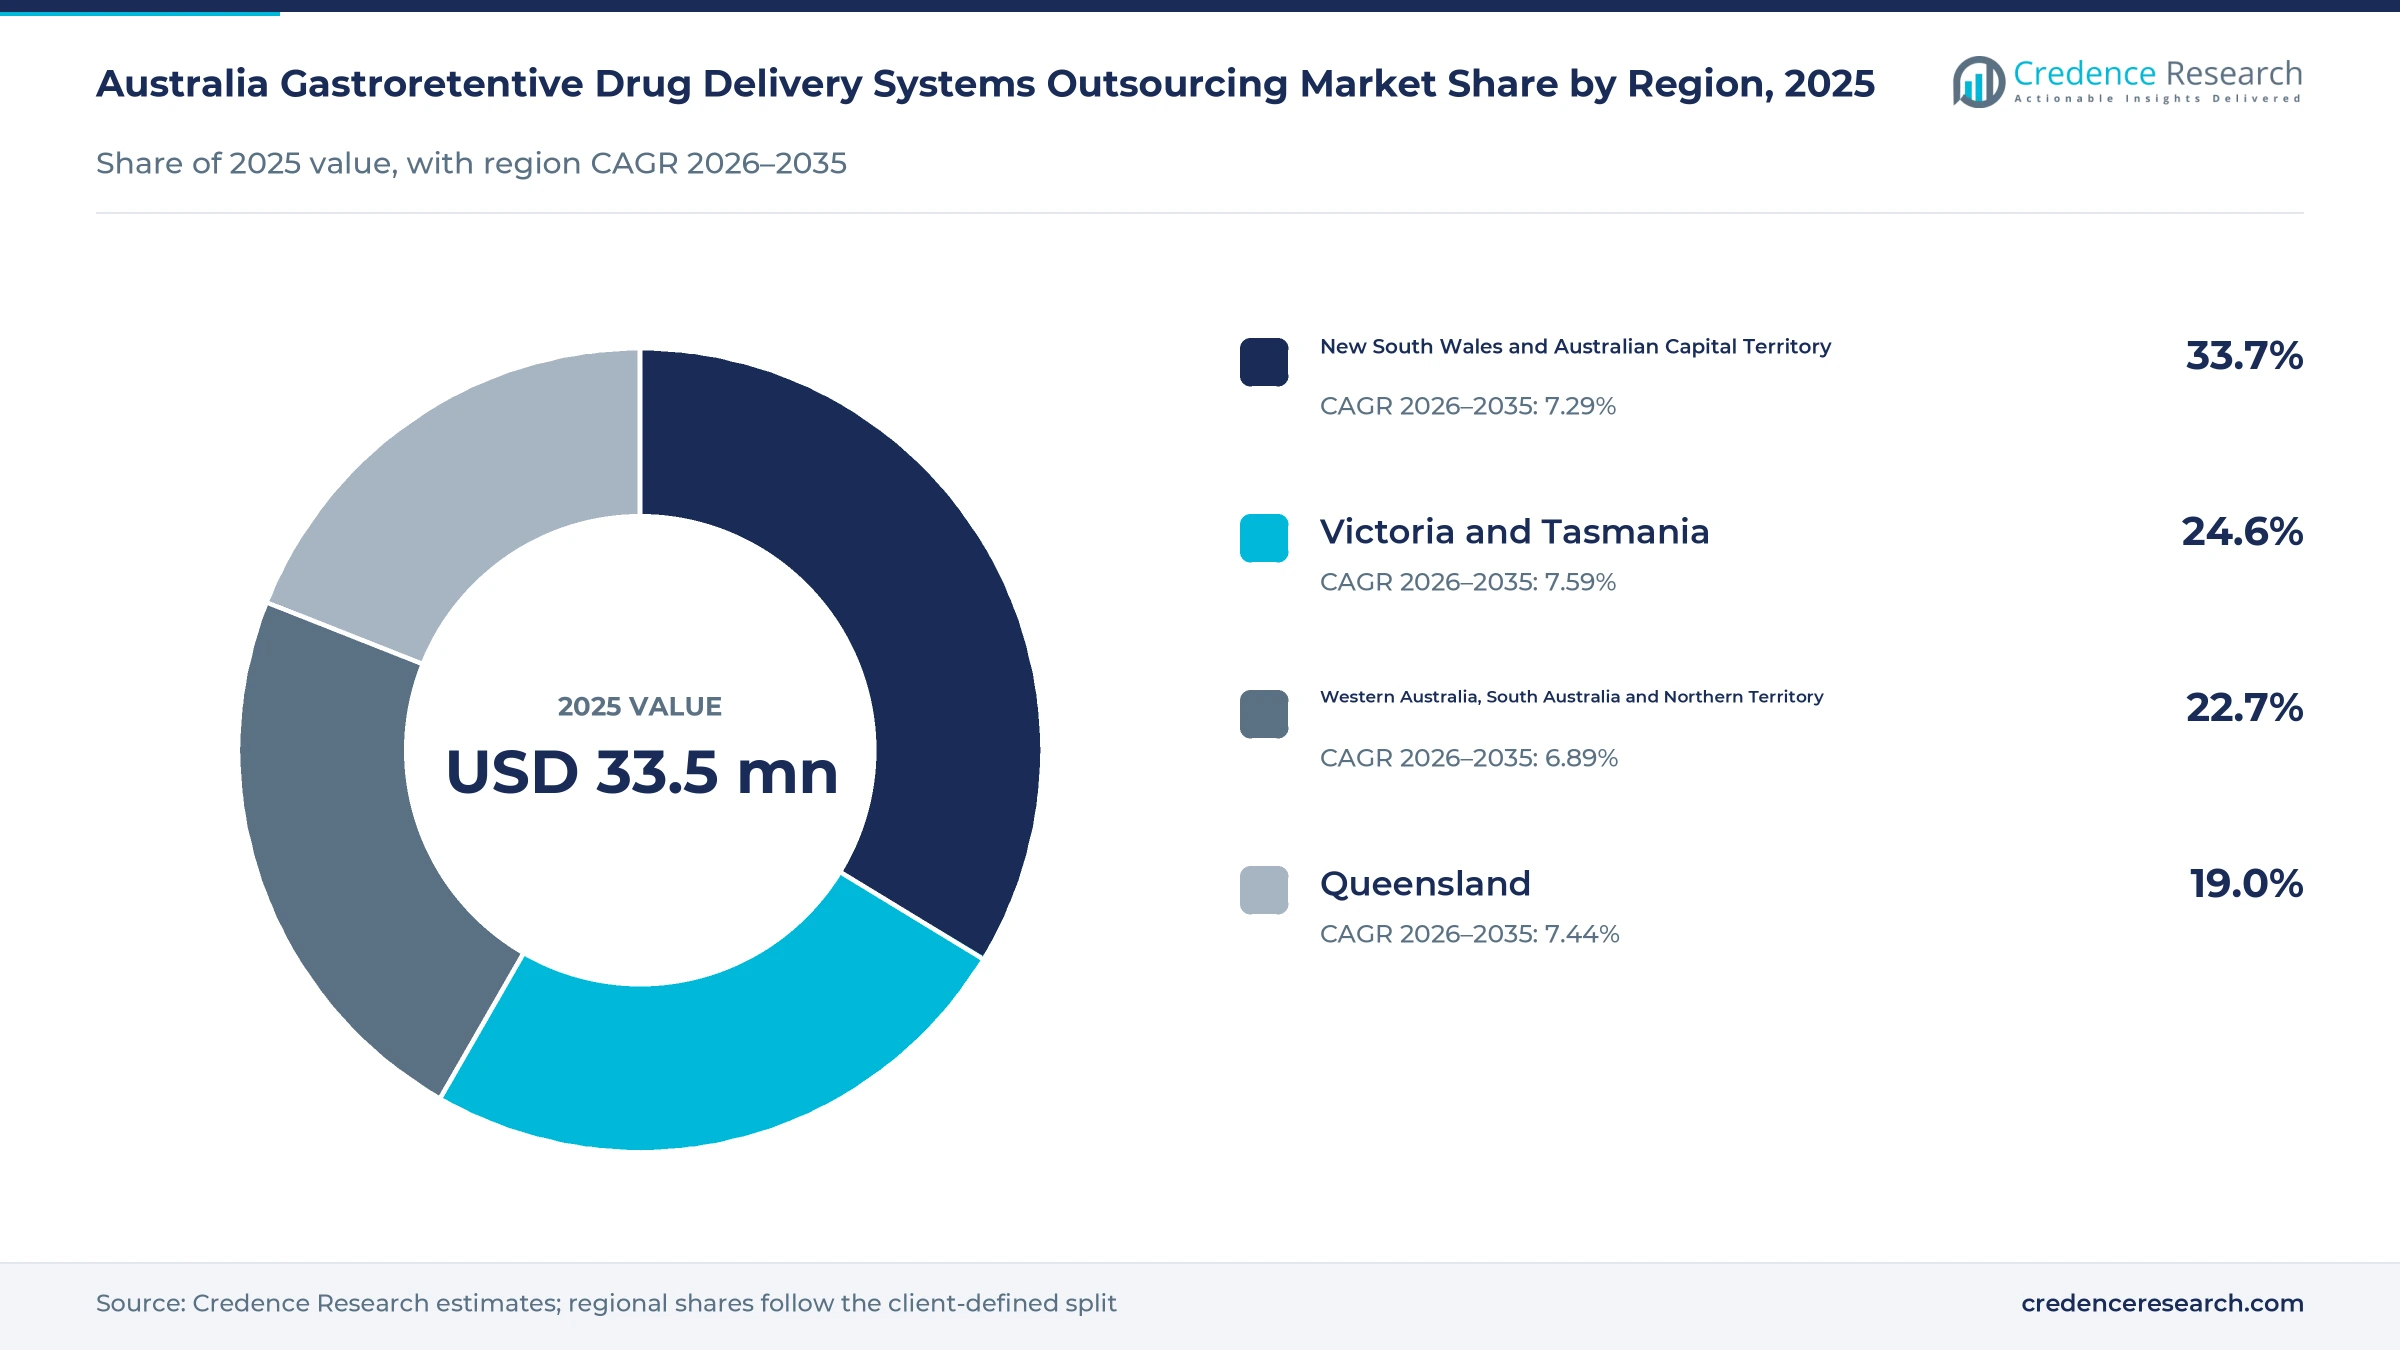
| New South Wales and Australian Capital Territory | 11.3 | 33.7% | 7.29% |
| Victoria and Tasmania | 8.2 | 24.6% | 7.59% |
| Western Australia, South Australia and Northern Territory | 7.6 | 22.7% | 6.89% |
| Queensland | 6.4 | 19.0% | 7.44% |
Why do new South Wales and the ACT hold the largest share?
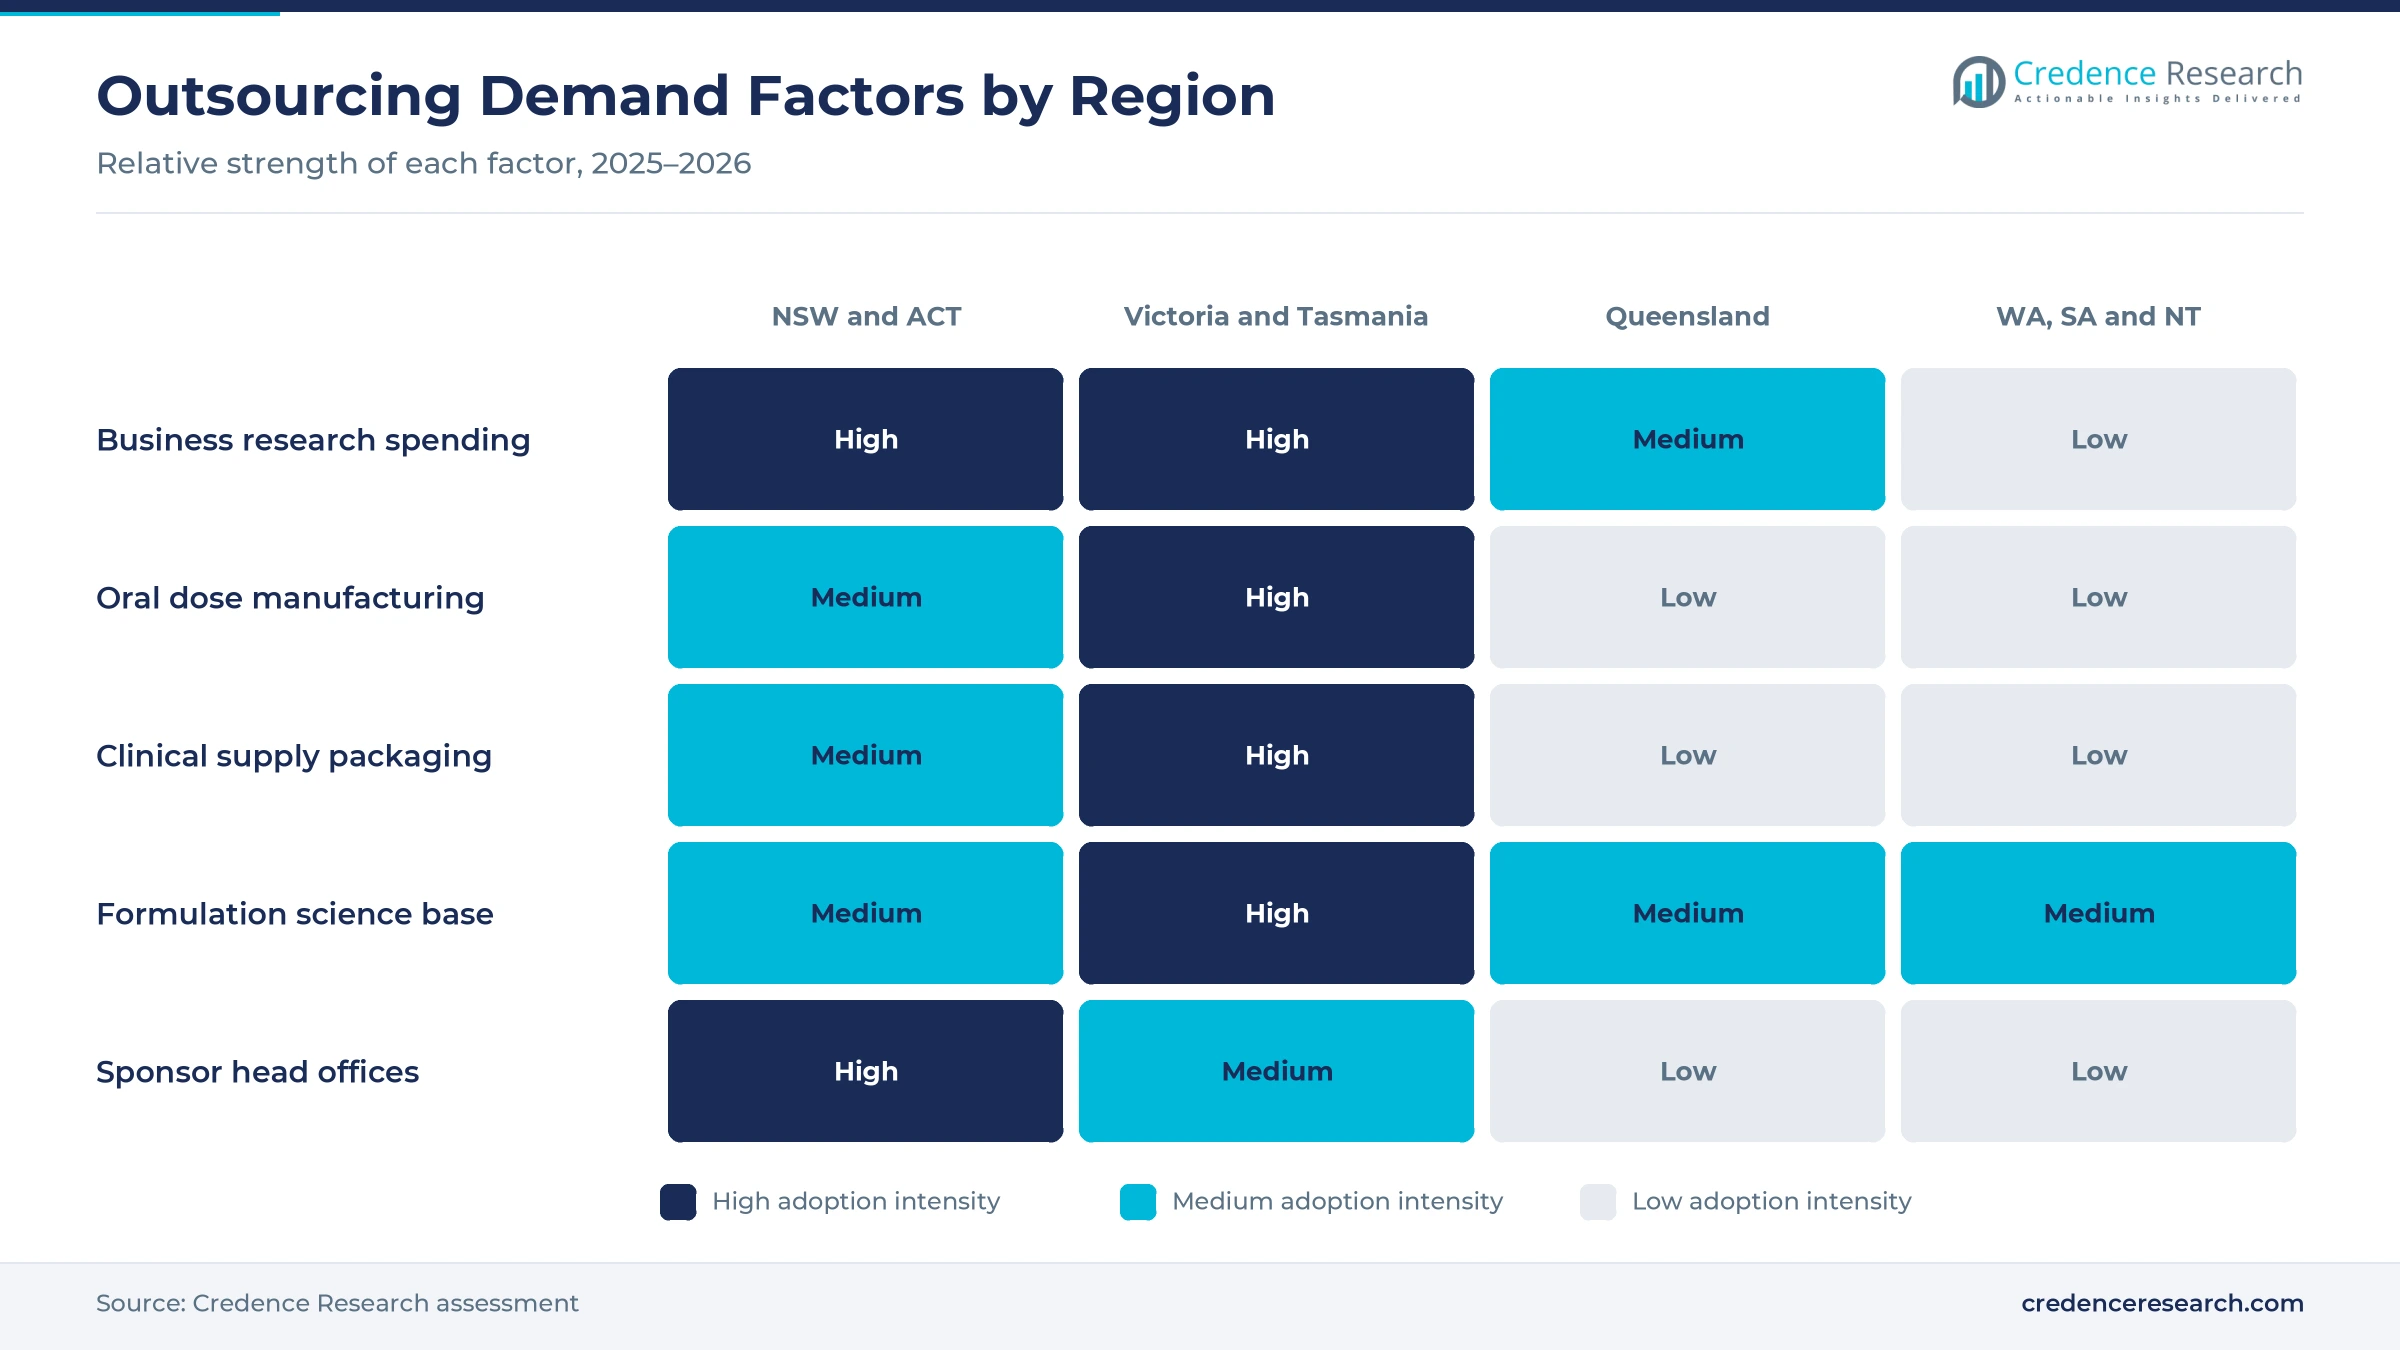
New South Wales and Australian Capital Territory held a 33.7% share of 2025 value and grow at 7.29% a year. New South Wales spent AUD 9.63 billion on business research in 2023-24, the highest of any state, and its business R&D equaled 1.17% of state output. Catalent added oral medicine packaging in Dee Why through Pharmapak in 2015. As a result, sponsor head offices in Sydney place many outsourced programs.
How does Melbourne capacity lift Victoria and Tasmania?
Victoria and Tasmania held a 24.6% share of 2025 value and grow fastest at 7.59% a year. Victoria spent AUD 6.95 billion on business research in 2023-24, while Tasmania's business R&D reached 0.85% of state output. IDT Australia, PCI Pharma Services and the Monash pharmacy faculty all operate in the Melbourne region, which links contract pharmaceutical manufacturing with clinical supply and formulation science. In turn, Melbourne wins much of the new local work.

How does Brisbane anchor demand in Queensland?
Queensland held a 19.0% share of 2025 value and grows at 7.44% a year, supported by a growing base of trial sites and manufacturing. Thermo Fisher runs its Patheon biologics site in Brisbane, which gives sponsors a local quality and analytical network even though oral retention work is placed elsewhere. Business R&D equaled 0.59% of state output in Queensland in 2023-24. As a result, Queensland sponsors buy retention work mostly from southern and offshore partners.
Why do the western and central regions grow more slowly?
Western Australia, South Australia and Northern Territory held a 22.7% share of 2025 value and grow at 6.89% a year. South Australia recorded the largest rise in business R&D as a share of state output, reaching 0.68% in 2023-24, while Western Australia stood at 0.43% and the Northern Territory at 0.17%. In turn, demand here rests on hospital trial sites rather than local oral manufacturing.
Ranking, regulator review and capacity moves, 2023–2026
| Development | Status and market relevance |
|---|---|
| In April 2024, Monash University retained its second-place global ranking for pharmacy and pharmacology. | Supports local formulation science and talent |
| In May 2024, the TGA held a targeted consultation with ethics committees on its review of the CTA scheme. | Review aims to improve communication on the CTA pathway |
| In July 2025, Gelteq signed a memorandum of understanding with IDT Australia for a dedicated local facility to develop and scale up its swallowed gel products. | Adds onshore capacity for novel oral delivery formats |
| In August 2025, IDT Australia completed the first stage of its transformation program and said its specialty orals vertical focuses on neuromeds. | Points onshore oral capacity toward neurological programs |
| In February 2026, IDT Australia reported a realignment around API, specialty oral and advanced therapy verticals. | Adds onshore capsule and tablet capacity for clinical to commercial supply |
Floating, swelling and mucoadhesive designs set capability
- Floating tablets use low-density or gas-generating excipients so the dose stays above stomach contents, which suits standard compression lines with added buoyancy, lag-time and dissolution testing before each clinical batch is released.
- Swelling and expanding matrices absorb fluid and grow beyond the size that passes the pylorus, which demands careful polymer selection, swelling-rate studies and release testing across the expected range of stomach conditions.
- Mucoadhesive systems cling to the stomach lining with charged or hydrophilic polymers, which adds adhesion, moisture and stability studies to development programs and often extends the time needed before first human dosing.
Need a Custom Version of This Report?
Tailor the scope, geography, or segments to your exact requirements.
- Custom geography or segment scope
- Direct access to our analyst team
Global clinical supply groups meet local oral specialists
Competition is split between global development and clinical supply groups with Australian sites and local specialists that make small oral batches. PCI Pharma Services runs clinical trial manufacturing, packaging and storage in Melbourne after buying Pharmaceutical Packaging Professionals. IDT Australia offers specialty oral manufacturing of capsules and tablets from clinical to commercial supply. Thermo Fisher operates a Patheon biologics site in Brisbane, while Catalent added oral packaging through Pharmapak in Dee Why and sold its Braeside plant to Blackmores in 2019. Lonza, WuXi STA and Recipharm compete for Australian sponsors from overseas sites. Partners compete on retention formulation know-how, dissolution and buoyancy testing, speed to first clinical batch and familiarity with Australian trial schemes, which favors groups that combine development, manufacturing and packaging.
Which partners serve oral retention sponsors in Australia?
| Company | Type | Role in the market |
|---|---|---|
| PCI Pharma Services | Clinical supply and packaging group | Melbourne clinical trial manufacturing, packaging and storage |
| IDT Australia | Australian development and manufacturing group | Specialty oral manufacturing of capsules, tablets and liquids |
| Patheon Pharma Services | Thermo Fisher development and manufacturing arm | Brisbane biologics site with in-house QC |
| Catalent | Global development and supply group | Added Dee Why oral packaging in 2015, sold Braeside in 2019 |
Trial access keeps sponsors buying local formulation work
Credence Research's view is that the Australia gastroretentive drug delivery systems outsourcing market will grow steadily because the country remains an attractive place to run early trials and small sponsors keep buying outside expertise. Contract manufacturing remains the largest value pool, while formulation development and neurological programs add the fastest growth. Partners that combine retention formulation, testing and clinical supply in one contract should win more overseas biotechs. Small local volumes and offshore price competition will keep most commercial production outside Australia.
Model built from health, trial and research spending data
The report uses 2025 as the base year on a calendar basis, and market values come from the Credence Research model. That model draws on national health survey statistics, antimicrobial use data, clinical trial registry analysis, business research spending statistics, regulator guidance on trial schemes and company releases on sites and acquisitions. Segment splits and regional growth rates are Credence Research estimates, while regional shares follow the client-defined split. Sources used are official statistics, regulator pages, peer-reviewed research, trade press and company releases, and no interviews or surveys were used.
Neurological and biotech programs carry growth to 2035
The Australia gastroretentive drug delivery systems outsourcing market is expected to reach USD 79.2 million by 2035, a 7.30% CAGR during 2026–2035, as sponsors keep developing once-daily oral products for chronic disease. Growth should be strongest in Victoria and Tasmania, where oral manufacturing and clinical supply sit close to formulation science. After 2030, neurological programs and alternative retention designs should carry more value as older patient numbers grow. Faster national trial reform would lift demand, while weaker biotech funding would slow it.
Frequently Asked Questions
How big is the Australia gastroretentive drug delivery systems outsourcing market?
Which service type leads outsourced spending?
Which region leads the market in Australia?
How do the CTN and CTA schemes affect outsourcing?
Which application grows fastest?
Which retention technology is most common?
Who are the leading companies in this market?
What are the main challenges for the market?
Table of Content
Chapter 1 Market Segmentation
- 1.1 Segmentation Framework
- 1.1.1 Product and Service Classification
- 1.1.2 Application and End-Use Classification
- 1.1.3 Technology and Solution Classification
- 1.1.4 Customer and Distribution Channel Classification
- 1.1.5 Geographic Segmentation
- 1.1.6 Market Segment Definitions and Boundaries
- 1.2 By Service Type
- 1.2.1 Formulation Development
- 1.2.2 Contract Manufacturing
- 1.2.3 Analytical and Quality Control Testing
- 1.2.4 Packaging and Regulatory Support
- 1.3 By Technology
- 1.3.1 Floating Systems
- 1.3.2 Bioadhesive Systems
- 1.3.3 Swelling and Expanding Systems
- 1.3.4 Alternative Retention Systems
- 1.4 By Application
- 1.4.1 Gastrointestinal Disorders
- 1.4.2 Neurological Disorders
- 1.4.3 Diabetes and Metabolic Disorders
- 1.4.4 Anti-Infective Therapy
- 1.4.5 Additional Therapeutic Applications
- 1.5 By Customer Type
- 1.5.1 Established Pharmaceutical Sponsors
- 1.5.2 Emerging Biotechnology Sponsors
- 1.5.3 Generic and Reformulation Sponsors
- 1.5.4 Academic and Public Research Sponsors
Chapter 2 Introduction
- 2.1 Report Objectives and Scope
- 2.2 Product Definition and Industry Terminology
- 2.3 Market Inclusions and Exclusions
- 2.4 Research Process
- 2.4.1 Primary Research and Expert Interviews
- 2.4.2 Secondary Research and Source Review
- 2.4.3 Top-Down and Bottom-Up Estimation
- 2.4.4 Data Triangulation and Verification
- 2.5 Market Size Measurement Basis
- 2.5.1 2025: USD 33.5 million → 2035: USD 79.2 million
- 2.6 Historical and Forecast Reference Periods
- 2.6.1 Historical Period: 2018-2025
- 2.6.2 Base Year: 2025
- 2.6.3 Forecast Period: 2025-2035
- 2.7 Research Assumptions and Limitations
Chapter 3 Executive Summary
- 3.1 Market Snapshot and Key Findings
- 3.2 Base-Year Market Size, 2025
- 3.3 Forecast Market Size, 2035
- 3.4 Revenue and Volume Growth Outlook
- 3.5 Key Demand and Supply Indicators
- 3.6 Leading Market Segments
- 3.7 Fastest-Growing Market Opportunities
- 3.8 Regional Performance Highlights
- 3.9 Technology and Industry Transformation
- 3.10 Competitive Landscape Summary
- 3.11 Analyst View and Strategic Implications
Chapter 4 Australia Gastroretentive Drug Delivery Systems Outsourcing Market Trends and Developments
- 4.1 Historical Industry Development, 2018-2025
- 4.2 Recent Market Trends and Developments
- 4.3 Demand and Customer Behavior Trends
- 4.4 Technology and Product Innovation
- 4.5 Artificial Intelligence, Automation and Digitalization
- 4.6 Local Manufacturing and Supply Chain Realignment
- 4.7 Industry Partnerships, Mergers and Acquisitions
- 4.8 Sustainability and Circular Economy Developments
- 4.9 Government and Private Sector Investment Trends
- 4.10 Emerging Business Models and Commercialization
- 4.11 Industry Developments and Announcements
Chapter 5 Australia Gastroretentive Drug Delivery Systems Outsourcing Market Supply and Demand Analysis
- 5.1 Demand Trend and Consumption Analysis, 2018-2025
- 5.2 Demand Forecast, 2025-2035
- 5.3 Supply Chain Structure and Procurement Trends
- 5.4 Supply-Demand Gap and Bottlenecks
- 5.5 Import Dependence and Sourcing Structure
- 5.6 Regional Supply and Demand Concentration
Chapter 6 Australia Gastroretentive Drug Delivery Systems Outsourcing Market Pricing Analysis
- 6.1 Pricing Structure and Measurement
- 6.2 Historical Pricing Trends, 2018-2025
- 6.3 Pricing Outlook, 2025-2035
- 6.4 Pricing by Product and Market Segment
- 6.5 Geographic Pricing Differences
- 6.6 Key Input, Energy, Labor and Logistics Costs
- 6.7 Contract Pricing and Purchasing Models
- 6.8 Pricing Sensitivity and Competitive Positioning
- 6.9 Price, Margin and Profitability Implications
Chapter 7 Australia Gastroretentive Drug Delivery Systems Outsourcing Market Dynamics
- 7.1 Market Growth Drivers
- 7.1.1 Demand-Side Drivers
- 7.1.2 Technology and Innovation Drivers
- 7.1.3 Infrastructure and Investment Drivers
- 7.1.4 Regulatory and Policy Drivers
- 7.2 Market Restraints
- 7.2.1 Cost and Affordability Constraints
- 7.2.2 Technology and Adoption Barriers
- 7.2.3 Supply Chain and Operational Constraints
- 7.3 Market Challenges
- 7.3.1 Competitive Pressure and Margin Erosion
- 7.3.2 Skills, Infrastructure and Implementation Gaps
- 7.4 Emerging Market Opportunities
- 7.5 Market Dynamics Impact and Time-Horizon Assessment
Chapter 8 Australia Gastroretentive Drug Delivery Systems Outsourcing Value Chain Analysis
- 8.1 Industry Value Chain Overview
- 8.2 Upstream Suppliers and Critical Inputs
- 8.3 Technology and Component Providers
- 8.4 Manufacturing or Service Delivery
- 8.5 Distribution, Channel Partners and Integrators
- 8.6 Downstream Applications and End Users
- 8.7 Value Addition and Profit Pools
- 8.8 Vertical Integration and Outsourcing
- 8.9 Supplier Concentration and Risk
- 8.10 Supply Chain Localization and Resilience
Chapter 9 Australia Gastroretentive Drug Delivery Systems Outsourcing Market Regulations and Policies
- 9.1 Relevant Laws, Standards and Compliance Frameworks
- 9.2 Product, Service, Safety and Quality Requirements
- 9.3 Government Policies, Incentives and Subsidies
- 9.4 Imports, Exports and Trade Barriers
- 9.5 Public Procurement and Local Content Requirements
- 9.6 Data Protection, AI and Cybersecurity Compliance
- 9.7 Upcoming Policy Changes and Market Implications
Chapter 10 Australia Gastroretentive Drug Delivery Systems Outsourcing Market Hotspots and Opportunities
- 10.1 Market Opportunity Mapping and Growth Hotspots
- 10.2 High-Growth Applications and Customer Groups
- 10.3 Underserved Markets and White-Space Opportunities
- 10.4 Emerging Technology and Product Opportunities
- 10.5 New Capacity and Investment Hotspots
- 10.6 Market Entry and Expansion Opportunities
- 10.7 Distribution and Partnership Opportunities
- 10.8 Near-Term and Long-Term Commercial Potential
- 10.9 Opportunity Attractiveness and Execution Risks
Chapter 11 Australia Gastroretentive Drug Delivery Systems Outsourcing Market Outlook, 2025-2035
- 11.1 Market Size and Analysis
- 11.1.1 Revenue (Market Measurement: 2025: USD 33.5 million → 2035: USD 79.2 million)
- 11.1.2 Historical Market Size, 2018-2025
- 11.1.3 Base-Year Market Size, 2025
- 11.2 Market Forecast, 2025-2035
- 11.2.1 Revenue Forecast to 2035
- 11.2.2 CAGR and Year-on-Year Growth
- 11.2.3 Incremental Revenue Opportunity
- 11.3 Forecast Assumptions and Scenario Analysis
- 11.3.1 Base-Case Forecast
- 11.3.2 Optimistic and Conservative Scenarios
- 11.3.3 Technology, Pricing and Policy Sensitivities
- 11.4 Market Attractiveness and Growth Outlook
Chapter 12 Australia Gastroretentive Drug Delivery Systems Outsourcing Market Segmentation and Outlook
- 12.1 Segmentation Summary and Market Shares, 2025
- 12.2 Largest and Fastest-Growing Segments
- 12.3 By Service Type - Market Size and Forecast, 2025-2035
- 12.3.1 Segment Definition and Scope
- 12.3.2 Historical Market Size, 2018-2025
- 12.3.3 Revenue Forecast, 2025-2035
- 12.3.4 Base-Year Market Share, 2025
- 12.3.5 Segment CAGR and Growth Drivers
- 12.3.6 Subsegment Market Size and Forecast
- 12.3.6.1 Formulation Development
- 12.3.6.2 Contract Manufacturing
- 12.3.6.3 Analytical and Quality Control Testing
- 12.3.6.4 Packaging and Regulatory Support
- 12.3.7 Subsegment Pricing and Adoption Trends
- 12.3.8 Leading Suppliers and Competition
- 12.3.9 Regional Demand and Opportunities
- 12.4 By Technology - Market Size and Forecast, 2025-2035
- 12.4.1 Segment Definition and Scope
- 12.4.2 Historical Market Size, 2018-2025
- 12.4.3 Revenue Forecast, 2025-2035
- 12.4.4 Base-Year Market Share, 2025
- 12.4.5 Segment CAGR and Growth Drivers
- 12.4.6 Subsegment Market Size and Forecast
- 12.4.6.1 Floating Systems
- 12.4.6.2 Bioadhesive Systems
- 12.4.6.3 Swelling and Expanding Systems
- 12.4.6.4 Alternative Retention Systems
- 12.4.7 Subsegment Pricing and Adoption Trends
- 12.4.8 Leading Suppliers and Competition
- 12.4.9 Regional Demand and Opportunities
- 12.5 By Application - Market Size and Forecast, 2025-2035
- 12.5.1 Segment Definition and Scope
- 12.5.2 Historical Market Size, 2018-2025
- 12.5.3 Revenue Forecast, 2025-2035
- 12.5.4 Base-Year Market Share, 2025
- 12.5.5 Segment CAGR and Growth Drivers
- 12.5.6 Subsegment Market Size and Forecast
- 12.5.6.1 Gastrointestinal Disorders
- 12.5.6.2 Neurological Disorders
- 12.5.6.3 Diabetes and Metabolic Disorders
- 12.5.6.4 Anti-Infective Therapy
- 12.5.6.5 Additional Therapeutic Applications
- 12.5.7 Subsegment Pricing and Adoption Trends
- 12.5.8 Leading Suppliers and Competition
- 12.5.9 Regional Demand and Opportunities
- 12.6 By Customer Type - Market Size and Forecast, 2025-2035
- 12.6.1 Segment Definition and Scope
- 12.6.2 Historical Market Size, 2018-2025
- 12.6.3 Revenue Forecast, 2025-2035
- 12.6.4 Base-Year Market Share, 2025
- 12.6.5 Segment CAGR and Growth Drivers
- 12.6.6 Subsegment Market Size and Forecast
- 12.6.6.1 Established Pharmaceutical Sponsors
- 12.6.6.2 Emerging Biotechnology Sponsors
- 12.6.6.3 Generic and Reformulation Sponsors
- 12.6.6.4 Academic and Public Research Sponsors
- 12.6.7 Subsegment Pricing and Adoption Trends
- 12.6.8 Leading Suppliers and Competition
- 12.6.9 Regional Demand and Opportunities
- 12.7 Segment Growth Comparison
- 12.8 Segment Attractiveness and Priority Matrix
Chapter 13 Australia Gastroretentive Drug Delivery Systems Outsourcing End-Use and Application Market Outlook
- 13.1 End-Use Industry and Customer Demand Structure
- 13.2 Leading Applications and Customer Groups
- 13.3 End-Use Market Size, Share and Forecast
- 13.4 Major End-Use Industry Deep Dives
- 13.4.1 Customer Requirements and Use Cases
- 13.4.2 Demand and Replacement Cycles
- 13.4.3 Technical and Regulatory Considerations
- 13.4.4 Purchasing and Procurement Models
- 13.4.5 Leading Vendors and Distribution Channels
- 13.4.6 Forecast and Commercial Opportunities
- 13.5 Emerging Applications and Cross-Segment Demand
- 13.6 End-Use Industry Investment Priorities
Chapter 14 Australia Gastroretentive Drug Delivery Systems Outsourcing Geographic Market Outlook, 2025-2035
- 14.1 Domestic Market Distribution and Demand Clusters
- 14.2 State- or Province-Wise Market Size and Forecast, 2025-2035
- 14.3 City and Metropolitan Market Outlook
- 14.4 Industrial, Manufacturing and Commercial Clusters
- 14.5 Geographic Concentration of Key End Users
- 14.6 Local Pricing and Purchasing Differences
- 14.7 Domestic Production Facilities and Capacity Map
- 14.8 Local Infrastructure and Project Pipeline
- 14.9 State-Level Policy and Incentive Differences
- 14.10 Subnational Investment Hotspots and Opportunities
- 14.11 Distribution and Logistics Networks
- 14.12 Domestic Competitive Footprint
Chapter 15 Australia Gastroretentive Drug Delivery Systems Outsourcing Technology, Innovation and Sustainability Outlook
- 15.1 Technology Landscape and Maturity
- 15.2 Product, Process and Service Innovation
- 15.3 AI, Automation and Digital Tools in the Industry
- 15.4 Technology Adoption and Performance Benchmarking
- 15.5 Innovation Pipeline and R&D Investment
- 15.6 Energy Efficiency and Resource Management
- 15.7 Sustainability, Recycling and Circularity
- 15.8 Technology Roadmap, 2025-2035
- 15.9 Risks of Obsolescence and Technology Substitution
Chapter 16 Australia Gastroretentive Drug Delivery Systems Outsourcing Market Key Strategic Imperatives
- 16.1 Growth and Market Entry Priorities
- 16.2 High-Return Products and Segments
- 16.3 Pricing, Profitability and Cost Optimization
- 16.4 Technology Investment and Product Differentiation
- 16.5 Supply Chain Localization and Resilience
- 16.6 Distribution and Customer Acquisition
- 16.7 Partnership, Acquisition and Capacity Strategy
- 16.8 Regional Expansion Priorities
- 16.9 Short-, Medium- and Long-Term Actions
Chapter 17 Competition Outlook
- 17.1 Industry Competition Characteristics
- 17.2 Market Structure and Concentration
- 17.3 Market Share and Competitive Positioning, 2025
- 17.4 Company-Wise Revenue and Product Benchmarking
- 17.5 Production and Service Capacity Benchmarking
- 17.6 Technology, Pricing and Differentiation
- 17.7 Regional Footprint and Distribution Strength
- 17.8 Mergers, Acquisitions and Strategic Alliances
- 17.9 New Entrants and Competitive Threats
- 17.10 Porter's Five Forces and Industry Attractiveness
- 17.11 Competitive Outlook, 2025-2035
Chapter 18 Company Profiles
- 18.1 Company Coverage and Selection Criteria
- 18.2 Patheon Pharma Services
- 18.2.1 Business Description
- 18.2.2 Company Ownership and Geographic Presence
- 18.2.3 Product and Service Portfolio
- 18.2.4 Manufacturing and Operating Footprint
- 18.2.5 Financial Performance and Investment
- 18.2.6 Market Share and Competitive Position
- 18.2.7 Technology and Innovation Capabilities
- 18.2.8 Strategic Alliances or Partnerships
- 18.2.9 Recent Developments
- 18.2.10 Growth Strategy and Outlook
- 18.3 Lonza
- 18.4 WuXi STA
- 18.5 Catalent
- 18.6 Recipharm
- 18.7 IDT Australia
- 18.8 PCI Pharma Services
- 18.9 Other Relevant Market Participants
Note: Every listed company is profiled on the structure shown under the first company. The company list is preliminary and may change based on research findings, market developments, data availability and client requirements.
Chapter 19 Disclaimer
- 19.1 Research and Forecast Disclaimer
- 19.2 Data Source and Estimation Limitations
Note: The depth of individual sections depends on data availability for this market. Volume, capacity, trade and other unit-based metrics are included where applicable.

