
Mobile video audiences turn livestreams into a sales channel
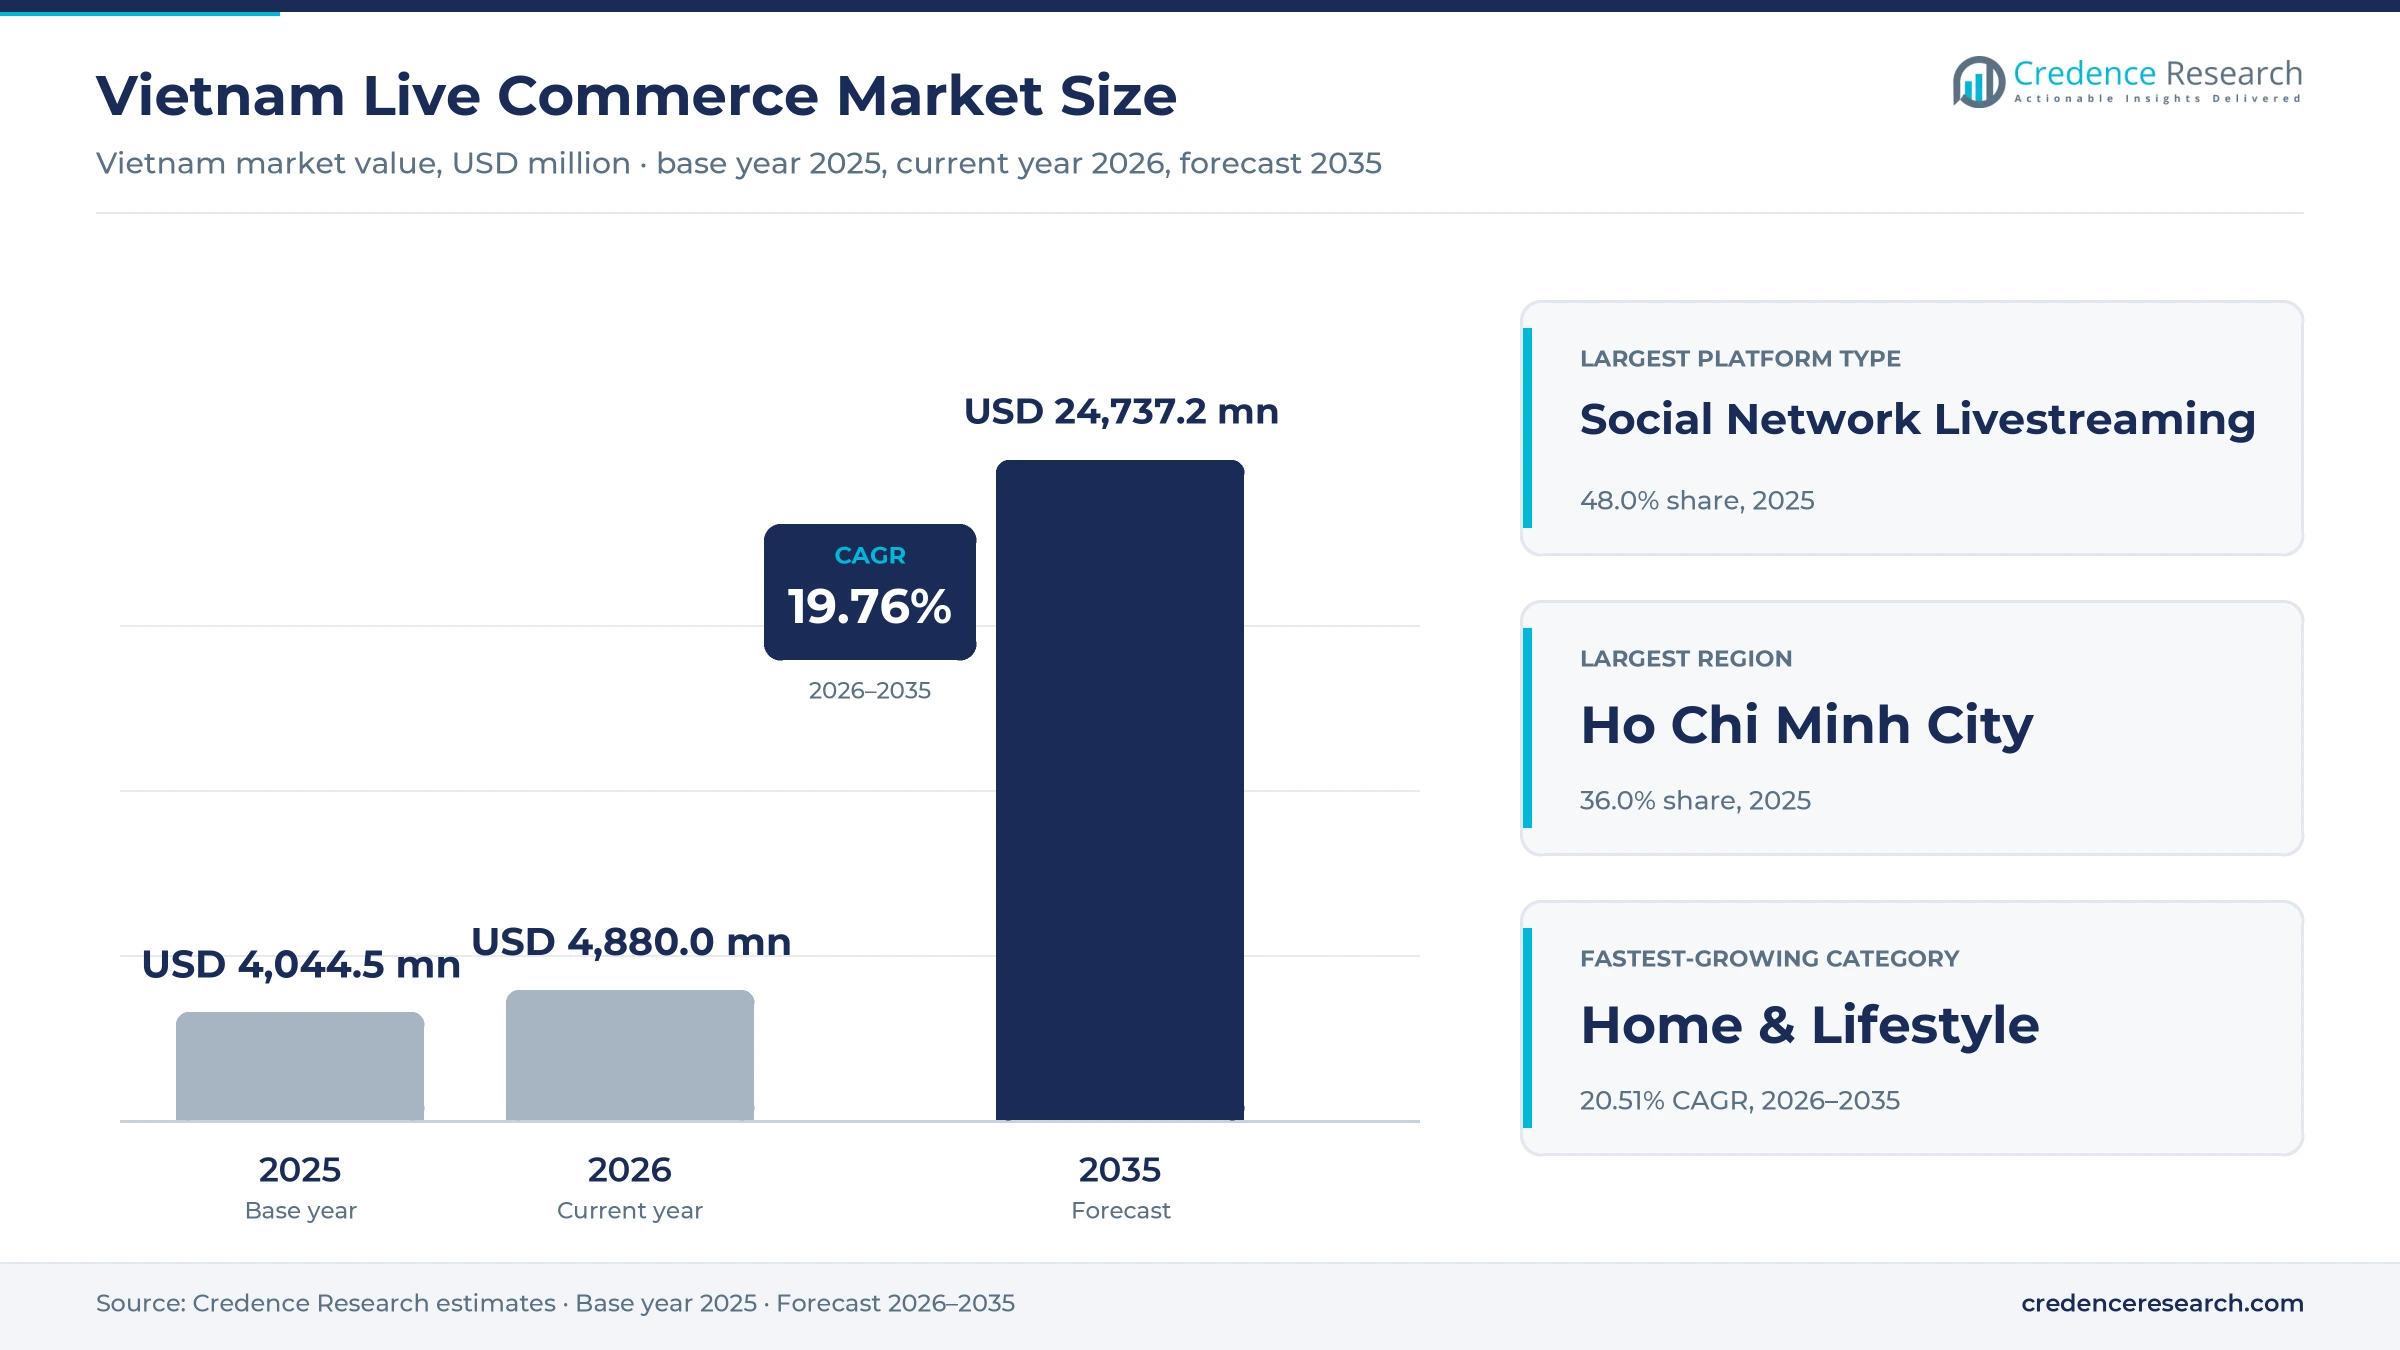
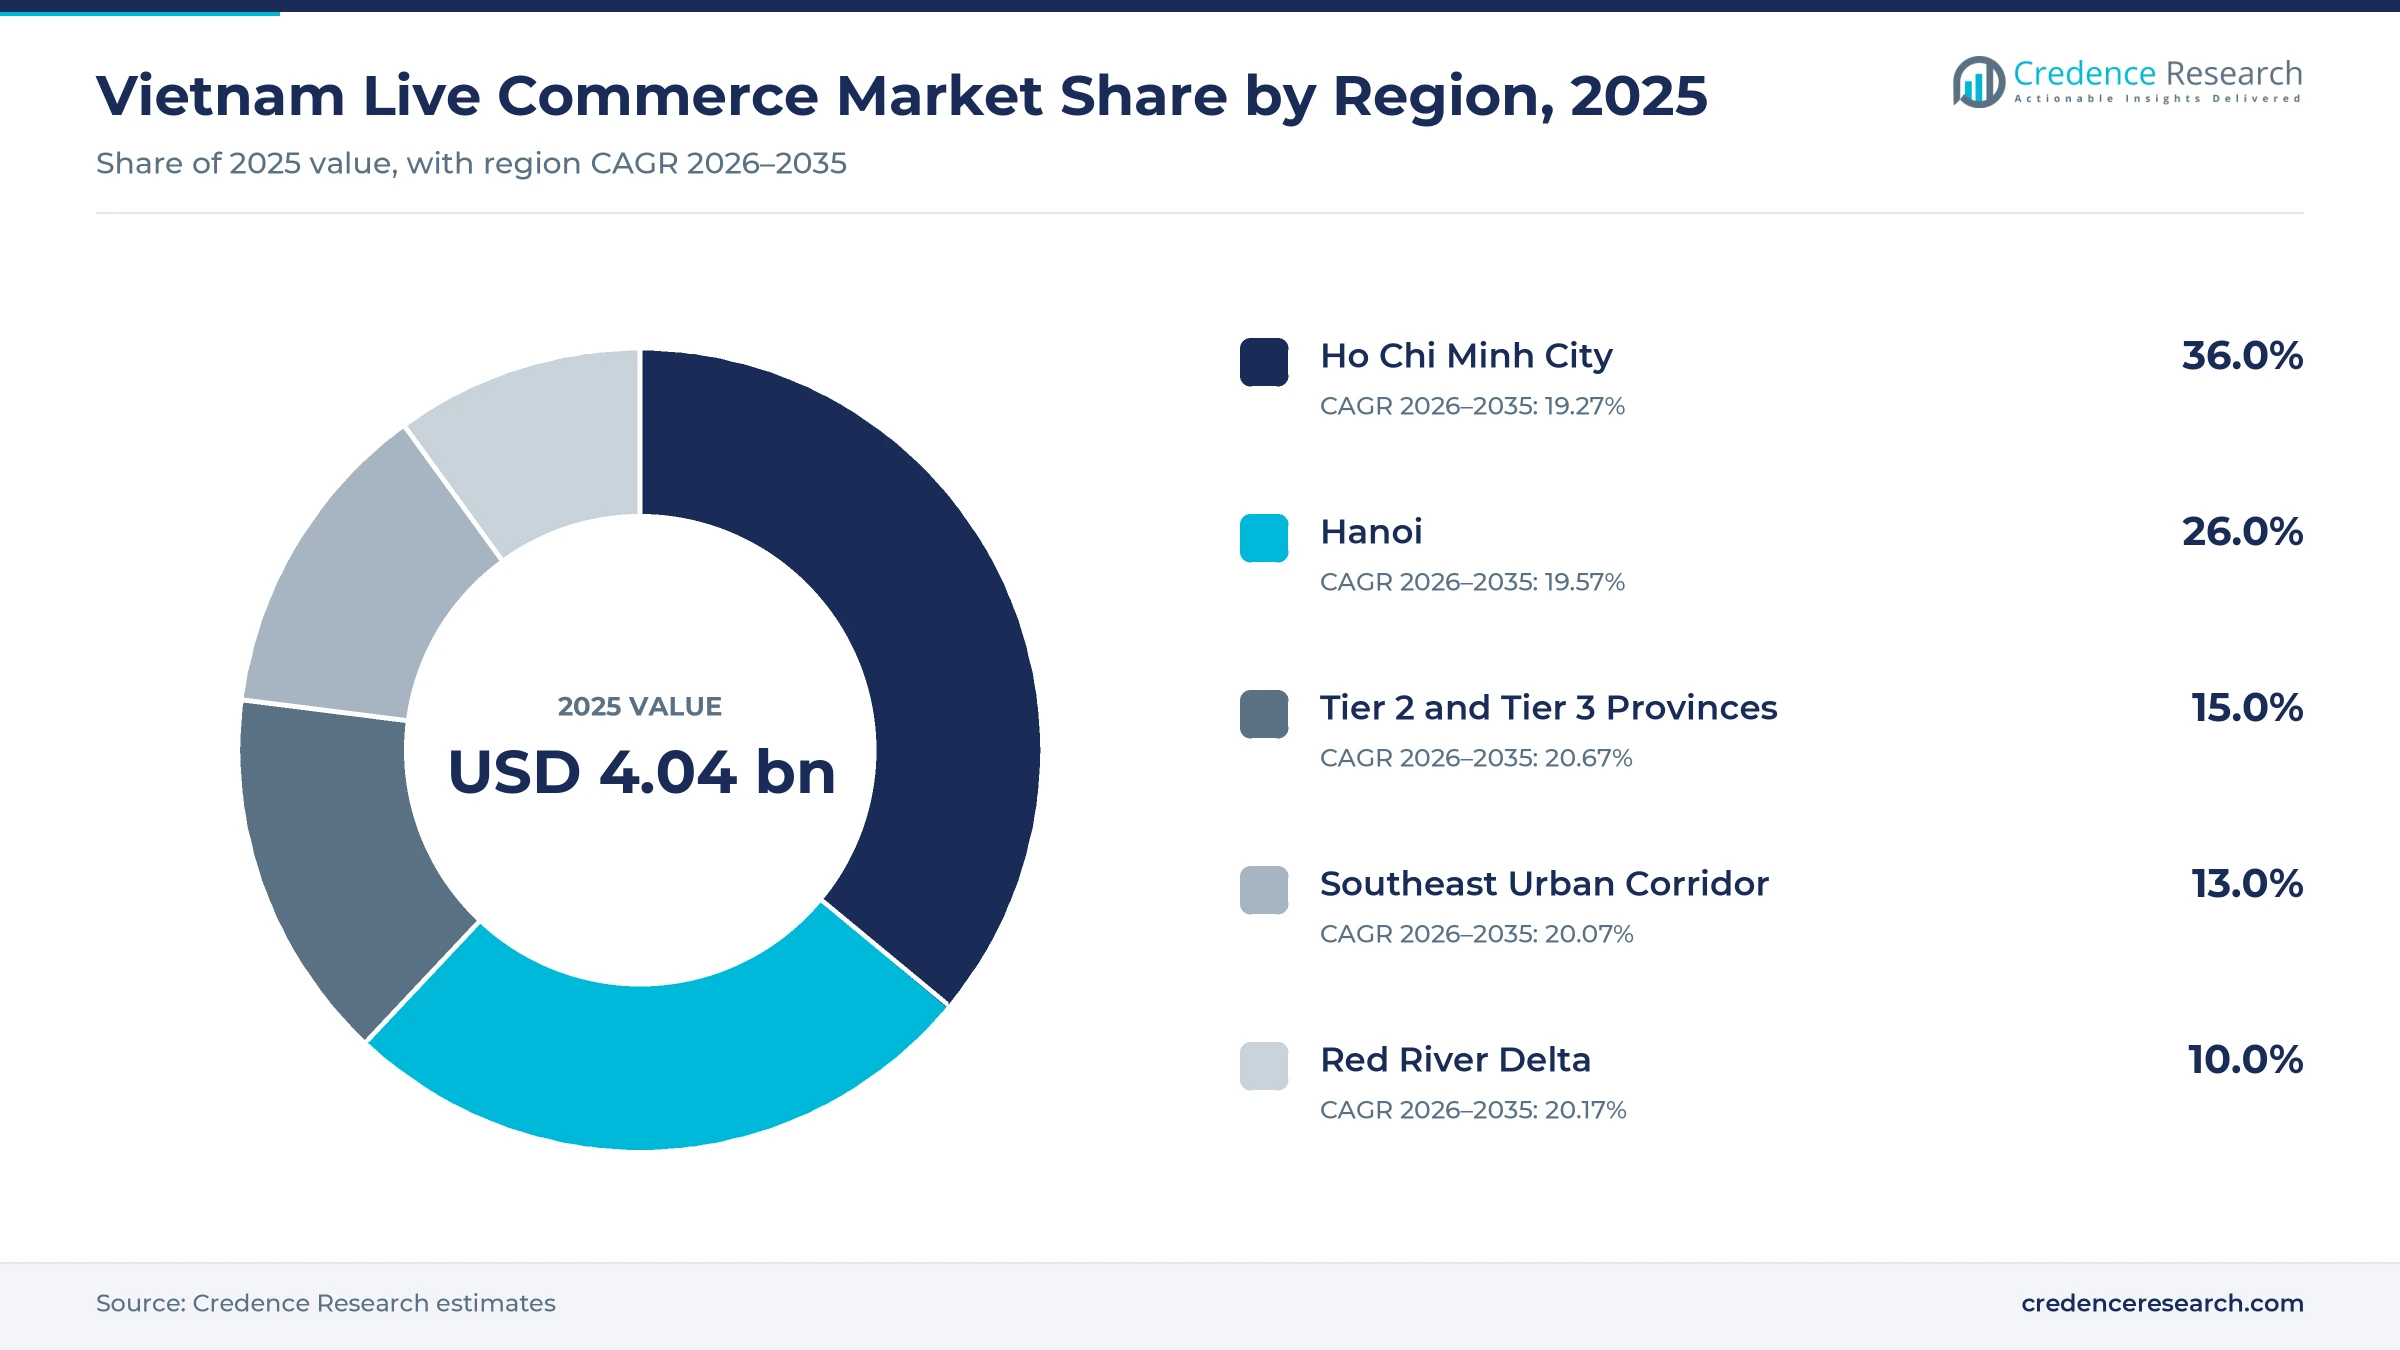
The Vietnam live commerce market was valued at USD 4.04 billion in 2025 and is projected to increase from USD 4.88 billion in 2026 to USD 24.74 billion by 2035, registering a CAGR of 19.76% during 2026–2035. Demand comes from a large mobile-first audience, the fast growth of shoppable short video, discount-driven campaign days and a widening pool of affiliate hosts who sell for brands and small shops. Ho Chi Minh City held the largest regional share, 36.0% in 2025, because the city combines the highest online spending with most brand studios and creator networks. Tier 2 and Tier 3 provinces grow fastest at 20.67% a year, as farm, craft and local sellers start selling through livestreams. Since July 1, 2025, platforms have also withheld tax for household and individual sellers, which brings more livestream sales into the formal economy.
Which livestream sales are counted in Vietnam?
The estimate measures the value of goods sold to consumers in Vietnam through real-time video sessions, where a host shows products and viewers buy inside the stream or through a linked store. It covers sessions on marketplaces, social video apps, brand channels and creator networks, together with the commissions, advertising and fulfillment fees they generate. Values are stated in USD million at current prices and exclude taxes.
The estimate excludes sales from recorded short videos without a live session, offline store sales and services such as travel and food delivery. The value chain runs from brands, distributors and small sellers through hosts, studios and creator networks to platforms, payment providers, delivery firms and buyers.
Vietnam Live Commerce Market Insights
- The Vietnam live commerce market was valued at USD 4.04 billion in 2025 and is projected to reach USD 24.74 billion by 2035, registering a CAGR of 19.76% during 2026–2035.
- Ho Chi Minh City held 36.0% of 2025 value, because the city has the highest online spending and most brand studios.
- Social network livestreaming led with 48.0% of 2025 value, since short-video apps with large audiences turn everyday entertainment viewing into buying.
- The E-commerce Law adopted on Dec. 10, 2025, takes effect on July 1, 2026, and sets duties for livestream hosts and sellers.
- Home and lifestyle products grow fastest at 20.51% a year during 2026–2035, as household goods gain strongly in livestream sales.
Social video apps and fashion carry most livestream sales
Why do social video apps lead livestream sales?
Based on platform type, the market is categorized into integrated marketplace livestreaming, social network livestreaming, brand-owned livestreaming and creator network livestreaming. Social Network Livestreaming led with 48.0% of 2025 value, because short-video apps move viewers from entertainment to checkout in one place. Creator Network Livestreaming grows fastest at 20.59% a year, as studios and agencies run sessions for many brands at once.
Which products sell best through livestreams?
Based on product category, the market is categorized into fashion and accessories, beauty and personal care, FMCG, consumer electronics and home and lifestyle. Fashion & Accessories led with 30.0% of 2025 value, because clothing and accessories are easy to show on camera. Home & Lifestyle grows fastest at 20.51% a year, as households buy kitchen, decor and craft goods during live demonstrations.
How do creator-led sellers change the seller mix?
Based on seller type, the market is categorized into brands and official stores, marketplace SMEs, creator-led sellers and cross-border merchants. Marketplace SMEs led with 38.0% of 2025 value, because millions of small shops already sell on Shopee and TikTok Shop. Creator-Led Sellers grow fastest at 20.30% a year, as popular hosts launch their own products and stores.
| Segment Group | Leading Sub-segment | Share, 2025 | Fastest-growing Sub-segment | CAGR, 2026–2035 |
|---|---|---|---|---|
| By Platform Type | Social Network Livestreaming | 48.0% | Creator Network Livestreaming | 20.59% |
| By Product Category | Fashion & Accessories | 30.0% | Home & Lifestyle | 20.51% |
| By Seller Type | Marketplace SMEs | 38.0% | Creator-Led Sellers | 20.30% |
Request a Free Sample
Fill in your details and we'll send you a free sample report.
- Sample data tables & charts
- Research methodology
Mobile reach, creator networks and new buyers lift sales
How does a large mobile-first audience lift sales?
A large mobile-first social audience lifts livestream sales, because most consumers already spend hours on video apps each day. Internet users reached 84.15% of the population in 2024, up from 78.08% a year earlier, according to World Bank data. TikTok reported more than 70 million monthly users in Vietnam at its July 2026 summit, which widens live commerce demand. YouTube counted more than 50 million adult users in November 2024, when it launched shopping affiliate links with Shopee. As a result, sellers can reach a national audience through one live session from a phone. This reach explains why social network livestreaming holds the largest platform share of live commerce value in Vietnam.
Why is platform and creator expansion driving growth?
Platform and creator ecosystem expansion drives growth, because each major app now pays hosts to sell for brands and shops. TikTok Shop said affiliate creators rose 140% in 2025, while creators joining livestream sales doubled, according to Brands Vietnam. Shopee and Meta added Vietnam to a Facebook Live shopping pilot on Oct. 23, 2025, according to Fintech News. Shopee's YouTube partnership had also linked 2.4 million products by November 2025. Consequently, sellers gain more channels and hosts, which spreads influencer marketing budgets into direct sales. As a result, creator network livestreaming grows fastest at 20.59% a year across the forecast period. Agencies that manage many hosts gain the most from this shift.
How does broader product and buyer participation help?
Broader product and buyer participation helps, because livestreams now sell household goods and groceries as well as fashion. TikTok Shop reported 2025 growth of 94% in home and living, 71% in groceries and 71% in phones and electronics. Buyers on TikTok Shop rose 36% in 2025, while sellers rose 42%, adding first-time participants and fresh demand. A TikTok campaign also sold 300 tons of Lai Chau potatoes in September and October 2025, showing reach into farm produce. In turn, home and lifestyle products grow fastest at 20.51% a year. This wider basket raises order frequency and lifts spending per buyer across the year.
Why does fast e-commerce growth widen the base?
Fast e-commerce growth widens the base for livestream selling, because more households now buy online every month. The Ministry of Industry and Trade estimated e-commerce at USD 31 billion in 2025, up about 25%, according to Dan Tri International. The ministry targets about USD 37 billion in 2026, roughly 20% growth in online demand. E-commerce also reached about a 10% share of retail sales by the end of 2025. Consequently, livestreams gain a larger pool of buyers who already trust online payment and delivery. This trust lets sellers convert viewers faster during mega campaign days and daily deal sessions. Higher online spending therefore feeds directly into larger live commerce volumes each year.
Affiliate hosts, studio selling and rural sellers rise
How is the rise of professional live studios playing out?
Professional live studios are rising, because brands want long, polished sessions run by trained hosts every day. Ecomobi runs a 4,000 square meter facility with 51 studios and more than 150 hosts, according to Ecomobi. The site streams 16 to 18 hours a day, adding more than 13,000 live hours each month on TikTok Shop and Shopee. One L'Oreal mega session there drew more than 120,000 peak concurrent viewers. As a result, brands and official stores outsource streams to studios instead of hiring their own teams. This shift lifts studio and technology fees as a revenue stream for agencies and creator networks.
Why is the shift toward affiliate hosts rising?
The shift toward affiliate hosts is rising, because sellers prefer paying commission per order over fixed fees. In the first half of 2024, affiliate creators joining TikTok Shop grew 2.5 times, while sellers grew 2.1 times. Livestream sales during the 6.6 campaign in 2024 rose 153% over earlier double-day campaigns, TikTok said. Bong Bach Tuyet ran more than 4,000 livestream sessions with affiliate creators during its Sept. 9 mega sale in 2024. Therefore, the wider creator economy in Vietnam now links pay to sales. In turn, creator-led sellers grow fastest at 20.30% a year during the forecast period. Hosts with loyal audiences also start launching their own branded products.
Can rural and craft sellers open new demand?
Rural and craft sellers open a clear new source of demand, because many have only recently started selling online. TikTok Shop plans 60 days of free commission and fees for OCOP, farm and craft village sellers in the second half of 2026. The package is expected to reach up to VND100 billion, with training in livestreaming, store operations and legal compliance. TikTok also signed a rural economy partnership focused on bamboo, rattan, lacquerware and ornamental plants. Consequently, Tier 2 and Tier 3 provinces become the fastest-growing zone for livestream sales. Local delivery options, such as same-day service, also help these sellers reach city buyers.
Is there room to grow through cross-platform selling?
Cross-platform selling offers a second opening, because sellers can now stream on one app and close sales on another. YouTube and Shopee launched shopping affiliate links in Ho Chi Minh City on Nov. 2, 2024. Facebook Live sellers in the Shopee pilot can pin catalog items and send viewers to Shopee for checkout. Lazada also planned to add 20 million products with milk brands and G-Market in late 2025. In turn, brands can test sessions on several networks without new stores. Demand for streaming software that pushes one feed to many apps rises as a result. Sellers that stream on several networks can also compare costs and results across them.
False claims, tax rules and thin margins weigh on sellers
How do false claims and host scandals hurt trust?
False claims and host scandals are a key risk to trust, because buyers act quickly on what a popular host says during a session. Police arrested two well-known creators in April 2025 over a candy promoted in livestreams that sold more than 100,000 boxes. Each had already been fined VND70 million for false advertising. As a result, brands now check hosts and products more carefully, and the E-commerce Law from July 2026 makes hosts refuse sellers without proper documents.
Why do tax and invoicing rules raise seller costs?
Tax and invoicing rules raise seller costs and act as a barrier, because many livestream sellers operated informally until recently. Under Decree 117, platforms have withheld personal income tax of 0.5% on goods sold by domestic households and individuals since July 1, 2025. Sellers must also keep sales records that match the data reported by each platform. Consequently, some small hosts leave or shift to larger agencies, while formal sellers gain buyer trust and access to platform programs.
How do discounts and fees squeeze margins?
Discounts and fees squeeze margins and limit profit, because mega campaign days push sellers to offer deep price cuts and free shipping. Platform commissions, affiliate fees and advertising boosts add further costs to each order sold in a stream. In turn, small sellers can grow volume while earning little profit. Sellers respond by bundling items, building repeat buyers and shifting to products with higher margins, such as own-brand goods. Marketplace SMEs, the largest seller group in 2025, feel this margin pressure most.
Will account and content rules slow new hosts?
Account and content rules can slow new hosts, because livestreaming now requires verified accounts and careful product claims. Decree 147, effective Dec. 25, 2024, allows only verified accounts to post, comment or livestream. The revised advertising law from Jan. 1, 2026, also requires labeled sponsored content. However, clear rules can lift buyer confidence, which supports longer-term growth for compliant hosts and platforms. Verified accounts also make it easier for buyers to report misleading sessions to platforms and regulators.
Ho Chi Minh City leads while smaller provinces grow fastest
| Region | Value, 2025 (USD billion) | Share, 2025 | CAGR, 2026–2035 |
|---|---|---|---|
| Ho Chi Minh City | 1.46 | 36.0% | 19.27% |
| Hanoi | 1.05 | 26.0% | 19.57% |
| Tier 2 and Tier 3 Provinces | 0.61 | 15.0% | 20.67% |
| Southeast Urban Corridor | 0.53 | 13.0% | 20.07% |
| Red River Delta | 0.40 | 10.0% | 20.17% |
Why does Ho Chi Minh City lead livestream sales?
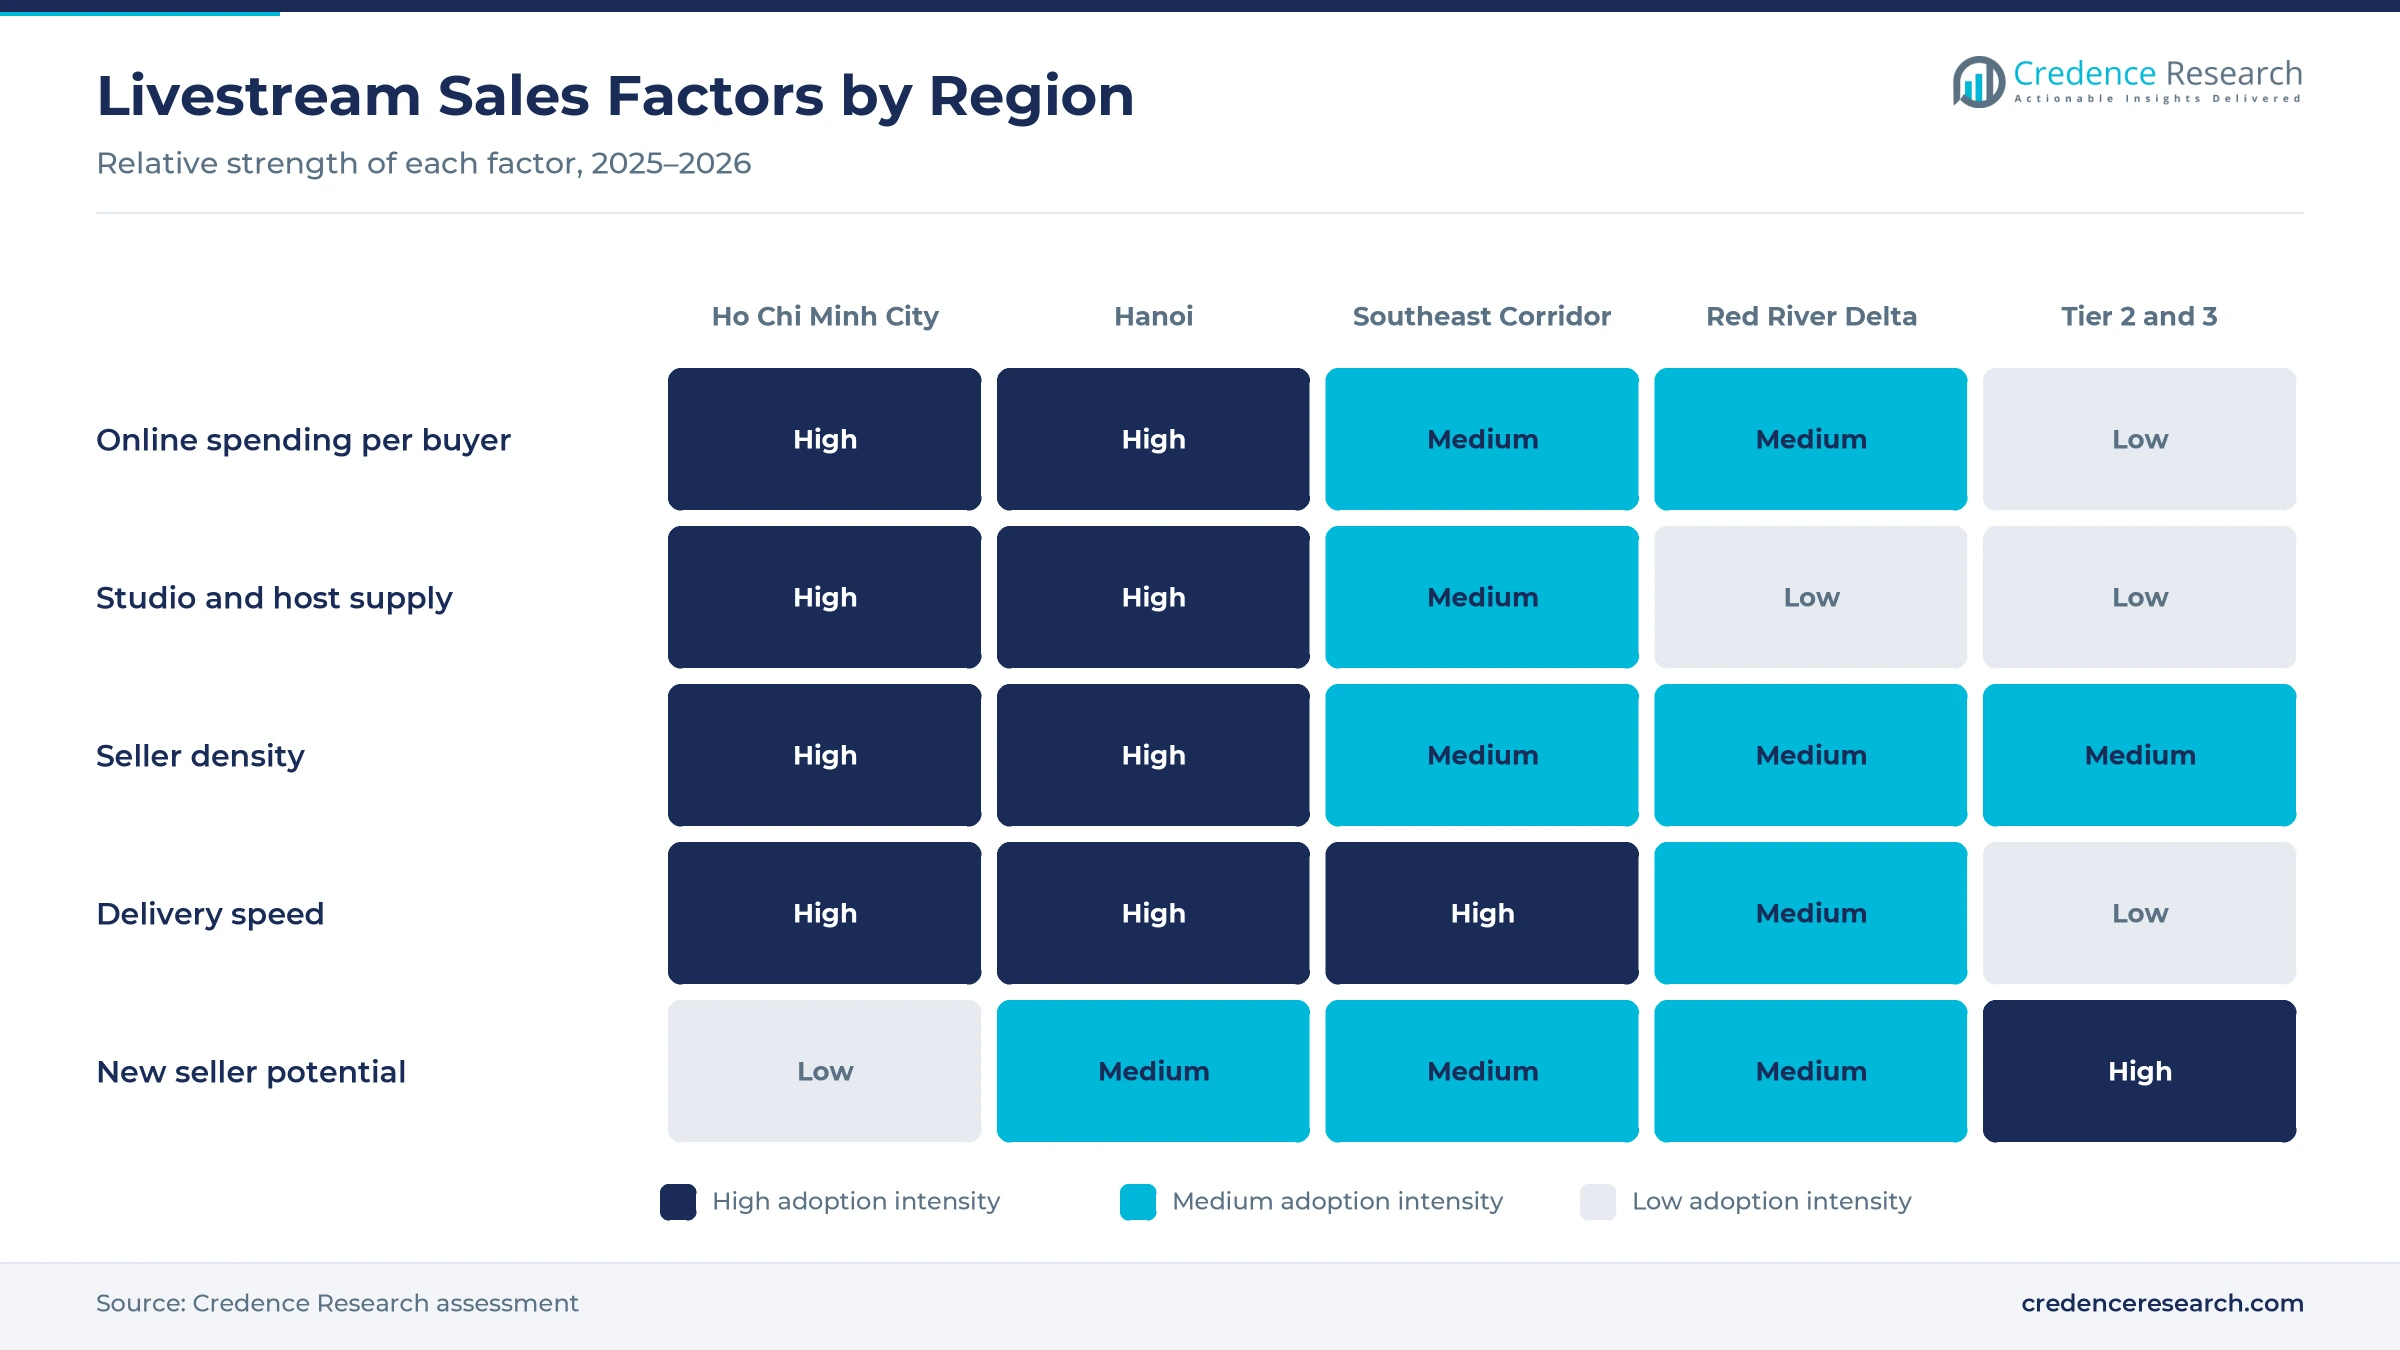
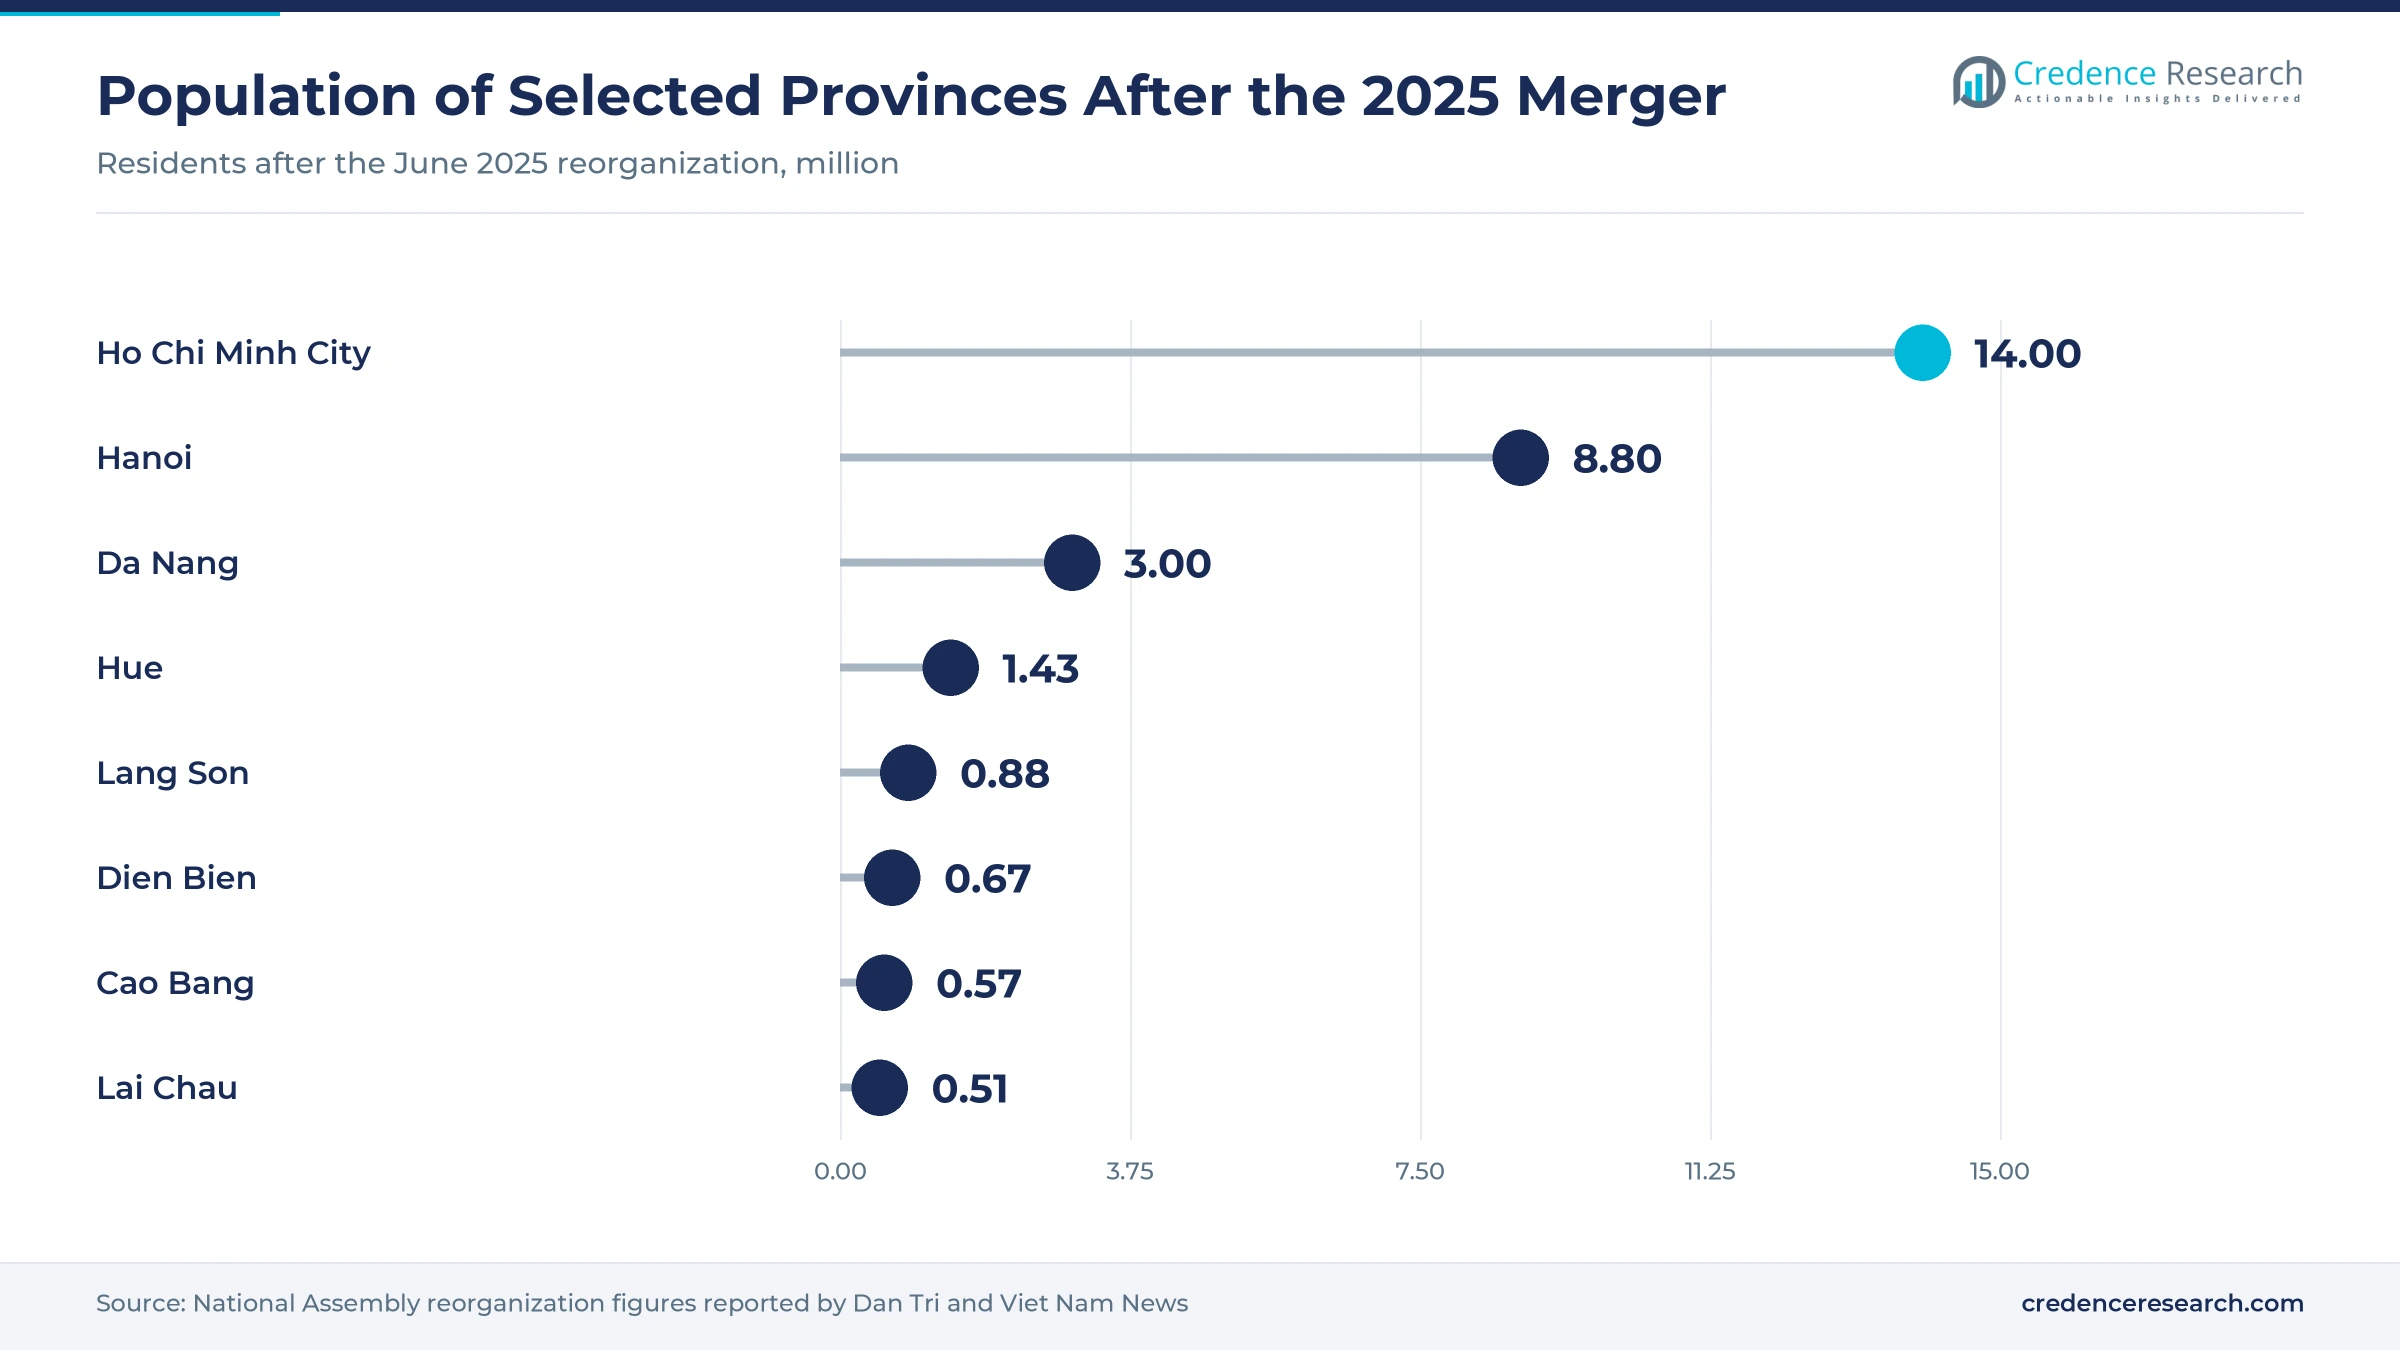
Ho Chi Minh City held 36.0% of 2025 value and grows at 19.27% a year, because the city has the highest incomes and most brand studios. The enlarged city has more than 14 million people after its 2025 merger with Binh Duong and Ba Ria-Vung Tau. YouTube and Shopee also launched their shopping affiliate program in the city in November 2024. As a result, most mega campaign streams and new live commerce formats start in Ho Chi Minh City before spreading to other regions.
How does Hanoi support livestream demand?
Hanoi held 26.0% of 2025 value and grows at 19.57% a year, because the capital combines high incomes with a large base of young online shoppers. Its population passed 8.8 million under the 2025 provincial reorganization, which widens regional demand for livestream shopping. Many fashion, beauty and electronics sellers run studios in the city. Consequently, Hanoi supports both buyer demand and host supply for sessions that reach northern provinces. The capital also hosts many electronics and beauty distributors that stream national campaigns every week.
Why are Tier 2 and Tier 3 provinces growing fastest?
Tier 2 and Tier 3 provinces held 15.0% of 2025 value and grow fastest at 20.67% a year, because farm, craft and OCOP sellers are joining livestreams for the first time. A TikTok campaign sold 300 tons of Lai Chau potatoes in September and October 2025, which shows demand for local produce. Buyers in these provinces also gain from faster delivery and cash-free payment. In turn, both new sellers and new buyers add volume in smaller towns.
What lifts sales in the Southeast Urban Corridor?
The Southeast Urban Corridor held 13.0% of 2025 value and grows at 20.07% a year, because its industrial towns host many young factory workers who shop on phones. Fashion, beauty and daily goods sell well during evening streams. Therefore, local sellers and hosts serve demand that spills over from the largest city.
How does the Red River Delta add buyers?
The Red River Delta held 10.0% of 2025 value and grows at 20.17% a year, because provinces around Hanoi combine dense populations with rising factory incomes. Sellers in these provinces often reach buyers through social video apps. As a result, local sales grow alongside the spread of online food delivery and other app-based services.
Launches and laws from 2024 to 2026
| Development | Status and market relevance |
|---|---|
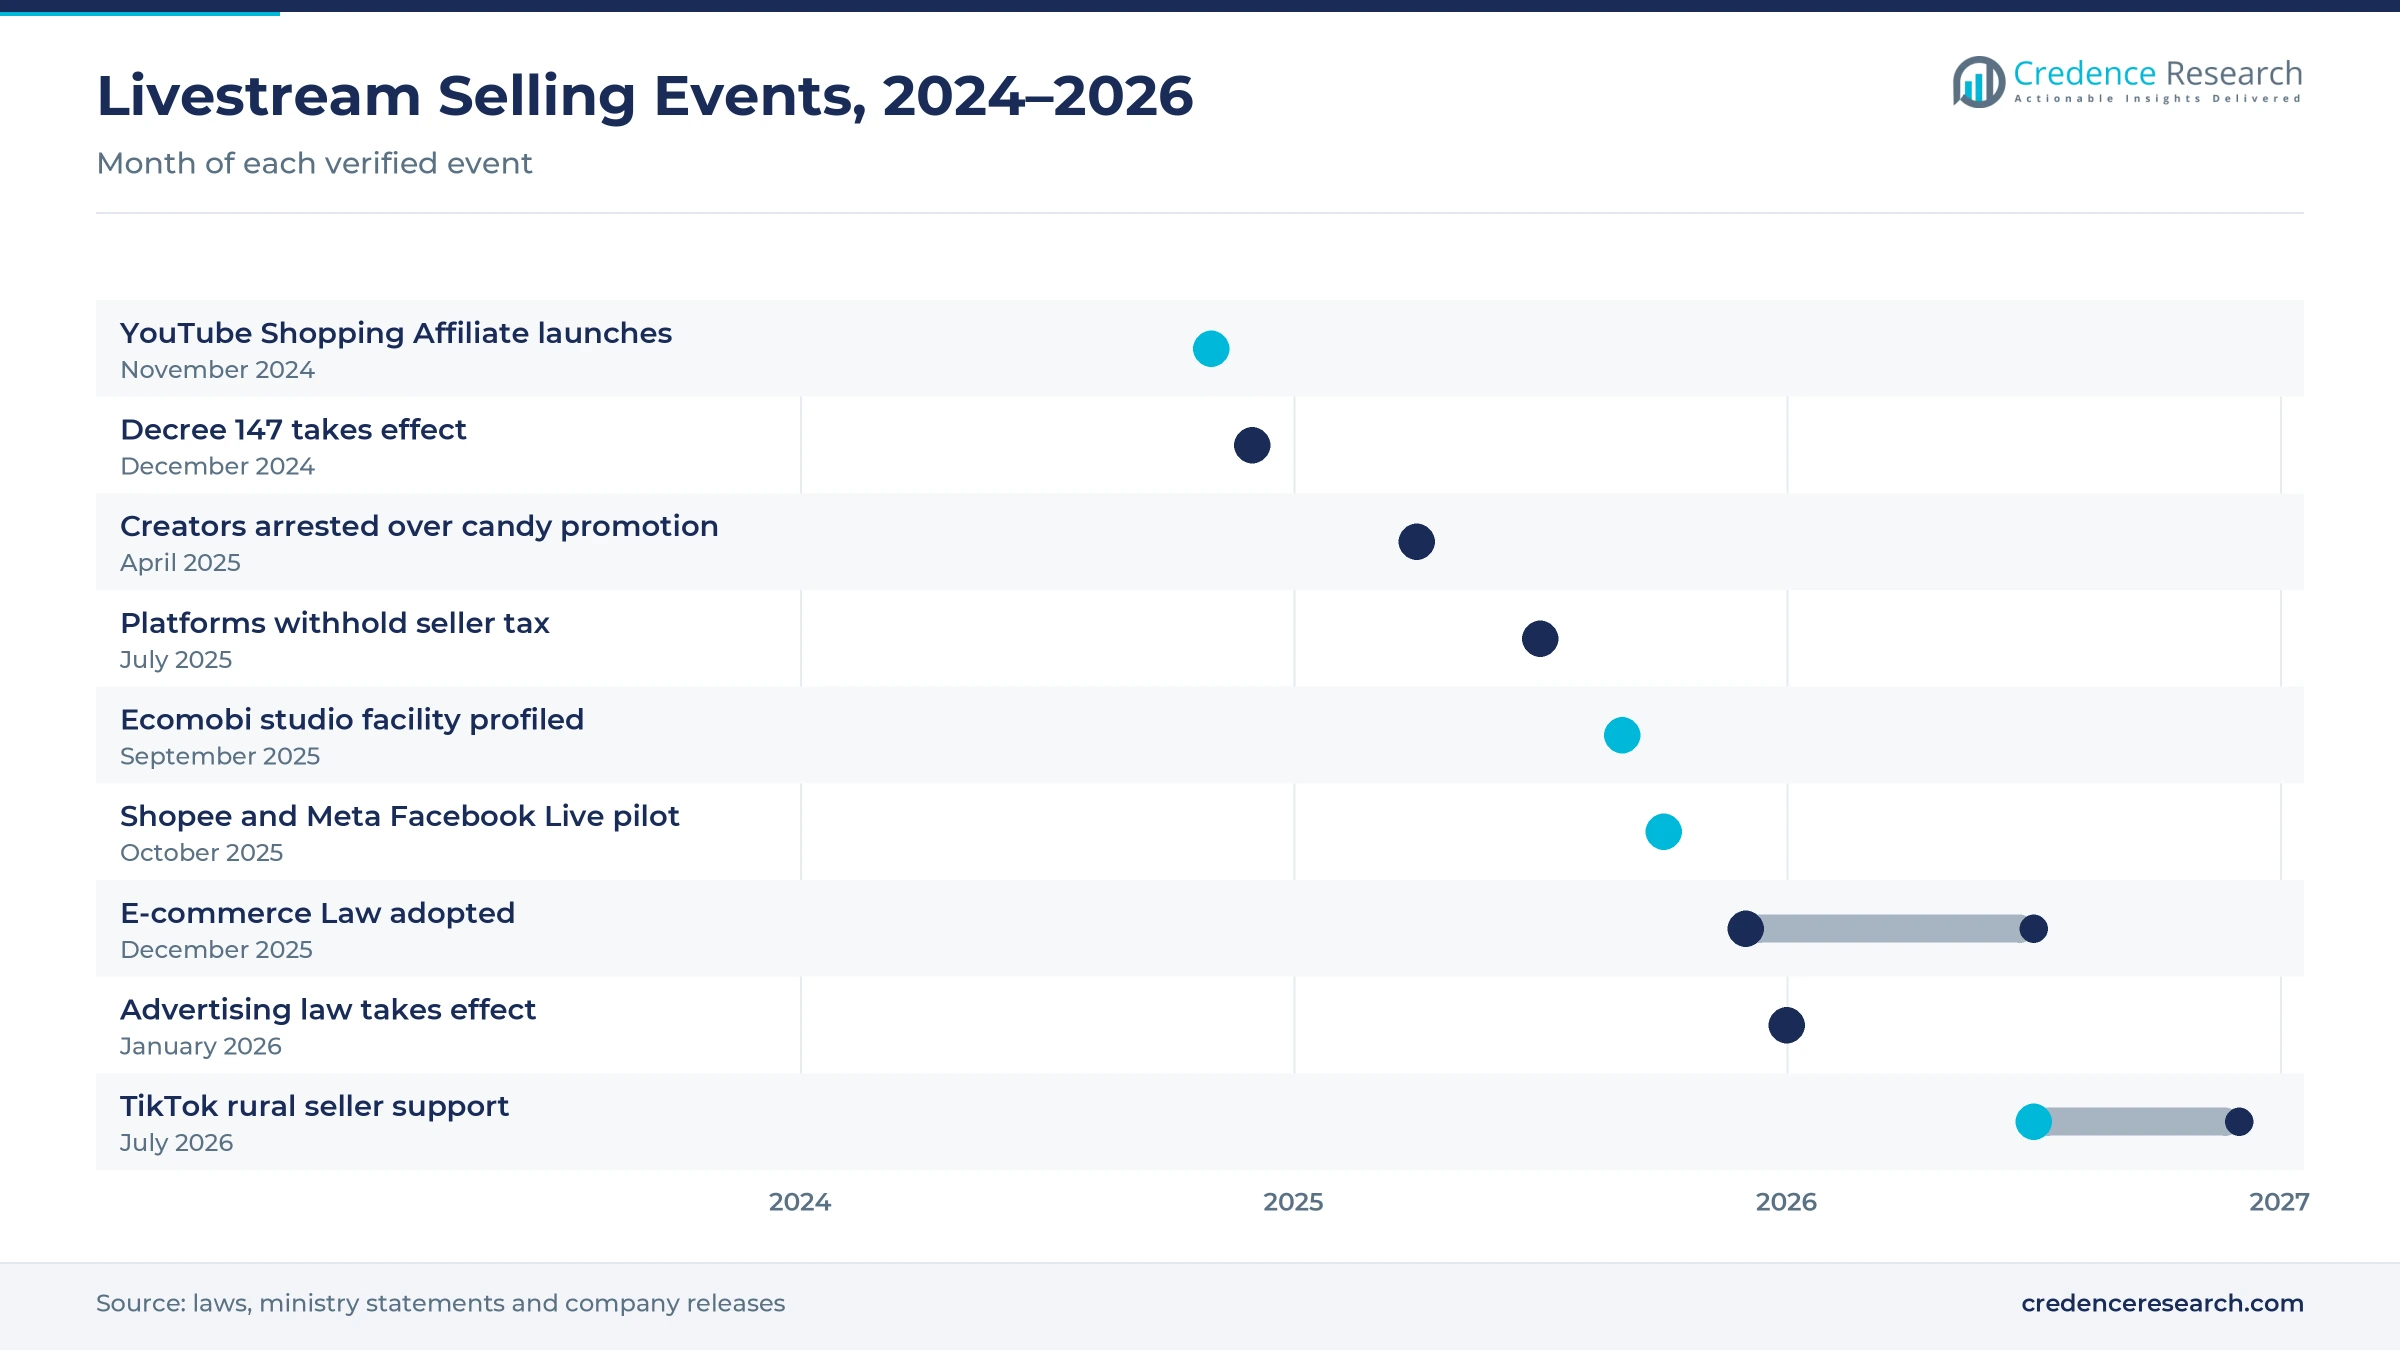
| In November 2024, YouTube and Shopee launched the YouTube Shopping Affiliate program in Ho Chi Minh City. | Lets creators tag Shopee products in videos |
| In July 2025, Decree 117 required platforms to withhold tax for household and individual sellers. | Brings more livestream sellers into the formal tax system |
| In September 2025, Ecomobi described its livestream facility with 51 studios and more than 150 hosts. | Adds studio capacity for brand sessions on TikTok Shop and Shopee |
| In October 2025, Shopee and Meta began a Facebook Live shopping pilot that includes Vietnam. | Links Facebook streams to Shopee checkout |
| In December 2025, the National Assembly adopted the E-commerce Law, effective July 1, 2026. | Sets duties for livestream hosts, sellers and affiliate marketers |
Product tagging, studios and AI hosts change selling
- Product tagging in streams and short videos lets buyers check out without leaving the app, which lifts conversion during sessions.
- Multi-studio facilities run many sessions at once with trained hosts, which lowers the cost per hour of live selling for brands.
- AI hosts and virtual presenters are being developed for e-commerce streams, which could extend selling into late-night hours.
- Platform tax tools calculate and withhold seller taxes on each order, which simplifies compliance for small livestream shops.
Need a Custom Version of This Report?
Tailor the scope, geography, or segments to your exact requirements.
- Custom geography or segment scope
- Direct access to our analyst team
Social apps and marketplaces compete for hosts and sellers
Competition combines social video apps, marketplaces and creator networks that supply hosts and studios. TikTok Shop grew buyers 36% and sellers 42% in 2025 and plans support for rural sellers in 2026. Shopee runs its own live feature, links products to YouTube and began a Facebook Live pilot with Meta in October 2025. Lazada planned to add 20 million products with partners in late 2025, while Tiki remains a domestic marketplace listed by the Ministry of Industry and Trade. Ecomobi operates a studio facility with 51 rooms, and Metub works with more than 5,000 creators across entertainment and live commerce. Companies compete on host networks, discounts, delivery speed, seller fees and tools that turn viewers into repeat buyers.
Companies profiled and their roles in this market
| Company | Type | Role in the market |
|---|---|---|
| TikTok Shop | Social video platform | More than 70 million monthly users; buyers up 36% in 2025 |
| Shopee | Marketplace | YouTube product links and Facebook Live pilot with Meta |
| Meta Platforms | Social network | Facebook Live shopping pilot with Shopee in Vietnam from October 2025 |
| Google YouTube Shopping | Video platform | Shopping Affiliate program launched in November 2024 |
| Lazada | Marketplace | Planned 20 million new products with partners in late 2025 |
| Ecomobi | Creator and studio network | Facility with 51 studios and more than 13,000 live hours a month |
| METUB Network | Creator network | More than 5,000 creators across entertainment and live commerce |
Credence Research view on creator-led selling
Credence Research's view is that Vietnamese livestream selling will grow strongly through 2035, as more sellers pay hosts by result and more buyers shop during daily sessions. Social video apps should keep the largest share of live commerce value, while marketplaces respond through partnerships with YouTube and Facebook. Rural sellers and household goods will add new volume across smaller provinces each year. However, false claims, tax compliance and thin margins will push weaker hosts out and favor professional studios. Hosts that build trust through accurate product claims should hold buyers longest.
How the livestream sales estimate was built
The report uses 2025 as the base year, with values in USD million at current prices. Market values come from the Credence Research model, which combines online buyers, livestream session volumes, conversion rates and average order values. Regional shares and segment splits by platform type, product category and seller type are Credence Research estimates. Sources used are World Bank data, ministry statements, laws and decrees, company releases and news reports, and no interviews or surveys were used.
Creators, rural sellers and rules set the path to 2035
The market is expected to reach USD 24.74 billion by 2035, a 19.76% CAGR during 2026–2035, as livestreams become a daily shopping habit across cities and provinces. Growth should be strongest in Tier 2 and Tier 3 provinces and in home and lifestyle goods, while Ho Chi Minh City keeps the largest share. Professional studios and affiliate hosts will carry more sessions each year. In contrast, new host scandals or sharp fee increases would slow growth, especially among small sellers.
Frequently Asked Questions
How big is the Vietnam live commerce market?
Which region leads livestream sales in Vietnam?
Which region grows fastest?
Which platform type holds the largest share?
How do new laws affect livestream sellers?
Which product category grows fastest?
Who are the leading companies in Vietnam?
What are the main risks to growth?
Table of Content
Chapter 1 Market Segmentation
- 1.1 Segmentation Framework
- 1.1.1 Product and Service Classification
- 1.1.2 Application and End-Use Classification
- 1.1.3 Technology and Solution Classification
- 1.1.4 Customer and Distribution Channel Classification
- 1.1.5 Geographic Segmentation
- 1.1.6 Market Segment Definitions and Boundaries
- 1.2 By Platform Type
- 1.2.1 Social Network Livestreaming
- 1.2.2 Integrated Marketplace Livestreaming
- 1.2.3 Brand-Owned Livestreaming
- 1.2.4 Creator Network Livestreaming
- 1.3 By Product Category
- 1.3.1 Fashion & Accessories
- 1.3.2 Beauty & Personal Care
- 1.3.3 FMCG
- 1.3.4 Consumer Electronics
- 1.3.5 Home & Lifestyle
- 1.4 By Seller Type
- 1.4.1 Brands & Official Stores
- 1.4.2 Marketplace SMEs
- 1.4.3 Creator-Led Sellers
- 1.4.4 Cross-Border Merchants
Chapter 2 Introduction
- 2.1 Report Objectives and Scope
- 2.2 Product Definition and Industry Terminology
- 2.3 Market Inclusions and Exclusions
- 2.4 Research Process
- 2.4.1 Primary Research and Expert Interviews
- 2.4.2 Secondary Research and Source Review
- 2.4.3 Top-Down and Bottom-Up Estimation
- 2.4.4 Data Triangulation and Verification
- 2.5 Market Size Measurement Basis
- 2.5.1 2025: USD 4.04 billion → 2035: USD 24.74 billion
- 2.6 Historical and Forecast Reference Periods
- 2.6.1 Historical Period: 2018-2025
- 2.6.2 Base Year: 2025
- 2.6.3 Forecast Period: 2025-2035
- 2.7 Research Assumptions and Limitations
Chapter 3 Executive Summary
- 3.1 Market Snapshot and Key Findings
- 3.2 Base-Year Market Size, 2025
- 3.3 Forecast Market Size, 2035
- 3.4 Revenue and Volume Growth Outlook
- 3.5 Key Demand and Supply Indicators
- 3.6 Leading Market Segments
- 3.7 Fastest-Growing Market Opportunities
- 3.8 Regional Performance Highlights
- 3.9 Technology and Industry Transformation
- 3.10 Competitive Landscape Summary
- 3.11 Analyst View and Strategic Implications
Chapter 4 Vietnam Live Commerce Market Trends and Developments
- 4.1 Historical Industry Development, 2018-2025
- 4.2 Recent Market Trends and Developments
- 4.3 Demand and Customer Behavior Trends
- 4.4 Technology and Product Innovation
- 4.5 Artificial Intelligence, Automation and Digitalization
- 4.6 Local Manufacturing and Supply Chain Realignment
- 4.7 Industry Partnerships, Mergers and Acquisitions
- 4.8 Sustainability and Circular Economy Developments
- 4.9 Government and Private Sector Investment Trends
- 4.10 Emerging Business Models and Commercialization
- 4.11 Industry Developments and Announcements
Chapter 5 Vietnam Live Commerce Market Production, Supply and Demand Analysis
- 5.1 Demand Trend and Consumption Analysis, 2018-2025
- 5.2 Demand Forecast, 2025-2035
- 5.3 Production and Output Trend, 2018-2025
- 5.4 Production and Output Forecast, 2025-2035
- 5.5 Installed Capacity and Capacity Utilization
- 5.6 Company-Wise Production Plants and Statistics
- 5.6.1 Installed Production Capacity
- 5.6.2 Actual Production
- 5.6.3 Planned Capacity and Expansion Targets
- 5.7 Supply Chain Structure and Procurement Trends
- 5.8 Supply-Demand Gap and Bottlenecks
- 5.9 Import Dependence and Sourcing Structure
- 5.10 Contract Manufacturing and Outsourcing
- 5.11 Regional Supply and Demand Concentration
Chapter 6 Vietnam Live Commerce Market Pricing Analysis
- 6.1 Pricing Structure and Measurement
- 6.2 Historical Pricing Trends, 2018-2025
- 6.3 Pricing Outlook, 2025-2035
- 6.4 Average Selling Price and Unit Economics
- 6.5 Pricing by Product and Market Segment
- 6.6 Geographic Pricing Differences
- 6.7 Key Input, Energy, Labor and Logistics Costs
- 6.8 Contract Pricing and Purchasing Models
- 6.9 Pricing Sensitivity and Competitive Positioning
- 6.10 Price, Margin and Profitability Implications
Chapter 7 Vietnam Live Commerce Market Dynamics
- 7.1 Market Growth Drivers
- 7.1.1 Demand-Side Drivers
- 7.1.2 Technology and Innovation Drivers
- 7.1.3 Infrastructure and Investment Drivers
- 7.1.4 Regulatory and Policy Drivers
- 7.2 Market Restraints
- 7.2.1 Cost and Affordability Constraints
- 7.2.2 Technology and Adoption Barriers
- 7.2.3 Supply Chain and Operational Constraints
- 7.3 Market Challenges
- 7.3.1 Competitive Pressure and Margin Erosion
- 7.3.2 Skills, Infrastructure and Implementation Gaps
- 7.4 Emerging Market Opportunities
- 7.5 Market Dynamics Impact and Time-Horizon Assessment
Chapter 8 Vietnam Live Commerce Value Chain Analysis
- 8.1 Industry Value Chain Overview
- 8.2 Upstream Suppliers and Critical Inputs
- 8.3 Technology and Component Providers
- 8.4 Manufacturing or Service Delivery
- 8.5 Distribution, Channel Partners and Integrators
- 8.6 Downstream Applications and End Users
- 8.7 Value Addition and Profit Pools
- 8.8 Vertical Integration and Outsourcing
- 8.9 Supplier Concentration and Risk
- 8.10 Supply Chain Localization and Resilience
Chapter 9 Vietnam Live Commerce Market Regulations and Policies
- 9.1 Relevant Laws, Standards and Compliance Frameworks
- 9.2 Product, Service, Safety and Quality Requirements
- 9.3 Government Policies, Incentives and Subsidies
- 9.4 Imports, Exports and Trade Barriers
- 9.5 Public Procurement and Local Content Requirements
- 9.6 Environmental and Sustainability Compliance
- 9.7 Data Protection, AI and Cybersecurity Compliance
- 9.8 Upcoming Policy Changes and Market Implications
Chapter 10 Vietnam Live Commerce Market Hotspots and Opportunities
- 10.1 Market Opportunity Mapping and Growth Hotspots
- 10.2 High-Growth Applications and Customer Groups
- 10.3 Underserved Markets and White-Space Opportunities
- 10.4 Emerging Technology and Product Opportunities
- 10.5 New Capacity and Investment Hotspots
- 10.6 Market Entry and Expansion Opportunities
- 10.7 Distribution and Partnership Opportunities
- 10.8 Near-Term and Long-Term Commercial Potential
- 10.9 Opportunity Attractiveness and Execution Risks
Chapter 11 Vietnam Live Commerce Market Outlook, 2025-2035
- 11.1 Market Size and Analysis
- 11.1.1 Revenue (Market Measurement: 2025: USD 4.04 billion → 2035: USD 24.74 billion)
- 11.1.2 Market Volume and Quantity Sold
- 11.1.3 Historical Market Size, 2018-2025
- 11.1.4 Base-Year Market Size, 2025
- 11.2 Market Forecast, 2025-2035
- 11.2.1 Revenue Forecast to 2035
- 11.2.2 Volume Forecast to 2035
- 11.2.3 CAGR and Year-on-Year Growth
- 11.2.4 Incremental Revenue Opportunity
- 11.3 Forecast Assumptions and Scenario Analysis
- 11.3.1 Base-Case Forecast
- 11.3.2 Optimistic and Conservative Scenarios
- 11.3.3 Technology, Pricing and Policy Sensitivities
- 11.4 Market Attractiveness and Growth Outlook
Chapter 12 Vietnam Live Commerce Market Segmentation and Outlook
- 12.1 Segmentation Summary and Market Shares, 2025
- 12.2 Largest and Fastest-Growing Segments
- 12.3 By Platform Type - Market Size and Forecast, 2025-2035
- 12.3.1 Segment Definition and Scope
- 12.3.2 Historical Market Size, 2018-2025
- 12.3.3 Revenue Forecast, 2025-2035
- 12.3.4 Volume Forecast, 2025-2035
- 12.3.5 Base-Year Market Share, 2025
- 12.3.6 Segment CAGR and Growth Drivers
- 12.3.7 Subsegment Market Size and Forecast
- 12.3.7.1 Social Network Livestreaming
- 12.3.7.2 Integrated Marketplace Livestreaming
- 12.3.7.3 Brand-Owned Livestreaming
- 12.3.7.4 Creator Network Livestreaming
- 12.3.8 Subsegment Pricing and Adoption Trends
- 12.3.9 Leading Suppliers and Competition
- 12.3.10 Regional Demand and Opportunities
- 12.4 By Product Category - Market Size and Forecast, 2025-2035
- 12.4.1 Segment Definition and Scope
- 12.4.2 Historical Market Size, 2018-2025
- 12.4.3 Revenue Forecast, 2025-2035
- 12.4.4 Volume Forecast, 2025-2035
- 12.4.5 Base-Year Market Share, 2025
- 12.4.6 Segment CAGR and Growth Drivers
- 12.4.7 Subsegment Market Size and Forecast
- 12.4.7.1 Fashion & Accessories
- 12.4.7.2 Beauty & Personal Care
- 12.4.7.3 FMCG
- 12.4.7.4 Consumer Electronics
- 12.4.7.5 Home & Lifestyle
- 12.4.8 Subsegment Pricing and Adoption Trends
- 12.4.9 Leading Suppliers and Competition
- 12.4.10 Regional Demand and Opportunities
- 12.5 By Seller Type - Market Size and Forecast, 2025-2035
- 12.5.1 Segment Definition and Scope
- 12.5.2 Historical Market Size, 2018-2025
- 12.5.3 Revenue Forecast, 2025-2035
- 12.5.4 Volume Forecast, 2025-2035
- 12.5.5 Base-Year Market Share, 2025
- 12.5.6 Segment CAGR and Growth Drivers
- 12.5.7 Subsegment Market Size and Forecast
- 12.5.7.1 Brands & Official Stores
- 12.5.7.2 Marketplace SMEs
- 12.5.7.3 Creator-Led Sellers
- 12.5.7.4 Cross-Border Merchants
- 12.5.8 Subsegment Pricing and Adoption Trends
- 12.5.9 Leading Suppliers and Competition
- 12.5.10 Regional Demand and Opportunities
- 12.6 Segment Growth Comparison
- 12.7 Segment Attractiveness and Priority Matrix
Chapter 13 Vietnam Live Commerce Geographic Market Outlook, 2025-2035
- 13.1 Regional Market Size and Country-Level Shares, 2025
- 13.2 Country Market Size Comparison, 2025
- 13.3 Country Market Forecasts, 2025-2035
- 13.4 Subregional Industrial and Demand Clusters
- 13.5 Intra-Regional Pricing and Cost Differences
- 13.6 Cross-Border Trade and Supply Networks
- 13.7 Regional Supply and Demand Balances
- 13.8 Country Opportunity Comparison and Prioritization
Note: Every listed country is covered on the structure shown under the first country.
Chapter 14 Vietnam Live Commerce Technology, Innovation and Sustainability Outlook
- 14.1 Technology Landscape and Maturity
- 14.2 Product, Process and Service Innovation
- 14.3 AI, Automation and Digital Tools in the Industry
- 14.4 Technology Adoption and Performance Benchmarking
- 14.5 Innovation Pipeline and R&D Investment
- 14.6 Patent and Intellectual Property Trends
- 14.7 Energy Efficiency and Resource Management
- 14.8 Sustainability, Recycling and Circularity
- 14.9 Technology Roadmap, 2025-2035
- 14.10 Risks of Obsolescence and Technology Substitution
Chapter 15 Vietnam Live Commerce Market Key Strategic Imperatives
- 15.1 Growth and Market Entry Priorities
- 15.2 High-Return Products and Segments
- 15.3 Pricing, Profitability and Cost Optimization
- 15.4 Technology Investment and Product Differentiation
- 15.5 Supply Chain Localization and Resilience
- 15.6 Distribution and Customer Acquisition
- 15.7 Partnership, Acquisition and Capacity Strategy
- 15.8 Regional Expansion Priorities
- 15.9 Short-, Medium- and Long-Term Actions
Chapter 16 Competition Outlook
- 16.1 Industry Competition Characteristics
- 16.2 Market Structure and Concentration
- 16.3 Market Share and Competitive Positioning, 2025
- 16.4 Company-Wise Revenue and Product Benchmarking
- 16.5 Production and Service Capacity Benchmarking
- 16.6 Technology, Pricing and Differentiation
- 16.7 Regional Footprint and Distribution Strength
- 16.8 Mergers, Acquisitions and Strategic Alliances
- 16.9 New Entrants and Competitive Threats
- 16.10 Porter's Five Forces and Industry Attractiveness
- 16.11 Competitive Outlook, 2025-2035
Chapter 17 Company Profiles
- 17.1 Company Coverage and Selection Criteria
- 17.2 TikTok Shop
- 17.2.1 Business Description
- 17.2.2 Company Ownership and Geographic Presence
- 17.2.3 Product and Service Portfolio
- 17.2.4 Manufacturing and Operating Footprint
- 17.2.5 Production Capacity and Expansion Plans
- 17.2.6 Financial Performance and Investment
- 17.2.7 Market Share and Competitive Position
- 17.2.8 Technology and Innovation Capabilities
- 17.2.9 Strategic Alliances or Partnerships
- 17.2.10 Recent Developments
- 17.2.11 Growth Strategy and Outlook
- 17.3 Shopee
- 17.4 Meta Platforms
- 17.5 Lazada
- 17.6 Google YouTube Shopping
- 17.7 Tiki
- 17.8 Ecomobi
- 17.9 METUB Network
- 17.10 ACCESSTRADE Vietnam
- 17.11 OnPoint
- 17.12 Other Relevant Market Participants
Note: Every listed company is profiled on the structure shown under the first company. The company list is preliminary and may change based on research findings, market developments, data availability and client requirements.
Chapter 18 Disclaimer
- 18.1 Research and Forecast Disclaimer
- 18.2 Data Source and Estimation Limitations
Note: The depth of individual sections depends on data availability for this market. Volume, capacity, trade and other unit-based metrics are included where applicable.

