
A mobile-first audience moves ad budgets online
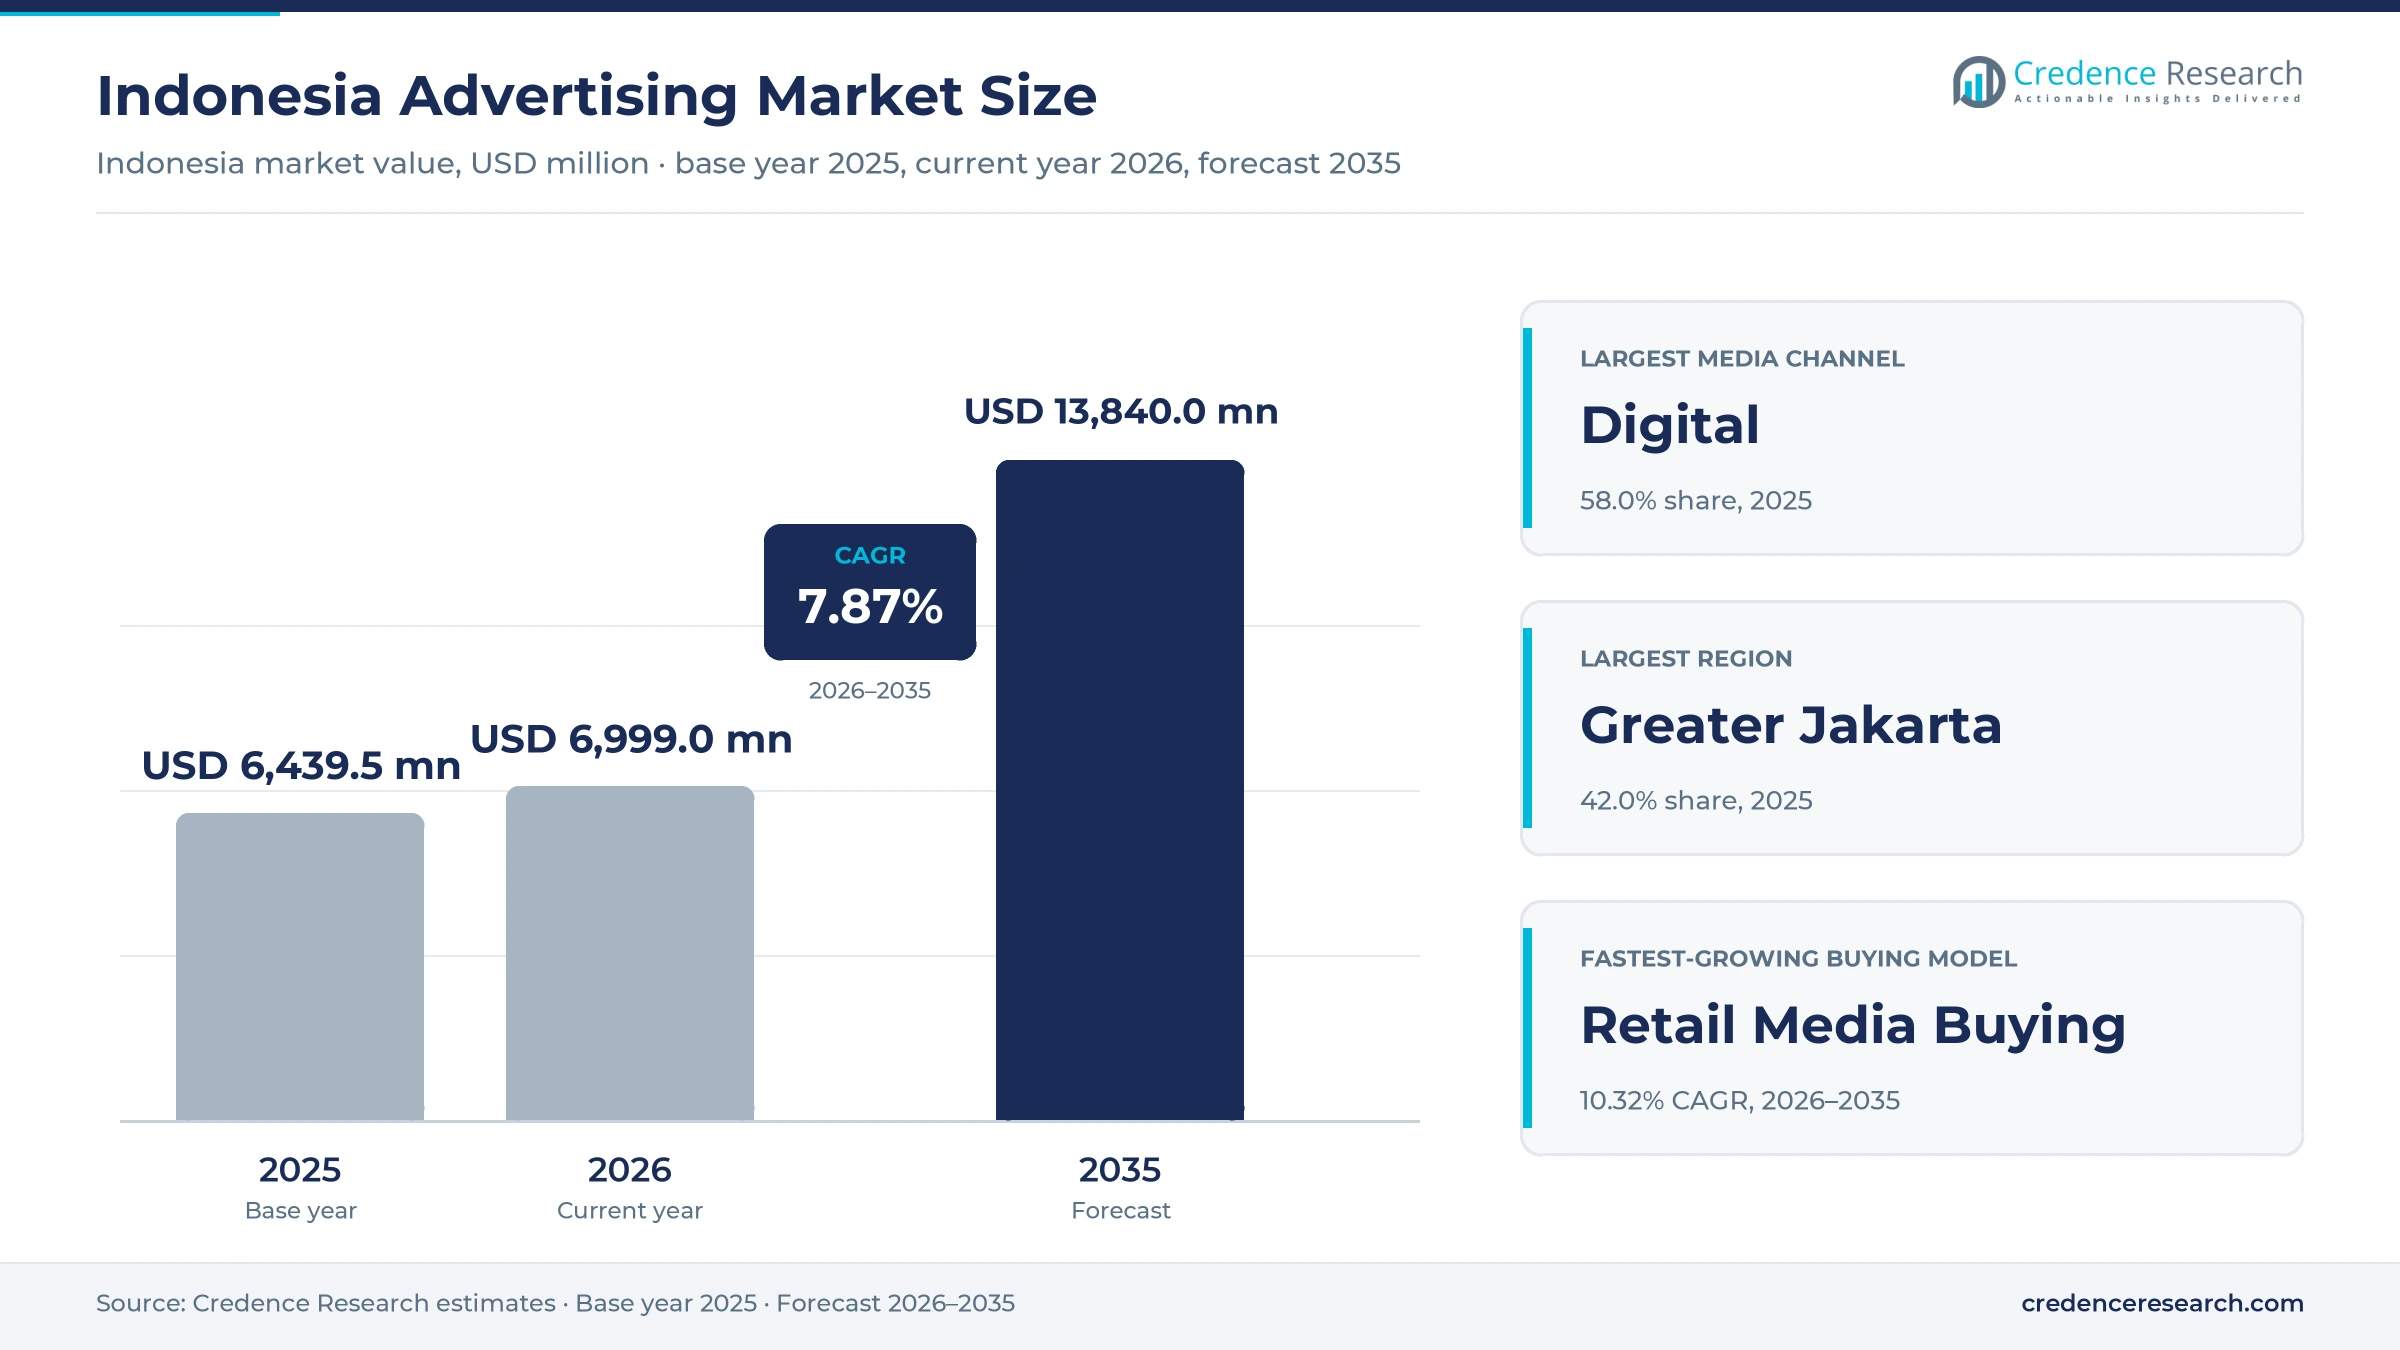
The Indonesia advertising market was valued at USD 6.44 billion in 2025 and is projected to increase from USD 7.00 billion in 2026 to USD 13.84 billion by 2035, registering a CAGR of 7.87% during 2026–2035. Demand comes from about 285.7 million people, a fast-growing online audience and brands that now sell through marketplaces, short video and chat apps. Greater Jakarta held the largest regional share, 42.0% in 2025, because the capital hosts most national advertisers, broadcasters and agency networks. Kalimantan and Sulawesi grow fastest at 8.43% a year, as phone use spreads and regional brands buy online placements. The most important commercial change is the rise of shoppable media, where ads on video and social apps now link viewers straight to checkout pages and let brands pay for sales rather than for reach alone.
Which media and ad formats does the estimate count?
The estimate measures paid media spending by advertisers in Indonesia across digital platforms, television, out-of-home media, print, radio and cinema. It covers search, social, video, display, native, audio and experiential formats, whether bought directly, through agencies, through programmatic auctions, on a performance basis or on retail platforms. Values are stated in USD million at current prices, converted from rupiah at average annual exchange rates.
The estimate excludes agency fees that are not tied to media, in-house marketing staff costs, sponsorship rights and public relations work. It also excludes spending by Indonesian brands on media placed outside the country. The value chain runs from advertisers through agencies and ad technology platforms to publishers, broadcasters, outdoor owners and creators.
Indonesia Advertising Market Insights
- The Indonesia advertising market was valued at USD 6.44 billion in 2025 and is projected to reach USD 13.84 billion by 2035, registering a CAGR of 7.87% during 2026–2035.
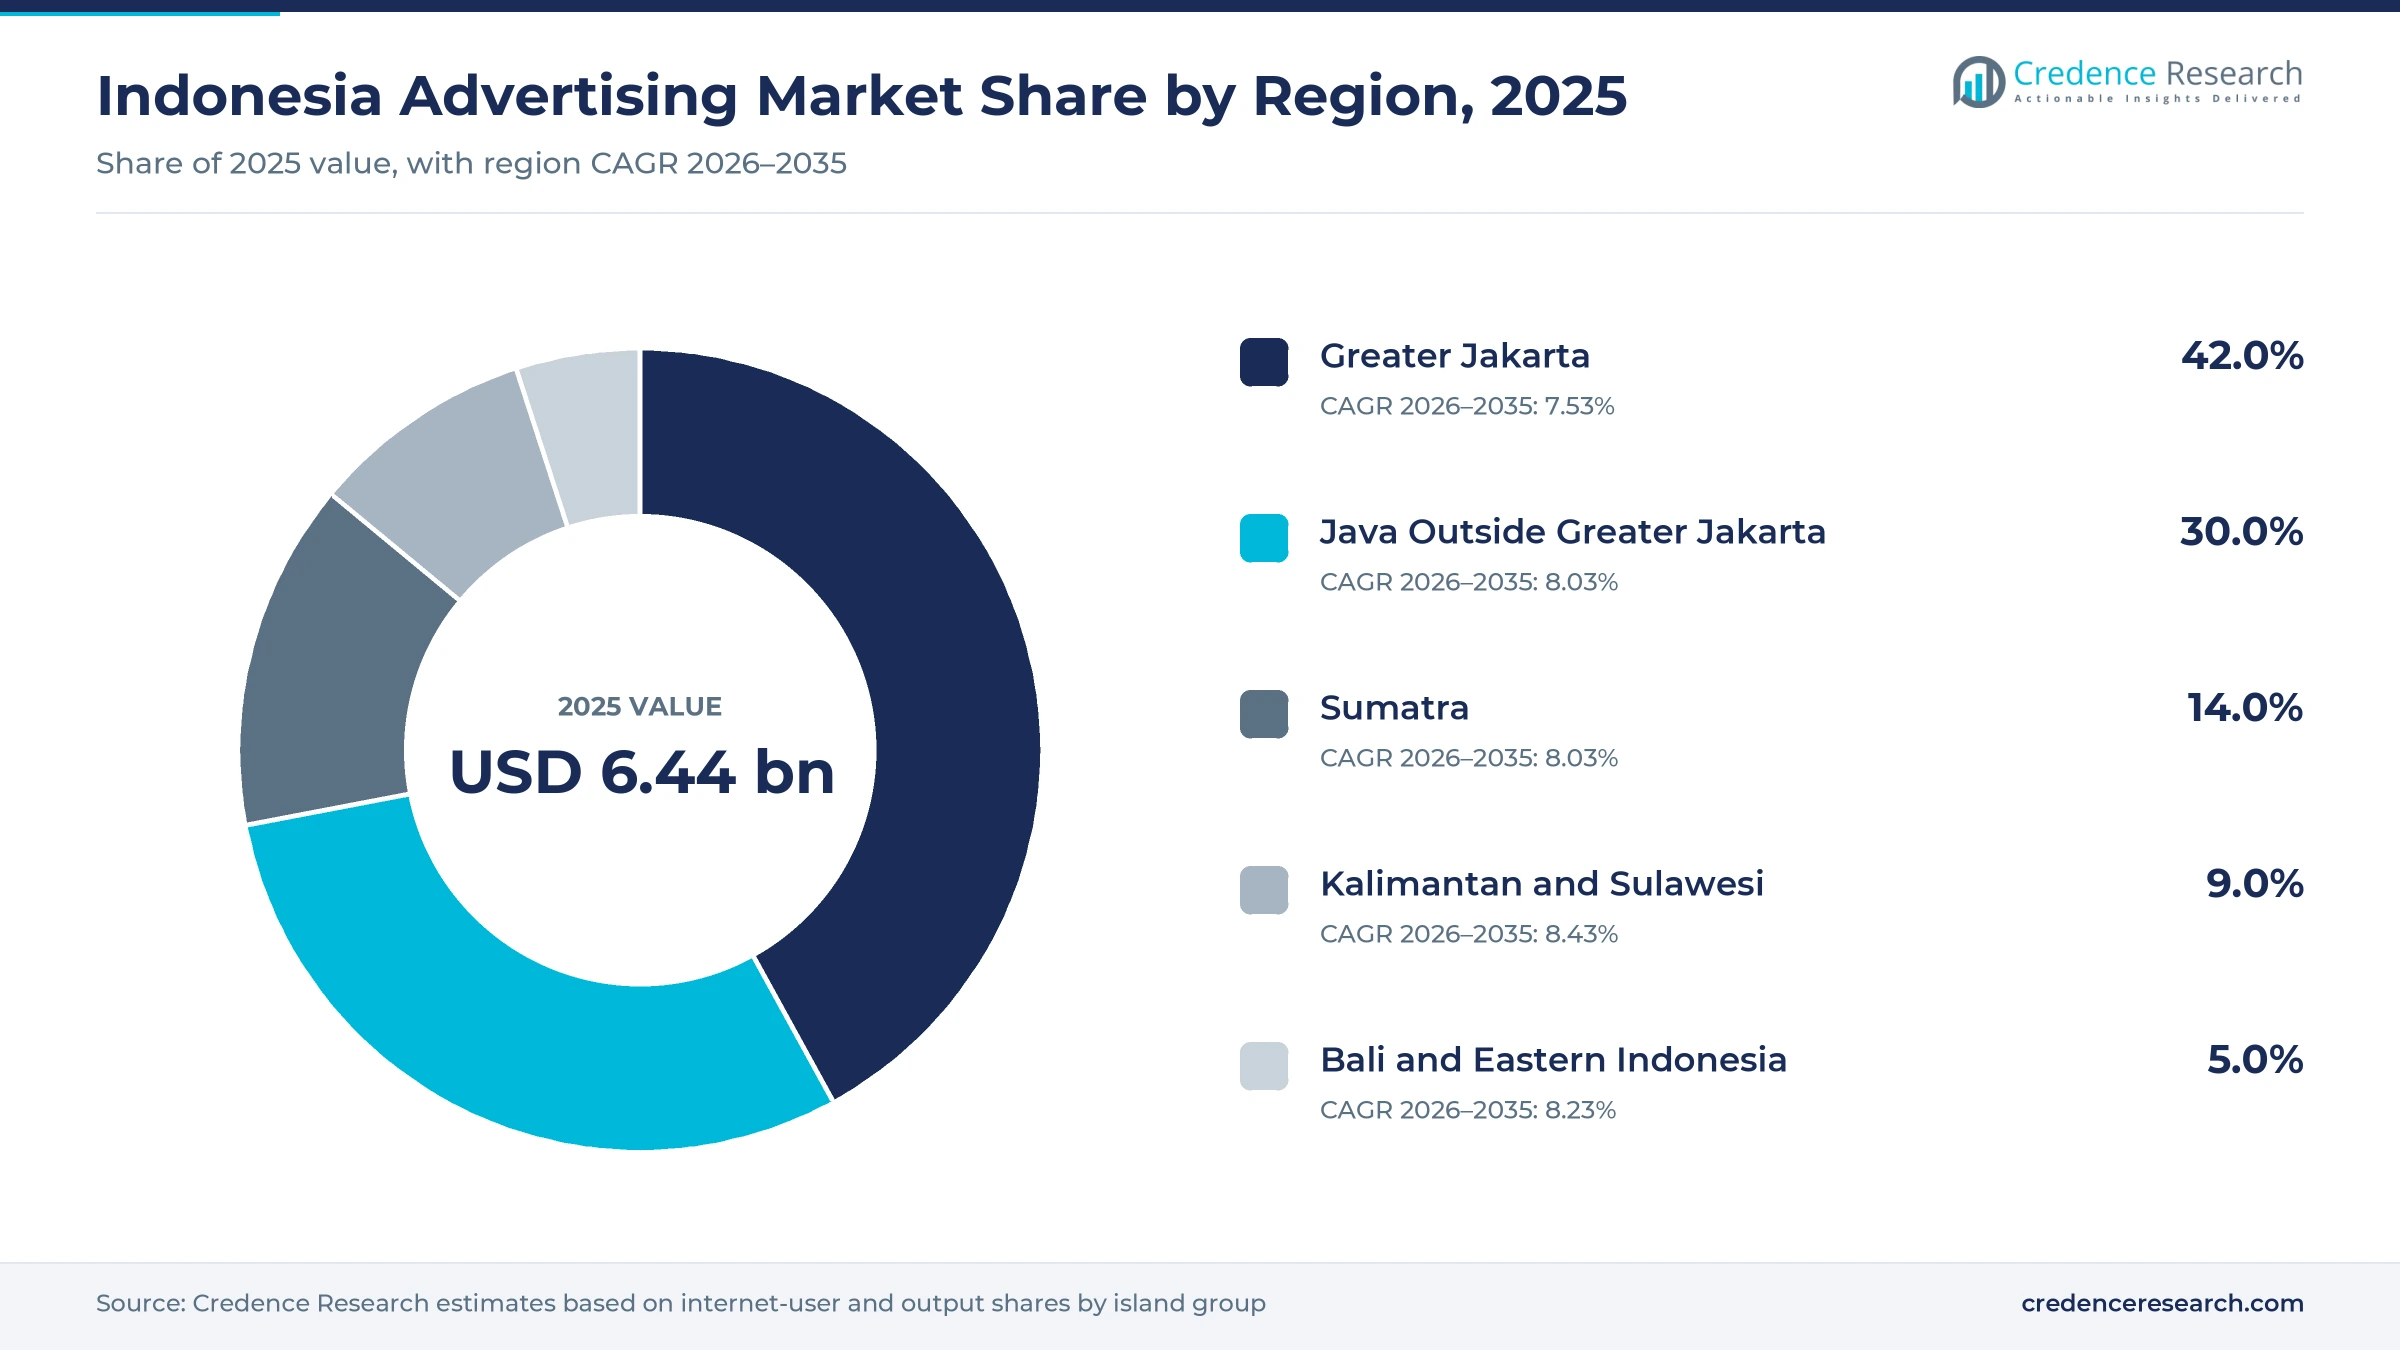
- Greater Jakarta held 42.0% of 2025 advertising value, because the capital hosts most national advertisers, broadcasters and agency networks.
- Digital channels led with 58.0% of 2025 spending, as 229.43 million internet users in 2025 moved viewing time to phones and apps.
- TikTok took a 75.01% stake in Tokopedia on Jan. 31, 2024, which joined short video and online shopping in one large advertising channel.
- Retail media buying grows fastest at 10.32% a year during 2026–2035, as marketplaces sell sponsored listings and video ads linked to checkout.
Digital channels and social formats carry the most value
Why do digital channels lead ad spending in Indonesia?
Based on media channel, the market is categorized into digital, television, out-of-home, print and radio and cinema. Digital channels led with 58.0% of 2025 value, because most Indonesians now watch video, chat and shop on their phones. Digital spending also grows fastest at 9.21% a year, as brands move budgets from print and radio toward mobile video and social feeds.
How do social and video formats shape budgets?
Based on advertising format, the market is categorized into search, social media, video, display and native, and audio and experiential advertising. Social Media Advertising led with 31.0% of 2025 value, because brands use feeds, stories and creator posts to reach young buyers. Video Advertising grows fastest at 8.94% a year, as short video and connected TV ads link viewers to product pages.
Which industries spend the most on advertising?
Based on end-use industry, the market is categorized into consumer goods and retail, financial services, telecommunications and technology, automotive and mobility, and travel, media and entertainment. Consumer Goods and Retail led with 38.0% of 2025 value, because food, personal care and marketplace brands advertise all year. Travel, Media and Entertainment grows fastest at 8.34% a year, as streaming and travel brands chase new viewers.
How are advertisers changing the way they buy media?
Based on buying model, the market is categorized into direct media buying, agency-mediated buying, programmatic auctions, performance-based buying and retail media buying. Agency-Mediated Buying led with 37.0% of 2025 value, because large brands still rely on agencies for planning and television deals. Retail Media Buying grows fastest at 10.32% a year, as marketplaces sell sponsored listings close to the point of purchase.
| Segment Group | Leading Sub-segment | Share, 2025 | Fastest-growing Sub-segment | CAGR, 2026–2035 |
|---|---|---|---|---|
| By Media Channel | Digital | 58.0% | Digital | 9.21% |
| By Advertising Format | Social Media Advertising | 31.0% | Video Advertising | 8.94% |
| By End-Use Industry | Consumer Goods and Retail | 38.0% | Travel, Media and Entertainment | 8.34% |
| By Buying Model | Agency-Mediated Buying | 37.0% | Retail Media Buying | 10.32% |
Request a Free Sample
Fill in your details and we'll send you a free sample report.
- Sample data tables & charts
- Research methodology
Phone reach, shoppable media and steady growth lift budgets
How does a mobile-first audience scale ad budgets?
A mobile-first audience scales ad budgets, because brands can now reach most Indonesian households through phones rather than through television alone. Indonesia had 229.43 million internet users in 2025, a penetration rate of 80.66%, up from 221.56 million in 2024, according to an APJII survey reported by Bisnis.com. Internet use reached 72.78% of the population in 2024, up from 69.21% in 2023, according to World Bank data. The population reached about 285.7 million in 2025, so each extra point of penetration adds millions of reachable viewers. Penetration also rose from 79.50% in 2024, a gain of more than one point in a single year. As a result, mobile video and social placements absorb most new budgets through 2035.
Why does commerce and retail media expansion lift spending?
Commerce and retail media expansion lifts spending, because marketplaces and video apps now let brands pay for ads that end in a purchase. TikTok completed its purchase of 75.01% of Tokopedia on Jan. 31, 2024, which joined short video with a major online marketplace. YouTube said on Oct. 7, 2026, that its shopping affiliate program in Indonesia works with Shopee, Lazada, Blibli and Zalora, and that YouTube ads can take viewers straight to checkout. Retail was expected to be the fastest-growing advertiser sector in 2025, with spending up 54.8%, according to the dentsu Indonesia forecast. Media and entertainment spending was also expected to rise 25.6%. In turn, retail media buying grows at 10.32% a year through 2035, the fastest of any buying model.
How do video, social and programmatic buying reallocate budgets?
Video, social and programmatic buying reallocate budgets, because advertisers want measurable reach and a lower cost for each result. Digital spending in Indonesia was expected to grow 10% to 12% in 2025, compared with 3% to 5% for television. Out-of-home media, including digital screens, was expected to grow 7.0% in the same year. Meta now lets Indonesian advertisers manage WhatsApp, Facebook and Instagram campaigns from one Ads Manager dashboard, while its Advantage+ tools use AI to shift budgets between placements. These tools reward short video and creator content that keeps viewers watching. Consequently, video advertising grows fastest at 8.94% a year, while social media advertising keeps the largest format share, 31.0% in 2025.
Why do steady economic growth and agency investment matter?
Steady economic growth and agency investment keep ad budgets rising, because brands plan campaigns around household spending and national sales targets. Indonesia's economy grew 5.11% in 2025, up from 5.03% in 2024, according to Statistics Indonesia. Java produced 56.93% of national output in 2025 and grew 5.30%, which keeps the largest budgets on the island. Total ad spend in Indonesia was expected to grow 5.1% in 2025, and the country was named one of the top two markets driving growth in Southeast Asia. Publicis Groupe Indonesia agreed on May 28, 2026, to buy Inter Pariwara Global and iLab Indonesia, which employ about 150 people. As a result, agency-mediated buying keeps 37.0% of 2025 value.
Agency mergers and streaming reshape media buying
How is the shift to merged, AI-led agency groups playing out?
Agency groups are shifting toward merged, AI-led structures, because global advertisers want one partner for media, data and commerce. WPP retired the GroupM name on May 28, 2025, and renamed its media arm WPP Media, keeping Mindshare, Wavemaker and EssenceMediacom as client teams around its WPP Open AI platform. Omnicom completed its acquisition of Interpublic on Nov. 26, 2025, according to Omnicom, and runs the combined group on its Omni platform. Hakuhodo International Indonesia named new leaders across its units in 2025 as part of a strategic overhaul. Publicis then folded two acquired Indonesian agencies into Spark Foundry Indonesia in 2026. Consequently, large advertisers can buy planning, data and commerce media from fewer, larger partners through 2035.
Why are TV groups rising in streaming while keeping broadcast reach?
Television groups are rising in streaming while they keep broadcast reach, because viewers split time between free TV and apps. SCTV and Indosiar held the viewership lead in the first quarter of 2025, and every channel run by Emtek ranked in the national top 10. Emtek also runs Vidio, a streaming platform whose subscriptions kept growing in early 2025. MNC Media reported that RCTI had a 15.2% primetime audience share in 2024, while MNCTV averaged 13.8% and GTV 6.5% of all-time viewing. Both groups can therefore sell television spots and streaming ads together to national brands. As a result, television stays the second-largest channel, while streaming adds new video inventory for advertisers.
Is there an opening to reach online audiences outside Java?
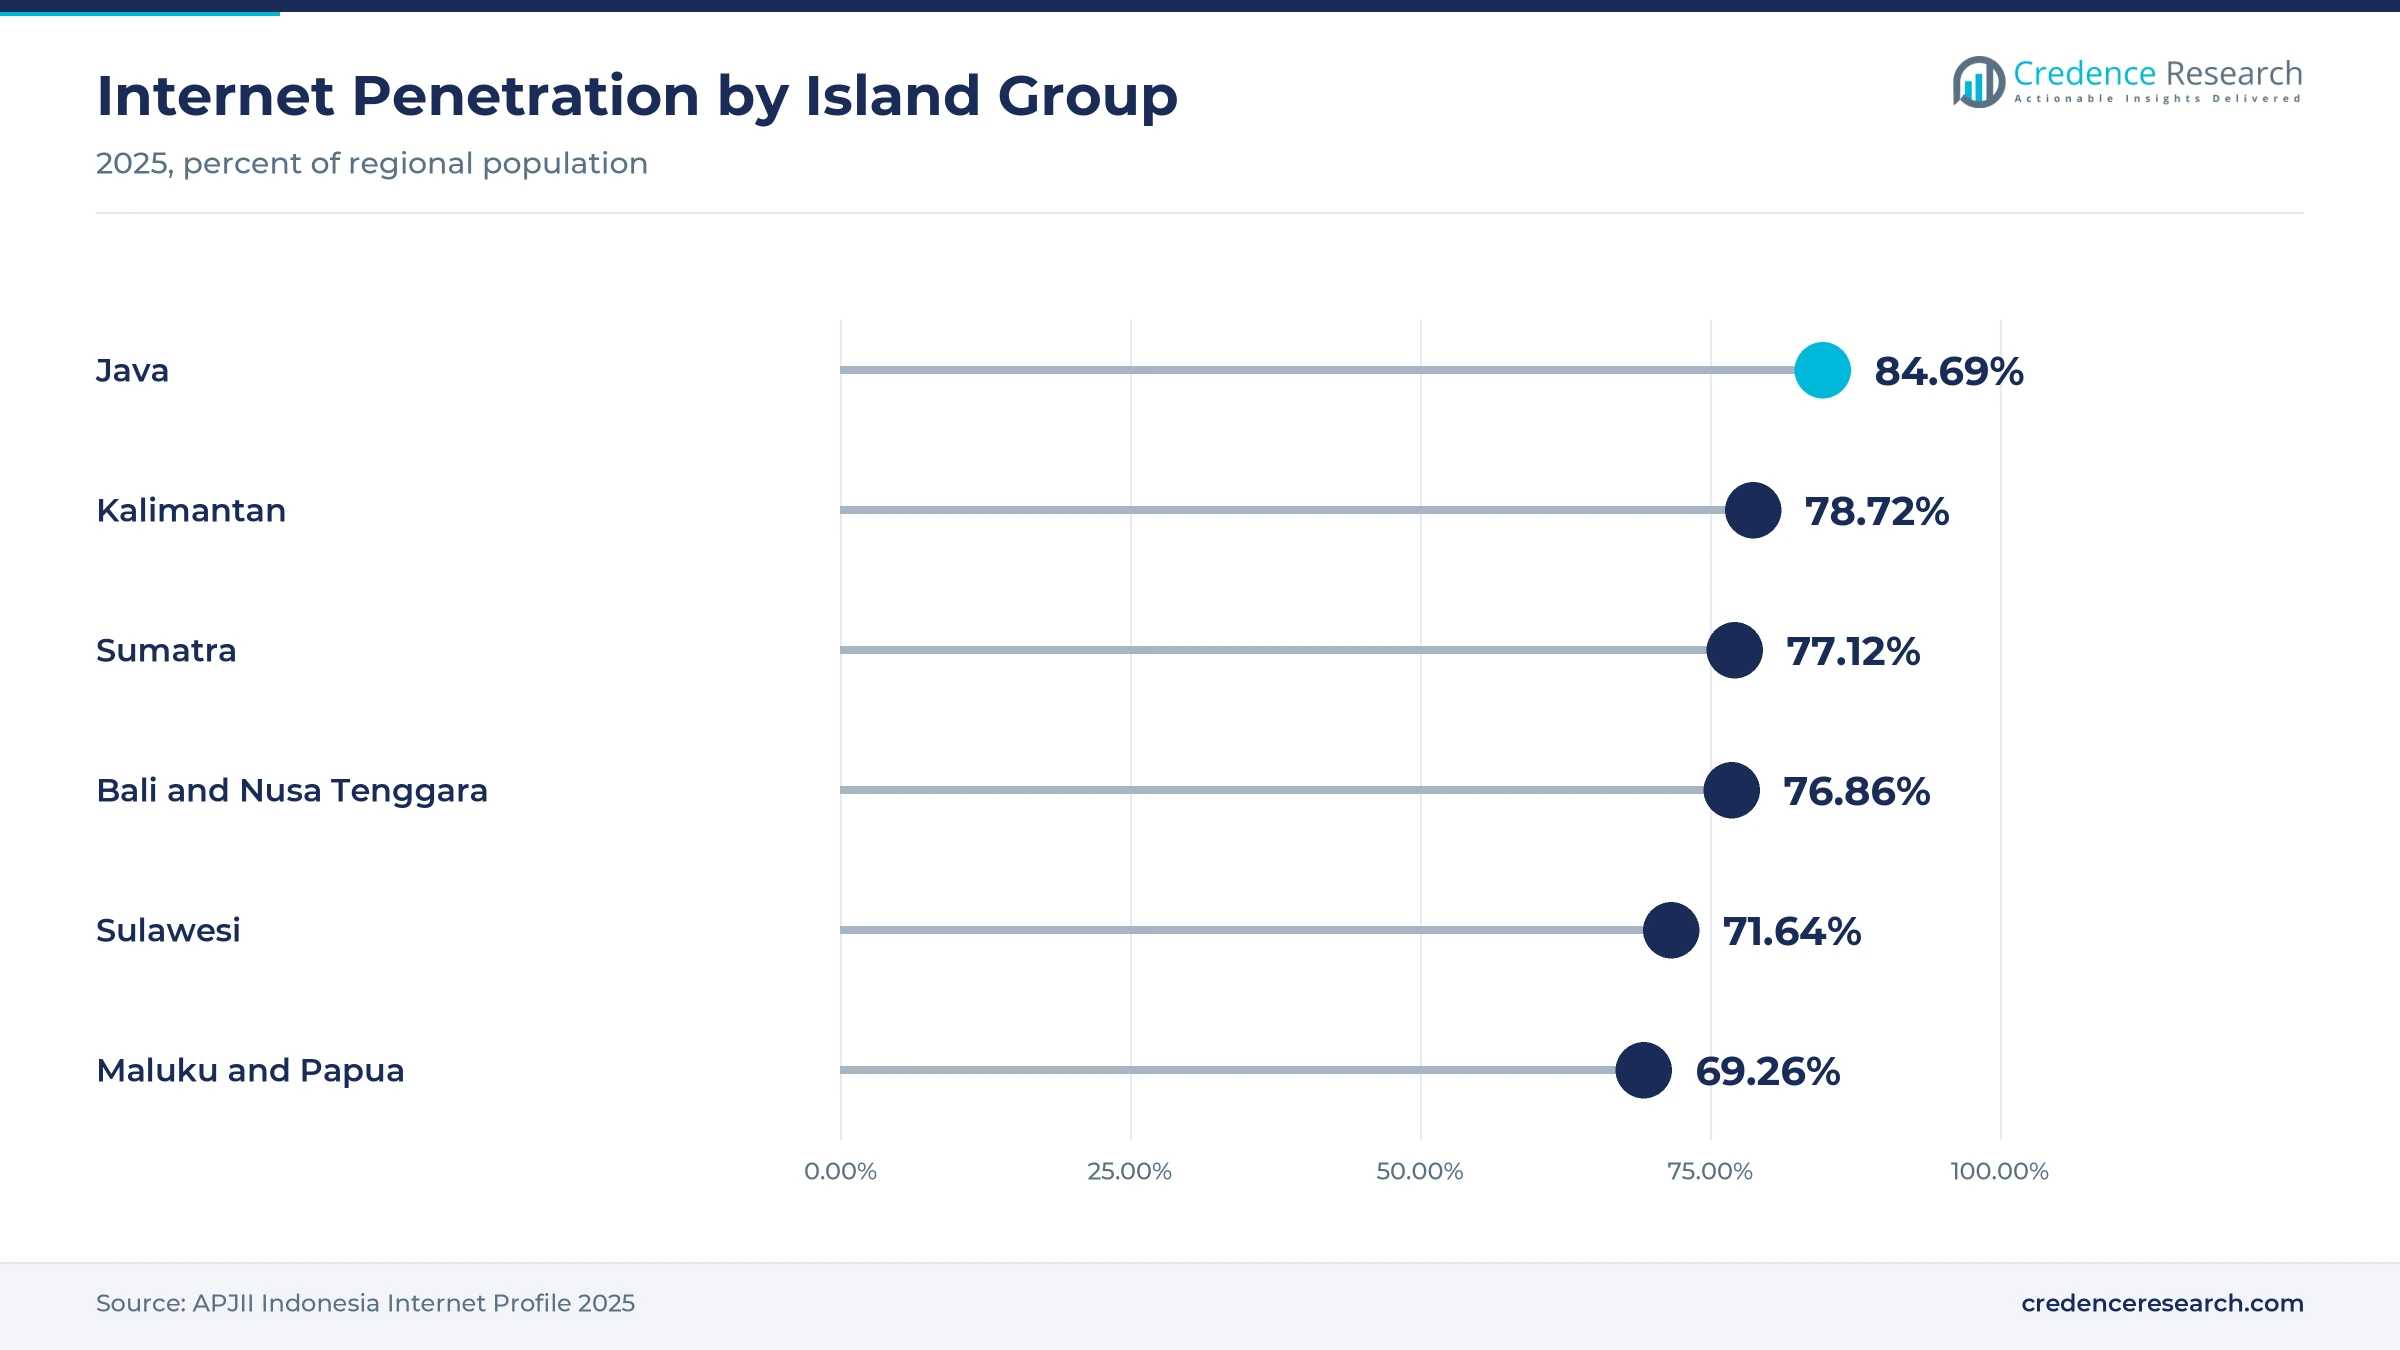
Online audiences outside Java offer a clear opening, because internet use is already high on the other islands while national campaigns still focus on Jakarta and Surabaya. Internet penetration reached 78.72% in Kalimantan, 77.12% in Sumatra and 76.86% in Bali and Nusa Tenggara in 2025. Sulawesi reached 71.64% and Maluku and Papua 69.26%, which leaves room for more users. Sumatra alone held 20.5% of all Indonesian internet users in that year. Regional banks, retailers and transport brands can therefore buy local targeting on social and video apps at low cost. Consequently, Kalimantan and Sulawesi become the fastest-growing region for advertising spending through 2035.
Can business messaging become a new ad channel?
Business messaging opens a second opportunity, because Indonesian buyers already ask brands questions inside chat apps before they buy. Meta said in August 2025 that 88% of people in Indonesia message businesses every week, citing its own research. The company added ads in the WhatsApp Updates tab, promoted channels and voice calls for businesses, with CIMB Niaga among the first adopters of calling. Meta is also testing a business AI tool that answers chats and recommends products, and plans to open it to Indonesian firms if tests succeed. Click-to-chat ads also support influencer marketing campaigns that send fans to a seller. In turn, performance-based buying grows faster than direct buying through 2035.
Child safety rules, tax duties and slow TV growth weigh
How do child online safety rules limit targeting?
Child online safety rules limit targeting, because platforms must restrict young users and the ads they see. Government Regulation 17 of 2025, known as PP Tunas, was set for full enforcement on March 28, 2026, according to Antara. Access to high-risk platforms is delayed until age 16, while lower-risk services open from age 13. As a result, snack, toy and game brands lose some reach among teenagers. Brands can respond with contextual placements, family content and stronger age checks with platforms.
Why do digital tax duties raise compliance work?
Digital tax duties raise compliance work, because foreign platforms that sell ads and services to Indonesians must collect value-added tax. The government had appointed 246 digital service companies as tax collectors by September 2025. These collectors had remitted Rp 32.94 trillion in value-added tax on digital trade by Sept. 30, 2025. Consequently, platforms pass some tax and compliance costs to advertisers through prices, which raises costs for small firms. Clear invoicing and local billing entities help brands track these costs.
How does fragmented measurement slow budget decisions?
Fragmented measurement slows budget decisions, because each platform reports results with its own tools and definitions. Brands that buy television, marketplace, social and video ads at once struggle to compare reach and sales across them. As a result, some advertisers hold back budget or keep money in familiar channels even when newer formats perform better. Tools for digital marketing analytics now help brands join these reports. Shared panels, clean data rooms and clear attribution rules help agencies and brands make faster decisions about where to spend each rupiah.
Why does slow growth in traditional media weigh on totals?
Slow growth in traditional media weighs on totals, because television still carries a large share of national budgets. Television spending was expected to grow only 3% to 5% in 2025, while print and radio budgets keep shrinking as readers and listeners move online. Broadcasters and publishers therefore face pressure on prices and staff. However, groups that bundle broadcast, streaming and social clips can keep advertisers, which softens the decline of older media formats.
Greater Jakarta leads while outer islands grow faster
| Region | Value, 2025 (USD billion) | Share, 2025 | CAGR, 2026–2035 |
|---|---|---|---|
| Greater Jakarta | 2.70 | 42.0% | 7.53% |
| Java Outside Greater Jakarta | 1.93 | 30.0% | 8.03% |
| Sumatra | 0.90 | 14.0% | 8.03% |
| Kalimantan and Sulawesi | 0.58 | 9.0% | 8.43% |
| Bali and Eastern Indonesia | 0.32 | 5.0% | 8.23% |
Why does Greater Jakarta lead advertising spending?
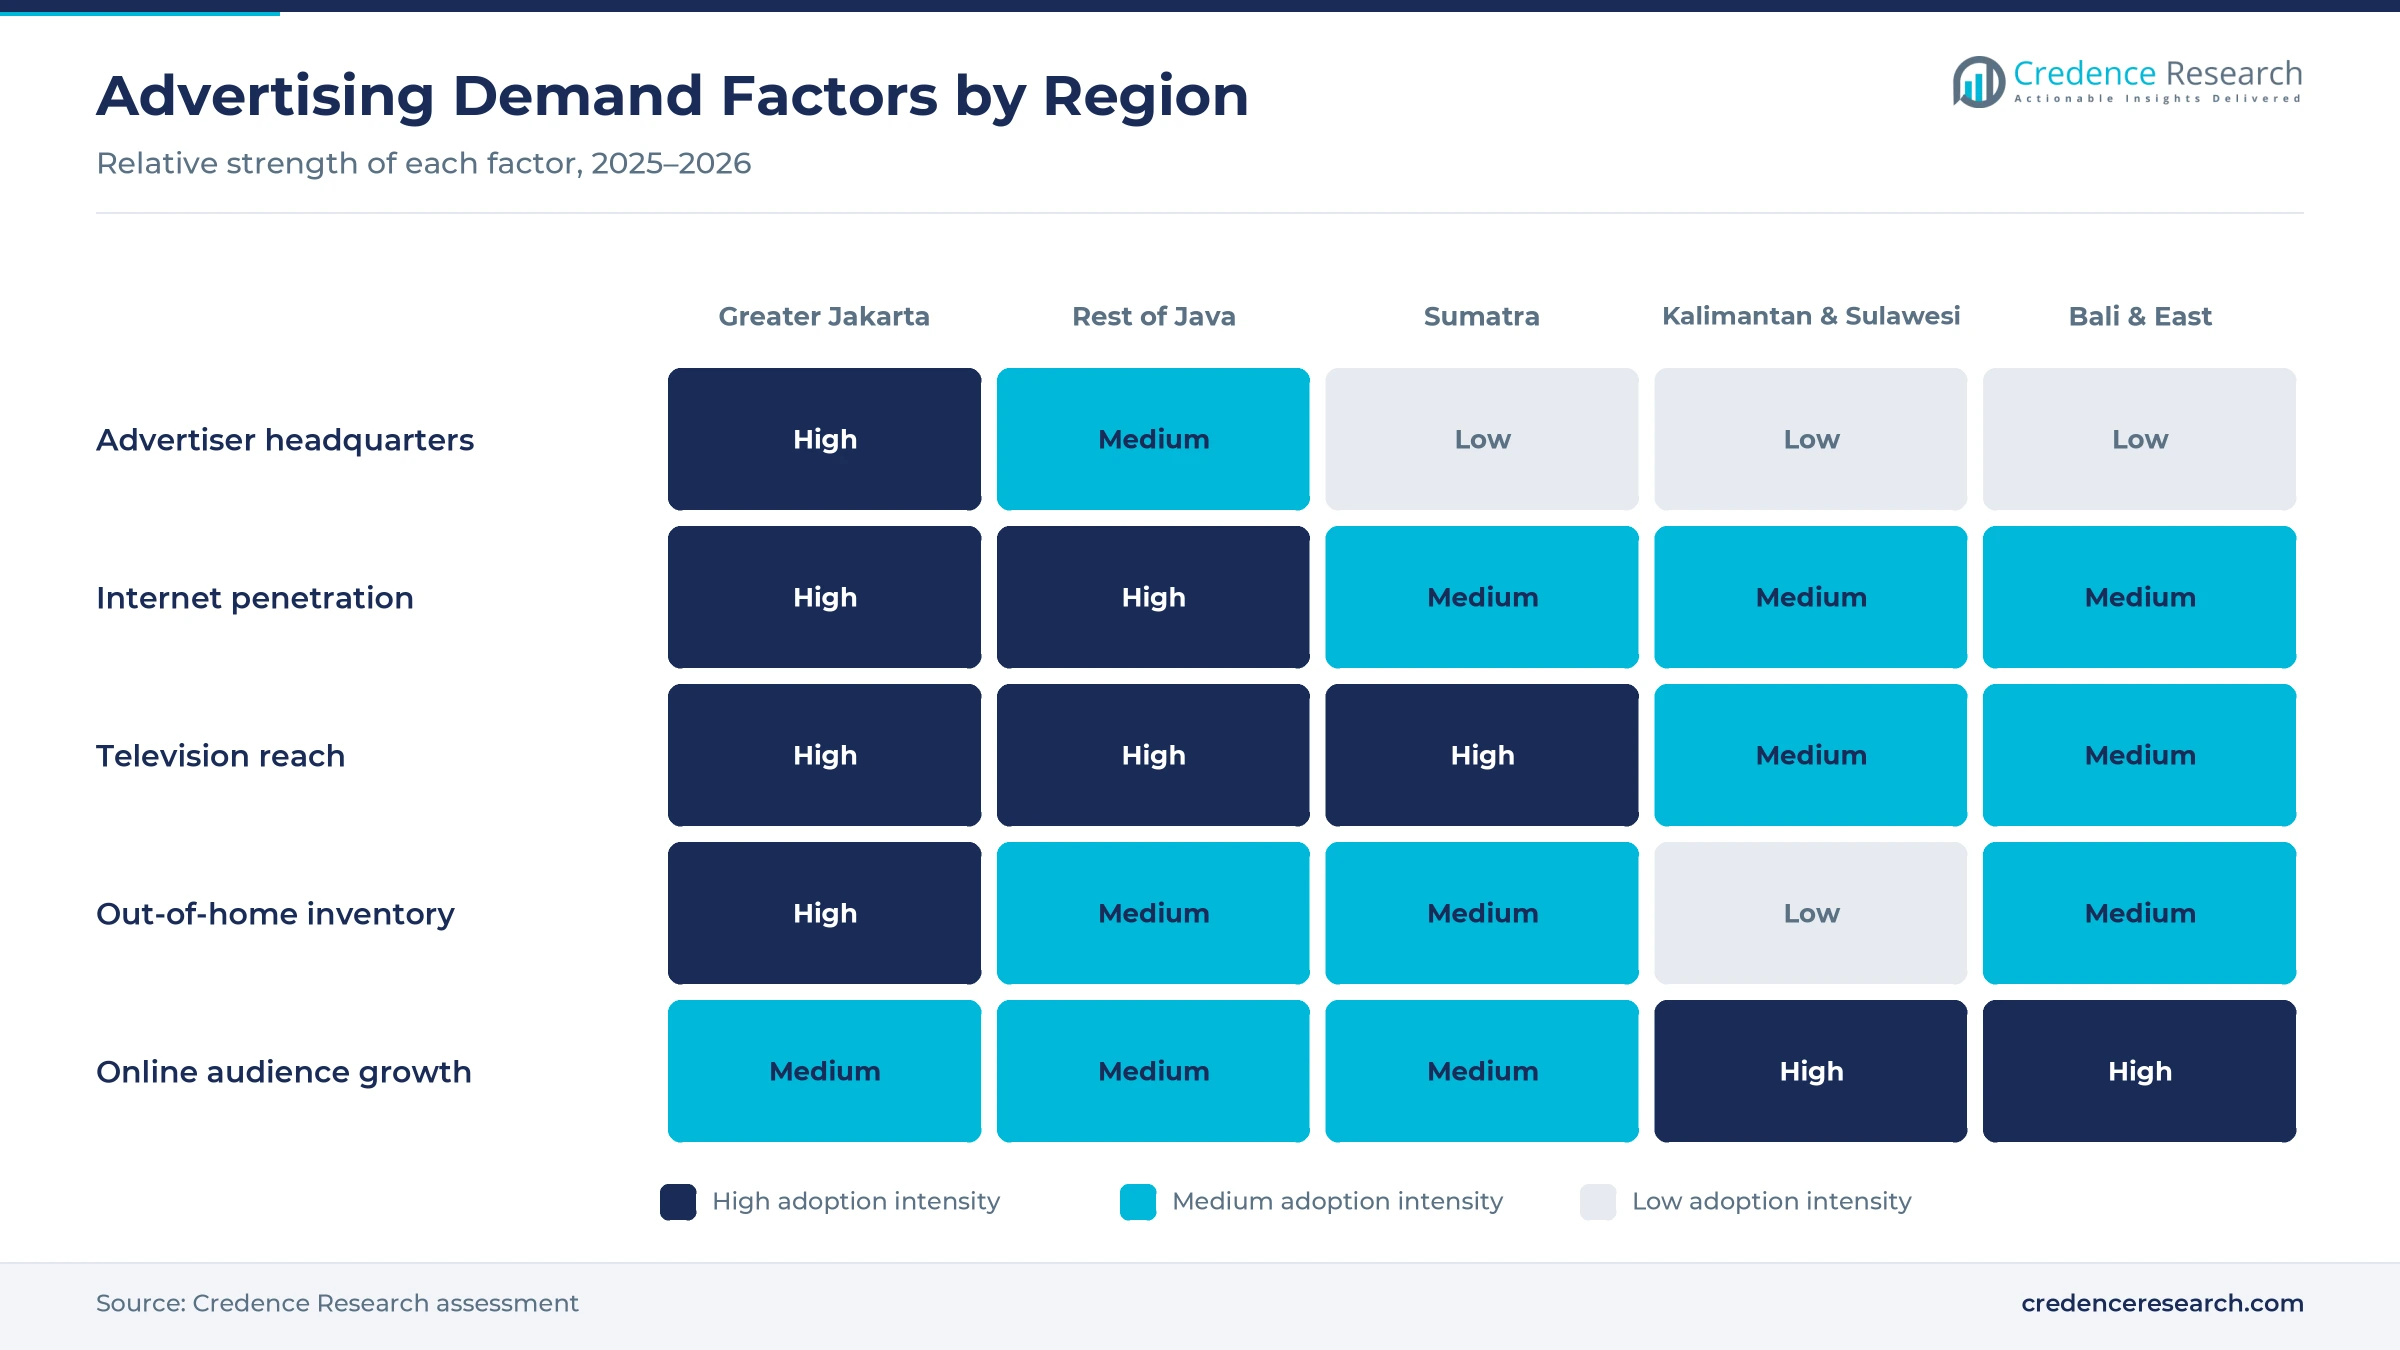
Greater Jakarta held 42.0% of 2025 value and grows at 7.53% a year, because the capital hosts most national advertisers, broadcasters, agencies and platform offices. Java produced 56.93% of national output in 2025, and Greater Jakarta is the largest commercial center on the island. Most national television and digital campaigns are planned and bought from the capital. The area also has the densest network of digital billboards, malls and transit screens, which supports out-of-home spending.
How does the rest of Java add volume?
Java outside Greater Jakarta held 30.0% of 2025 value and grows at 8.03% a year, because Surabaya, Bandung, Semarang and Yogyakarta host large consumer markets. Java accounted for 58% of all Indonesian internet users in 2025 and reached 84.69% penetration, the highest of any island group. Regional retailers, universities and property developers buy local social and video ads. Factories and e-commerce warehouses in these provinces also attract recruitment and delivery campaigns.
What shapes advertising demand in Sumatra?
Sumatra held 14.0% of 2025 value and grows at 8.03% a year, because Medan, Palembang and Pekanbaru support steady consumer and retail spending. The island held 20.5% of national internet users in 2025, with penetration of 77.12%. Regional banks, plantation companies and retail chains buy local radio, outdoor and social placements. National brands also run regional versions of television campaigns for Sumatran audiences.
Why do Kalimantan and Sulawesi grow fastest?
Kalimantan and Sulawesi held 9.0% of 2025 value and grow fastest at 8.43% a year, because rising incomes and phone use widen the online audience. Internet penetration reached 78.72% in Kalimantan and 71.64% in Sulawesi in 2025. Resource industries and trade support spending in cities such as Balikpapan and Makassar. Online ads reach towns with few billboards or local media outlets.
How do Bali and eastern Indonesia add tourism demand?
Bali and eastern Indonesia held 5.0% of 2025 value and grow at 8.23% a year, because tourism brands, hotels and airlines advertise to visitors. Internet penetration reached 76.86% in Bali and Nusa Tenggara and 69.26% in Maluku and Papua in 2025. Travel and food brands buy social and search ads aimed at tourists before and during their trips.
Platform deals, agency mergers and new rules
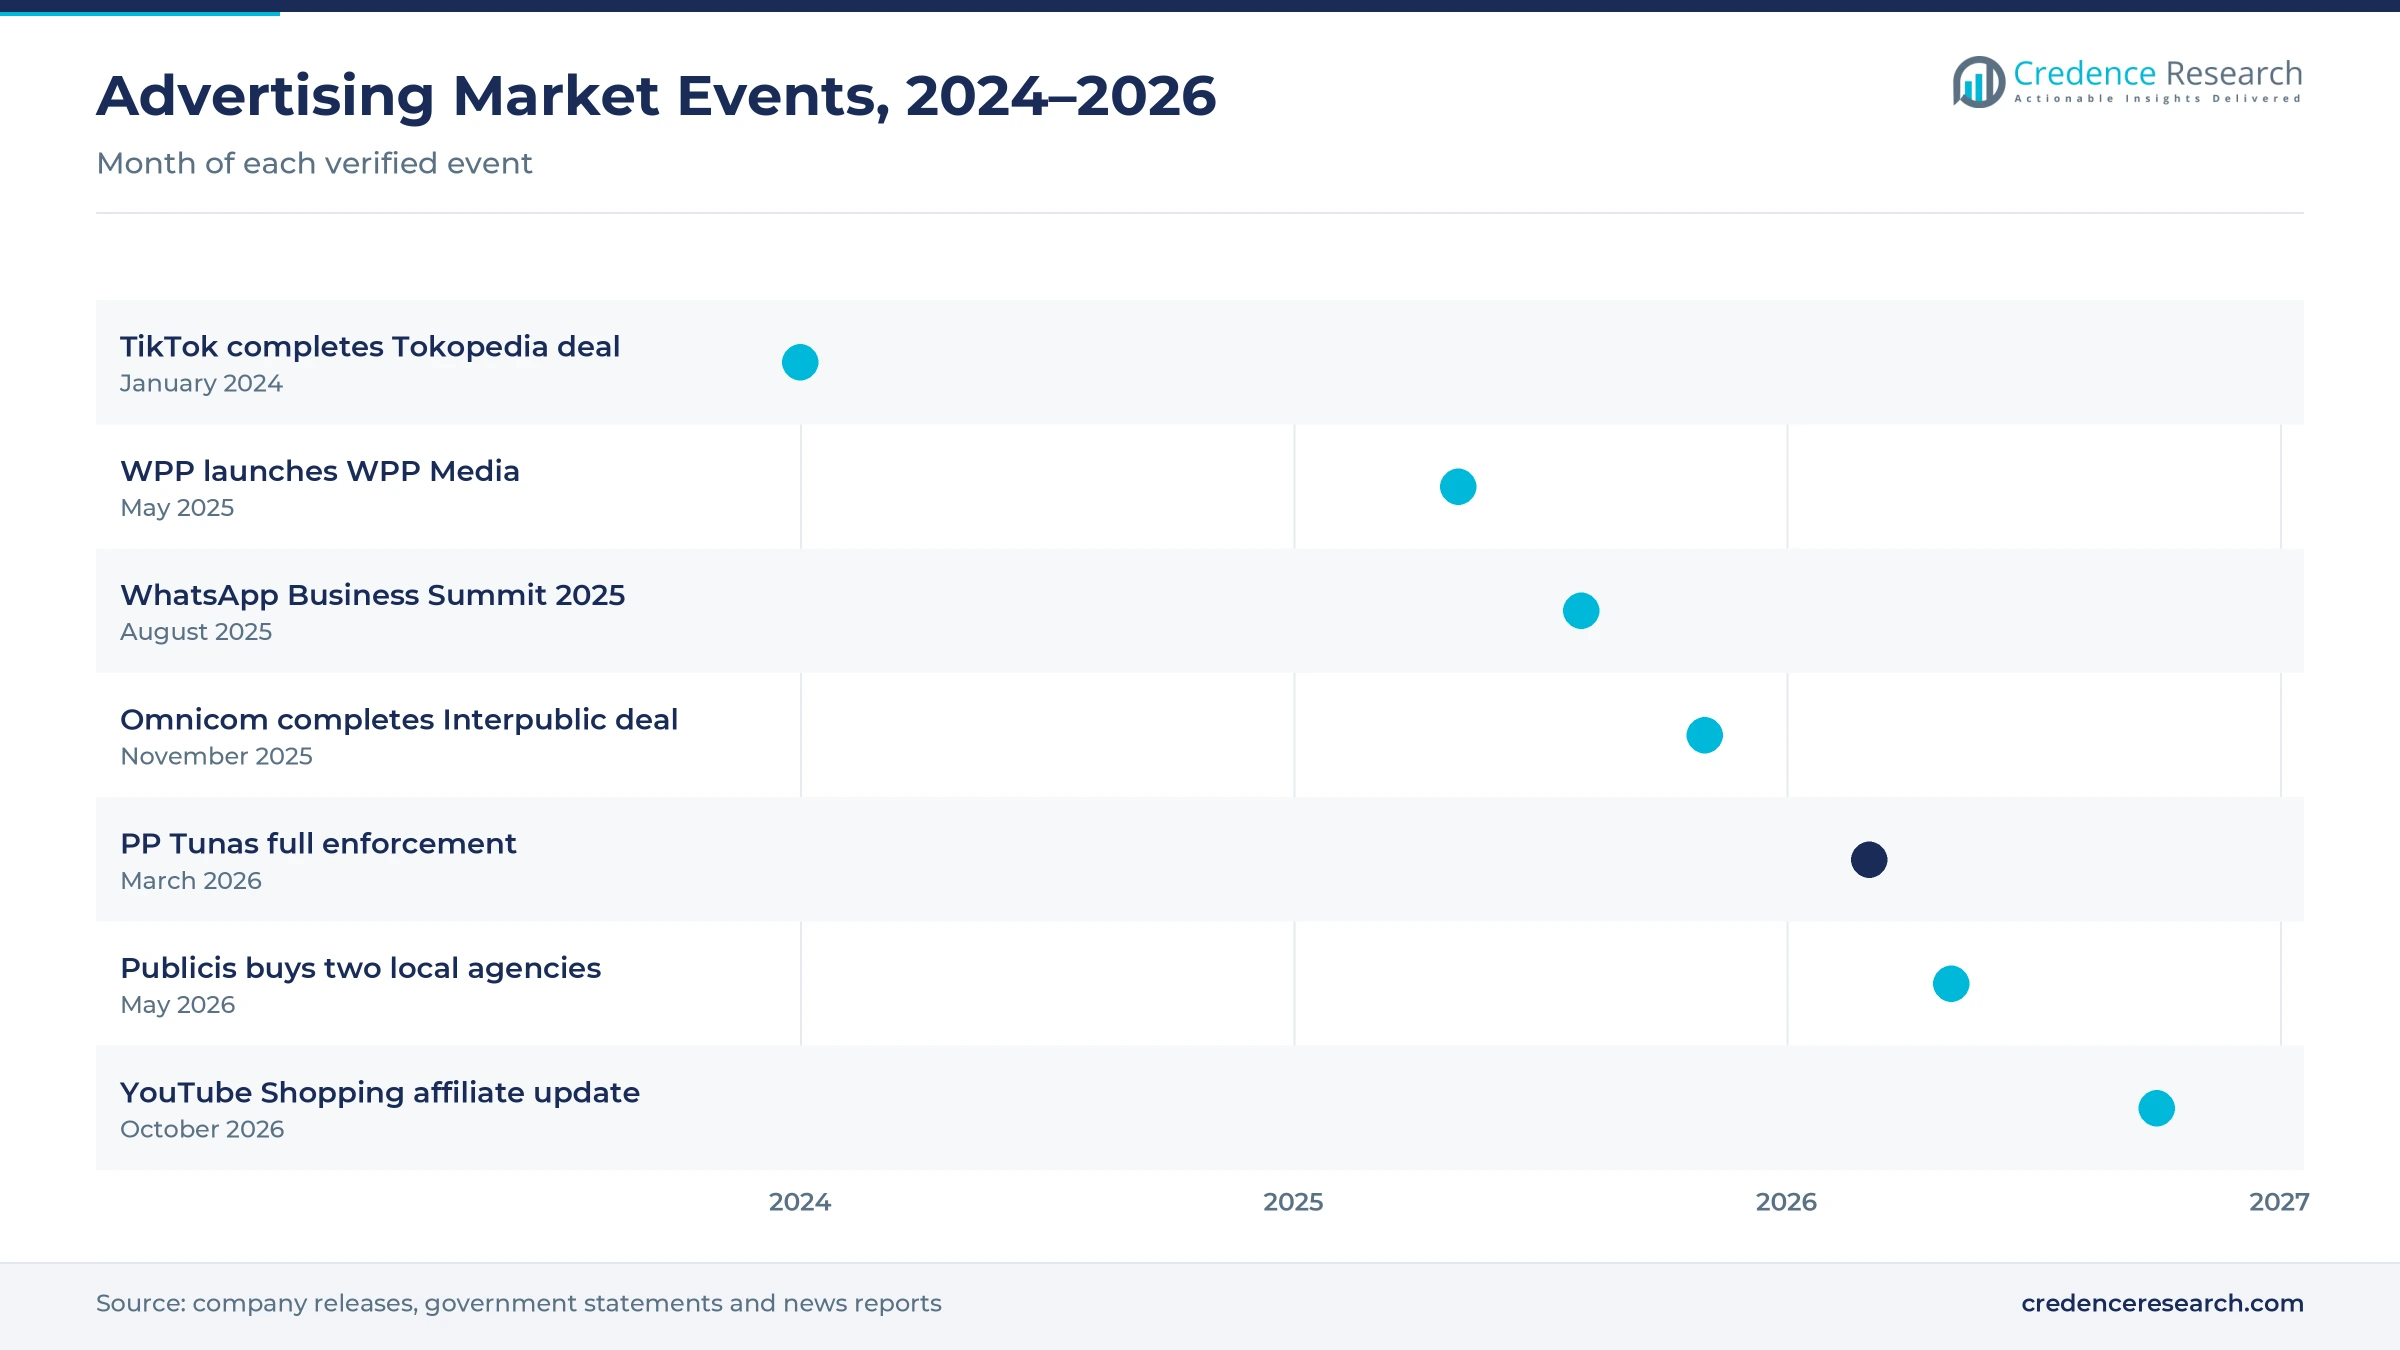
| Development | Status and market relevance |
|---|---|
| In January 2024, TikTok completed its purchase of 75.01% of Tokopedia, joining short video with a major marketplace. | Creates a large shoppable video channel |
| In May 2025, WPP retired the GroupM name and launched WPP Media as its global media arm. | Reshapes agency media buying around one AI platform |
| In November 2025, Omnicom completed its acquisition of Interpublic after receiving regulatory approvals. | Combines two large agency networks under one group |
| In March 2026, PP Tunas was set for full enforcement, delaying access to high-risk platforms until age 16. | Limits targeting of younger users |
| In May 2026, Publicis Groupe Indonesia agreed to acquire Inter Pariwara Global and iLab Indonesia for Spark Foundry Indonesia. | Expands local media buying capacity |
AI buying, shoppable video and messaging ads change delivery
- AI campaign tools such as Advantage+ shift budgets across WhatsApp, Facebook and Instagram placements, which cuts manual planning work for brands.
- Shoppable video on YouTube and TikTok links ads to checkout pages on Shopee, Lazada and Tokopedia, which lets brands measure sales directly.
- Messaging ads in the WhatsApp Updates tab and click-to-chat formats send buyers into conversations with sellers before they buy.
- Data platforms used for social media analytics help agencies compare reach and sentiment across apps and channels.
Need a Custom Version of This Report?
Tailor the scope, geography, or segments to your exact requirements.
- Custom geography or segment scope
- Direct access to our analyst team
Global platforms, TV groups and agency networks compete
Competition is spread across global platforms, local television groups and agency networks. Google, Meta and ByteDance compete for digital budgets through search, social, video and shoppable formats, and each now links ads to marketplaces or chat. Emtek runs SCTV, Indosiar and the Vidio streaming service, while MNC Media runs RCTI, MNCTV and GTV, so both groups sell broadcast and online video together. Dentsu Indonesia, Publicis Groupe Indonesia and Hakuhodo International Indonesia compete for planning and buying mandates, and Publicis added two local agencies in 2026. WPP Media and Omnicom bring global data platforms after their 2025 restructurings. Companies compete on audience reach, data quality, measurement, creative speed, price per result and links to commerce. Smaller performance agencies and creator networks also win budgets from digital-native brands that want fast tests and low fees.
Companies profiled and their roles in this market
| Company | Type | Role in the market |
|---|---|---|
| Google Indonesia | Search and video platform | YouTube Shopping affiliate program works with Shopee, Lazada, Blibli and Zalora |
| Meta Platforms | Social and messaging platform | Added WhatsApp Status ads and unified Ads Manager for Indonesian advertisers in 2025 |
| ByteDance | Short video and commerce platform | TikTok took a 75.01% stake in Tokopedia in January 2024 |
| Emtek | Television and streaming group | SCTV and Indosiar led viewership in the first quarter of 2025; runs Vidio |
| MNC Media | Television group | RCTI had a 15.2% primetime audience share in 2024 |
| Dentsu Indonesia | Agency network | Forecast 5.1% ad spend growth for Indonesia in 2025 |
| Publicis Groupe Indonesia | Agency network | Agreed to buy Inter Pariwara Global and iLab Indonesia in May 2026 |
| Hakuhodo International Indonesia | Agency network | Named new leaders across its units in 2025 |
Credence Research view on fast digital ad growth
Credence Research's view is that Indonesian advertising will grow quickly through 2035, because a large mobile audience and commerce-linked formats let brands tie spending to sales. Digital channels already hold 58.0% of 2025 value, and retail media buying grows fastest. Agency mergers and AI tools should lower the cost of planning and buying. However, child safety rules, tax duties and fragmented measurement could slow some budgets. Greater Jakarta keeps the largest share, while Kalimantan, Sulawesi and the eastern islands grow faster as phone use spreads.
How the ad spending estimate was built
The report uses 2025 as the base year, with values in USD million at current prices. Market values come from the Credence Research model, which combines media spending by channel, advertiser activity and audience reach. Regional shares are Credence Research estimates based on internet-user and output shares by island group, and segment splits by channel, format, industry and buying model are also Credence Research estimates. Sources used are government statistics, regulator statements, World Bank data, industry association surveys, company announcements and news reports, and no interviews or surveys were used.
Commerce media and outer-island reach set the path to 2035
The market is expected to reach USD 13.84 billion by 2035, a 7.87% CAGR during 2026–2035, as mobile reach, shoppable media and steady economic growth lift advertising budgets. Growth should be strongest in retail media buying, video formats and in Kalimantan and Sulawesi, while Greater Jakarta keeps the largest share. Agencies that combine data, creative and commerce media should win mandates from large brands. In contrast, tighter child safety rules or a sharp slowdown in household spending would cut growth for some advertisers.
Frequently Asked Questions
How big is the Indonesia advertising market?
Which region leads advertising spending in Indonesia?
Which region grows fastest?
Which media channel holds the largest share?
Which buying model grows fastest?
How many internet users does Indonesia have?
Who are the leading companies in Indonesian advertising?
What are the main risks to growth?
Table of Content
Chapter 1 Market Segmentation
- 1.1 Segmentation Framework
- 1.1.1 Product and Service Classification
- 1.1.2 Application and End-Use Classification
- 1.1.3 Technology and Solution Classification
- 1.1.4 Customer and Distribution Channel Classification
- 1.1.5 Geographic Segmentation
- 1.1.6 Market Segment Definitions and Boundaries
- 1.2 By Media Channel
- 1.2.1 Digital
- 1.2.2 Television
- 1.2.3 Out-of-Home
- 1.2.4 Print
- 1.2.5 Radio and Cinema
- 1.3 By Advertising Format
- 1.3.1 Social Media Advertising
- 1.3.2 Video Advertising
- 1.3.3 Search Advertising
- 1.3.4 Display and Native Advertising
- 1.3.5 Audio and Experiential Advertising
- 1.4 By End-Use Industry
- 1.4.1 Consumer Goods and Retail
- 1.4.2 Travel, Media and Entertainment
- 1.4.3 Telecommunications and Technology
- 1.4.4 Financial Services
- 1.4.5 Automotive and Mobility
- 1.5 By Buying Model
- 1.5.1 Agency-Mediated Buying
- 1.5.2 Programmatic Auctions
- 1.5.3 Direct Media Buying
- 1.5.4 Performance-Based Buying
- 1.5.5 Retail Media Buying
Chapter 2 Introduction
- 2.1 Report Objectives and Scope
- 2.2 Product Definition and Industry Terminology
- 2.3 Market Inclusions and Exclusions
- 2.4 Research Process
- 2.4.1 Primary Research and Expert Interviews
- 2.4.2 Secondary Research and Source Review
- 2.4.3 Top-Down and Bottom-Up Estimation
- 2.4.4 Data Triangulation and Verification
- 2.5 Market Size Measurement Basis
- 2.5.1 2025: USD 6.44 billion → 2035: USD 13.84 billion
- 2.6 Historical and Forecast Reference Periods
- 2.6.1 Historical Period: 2018-2025
- 2.6.2 Base Year: 2025
- 2.6.3 Forecast Period: 2025-2035
- 2.7 Research Assumptions and Limitations
Chapter 3 Executive Summary
- 3.1 Market Snapshot and Key Findings
- 3.2 Base-Year Market Size, 2025
- 3.3 Forecast Market Size, 2035
- 3.4 Revenue and Volume Growth Outlook
- 3.5 Key Demand and Supply Indicators
- 3.6 Leading Market Segments
- 3.7 Fastest-Growing Market Opportunities
- 3.8 Regional Performance Highlights
- 3.9 Technology and Industry Transformation
- 3.10 Competitive Landscape Summary
- 3.11 Analyst View and Strategic Implications
Chapter 4 Indonesia Advertising Market Trends and Developments
- 4.1 Historical Industry Development, 2018-2025
- 4.2 Recent Market Trends and Developments
- 4.3 Demand and Customer Behavior Trends
- 4.4 Technology and Product Innovation
- 4.5 Artificial Intelligence, Automation and Digitalization
- 4.6 Local Manufacturing and Supply Chain Realignment
- 4.7 Industry Partnerships, Mergers and Acquisitions
- 4.8 Sustainability and Circular Economy Developments
- 4.9 Government and Private Sector Investment Trends
- 4.10 Emerging Business Models and Commercialization
- 4.11 Industry Developments and Announcements
Chapter 5 Indonesia Advertising Market Production, Supply and Demand Analysis
- 5.1 Demand Trend and Consumption Analysis, 2018-2025
- 5.2 Demand Forecast, 2025-2035
- 5.3 Production and Output Trend, 2018-2025
- 5.4 Production and Output Forecast, 2025-2035
- 5.5 Installed Capacity and Capacity Utilization
- 5.6 Company-Wise Production Plants and Statistics
- 5.6.1 Installed Production Capacity
- 5.6.2 Actual Production
- 5.6.3 Planned Capacity and Expansion Targets
- 5.7 Supply Chain Structure and Procurement Trends
- 5.8 Supply-Demand Gap and Bottlenecks
- 5.9 Import Dependence and Sourcing Structure
- 5.10 Contract Manufacturing and Outsourcing
- 5.11 Regional Supply and Demand Concentration
Chapter 6 Indonesia Advertising Market Pricing Analysis
- 6.1 Pricing Structure and Measurement
- 6.2 Historical Pricing Trends, 2018-2025
- 6.3 Pricing Outlook, 2025-2035
- 6.4 Average Selling Price and Unit Economics
- 6.5 Pricing by Product and Market Segment
- 6.6 Geographic Pricing Differences
- 6.7 Key Input, Energy, Labor and Logistics Costs
- 6.8 Contract Pricing and Purchasing Models
- 6.9 Pricing Sensitivity and Competitive Positioning
- 6.10 Price, Margin and Profitability Implications
Chapter 7 Indonesia Advertising Market Dynamics
- 7.1 Market Growth Drivers
- 7.1.1 Demand-Side Drivers
- 7.1.2 Technology and Innovation Drivers
- 7.1.3 Infrastructure and Investment Drivers
- 7.1.4 Regulatory and Policy Drivers
- 7.2 Market Restraints
- 7.2.1 Cost and Affordability Constraints
- 7.2.2 Technology and Adoption Barriers
- 7.2.3 Supply Chain and Operational Constraints
- 7.3 Market Challenges
- 7.3.1 Competitive Pressure and Margin Erosion
- 7.3.2 Skills, Infrastructure and Implementation Gaps
- 7.4 Emerging Market Opportunities
- 7.5 Market Dynamics Impact and Time-Horizon Assessment
Chapter 8 Indonesia Advertising Value Chain Analysis
- 8.1 Industry Value Chain Overview
- 8.2 Upstream Suppliers and Critical Inputs
- 8.3 Technology and Component Providers
- 8.4 Manufacturing or Service Delivery
- 8.5 Distribution, Channel Partners and Integrators
- 8.6 Downstream Applications and End Users
- 8.7 Value Addition and Profit Pools
- 8.8 Vertical Integration and Outsourcing
- 8.9 Supplier Concentration and Risk
- 8.10 Supply Chain Localization and Resilience
Chapter 9 Indonesia Advertising Market Regulations and Policies
- 9.1 Relevant Laws, Standards and Compliance Frameworks
- 9.2 Product, Service, Safety and Quality Requirements
- 9.3 Government Policies, Incentives and Subsidies
- 9.4 Imports, Exports and Trade Barriers
- 9.5 Public Procurement and Local Content Requirements
- 9.6 Environmental and Sustainability Compliance
- 9.7 Data Protection, AI and Cybersecurity Compliance
- 9.8 Upcoming Policy Changes and Market Implications
Chapter 10 Indonesia Advertising Market Hotspots and Opportunities
- 10.1 Market Opportunity Mapping and Growth Hotspots
- 10.2 High-Growth Applications and Customer Groups
- 10.3 Underserved Markets and White-Space Opportunities
- 10.4 Emerging Technology and Product Opportunities
- 10.5 New Capacity and Investment Hotspots
- 10.6 Market Entry and Expansion Opportunities
- 10.7 Distribution and Partnership Opportunities
- 10.8 Near-Term and Long-Term Commercial Potential
- 10.9 Opportunity Attractiveness and Execution Risks
Chapter 11 Indonesia Advertising Market Outlook, 2025-2035
- 11.1 Market Size and Analysis
- 11.1.1 Revenue (Market Measurement: 2025: USD 6.44 billion → 2035: USD 13.84 billion)
- 11.1.2 Market Volume and Quantity Sold
- 11.1.3 Historical Market Size, 2018-2025
- 11.1.4 Base-Year Market Size, 2025
- 11.2 Market Forecast, 2025-2035
- 11.2.1 Revenue Forecast to 2035
- 11.2.2 Volume Forecast to 2035
- 11.2.3 CAGR and Year-on-Year Growth
- 11.2.4 Incremental Revenue Opportunity
- 11.3 Forecast Assumptions and Scenario Analysis
- 11.3.1 Base-Case Forecast
- 11.3.2 Optimistic and Conservative Scenarios
- 11.3.3 Technology, Pricing and Policy Sensitivities
- 11.4 Market Attractiveness and Growth Outlook
Chapter 12 Indonesia Advertising Market Segmentation and Outlook
- 12.1 Segmentation Summary and Market Shares, 2025
- 12.2 Largest and Fastest-Growing Segments
- 12.3 By Media Channel - Market Size and Forecast, 2025-2035
- 12.3.1 Segment Definition and Scope
- 12.3.2 Historical Market Size, 2018-2025
- 12.3.3 Revenue Forecast, 2025-2035
- 12.3.4 Volume Forecast, 2025-2035
- 12.3.5 Base-Year Market Share, 2025
- 12.3.6 Segment CAGR and Growth Drivers
- 12.3.7 Subsegment Market Size and Forecast
- 12.3.7.1 Digital
- 12.3.7.2 Television
- 12.3.7.3 Out-of-Home
- 12.3.7.4 Print
- 12.3.7.5 Radio and Cinema
- 12.3.8 Subsegment Pricing and Adoption Trends
- 12.3.9 Leading Suppliers and Competition
- 12.3.10 Regional Demand and Opportunities
- 12.4 By Advertising Format - Market Size and Forecast, 2025-2035
- 12.4.1 Segment Definition and Scope
- 12.4.2 Historical Market Size, 2018-2025
- 12.4.3 Revenue Forecast, 2025-2035
- 12.4.4 Volume Forecast, 2025-2035
- 12.4.5 Base-Year Market Share, 2025
- 12.4.6 Segment CAGR and Growth Drivers
- 12.4.7 Subsegment Market Size and Forecast
- 12.4.7.1 Social Media Advertising
- 12.4.7.2 Video Advertising
- 12.4.7.3 Search Advertising
- 12.4.7.4 Display and Native Advertising
- 12.4.7.5 Audio and Experiential Advertising
- 12.4.8 Subsegment Pricing and Adoption Trends
- 12.4.9 Leading Suppliers and Competition
- 12.4.10 Regional Demand and Opportunities
- 12.5 By End-Use Industry - Market Size and Forecast, 2025-2035
- 12.5.1 Segment Definition and Scope
- 12.5.2 Historical Market Size, 2018-2025
- 12.5.3 Revenue Forecast, 2025-2035
- 12.5.4 Volume Forecast, 2025-2035
- 12.5.5 Base-Year Market Share, 2025
- 12.5.6 Segment CAGR and Growth Drivers
- 12.5.7 Subsegment Market Size and Forecast
- 12.5.7.1 Consumer Goods and Retail
- 12.5.7.2 Travel, Media and Entertainment
- 12.5.7.3 Telecommunications and Technology
- 12.5.7.4 Financial Services
- 12.5.7.5 Automotive and Mobility
- 12.5.8 Subsegment Pricing and Adoption Trends
- 12.5.9 Leading Suppliers and Competition
- 12.5.10 Regional Demand and Opportunities
- 12.6 By Buying Model - Market Size and Forecast, 2025-2035
- 12.6.1 Segment Definition and Scope
- 12.6.2 Historical Market Size, 2018-2025
- 12.6.3 Revenue Forecast, 2025-2035
- 12.6.4 Volume Forecast, 2025-2035
- 12.6.5 Base-Year Market Share, 2025
- 12.6.6 Segment CAGR and Growth Drivers
- 12.6.7 Subsegment Market Size and Forecast
- 12.6.7.1 Agency-Mediated Buying
- 12.6.7.2 Programmatic Auctions
- 12.6.7.3 Direct Media Buying
- 12.6.7.4 Performance-Based Buying
- 12.6.7.5 Retail Media Buying
- 12.6.8 Subsegment Pricing and Adoption Trends
- 12.6.9 Leading Suppliers and Competition
- 12.6.10 Regional Demand and Opportunities
- 12.7 Segment Growth Comparison
- 12.8 Segment Attractiveness and Priority Matrix
Chapter 13 Indonesia Advertising End-Use and Application Market Outlook
- 13.1 End-Use Industry and Customer Demand Structure
- 13.2 Leading Applications and Customer Groups
- 13.3 End-Use Market Size, Share and Forecast
- 13.4 Major End-Use Industry Deep Dives
- 13.4.1 Customer Requirements and Use Cases
- 13.4.2 Demand and Replacement Cycles
- 13.4.3 Technical and Regulatory Considerations
- 13.4.4 Purchasing and Procurement Models
- 13.4.5 Leading Vendors and Distribution Channels
- 13.4.6 Forecast and Commercial Opportunities
- 13.5 Emerging Applications and Cross-Segment Demand
- 13.6 End-Use Industry Investment Priorities
Chapter 14 Indonesia Advertising Geographic Market Outlook, 2025-2035
- 14.1 Regional Market Size and Country-Level Shares, 2025
- 14.2 Country Market Size Comparison, 2025
- 14.3 Country Market Forecasts, 2025-2035
- 14.4 Subregional Industrial and Demand Clusters
- 14.5 Intra-Regional Pricing and Cost Differences
- 14.6 Cross-Border Trade and Supply Networks
- 14.7 Regional Supply and Demand Balances
- 14.8 Country Opportunity Comparison and Prioritization
Note: Every listed country is covered on the structure shown under the first country.
Chapter 15 Indonesia Advertising Technology, Innovation and Sustainability Outlook
- 15.1 Technology Landscape and Maturity
- 15.2 Product, Process and Service Innovation
- 15.3 AI, Automation and Digital Tools in the Industry
- 15.4 Technology Adoption and Performance Benchmarking
- 15.5 Innovation Pipeline and R&D Investment
- 15.6 Patent and Intellectual Property Trends
- 15.7 Energy Efficiency and Resource Management
- 15.8 Sustainability, Recycling and Circularity
- 15.9 Technology Roadmap, 2025-2035
- 15.10 Risks of Obsolescence and Technology Substitution
Chapter 16 Indonesia Advertising Market Key Strategic Imperatives
- 16.1 Growth and Market Entry Priorities
- 16.2 High-Return Products and Segments
- 16.3 Pricing, Profitability and Cost Optimization
- 16.4 Technology Investment and Product Differentiation
- 16.5 Supply Chain Localization and Resilience
- 16.6 Distribution and Customer Acquisition
- 16.7 Partnership, Acquisition and Capacity Strategy
- 16.8 Regional Expansion Priorities
- 16.9 Short-, Medium- and Long-Term Actions
Chapter 17 Competition Outlook
- 17.1 Industry Competition Characteristics
- 17.2 Market Structure and Concentration
- 17.3 Market Share and Competitive Positioning, 2025
- 17.4 Company-Wise Revenue and Product Benchmarking
- 17.5 Production and Service Capacity Benchmarking
- 17.6 Technology, Pricing and Differentiation
- 17.7 Regional Footprint and Distribution Strength
- 17.8 Mergers, Acquisitions and Strategic Alliances
- 17.9 New Entrants and Competitive Threats
- 17.10 Porter's Five Forces and Industry Attractiveness
- 17.11 Competitive Outlook, 2025-2035
Chapter 18 Company Profiles
- 18.1 Company Coverage and Selection Criteria
- 18.2 Google Indonesia
- 18.2.1 Business Description
- 18.2.2 Company Ownership and Geographic Presence
- 18.2.3 Product and Service Portfolio
- 18.2.4 Manufacturing and Operating Footprint
- 18.2.5 Production Capacity and Expansion Plans
- 18.2.6 Financial Performance and Investment
- 18.2.7 Market Share and Competitive Position
- 18.2.8 Technology and Innovation Capabilities
- 18.2.9 Strategic Alliances or Partnerships
- 18.2.10 Recent Developments
- 18.2.11 Growth Strategy and Outlook
- 18.3 Meta Platforms
- 18.4 ByteDance
- 18.5 MNC Media
- 18.6 Emtek
- 18.7 WPP Media Indonesia
- 18.8 Dentsu Indonesia
- 18.9 Publicis Groupe Indonesia
- 18.10 Omnicom Media Group Indonesia
- 18.11 Hakuhodo International Indonesia
- 18.12 Other Relevant Market Participants
Note: Every listed company is profiled on the structure shown under the first company. The company list is preliminary and may change based on research findings, market developments, data availability and client requirements.
Chapter 19 Disclaimer
- 19.1 Research and Forecast Disclaimer
- 19.2 Data Source and Estimation Limitations
Note: The depth of individual sections depends on data availability for this market. Volume, capacity, trade and other unit-based metrics are included where applicable.

