
Feeds, creators and video turn browsing into buying
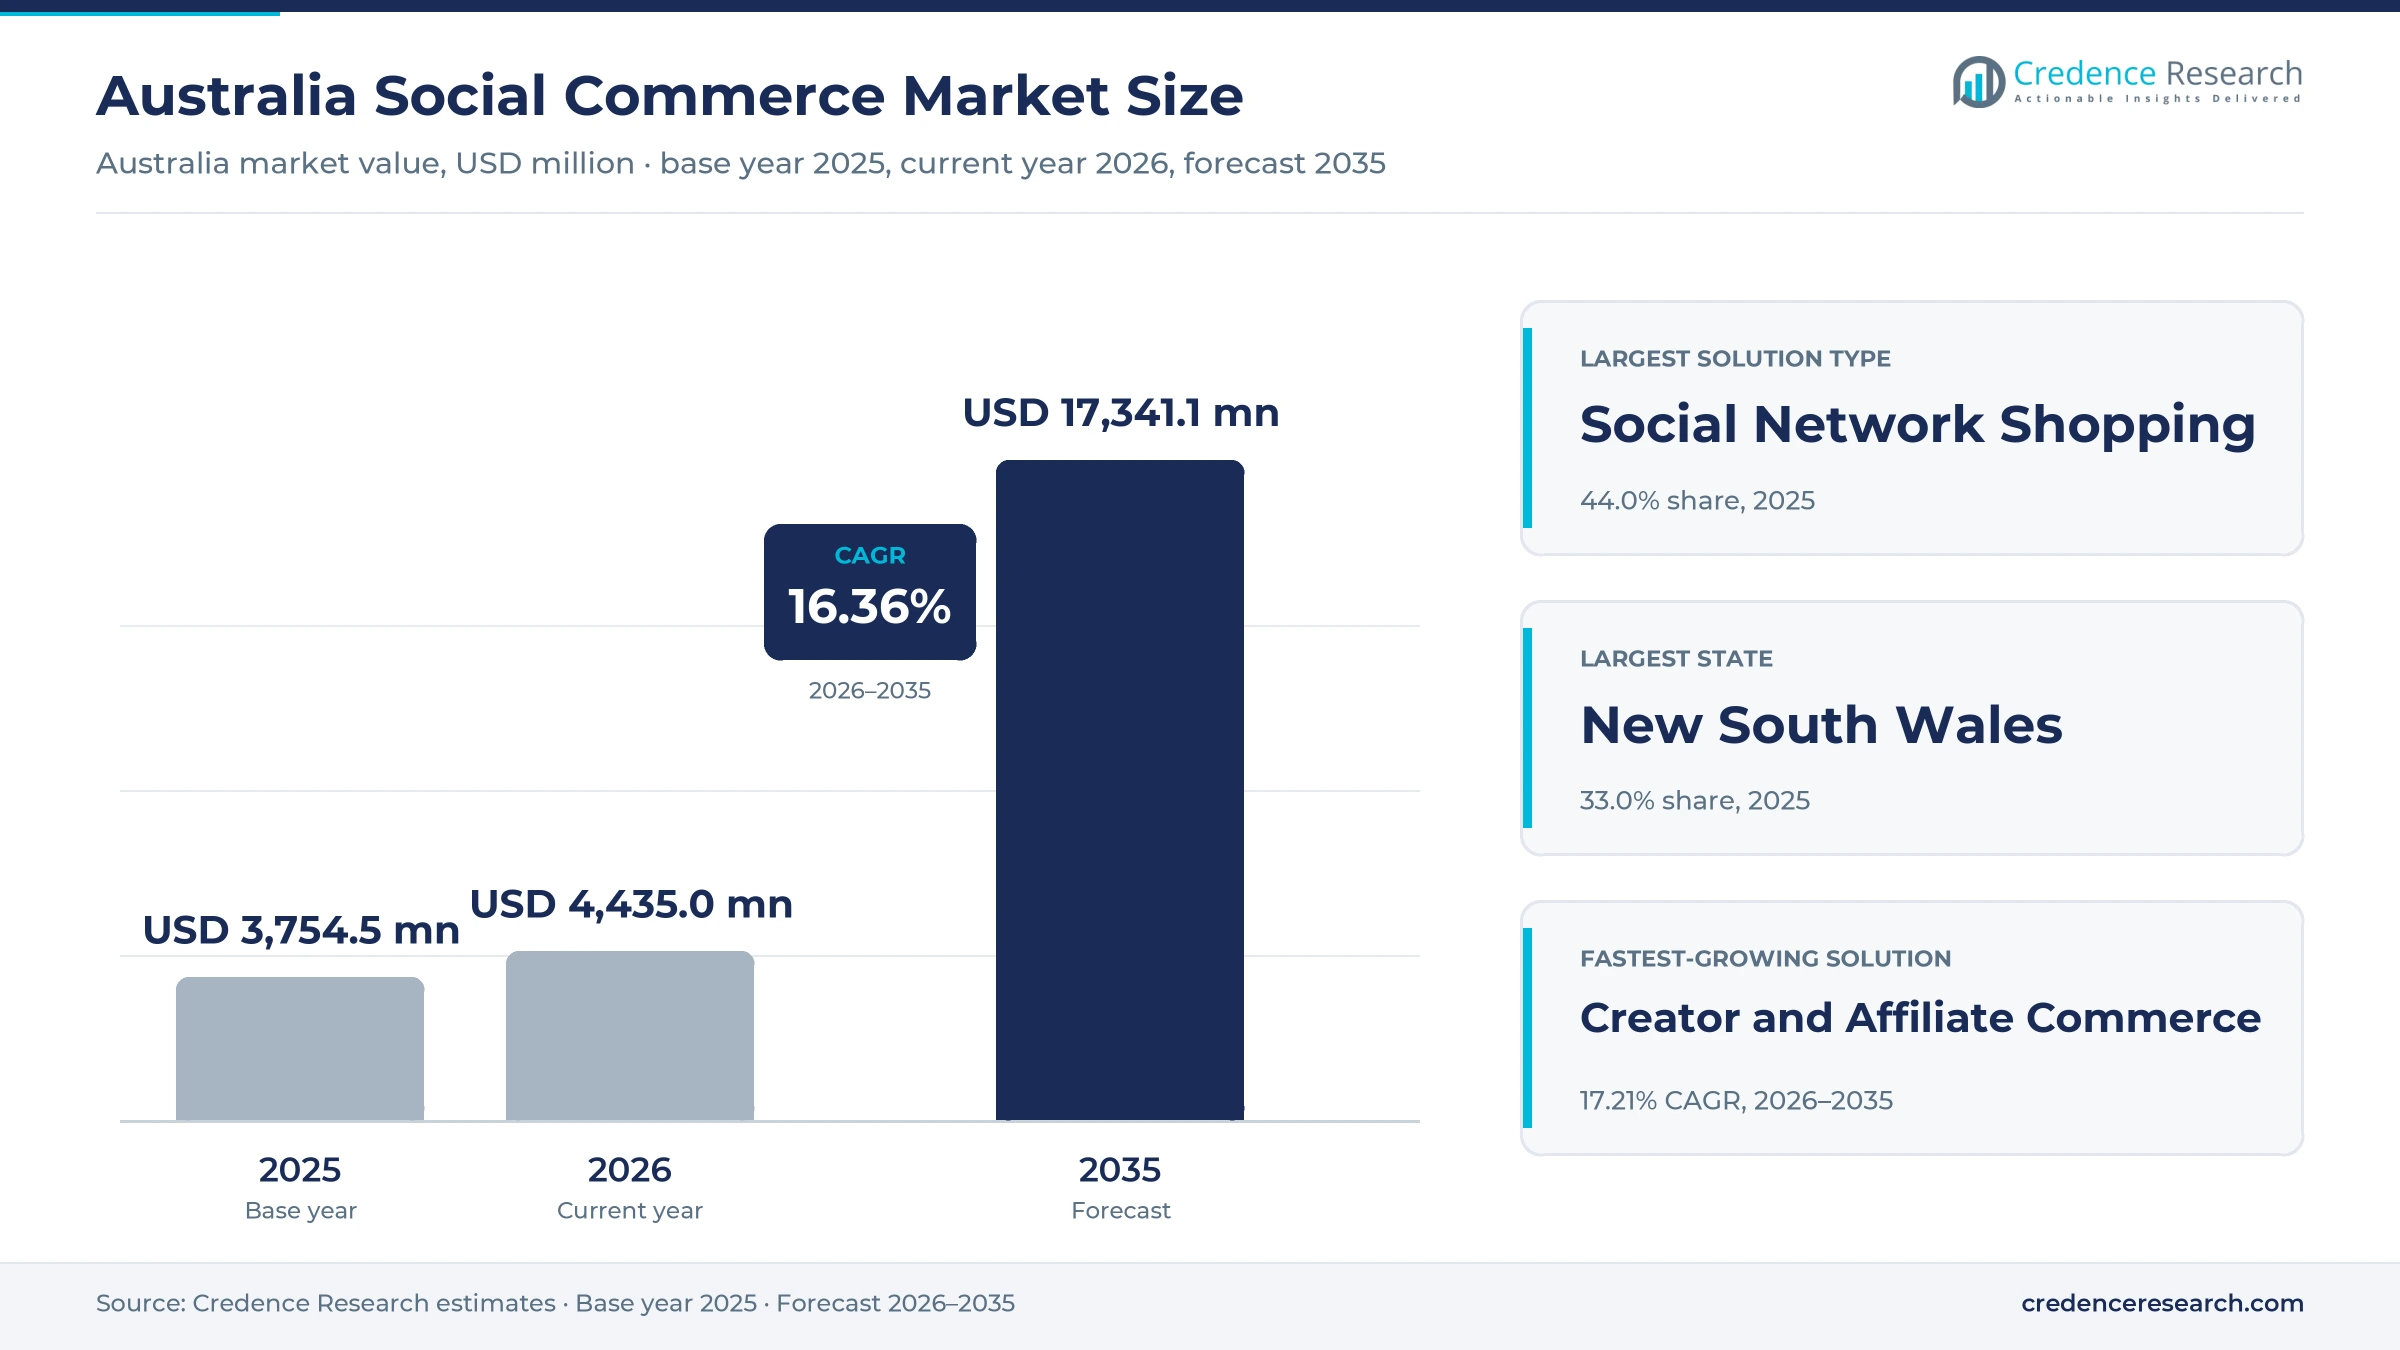
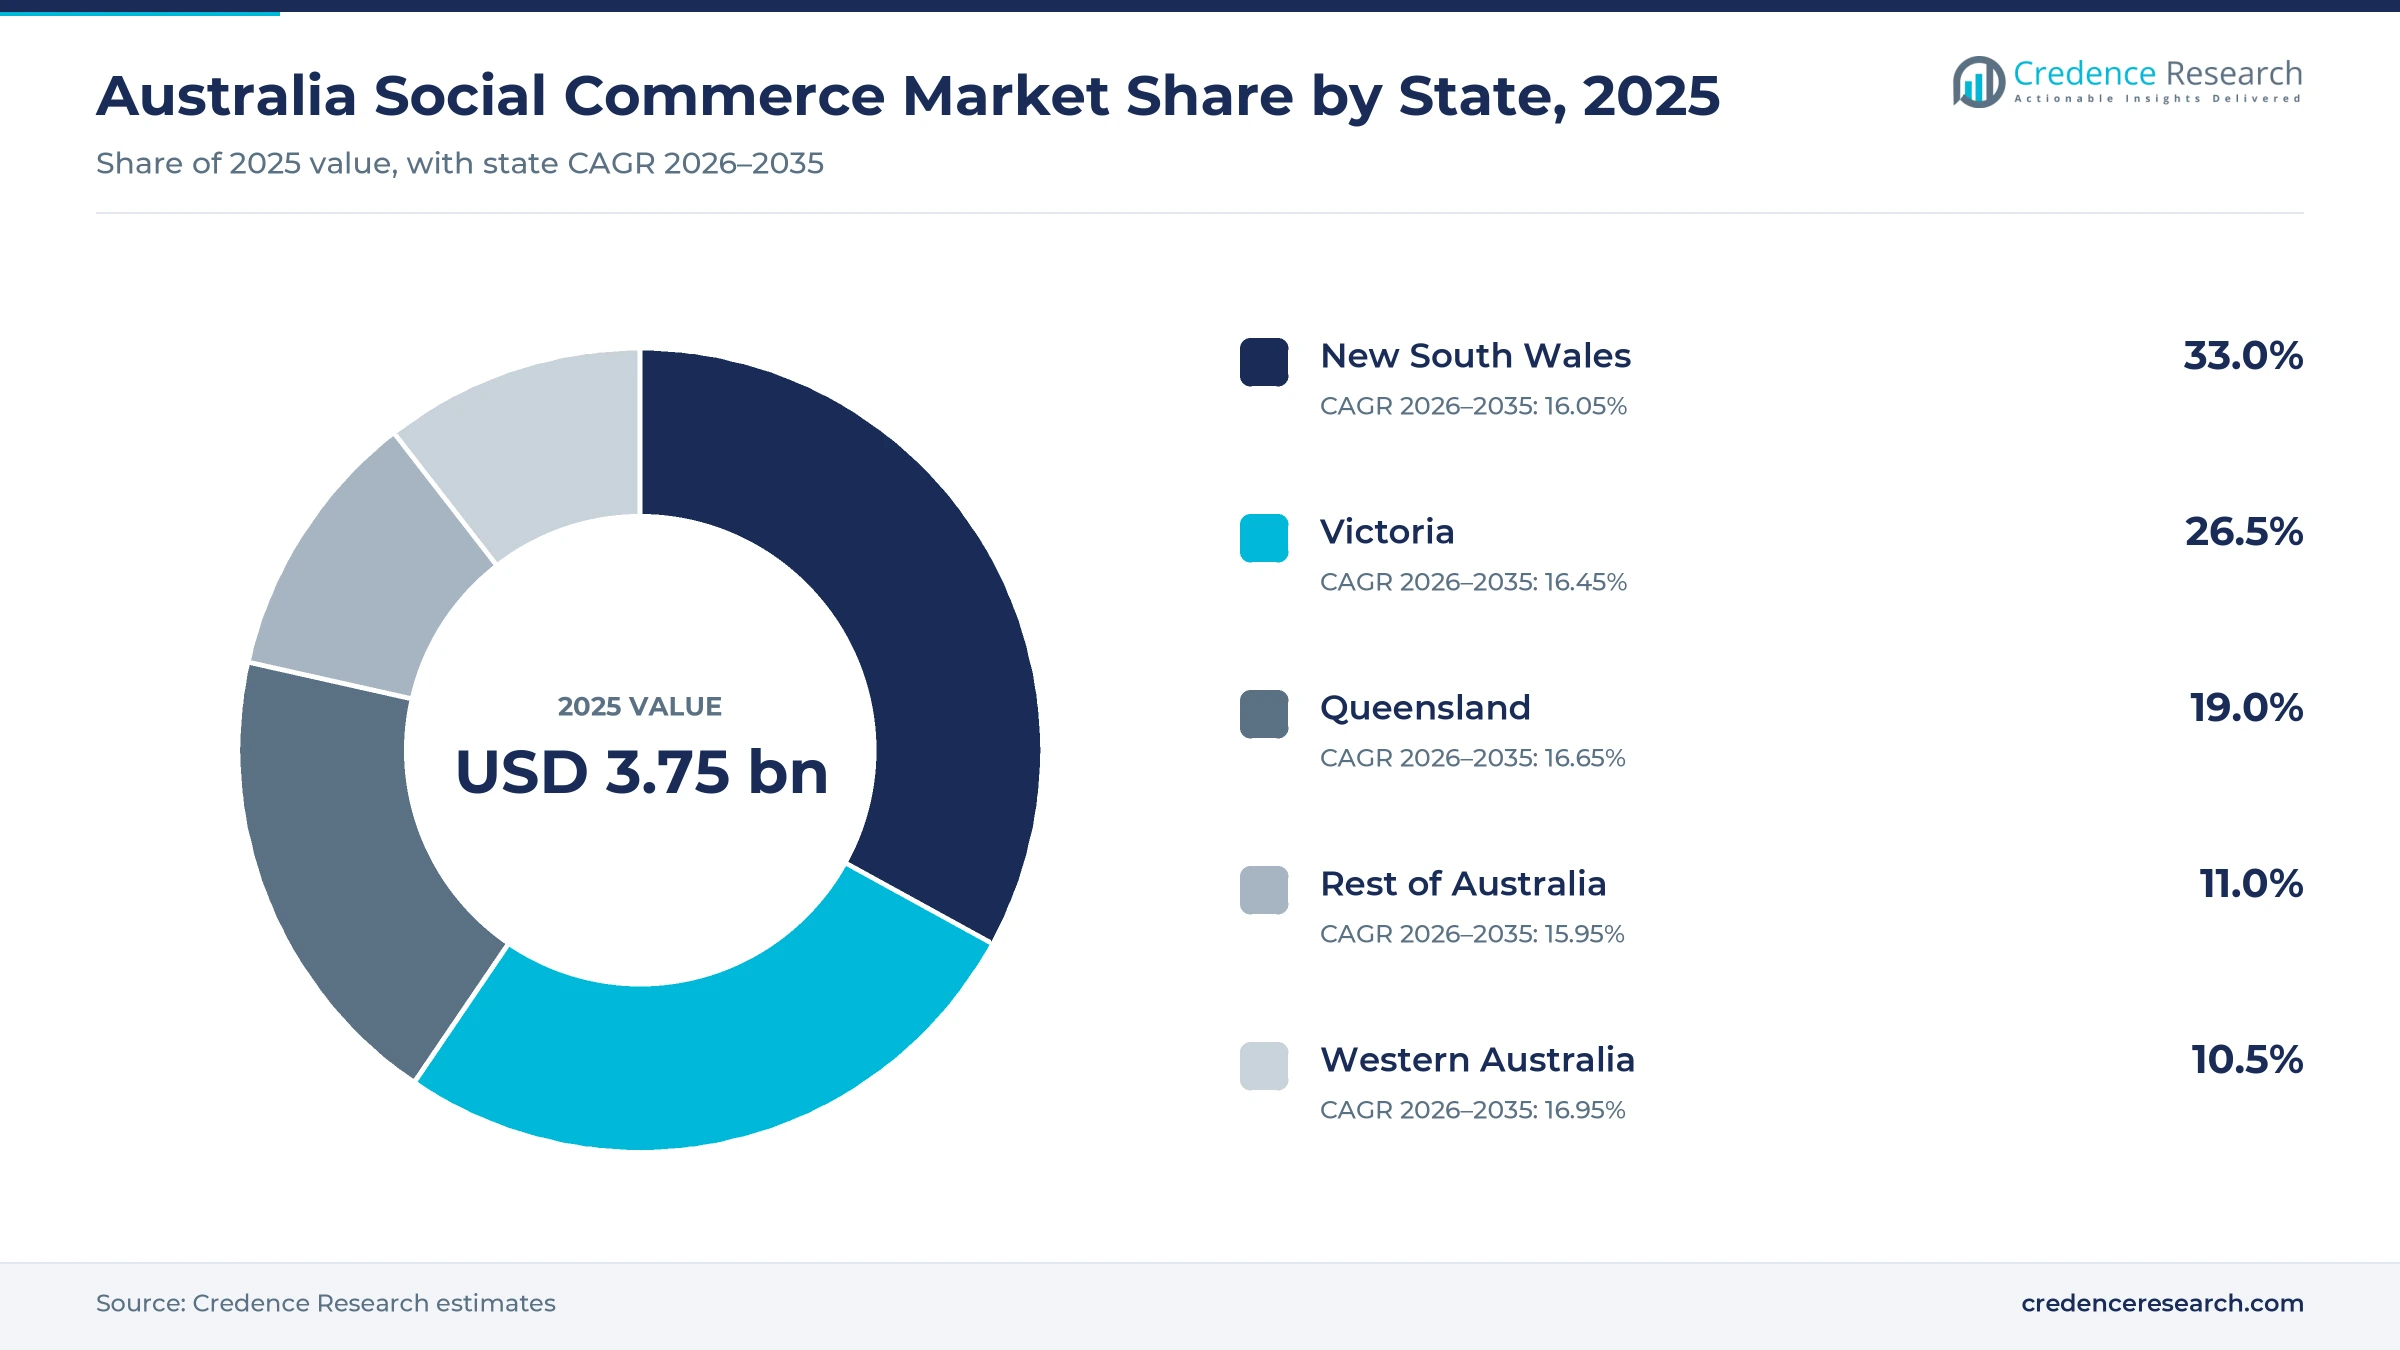
The Australia social commerce market was valued at USD 3.75 billion in 2025 and is projected to increase from USD 4.43 billion in 2026 to USD 17.34 billion by 2035, registering a CAGR of 16.36% during 2026–2035. Demand comes from consumers who now find products in feeds, short videos and creator posts before they buy, and from retailers that shift budgets toward shoppable social video. New South Wales held the largest state share, 33.0% in 2025, because Sydney concentrates the largest online population, fashion and beauty brands and creator agencies. Western Australia grows fastest at 16.95% a year, as the state adds residents faster than any other. TikTok has not yet opened a local in-app shop, so most social sales still close on retailer websites and marketplaces. Since Dec. 10, 2025, age limits for users under 16 have also changed how platforms verify accounts and target younger shoppers.
Which social sales are counted in Australia?
The estimate measures the value of goods bought by consumers in Australia after discovery on social platforms, including purchases completed inside an app, through a creator or affiliate link, during a livestream or in a messaging or community group. It also includes the commissions, affiliate fees, advertising and merchant tools that these sales generate. Values are stated in USD million at current prices and exclude taxes.
The estimate excludes services such as travel, food delivery and ticketing, and it excludes purchases where social media played no part in discovery. The value chain runs from brands, retailers and small sellers through creators, agencies and link tools to platforms, payment providers, delivery firms and buyers.
Australia Social Commerce Market Insights
- The Australia social commerce market was valued at USD 3.75 billion in 2025 and is projected to reach USD 17.34 billion by 2035, registering a CAGR of 16.36% during 2026–2035.
- New South Wales held 33.0% of 2025 value, because Sydney hosts the largest online population and most fashion, beauty and creator businesses.
- Social network shopping led with 44.0% of 2025 value, since feeds on large networks turn everyday browsing into product discovery and purchase.
- Age limits for users under 16 took effect on Dec. 10, 2025, with fines of up to AUD 49.5 million for systemic breaches.
- Creator and affiliate commerce grows fastest at 17.21% a year during 2026–2035, as creators earn commission on tagged products.
Network shopping and referrals carry most social sales
Why does network shopping lead social sales?
Based on solution type, the market is categorized into social network shopping, creator and affiliate commerce, live commerce and messaging and community commerce. Social Network Shopping led with 44.0% of 2025 value, because large feeds reach most adults and send buyers to stores in one tap. Creator and Affiliate Commerce grows fastest at 17.21% a year, as creators add product tags and affiliate links to everyday posts.
How do referrals and native checkout split social sales?
Based on deployment model, the market is categorized into native in-platform commerce, social-to-merchant referral, embedded storefront integration and cross-border social commerce. Social-to-Merchant Referral led with 49.0% of 2025 value, because most buyers still complete orders on familiar retailer websites. Cross-Border Social Commerce grows fastest at 17.12% a year, as local brands sell overseas through shoppable video apps.
Which product groups sell best through social channels?
Based on end-use industry, the market is categorized into fashion and beauty, consumer electronics, home and lifestyle and food and specialty retail. Fashion and Beauty led with 41.0% of 2025 value, because clothing, cosmetics and skincare are easy to show in short video. Home and Lifestyle grows fastest at 16.93% a year, as decor, furniture and kitchen goods gain from visual search and creator styling.
| Segment Group | Leading Sub-segment | Share, 2025 | Fastest-growing Sub-segment | CAGR, 2026–2035 |
|---|---|---|---|---|
| By Solution Type | Social Network Shopping | 44.0% | Creator and Affiliate Commerce | 17.21% |
| By Deployment Model | Social-to-Merchant Referral | 49.0% | Cross-Border Social Commerce | 17.12% |
| By End-Use Industry | Fashion and Beauty | 41.0% | Home and Lifestyle | 16.93% |
Request a Free Sample
Fill in your details and we'll send you a free sample report.
- Sample data tables & charts
- Research methodology
Discovery, mobile reach and video budgets lift sales
How is social media becoming a product-discovery layer?
Social media is becoming the first stop for product discovery, because shoppers now see new items in feeds before they search a store. Six in 10 Australians take action after seeing a product on social media, according to a July 2026 shopper study. The same study found 38% are more likely to buy a product an influencer they follow recommends. That share rises to 62% among people aged 18 to 24 and 61% among those aged 25 to 34. As a result, brands shift budgets toward influencer marketing and shoppable posts. This discovery habit explains why social network shopping holds 44.0% of 2025 value across the country. Younger buyers will likely carry this discovery habit into their higher-spending years.
Why does near-universal mobile access support feed-to-checkout sales?
Near-universal mobile access supports feed-to-checkout sales, because almost every adult already carries a phone that links social apps to payment. Internet users reached 96.13% of the population in 2024, which supports social commerce demand nationwide, according to World Bank data. Mobile subscriptions stood at 112.6 per 100 people in the same year, which shows that many people use several connected devices. The communications regulator reported that 99.7% of adults went online in the six months to June 2025. Nearly all adults, 97%, used a mobile phone to go online, up from 95% in 2024. Consequently, a seller can reach national demand through one post, and a buyer can pay within seconds of watching a clip.
How is social video investment reinforcing shoppable content?
Social video investment is reinforcing shoppable content, because brands now fund more clips that show products in use. Internet advertising grew 11.5% to AUD 18.4 billion in 2025, according to B&T. Video advertising rose 19.8% to AUD 5.4 billion and reached 29% of total online advertising spend in the year. Social video accounted for 40% of all video investment and grew 35.1% over the year. In turn, platforms gain more product content that viewers can tap to buy, and spending on digital video advertising links directly to sales. This shift lifts demand for creator and affiliate commerce across fashion, beauty and home products.
Why does record online spending widen the buyer base?
Record online spending widens the buyer base for social selling, because more households now trust online payment and delivery. Australians spent a record AUD 82.6 billion online in 2025, up 13.9% year on year, according to Australia Post figures. About 9.8 million households shopped online during the year, which leaves few homes outside digital retail. Online marketplaces were the largest category at AUD 18.9 billion in spending, a share of demand that social referrals feed. Consequently, social posts that send buyers to stores convert into orders more easily than before. This trust explains why social-to-merchant referral holds 49.0% of 2025 value, as buyers move from a feed to a familiar checkout. Flexible payment options such as buy now, pay later also lift basket sizes for these referred orders.
Creator links, cross-border selling and AI shopping rise
How is the rise of creator product tagging playing out?
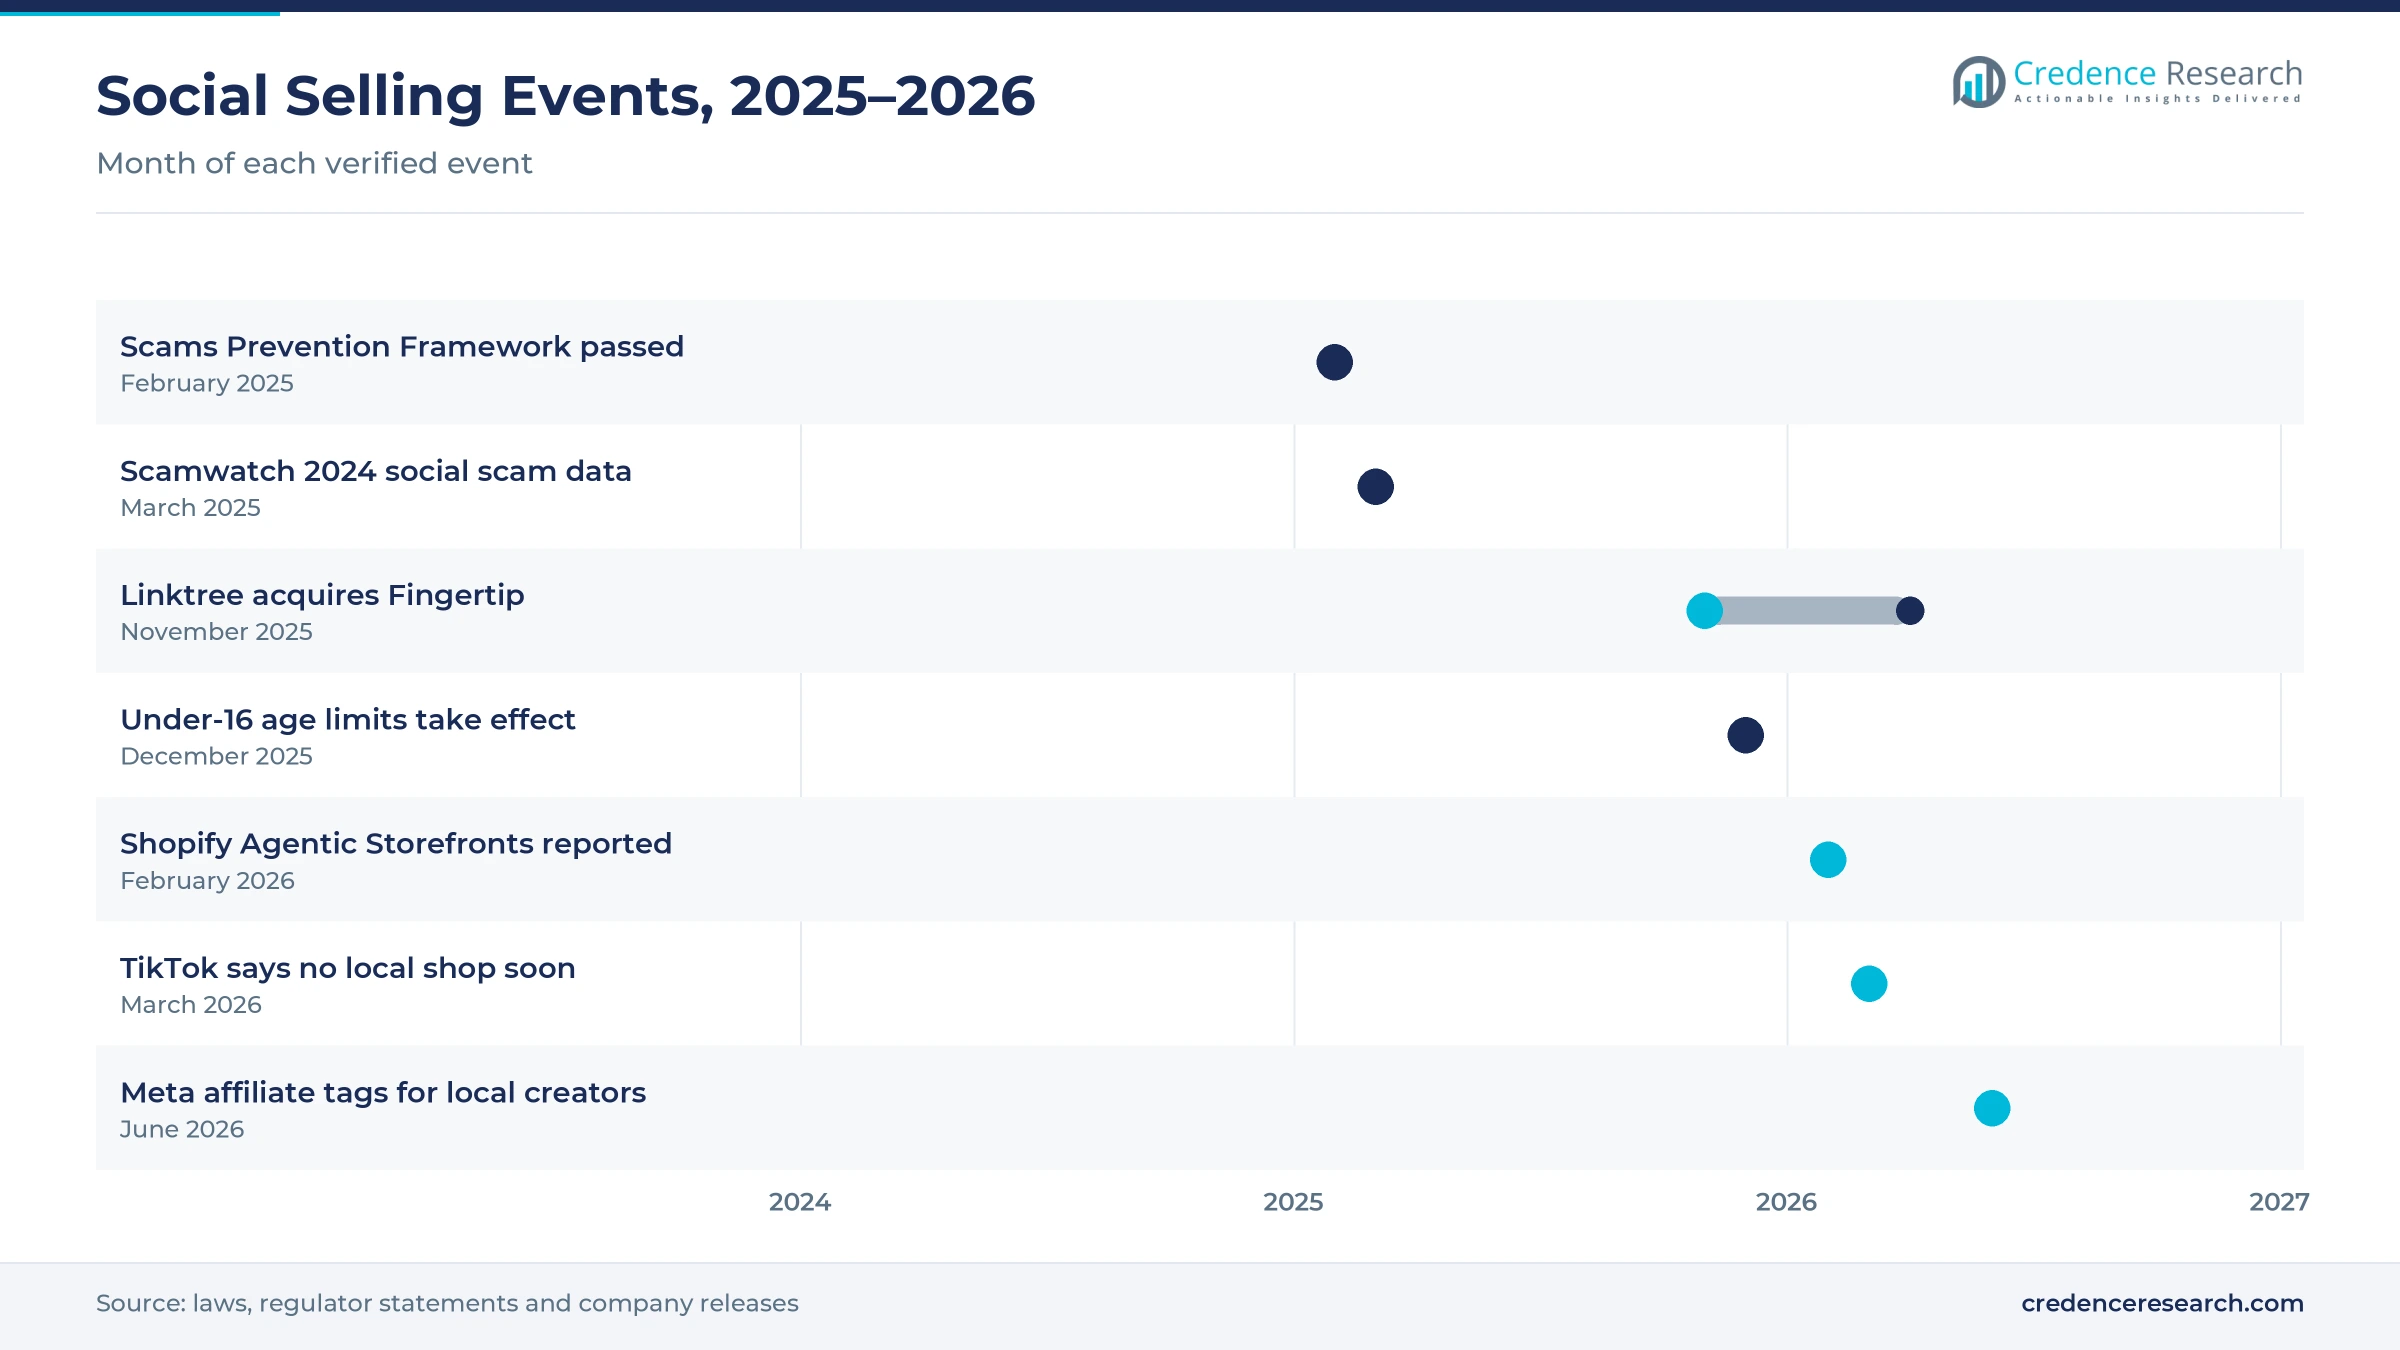
Creator product tagging is rising, because platforms now let creators earn commission directly from posts. In June 2026, Meta said Australian creators can add affiliate links or tag products in Instagram Reels and Feed posts. Businesses can also make catalogs searchable for creators, who earn commission on purchases made through their links. Linktree, the Melbourne link-in-bio company, now has about 70 million users, according to SmartCompany. It bought Melbourne start-up Fingertip in November 2025 and moved Fingertip users to its platform by the end of April 2026. As a result, creator and affiliate commerce grows fastest at 17.21% a year. Creators with loyal audiences gain new income from every tagged product.
Why is the shift toward cross-border social selling rising?
The shift toward cross-border social selling is rising, because local brands can reach overseas buyers before a domestic in-app shop opens. At its Spotlight event in Sydney in March 2026, TikTok said its shop service was not launching locally in the near term. Roughly 20 Australian brands already sell into the United States and the United Kingdom through cross-border tools on the same app. At an Oct. 1, 2026, event in Sydney, TikTok reported that overseas shop sales by Australian and New Zealand brands grew 300% this year. Launch requirements cited by the company include local logistics, payment integrations, returns and compliance support. Consequently, cross-border social commerce grows fastest among deployment models at 17.12% a year.
Can AI shopping agents open a new sales path?
AI shopping agents open a clear new path, because buyers increasingly ask chat assistants for product suggestions. In February 2026, Shopify described Agentic Storefronts that send merchant catalogs to Google Gemini, ChatGPT and Microsoft Copilot. Orders generated through AI-driven search rose about 15 times year on year, although from a small base. About 16% of Shopify merchants are in Asia Pacific and Australia, which gives local sellers early access to these tools. As a result, embedded storefront integration gains as social posts, chat answers and stores share one catalog. Sellers that already run online store software can add these channels without new inventory systems.
Is there room to grow through visual and AR discovery?
Visual and augmented reality discovery offers a second opening, because many buyers want to see products in context before they buy. Pinterest reported about 8 million local monthly users in December 2023, when it launched its first local online store. Snap reported more than 8 million monthly Snapchat users in Australia in August 2023. Snap also said 60% of its Australian users interact with AR Lenses daily, partly to buy products from favorite brands. In turn, home and lifestyle goods grow fastest among product groups at 16.93% a year. Furniture, decor and beauty sellers that use try-on and visual search tools can convert browsers into buyers more quickly.
Age limits, scams and disclosure rules test platforms
How do age limits for users under 16 affect reach?
Age limits for users under 16 reduce reach among the youngest shoppers, because platforms must now remove underage accounts. The rule took effect on Dec. 10, 2025, and covers Facebook, Instagram, Snapchat, Threads and YouTube among others. Platforms face fines of up to AUD 49.5 million for systemic non-compliance with the law. As a result, brands that sell to teenagers lose a direct channel and shift spending toward creators who reach adult buyers.
Why do social media scams weaken buyer trust?
Social media scams weaken buyer trust, because fake stores and fraudulent ads look similar to genuine shoppable posts. Scamwatch received 7,724 reports of social media scams with financial loss in 2024, with losses of AUD 69.5 million. Parliament passed the Scams Prevention Framework on Feb. 13, 2025, and social media platforms are a planned sector. Consequently, platforms must invest more in seller checks, which raises costs but should improve buyer confidence over time.
How do disclosure rules raise creator compliance costs?
Disclosure rules raise creator compliance costs, because regulators want buyers to know when a post is paid advertising. In December 2023, the competition regulator found that 81% of 118 influencers reviewed made posts that raised concerns under consumer law. Guidance for influencers and businesses on disclosure followed in 2024. In turn, brands now check creator posts more carefully, and clear labels can protect long-term trust in affiliate selling.
Will the lack of a local in-app shop slow native checkout?
The lack of a local in-app shop on the largest short-video app slows native checkout, because buyers must leave the app to pay. A July 2026 shopper study found 42% prefer to complete purchases through familiar retailer channels. Half of shoppers who search after seeing a social post click through to a brand or retailer website. However, this pattern keeps referral sales strong while native in-platform commerce grows from a smaller base.
Sydney buyers lead as Western Australia adds shoppers
| State | Value, 2025 (USD billion) | Share, 2025 | CAGR, 2026–2035 |
|---|---|---|---|
| New South Wales | 1.24 | 33.0% | 16.05% |
| Victoria | 0.99 | 26.5% | 16.45% |
| Queensland | 0.71 | 19.0% | 16.65% |
| Rest of Australia | 0.41 | 11.0% | 15.95% |
| Western Australia | 0.39 | 10.5% | 16.95% |
Why does New South Wales lead social sales?
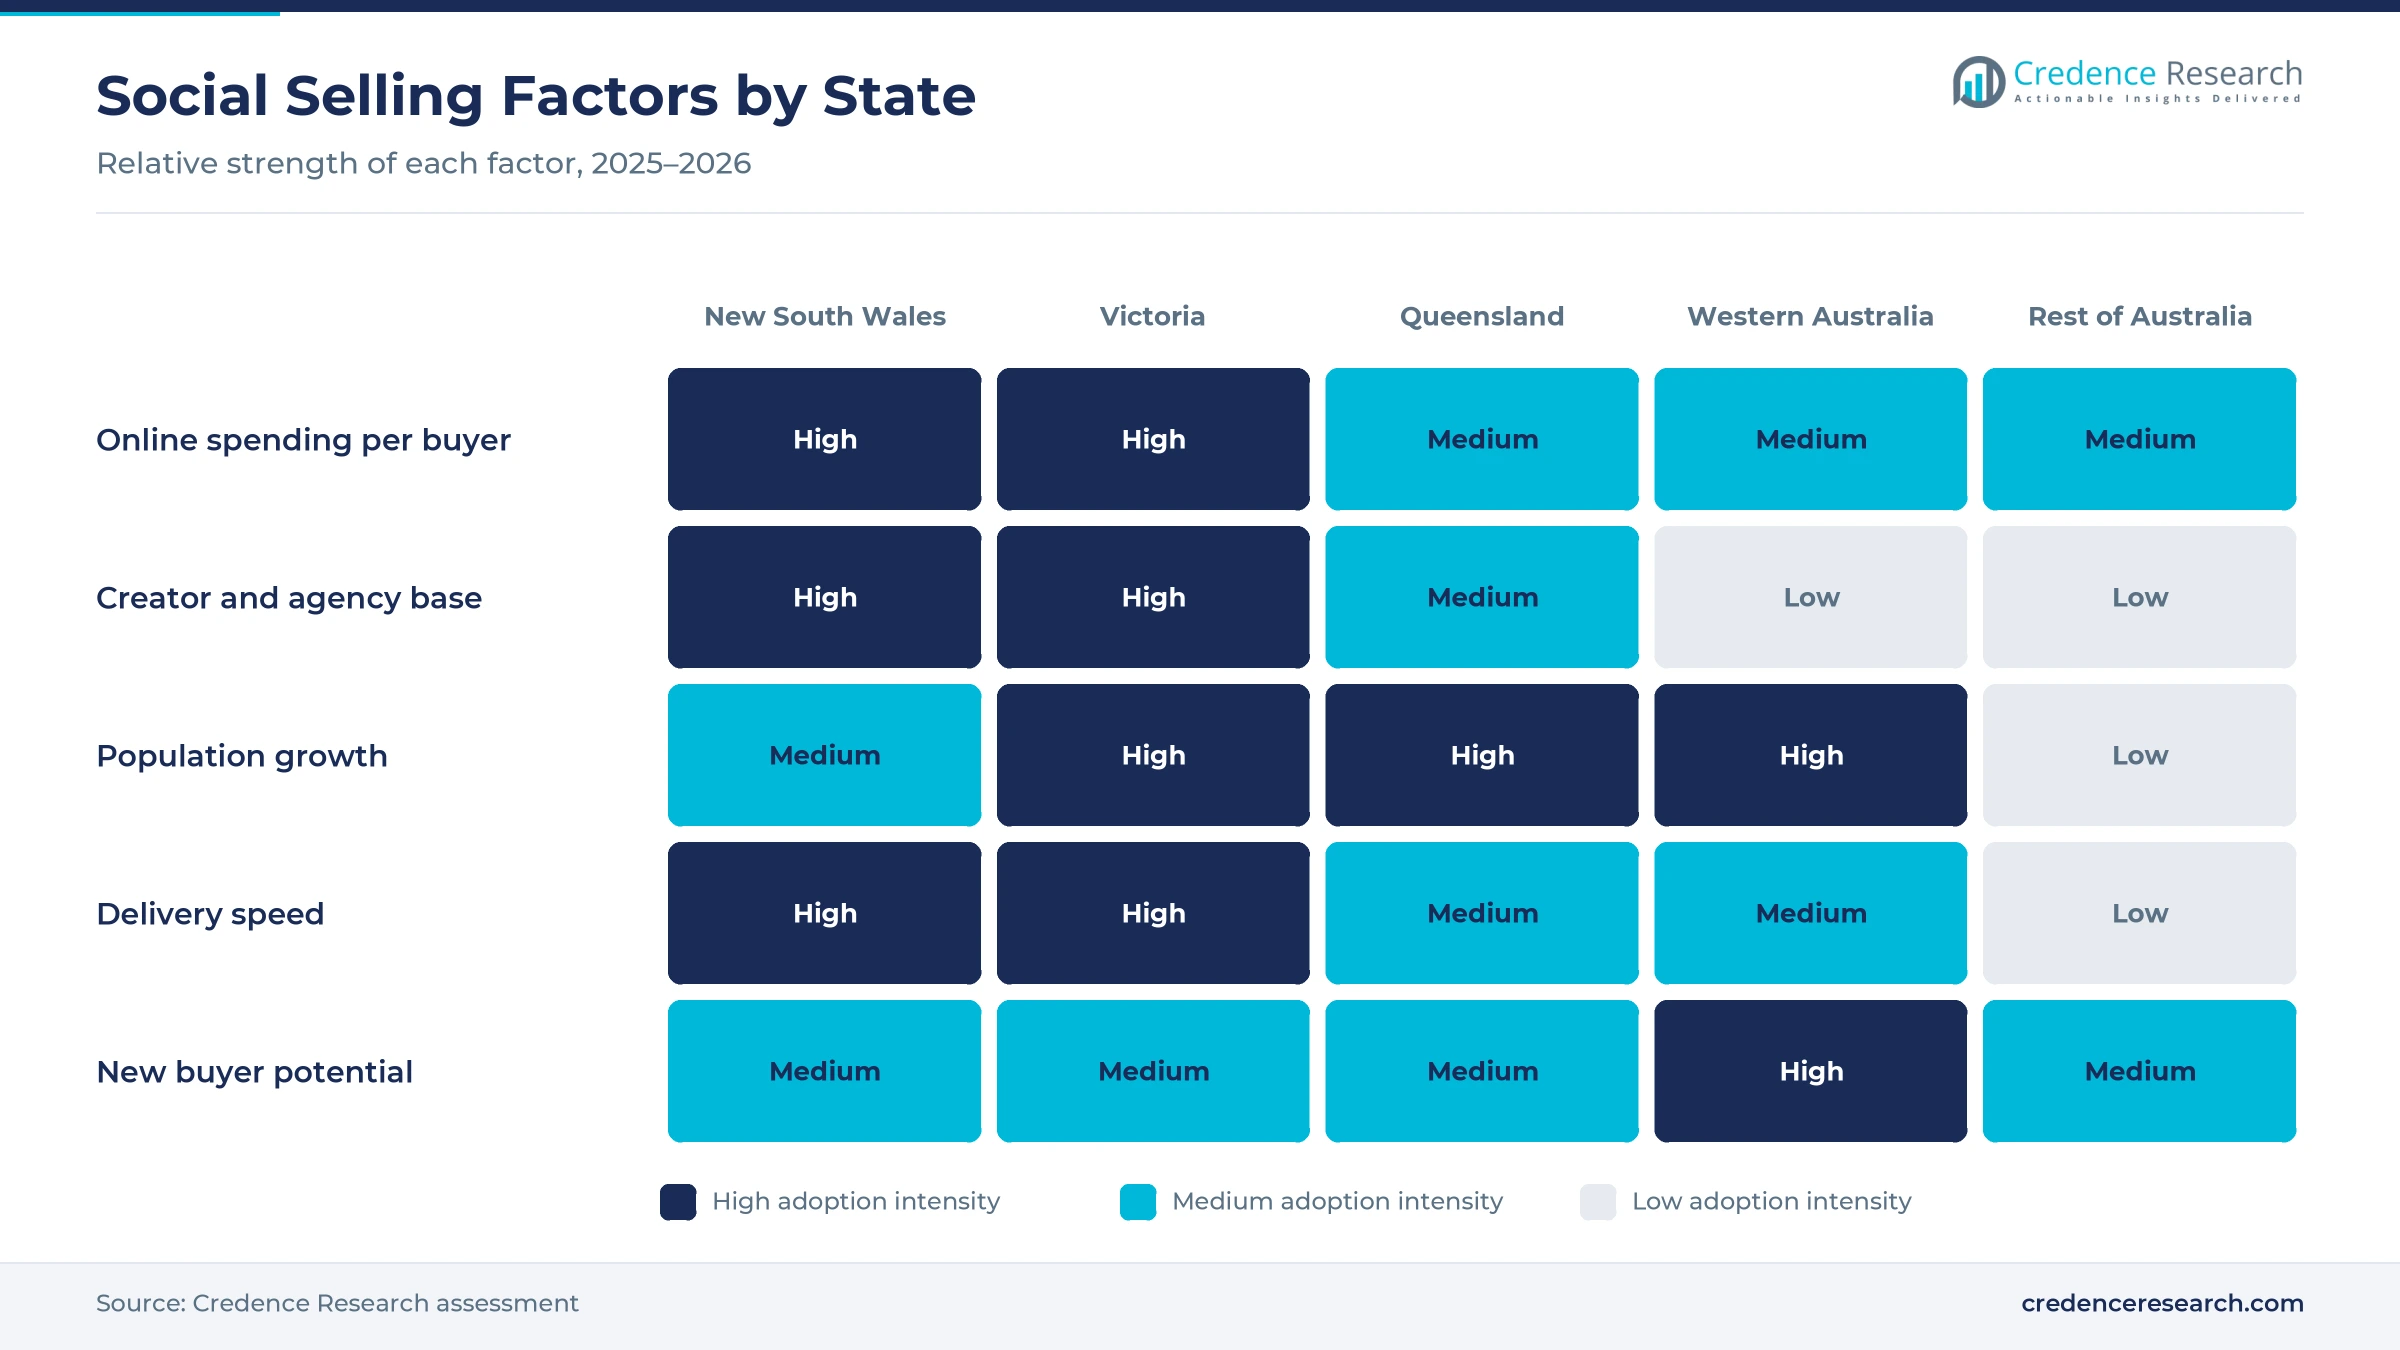
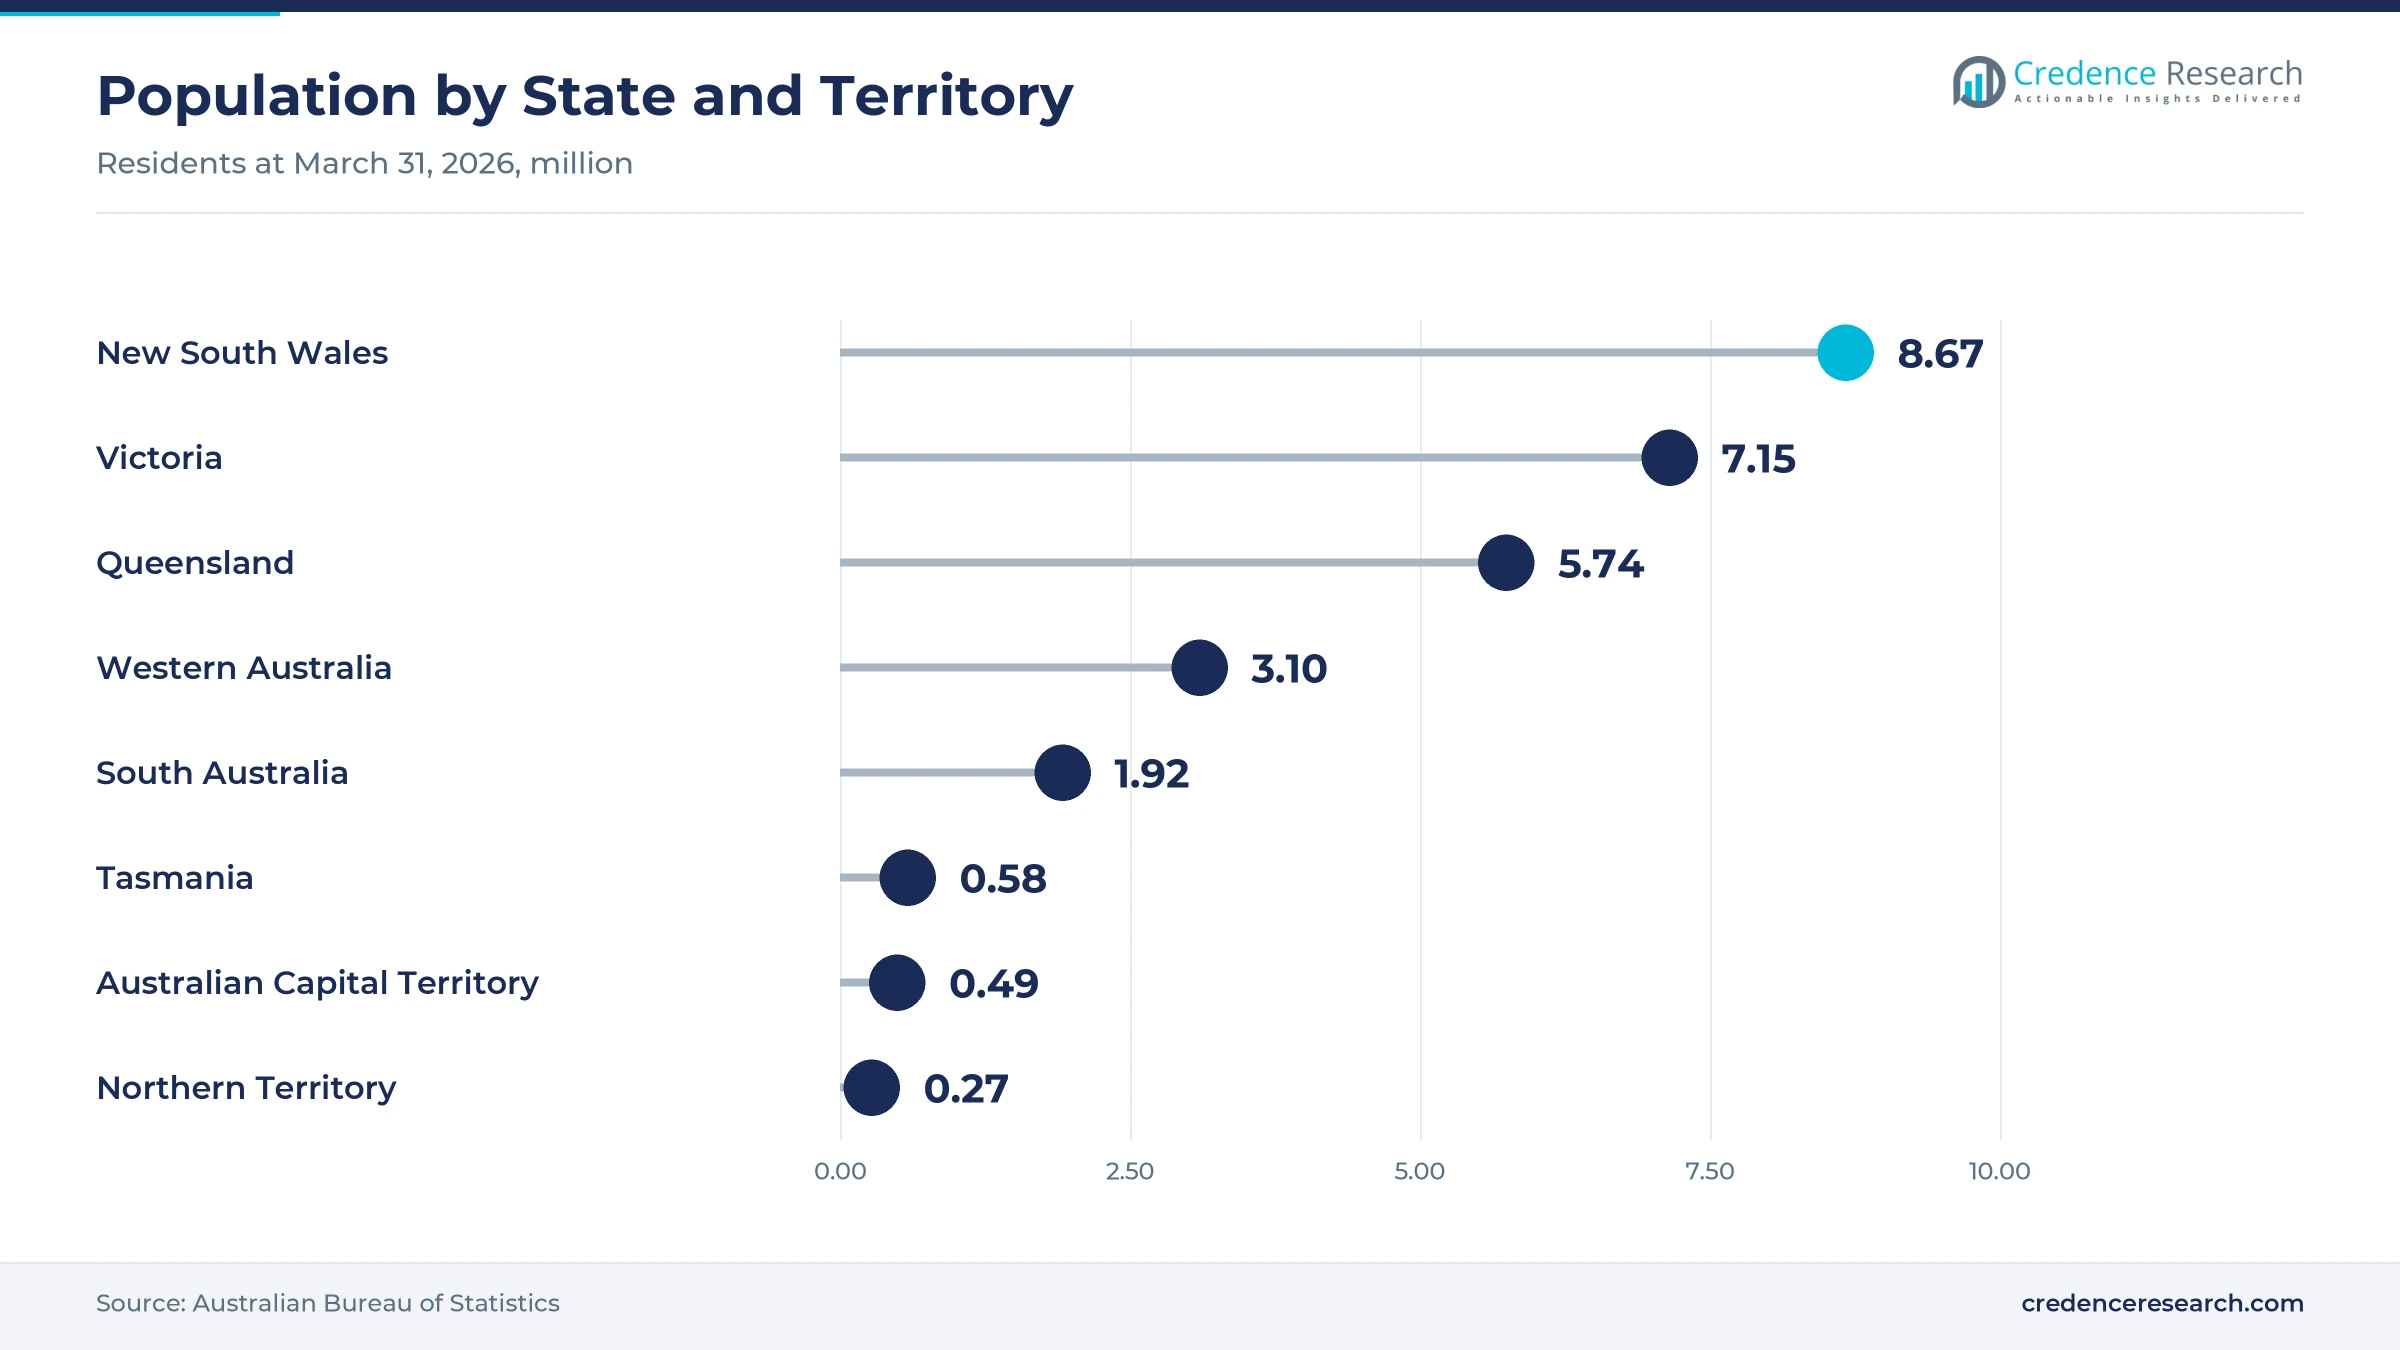
New South Wales held 33.0% of 2025 value and grows at 16.05% a year, because Sydney concentrates the largest online population and many brand, agency and creator businesses. The state had 8.67 million residents at March 31, 2026, the largest base of social shopping demand in any region. Its population grew 1.1% over the year, slower than the national rate of 1.4%. As a result, New South Wales keeps the largest share, while growth comes more from higher spending per buyer than from new residents.
How does Victoria support creator-led selling?
Victoria held 26.5% of 2025 value and grows at 16.45% a year, because Melbourne combines a large young population with fashion and creator businesses. The state had 7.15 million residents at March 31, 2026, after growth of 1.6% over the year. Melbourne is also home to Linktree, which bought local start-up Fingertip in November 2025. Consequently, Victoria supports both buyer demand and creator tools that serve sellers across the country and overseas.
Why is Queensland a growing social shopping state?
Queensland held 19.0% of 2025 value and grows at 16.65% a year, because its population is growing quickly across Brisbane and coastal cities. The state had 5.74 million residents at March 31, 2026, up 1.6% over the year. Many households in regional towns rely on online orders because local store ranges are smaller. In turn, social posts that send buyers to national retailers add volume across Queensland as delivery networks improve.
Why does Western Australia grow fastest?
Western Australia held 10.5% of 2025 value and grows fastest at 16.95% a year, because it added residents faster than any other state. Its population rose 2.1% to 3.10 million in the year to March 31, 2026. Therefore, new arrivals who already shop through social apps add fresh demand in Perth and mining towns.
How do the smaller states and territories add buyers?
The rest of Australia held 11.0% of 2025 value and grows at 15.95% a year, covering South Australia, Tasmania and the two territories. Tasmania grew slowest at 0.6% in the year to March 2026, which limits new demand in that region. As a result, growth there depends on wider use of short-video apps rather than on population gains.
Laws, deals and platform moves from 2025 to 2026
| Development | Status and market relevance |
|---|---|
| In February 2025, Parliament passed the Scams Prevention Framework, with social media platforms among planned sectors. | Raises seller checks and fraud controls on shoppable posts |
| In November 2025, Linktree acquired Melbourne start-up Fingertip and later moved its users to the Linktree platform. | Expands creator storefront and link tools |
| In December 2025, age limits for social media users under 16 took effect across major platforms. | Reduces direct reach to teenage shoppers |
| In March 2026, TikTok said at its Sydney Spotlight event that a local in-app shop was not launching soon. | Keeps social sales focused on referrals and cross-border selling |
| In June 2026, Meta said Australian creators can add affiliate links or tag products in Instagram Reels and Feed posts. | Widens creator and affiliate commerce inside Meta apps |
Product tags, link pages and AI agents reshape checkout
- Product tags and affiliate links inside posts and short videos let buyers reach a product page in one tap, which lifts conversion from feeds.
- Link-in-bio storefronts give creators one page for products, bookings and payments, which suits small sellers without their own websites.
- AI shopping agents that read merchant catalogs can answer product questions in chat, which adds a new path from discovery to checkout.
- Age assurance tools check whether account holders are adults, which platforms now use to meet the under-16 rule and protect ad targeting.
Need a Custom Version of This Report?
Tailor the scope, geography, or segments to your exact requirements.
- Custom geography or segment scope
- Direct access to our analyst team
Platforms and creator tools compete for seller budgets
Competition combines large social networks, video apps, visual search services and creator tools that sit between posts and checkout. Meta Platforms runs Facebook and Instagram and added affiliate links and product tags for Australian creators in June 2026. ByteDance's TikTok reaches local audiences but has not opened a domestic in-app shop, so Australian brands sell overseas through its cross-border tools. Google offers creator partnerships on YouTube in Australia, while Pinterest reported about 8 million local monthly users and runs shoppable pins. Snap reported more than 8 million monthly Snapchat users, and Linktree serves about 70 million users after five acquisitions. Shopify supplies online stores and AI-ready catalogs for many local sellers. Companies compete on audience reach, creator commissions, ad formats, checkout speed and seller tools that turn viewers into repeat buyers.
Companies profiled and their roles in this market
| Company | Type | Role in the market |
|---|---|---|
| Meta Platforms | Social network | Affiliate links and product tags for Australian creators from June 2026 |
| ByteDance (TikTok) | Short-video platform | No local in-app shop; cross-border selling for about 20 local brands |
| Google (YouTube) | Video platform | Creator partnerships available in Australia |
| Visual discovery platform | About 8 million local monthly users and a local online store | |
| Snap Inc. | Messaging and camera app | More than 8 million monthly users; AR Lenses used for shopping |
| Linktree | Creator storefront tool | About 70 million users; acquired Fingertip in November 2025 |
| Shopify | Commerce platform | Agentic Storefronts linking catalogs to AI assistants in 2026 |
Credence Research view on creator-led selling
Credence Research's view is that Australian social selling will grow strongly through 2035, as creators earn commission on more posts and brands move video budgets toward shoppable content. Social network shopping should keep the largest share, while creator and affiliate commerce gains most. A local in-app shop on the largest short-video app would speed native checkout, but referral sales will remain strong because many buyers prefer familiar retailers. However, scams, age limits and disclosure rules will favor platforms and creators that invest in trust and verification.
How the social selling estimate was built
The report uses 2025 as the base year, with values in USD million at current prices. Market values come from the Credence Research model, which combines online spending, social media reach, advertising data, conversion rates and average order values. State shares and segment splits by solution type, deployment model and end-use industry are Credence Research estimates, with state zones built from official population data. Sources used are World Bank data, official statistics, regulator releases, company statements and news reports, and no interviews or surveys were used.
Creators, video and rules set the path to 2035
The market is expected to reach USD 17.34 billion by 2035, a 16.36% CAGR during 2026–2035, as social feeds become a routine starting point for shopping across every state. Growth should be strongest in creator and affiliate commerce and in Western Australia, while New South Wales keeps the largest share. Shoppable video, AI shopping agents and cross-border selling will add new paths to purchase each year. In contrast, a rise in scams or stricter platform rules could slow growth among small sellers.
Frequently Asked Questions
How big is the Australia social commerce market?
Which state leads social selling in Australia?
Which state grows fastest?
Which solution type holds the largest share?
Has TikTok opened a local in-app shop?
Which solution type grows fastest?
Who are the leading companies in this market?
What are the main risks to growth?
Table of Content
Chapter 1 Market Segmentation
- 1.1 Segmentation Framework
- 1.1.1 Product and Service Classification
- 1.1.2 Application and End-Use Classification
- 1.1.3 Technology and Solution Classification
- 1.1.4 Customer and Distribution Channel Classification
- 1.1.5 Geographic Segmentation
- 1.1.6 Market Segment Definitions and Boundaries
- 1.2 By Solution Type
- 1.2.1 Social Network Shopping
- 1.2.2 Creator and Affiliate Commerce
- 1.2.3 Live Commerce
- 1.2.4 Messaging and Community Commerce
- 1.3 By Deployment Model
- 1.3.1 Native In-Platform Commerce
- 1.3.2 Social-to-Merchant Referral
- 1.3.3 Embedded Storefront Integration
- 1.3.4 Cross-Border Social Commerce
- 1.4 By End-Use Industry
- 1.4.1 Fashion and Beauty
- 1.4.2 Consumer Electronics
- 1.4.3 Home and Lifestyle
- 1.4.4 Food and Specialty Retail
- 1.5 By State
- 1.5.1 New South Wales
- 1.5.2 Victoria
- 1.5.3 Queensland
- 1.5.4 Western Australia
- 1.5.5 Rest of Australia
Chapter 2 Introduction
- 2.1 Report Objectives and Scope
- 2.2 Product Definition and Industry Terminology
- 2.3 Market Inclusions and Exclusions
- 2.4 Research Process
- 2.4.1 Primary Research and Expert Interviews
- 2.4.2 Secondary Research and Source Review
- 2.4.3 Top-Down and Bottom-Up Estimation
- 2.4.4 Data Triangulation and Verification
- 2.5 Market Size Measurement Basis
- 2.5.1 2025: USD 3.75 billion → 2035: USD 17.34 billion
- 2.6 Historical and Forecast Reference Periods
- 2.6.1 Historical Period: 2018-2025
- 2.6.2 Base Year: 2025
- 2.6.3 Forecast Period: 2025-2035
- 2.7 Research Assumptions and Limitations
Chapter 3 Executive Summary
- 3.1 Market Snapshot and Key Findings
- 3.2 Base-Year Market Size, 2025
- 3.3 Forecast Market Size, 2035
- 3.4 Revenue and Volume Growth Outlook
- 3.5 Key Demand and Supply Indicators
- 3.6 Leading Market Segments
- 3.7 Fastest-Growing Market Opportunities
- 3.8 Regional Performance Highlights
- 3.9 Technology and Industry Transformation
- 3.10 Competitive Landscape Summary
- 3.11 Analyst View and Strategic Implications
Chapter 4 Australia Social Commerce Market Trends and Developments
- 4.1 Historical Industry Development, 2018-2025
- 4.2 Recent Market Trends and Developments
- 4.3 Demand and Customer Behavior Trends
- 4.4 Technology and Product Innovation
- 4.5 Artificial Intelligence, Automation and Digitalization
- 4.6 Local Manufacturing and Supply Chain Realignment
- 4.7 Industry Partnerships, Mergers and Acquisitions
- 4.8 Sustainability and Circular Economy Developments
- 4.9 Government and Private Sector Investment Trends
- 4.10 Emerging Business Models and Commercialization
- 4.11 Industry Developments and Announcements
Chapter 5 Australia Social Commerce Market Production, Supply and Demand Analysis
- 5.1 Demand Trend and Consumption Analysis, 2018-2025
- 5.2 Demand Forecast, 2025-2035
- 5.3 Production and Output Trend, 2018-2025
- 5.4 Production and Output Forecast, 2025-2035
- 5.5 Installed Capacity and Capacity Utilization
- 5.6 Company-Wise Production Plants and Statistics
- 5.6.1 Installed Production Capacity
- 5.6.2 Actual Production
- 5.6.3 Planned Capacity and Expansion Targets
- 5.7 Supply Chain Structure and Procurement Trends
- 5.8 Supply-Demand Gap and Bottlenecks
- 5.9 Import Dependence and Sourcing Structure
- 5.10 Contract Manufacturing and Outsourcing
- 5.11 Regional Supply and Demand Concentration
Chapter 6 Australia Social Commerce Market Pricing Analysis
- 6.1 Pricing Structure and Measurement
- 6.2 Historical Pricing Trends, 2018-2025
- 6.3 Pricing Outlook, 2025-2035
- 6.4 Average Selling Price and Unit Economics
- 6.5 Pricing by Product and Market Segment
- 6.6 Geographic Pricing Differences
- 6.7 Key Input, Energy, Labor and Logistics Costs
- 6.8 Contract Pricing and Purchasing Models
- 6.9 Pricing Sensitivity and Competitive Positioning
- 6.10 Price, Margin and Profitability Implications
Chapter 7 Australia Social Commerce Market Dynamics
- 7.1 Market Growth Drivers
- 7.1.1 Demand-Side Drivers
- 7.1.2 Technology and Innovation Drivers
- 7.1.3 Infrastructure and Investment Drivers
- 7.1.4 Regulatory and Policy Drivers
- 7.2 Market Restraints
- 7.2.1 Cost and Affordability Constraints
- 7.2.2 Technology and Adoption Barriers
- 7.2.3 Supply Chain and Operational Constraints
- 7.3 Market Challenges
- 7.3.1 Competitive Pressure and Margin Erosion
- 7.3.2 Skills, Infrastructure and Implementation Gaps
- 7.4 Emerging Market Opportunities
- 7.5 Market Dynamics Impact and Time-Horizon Assessment
Chapter 8 Australia Social Commerce Value Chain Analysis
- 8.1 Industry Value Chain Overview
- 8.2 Upstream Suppliers and Critical Inputs
- 8.3 Technology and Component Providers
- 8.4 Manufacturing or Service Delivery
- 8.5 Distribution, Channel Partners and Integrators
- 8.6 Downstream Applications and End Users
- 8.7 Value Addition and Profit Pools
- 8.8 Vertical Integration and Outsourcing
- 8.9 Supplier Concentration and Risk
- 8.10 Supply Chain Localization and Resilience
Chapter 9 Australia Social Commerce Market Regulations and Policies
- 9.1 Relevant Laws, Standards and Compliance Frameworks
- 9.2 Product, Service, Safety and Quality Requirements
- 9.3 Government Policies, Incentives and Subsidies
- 9.4 Imports, Exports and Trade Barriers
- 9.5 Public Procurement and Local Content Requirements
- 9.6 Environmental and Sustainability Compliance
- 9.7 Data Protection, AI and Cybersecurity Compliance
- 9.8 Upcoming Policy Changes and Market Implications
Chapter 10 Australia Social Commerce Market Hotspots and Opportunities
- 10.1 Market Opportunity Mapping and Growth Hotspots
- 10.2 High-Growth Applications and Customer Groups
- 10.3 Underserved Markets and White-Space Opportunities
- 10.4 Emerging Technology and Product Opportunities
- 10.5 New Capacity and Investment Hotspots
- 10.6 Market Entry and Expansion Opportunities
- 10.7 Distribution and Partnership Opportunities
- 10.8 Near-Term and Long-Term Commercial Potential
- 10.9 Opportunity Attractiveness and Execution Risks
Chapter 11 Australia Social Commerce Market Outlook, 2025-2035
- 11.1 Market Size and Analysis
- 11.1.1 Revenue (Market Measurement: 2025: USD 3.75 billion → 2035: USD 17.34 billion)
- 11.1.2 Market Volume and Quantity Sold
- 11.1.3 Historical Market Size, 2018-2025
- 11.1.4 Base-Year Market Size, 2025
- 11.2 Market Forecast, 2025-2035
- 11.2.1 Revenue Forecast to 2035
- 11.2.2 Volume Forecast to 2035
- 11.2.3 CAGR and Year-on-Year Growth
- 11.2.4 Incremental Revenue Opportunity
- 11.3 Forecast Assumptions and Scenario Analysis
- 11.3.1 Base-Case Forecast
- 11.3.2 Optimistic and Conservative Scenarios
- 11.3.3 Technology, Pricing and Policy Sensitivities
- 11.4 Market Attractiveness and Growth Outlook
Chapter 12 Australia Social Commerce Market Segmentation and Outlook
- 12.1 Segmentation Summary and Market Shares, 2025
- 12.2 Largest and Fastest-Growing Segments
- 12.3 By Solution Type - Market Size and Forecast, 2025-2035
- 12.3.1 Segment Definition and Scope
- 12.3.2 Historical Market Size, 2018-2025
- 12.3.3 Revenue Forecast, 2025-2035
- 12.3.4 Volume Forecast, 2025-2035
- 12.3.5 Base-Year Market Share, 2025
- 12.3.6 Segment CAGR and Growth Drivers
- 12.3.7 Subsegment Market Size and Forecast
- 12.3.7.1 Social Network Shopping
- 12.3.7.2 Creator and Affiliate Commerce
- 12.3.7.3 Live Commerce
- 12.3.7.4 Messaging and Community Commerce
- 12.3.8 Subsegment Pricing and Adoption Trends
- 12.3.9 Leading Suppliers and Competition
- 12.3.10 Regional Demand and Opportunities
- 12.4 By Deployment Model - Market Size and Forecast, 2025-2035
- 12.4.1 Segment Definition and Scope
- 12.4.2 Historical Market Size, 2018-2025
- 12.4.3 Revenue Forecast, 2025-2035
- 12.4.4 Volume Forecast, 2025-2035
- 12.4.5 Base-Year Market Share, 2025
- 12.4.6 Segment CAGR and Growth Drivers
- 12.4.7 Subsegment Market Size and Forecast
- 12.4.7.1 Native In-Platform Commerce
- 12.4.7.2 Social-to-Merchant Referral
- 12.4.7.3 Embedded Storefront Integration
- 12.4.7.4 Cross-Border Social Commerce
- 12.4.8 Subsegment Pricing and Adoption Trends
- 12.4.9 Leading Suppliers and Competition
- 12.4.10 Regional Demand and Opportunities
- 12.5 By End-Use Industry - Market Size and Forecast, 2025-2035
- 12.5.1 Segment Definition and Scope
- 12.5.2 Historical Market Size, 2018-2025
- 12.5.3 Revenue Forecast, 2025-2035
- 12.5.4 Volume Forecast, 2025-2035
- 12.5.5 Base-Year Market Share, 2025
- 12.5.6 Segment CAGR and Growth Drivers
- 12.5.7 Subsegment Market Size and Forecast
- 12.5.7.1 Fashion and Beauty
- 12.5.7.2 Consumer Electronics
- 12.5.7.3 Home and Lifestyle
- 12.5.7.4 Food and Specialty Retail
- 12.5.8 Subsegment Pricing and Adoption Trends
- 12.5.9 Leading Suppliers and Competition
- 12.5.10 Regional Demand and Opportunities
- 12.6 By State - Market Size and Forecast, 2025-2035
- 12.6.1 Segment Definition and Scope
- 12.6.2 Historical Market Size, 2018-2025
- 12.6.3 Revenue Forecast, 2025-2035
- 12.6.4 Volume Forecast, 2025-2035
- 12.6.5 Base-Year Market Share, 2025
- 12.6.6 Segment CAGR and Growth Drivers
- 12.6.7 Subsegment Market Size and Forecast
- 12.6.7.1 New South Wales
- 12.6.7.2 Victoria
- 12.6.7.3 Queensland
- 12.6.7.4 Western Australia
- 12.6.7.5 Rest of Australia
- 12.6.8 Subsegment Pricing and Adoption Trends
- 12.6.9 Leading Suppliers and Competition
- 12.6.10 Regional Demand and Opportunities
- 12.7 Segment Growth Comparison
- 12.8 Segment Attractiveness and Priority Matrix
Chapter 13 Australia Social Commerce End-Use and Application Market Outlook
- 13.1 End-Use Industry and Customer Demand Structure
- 13.2 Leading Applications and Customer Groups
- 13.3 End-Use Market Size, Share and Forecast
- 13.4 Major End-Use Industry Deep Dives
- 13.4.1 Customer Requirements and Use Cases
- 13.4.2 Demand and Replacement Cycles
- 13.4.3 Technical and Regulatory Considerations
- 13.4.4 Purchasing and Procurement Models
- 13.4.5 Leading Vendors and Distribution Channels
- 13.4.6 Forecast and Commercial Opportunities
- 13.5 Emerging Applications and Cross-Segment Demand
- 13.6 End-Use Industry Investment Priorities
Chapter 14 Australia Social Commerce Geographic Market Outlook, 2025-2035
- 14.1 Regional Market Size and Country-Level Shares, 2025
- 14.2 Country Market Size Comparison, 2025
- 14.3 Country Market Forecasts, 2025-2035
- 14.4 Subregional Industrial and Demand Clusters
- 14.5 Intra-Regional Pricing and Cost Differences
- 14.6 Cross-Border Trade and Supply Networks
- 14.7 Regional Supply and Demand Balances
- 14.8 Country Opportunity Comparison and Prioritization
Note: Every listed country is covered on the structure shown under the first country.
Chapter 15 Australia Social Commerce Technology, Innovation and Sustainability Outlook
- 15.1 Technology Landscape and Maturity
- 15.2 Product, Process and Service Innovation
- 15.3 AI, Automation and Digital Tools in the Industry
- 15.4 Technology Adoption and Performance Benchmarking
- 15.5 Innovation Pipeline and R&D Investment
- 15.6 Patent and Intellectual Property Trends
- 15.7 Energy Efficiency and Resource Management
- 15.8 Sustainability, Recycling and Circularity
- 15.9 Technology Roadmap, 2025-2035
- 15.10 Risks of Obsolescence and Technology Substitution
Chapter 16 Australia Social Commerce Market Key Strategic Imperatives
- 16.1 Growth and Market Entry Priorities
- 16.2 High-Return Products and Segments
- 16.3 Pricing, Profitability and Cost Optimization
- 16.4 Technology Investment and Product Differentiation
- 16.5 Supply Chain Localization and Resilience
- 16.6 Distribution and Customer Acquisition
- 16.7 Partnership, Acquisition and Capacity Strategy
- 16.8 Regional Expansion Priorities
- 16.9 Short-, Medium- and Long-Term Actions
Chapter 17 Competition Outlook
- 17.1 Industry Competition Characteristics
- 17.2 Market Structure and Concentration
- 17.3 Market Share and Competitive Positioning, 2025
- 17.4 Company-Wise Revenue and Product Benchmarking
- 17.5 Production and Service Capacity Benchmarking
- 17.6 Technology, Pricing and Differentiation
- 17.7 Regional Footprint and Distribution Strength
- 17.8 Mergers, Acquisitions and Strategic Alliances
- 17.9 New Entrants and Competitive Threats
- 17.10 Porter's Five Forces and Industry Attractiveness
- 17.11 Competitive Outlook, 2025-2035
Chapter 18 Company Profiles
- 18.1 Company Coverage and Selection Criteria
- 18.2 Meta Platforms
- 18.2.1 Business Description
- 18.2.2 Company Ownership and Geographic Presence
- 18.2.3 Product and Service Portfolio
- 18.2.4 Manufacturing and Operating Footprint
- 18.2.5 Production Capacity and Expansion Plans
- 18.2.6 Financial Performance and Investment
- 18.2.7 Market Share and Competitive Position
- 18.2.8 Technology and Innovation Capabilities
- 18.2.9 Strategic Alliances or Partnerships
- 18.2.10 Recent Developments
- 18.2.11 Growth Strategy and Outlook
- 18.3 ByteDance
- 18.4 Google
- 18.5 Pinterest
- 18.6 Snap Inc.
- 18.7 Linktree
- 18.8 Shopify
- 18.9 LTK
- 18.10 Other Relevant Market Participants
Note: Every listed company is profiled on the structure shown under the first company. The company list is preliminary and may change based on research findings, market developments, data availability and client requirements.
Chapter 19 Disclaimer
- 19.1 Research and Forecast Disclaimer
- 19.2 Data Source and Estimation Limitations
Note: The depth of individual sections depends on data availability for this market. Volume, capacity, trade and other unit-based metrics are included where applicable.

