
Smart TVs, ad tiers and local content lift paid viewing
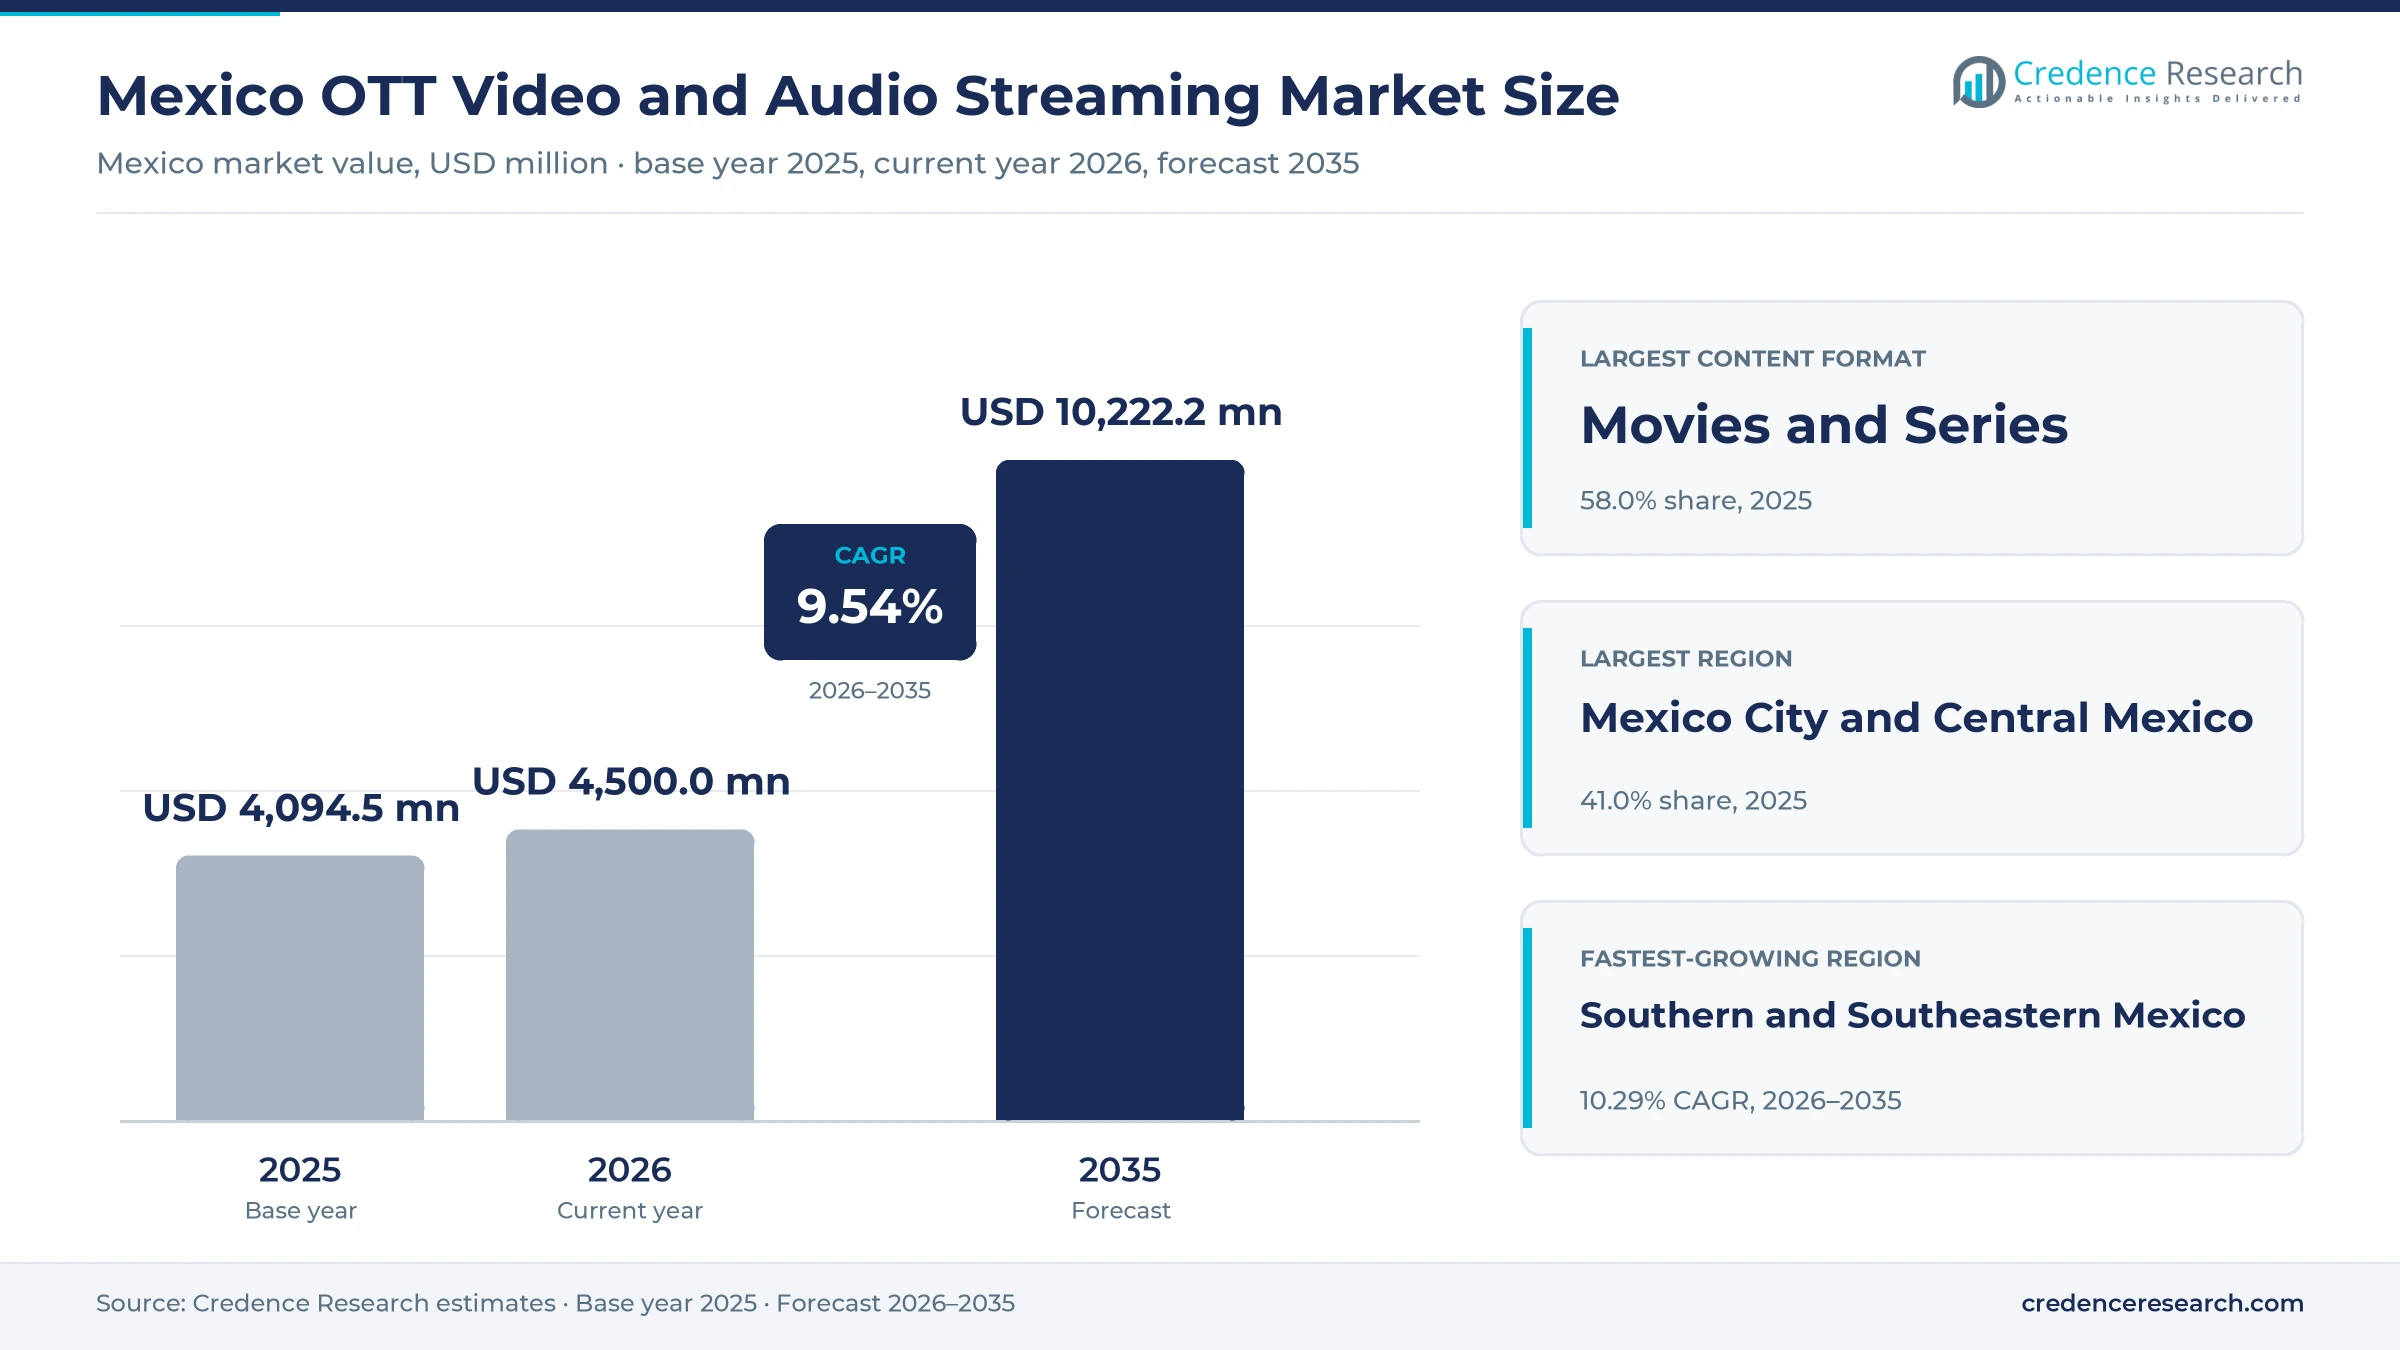
The Mexico OTT video and audio streaming market was valued at USD 4.09 billion in 2025 and is projected to increase from USD 4.50 billion in 2026 to USD 10.22 billion by 2035, registering a CAGR of 9.54% during 2026–2035. Demand comes from individuals and households that pay for series, films, live sports, music and podcasts on smart TVs and phones. Mexico City and Central Mexico held the largest share, 41.0% in 2025, because the capital region combines dense fiber networks with high household incomes. Southern and Southeastern Mexico is the fastest-growing region at 10.29% a year, as internet access spreads beyond large cities. Pricing also changed in 2024, when Disney+ and Max added cheaper plans with advertising. As a result, platforms now compete through ad-supported tiers, telecom bundles and local productions rather than only through premium monthly plans.
Which video and audio services are counted?
The estimate measures consumer and business spending on subscription, advertising-supported, transactional and bundled video and audio services delivered over the internet in Mexico. It counts series, films, live video, music and podcasts watched or heard on smart TVs, phones, computers and streaming devices. All values in the estimate are stated in USD million at current prices.
The estimate excludes traditional pay TV packages, free-to-air broadcasting, cinema tickets, live concerts and device sales. The value chain runs from studios, labels and sports leagues through streaming platforms, telecom operators and app stores to households, individual users and commercial venues.
Mexico OTT Video and Audio Streaming Market Insights
- The market was valued at USD 4.09 billion in 2025 and is projected to reach USD 10.22 billion by 2035, registering a CAGR of 9.54% during 2026–2035.
- Mexico City and Central Mexico held 41.0% of national value in 2025, supported by dense fiber networks and high incomes.
- Movies and series led with 58.0% of 2025 value, because most households subscribe for scripted shows, films and local productions.
- INEGI counted 104.9 million internet users aged 6 and over in 2025, or 86.1% of the population, and 36.4% of households had a streaming service.
- Netflix announced on Feb. 20, 2025 that it would invest $1 billion in Mexican series and films from 2025 through 2028.
Series, subscriptions and smart TVs lead streaming value
Why do series and films lead viewing value?
Based on content format, the market is categorized into movies and series, live video, music streaming and podcasts and spoken audio. Movies and Series led with 58.0% of 2025 value, because most homes subscribe for scripted shows and films. Live Video grows fastest at 10.63% a year, as football, boxing and events move online, while music subscription services keep adding paying listeners.
How fast are ad-supported plans gaining?
Based on revenue model, the market is categorized into subscription, advertising-supported, transactional and bundled and freemium services. Subscription led with 62.0% of 2025 value, because most platforms still earn mainly from monthly plans. Advertising-Supported services grow fastest at 10.77% a year, as cheaper plans with ads attract price-sensitive households and give brands new video inventory.
Which screens carry most streaming use?
Based on access device, the market is categorized into smart TVs and connected TVs, smartphones, computers and tablets and streaming devices and consoles. Smart TVs and Connected TVs led with 44.0% of 2025 value and grow fastest at 9.93% a year, because families watch paid video together on large screens. Sticks and boxes sold as connected TV devices still upgrade older sets.
How do services reach Mexican households?
Based on distribution channel, the market is categorized into direct-to-consumer applications, telecom bundles, device and app ecosystems and aggregators. Direct-to-Consumer Applications led with 63.0% of 2025 value, because most users subscribe directly inside each app. Telecom Bundles grow fastest at 10.45% a year, as pay TV, mobile and broadband providers combine several apps under one monthly bill, often with discounted ad-supported tiers.
| Segment Group | Leading Sub-segment | Share, 2025 | Fastest-growing Sub-segment | CAGR, 2026–2035 |
|---|---|---|---|---|
| By Content Format | Movies and Series | 58.0% | Live Video | 10.63% |
| By Revenue Model | Subscription | 62.0% | Advertising-Supported | 10.77% |
| By Access Device | Smart TVs and Connected TVs | 44.0% | Smart TVs and Connected TVs | 9.93% |
| By Distribution Channel | Direct-to-Consumer Applications | 63.0% | Telecom Bundles | 10.45% |
Request a Free Sample
Fill in your details and we'll send you a free sample report.
- Sample data tables & charts
- Research methodology
Connectivity, bundles and local production drive demand
How does wider connectivity expand the paying audience?
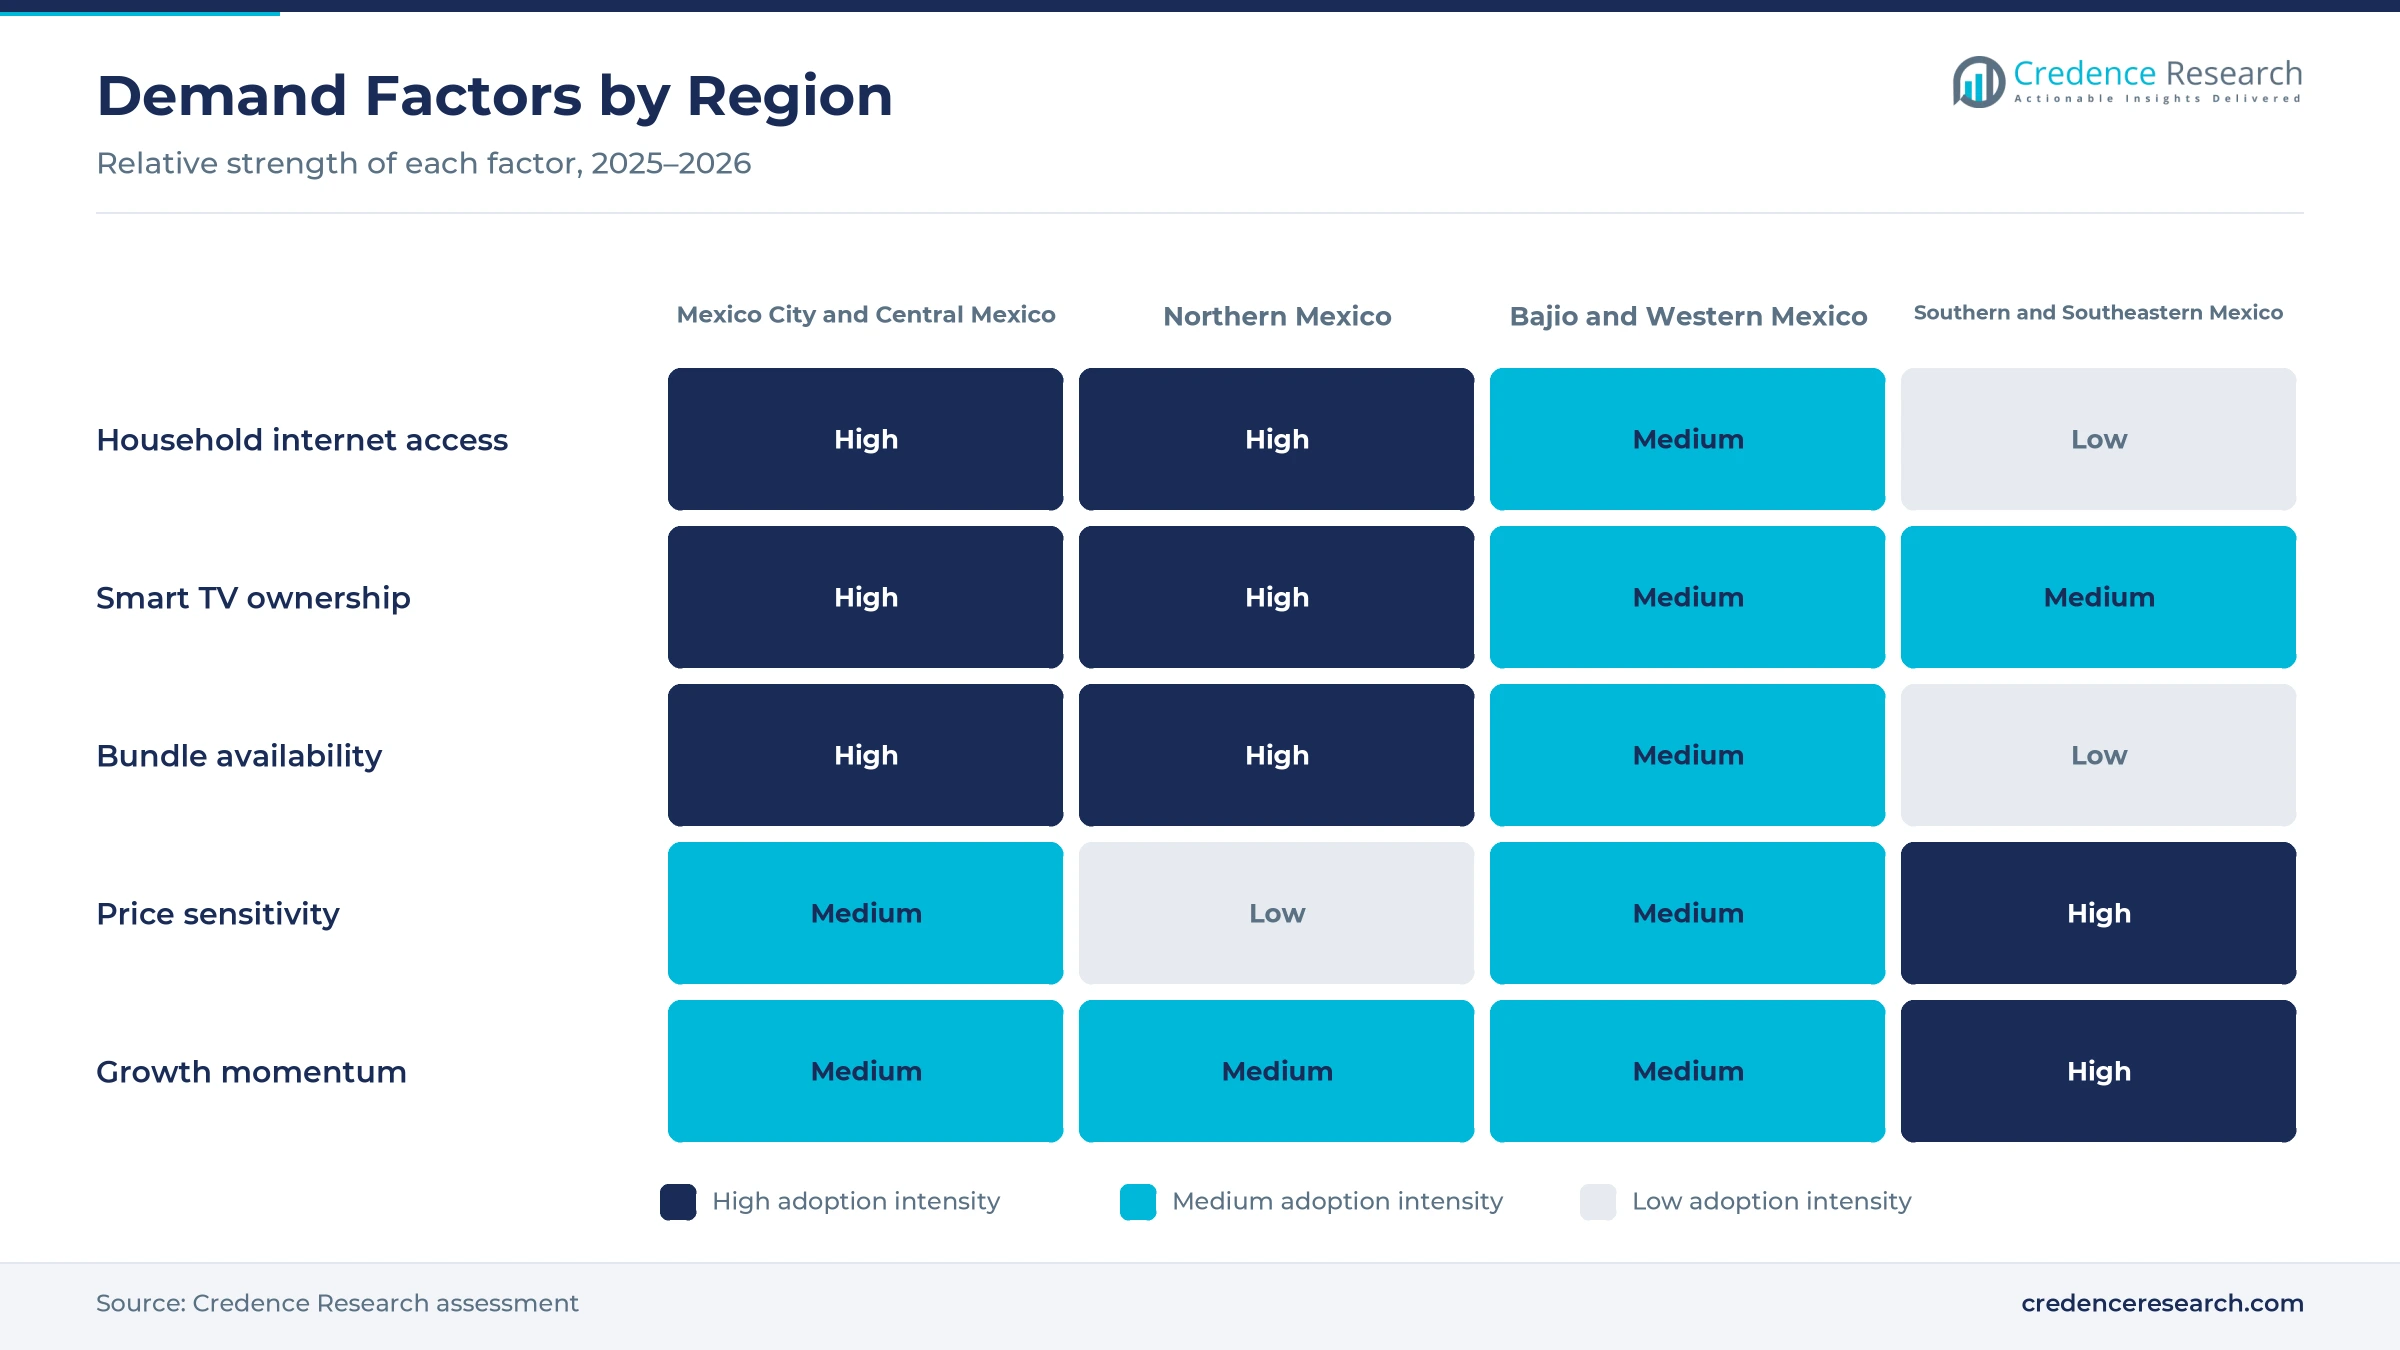
Expanding connectivity and connected-device reach drive demand, because each new home online becomes a possible subscriber. Mexico counted 104.9 million internet users aged 6 and over in 2025, or 86.1% of the population, according to INEGI's ENDUTIH 2025 survey. The same survey found that 75.6% of households owned at least one smart TV, up 6.6 points from 2024, and that half of all internet users went online through a smart TV. Internet use rose from 69.6% of the population in 2019 to 83.1% in 2024, according to World Bank data. As a result, smart TVs hold 44.0% of 2025 value.
Why do hybrid pricing and telecom bundles widen reach?
Hybrid pricing and telecom bundling drive demand, because they lower the entry price and simplify payment for households. Totalplay offered a 1,000-megabit package with Netflix, Disney+, HBO Max, Universal+ and Apple TV for 1,000 pesos a month in August 2026, according to Xataka México. Telcel has sold Max Play mobile plans with Netflix and Claro video since September 2020, which shows how long carriers have used streaming to win customers. Netflix raised its Standard plan from 249 to 269 pesos and its Premium plan from 329 to 369 pesos for current members from April 13, 2026. Therefore, telecom bundles grow fastest among sales channels at 10.45% a year.
How does local production strengthen subscriber loyalty?
The strength of local content drives demand, because Spanish-language series and films keep subscribers loyal. Netflix said on Feb. 20, 2025 that it would invest $1 billion in Mexican series and films from 2025 through 2028, according to Screen Global Production. The company also pledged $2 million to upgrade Churubusco Studios and has shot productions in 25 Mexican states. Its Mexico team grew from about 30 people in 2019 to nearly 400, and Pedro Páramo added more than 375 million pesos to national output. In turn, movies and series hold 58.0% of 2025 value, as local titles draw viewers to paid plans.
Why does household adoption still have room to grow?
Household streaming adoption still has room to grow, because many connected homes do not yet pay for a service. INEGI estimated that 36.4% of households had a streaming service in 2025, up 4.0 points from 2024, while 78.3% of households, or 31.1 million, had internet. This gap of more than 40 points means that millions of connected homes remain potential subscribers. The survey also found that 77.8% of smartphone users accessed audio and video content, which shows strong interest in viewing on phones. As a result, cheaper plans and bundles can turn more connected homes into paying ones through 2035.
Ad tiers, live sports and music reshape viewing habits
How is the shift to ad-supported plans changing prices?
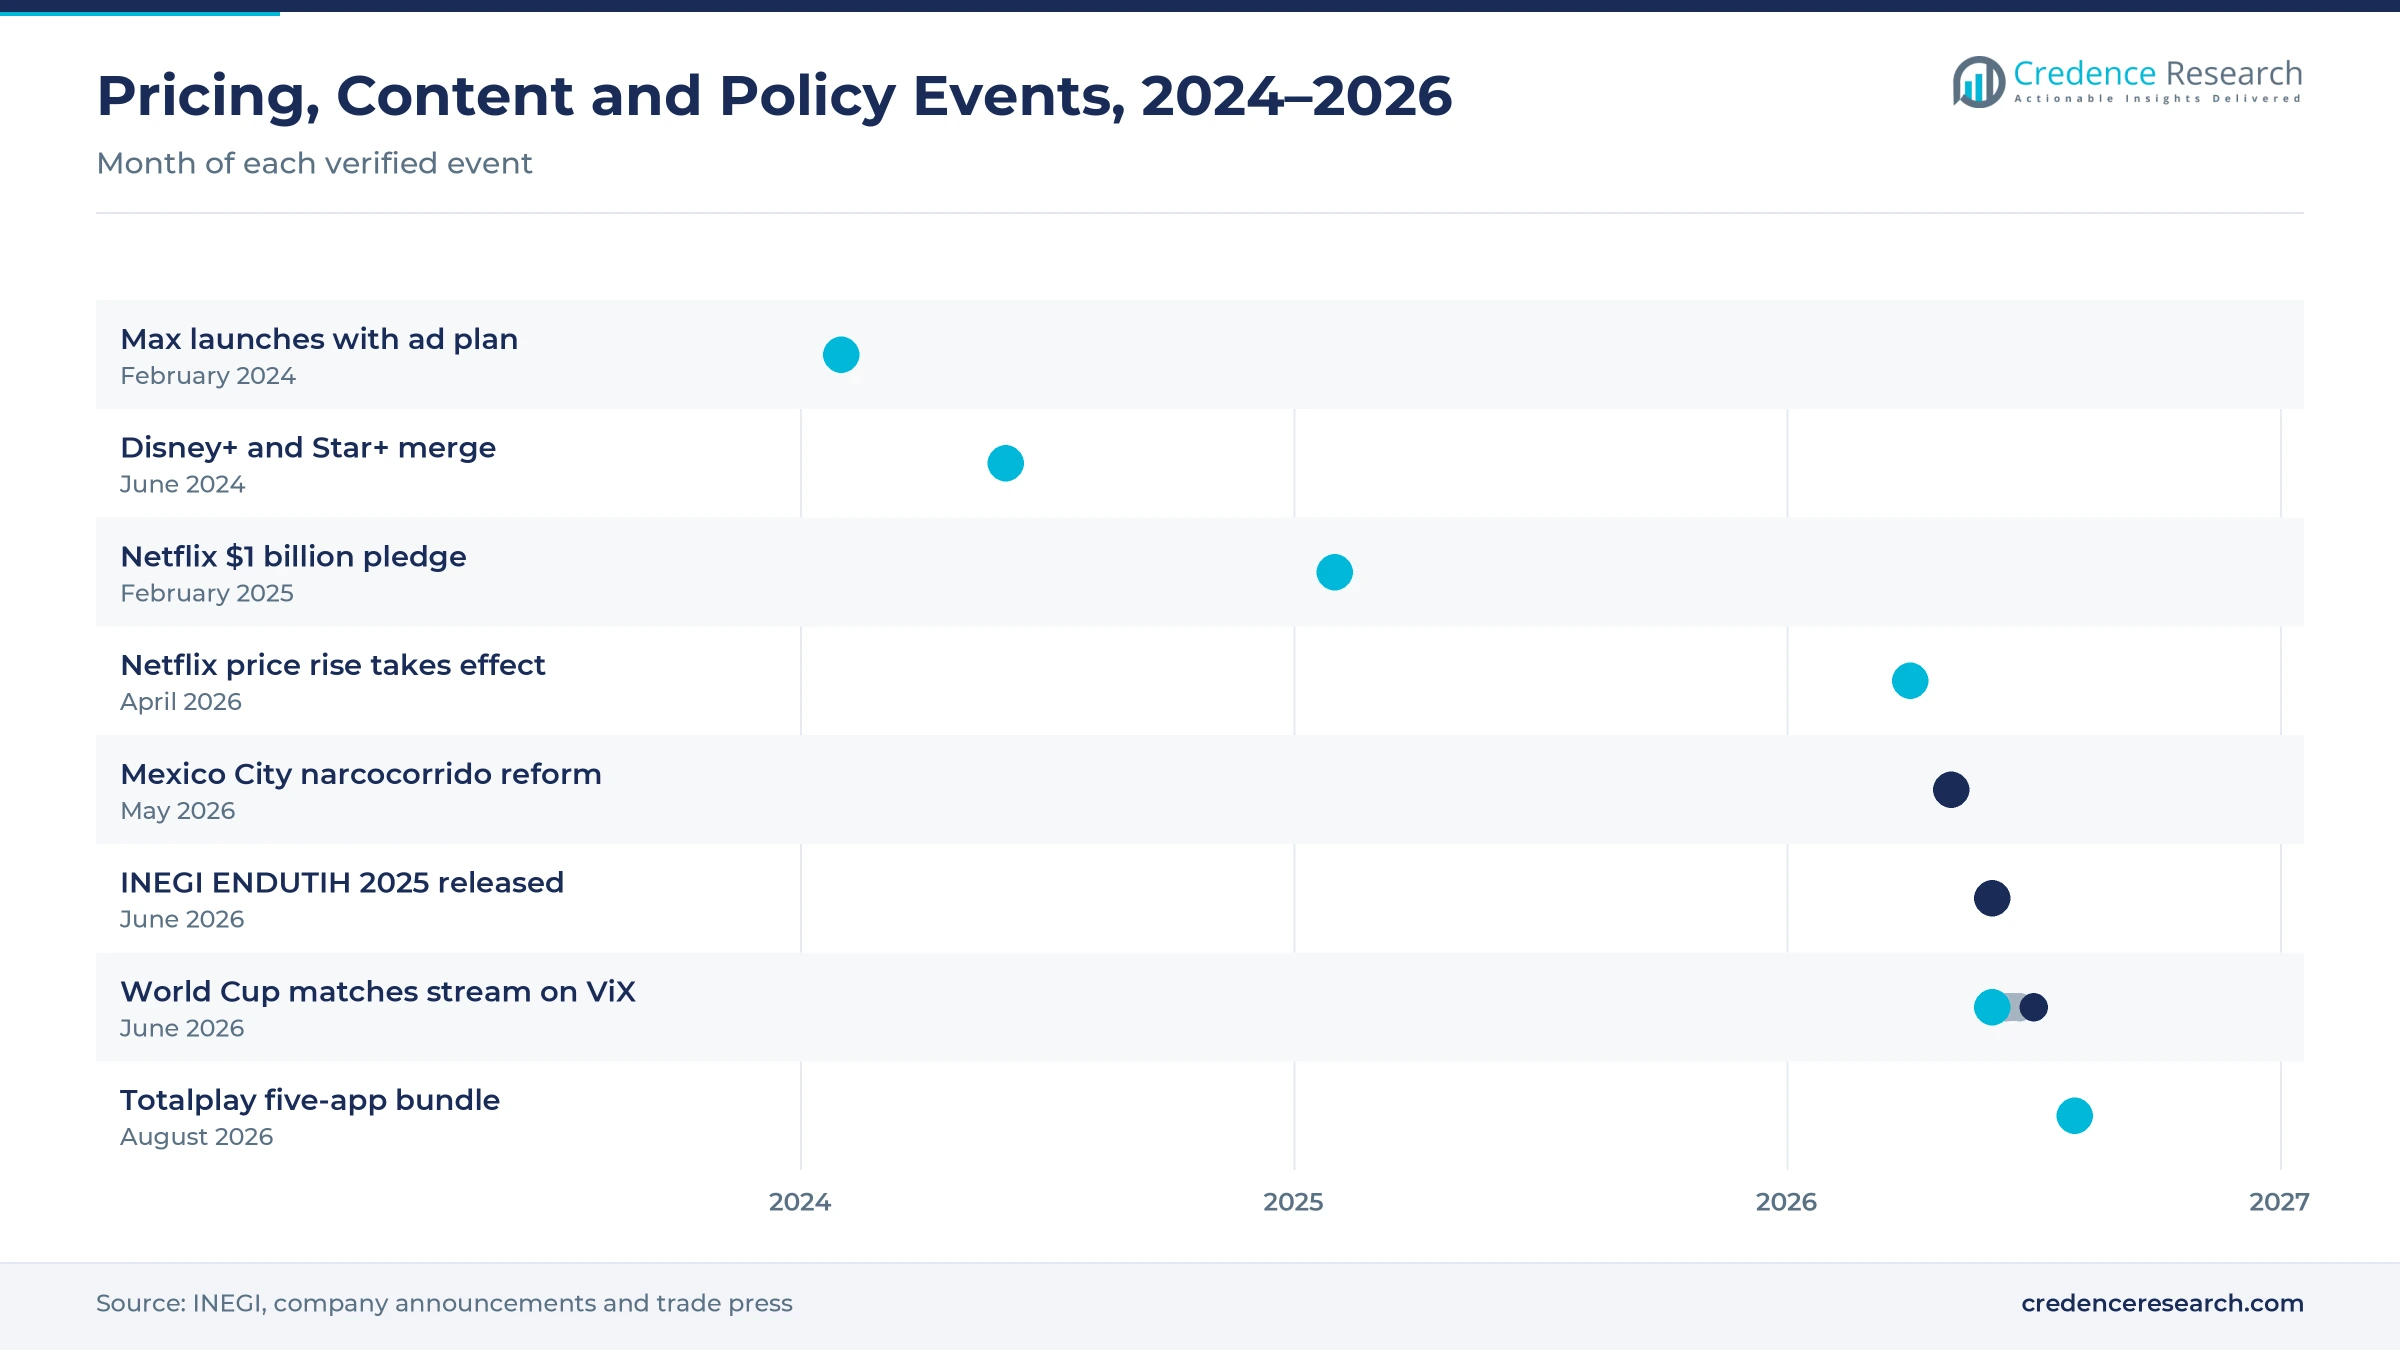
The shift to ad-supported plans is changing prices, because platforms want lower entry points without cutting margins. Max launched in Mexico on Feb. 27, 2024 with a Basic with Ads plan at 149 pesos a month. Disney+ merged with Star+ on June 26, 2024 and added a Standard with Ads plan in Mexico and four other Latin American countries. Prime Video began showing ads in Mexico in 2024, and Netflix raised its ad plan from 119 to 139 pesos in April 2026, which keeps it well below its 269-peso Standard plan. As a result, advertising-supported services grow fastest among revenue models at 10.77% a year.
Why is the rise of live sports streaming notable?
The rise of live sports streaming is notable, because football draws large audiences that pay for short-term passes and annual plans. ViX Premium carried all 104 matches of the 2026 World Cup, while TV Azteca streamed its 32 matches free online and TUDN carried about 72 matches for pay TV subscribers. Mexico played Czechia on June 24, 2026 at Estadio Azteca, one of the matches hosted in the country. These rights deals link live sports platforms with free-to-air and pay TV broadcasters, which widens the paying audience for each tournament. Therefore, live video grows fastest among content formats at 10.63% a year.
Can music exports open new audio revenue?
Music exports open a clear opening, because Mexican artists and regional genres attract listeners at home and abroad. Mexico ranked as the world's 10th-largest recorded music market in 2025, with revenue up 13.3%, according to IFPI data reported by Interspace Music. Latin American recorded music revenue grew 17.1% in 2025, the 16th straight year of growth, and streaming made up 88.1% of it. These figures show that paid and ad-supported audio is now the main way music earns money for labels and artists in the region. In turn, music streaming and podcasts can lift premium subscriptions and ad revenue for audio platforms through 2035.
Is there room to grow in southern Mexico?
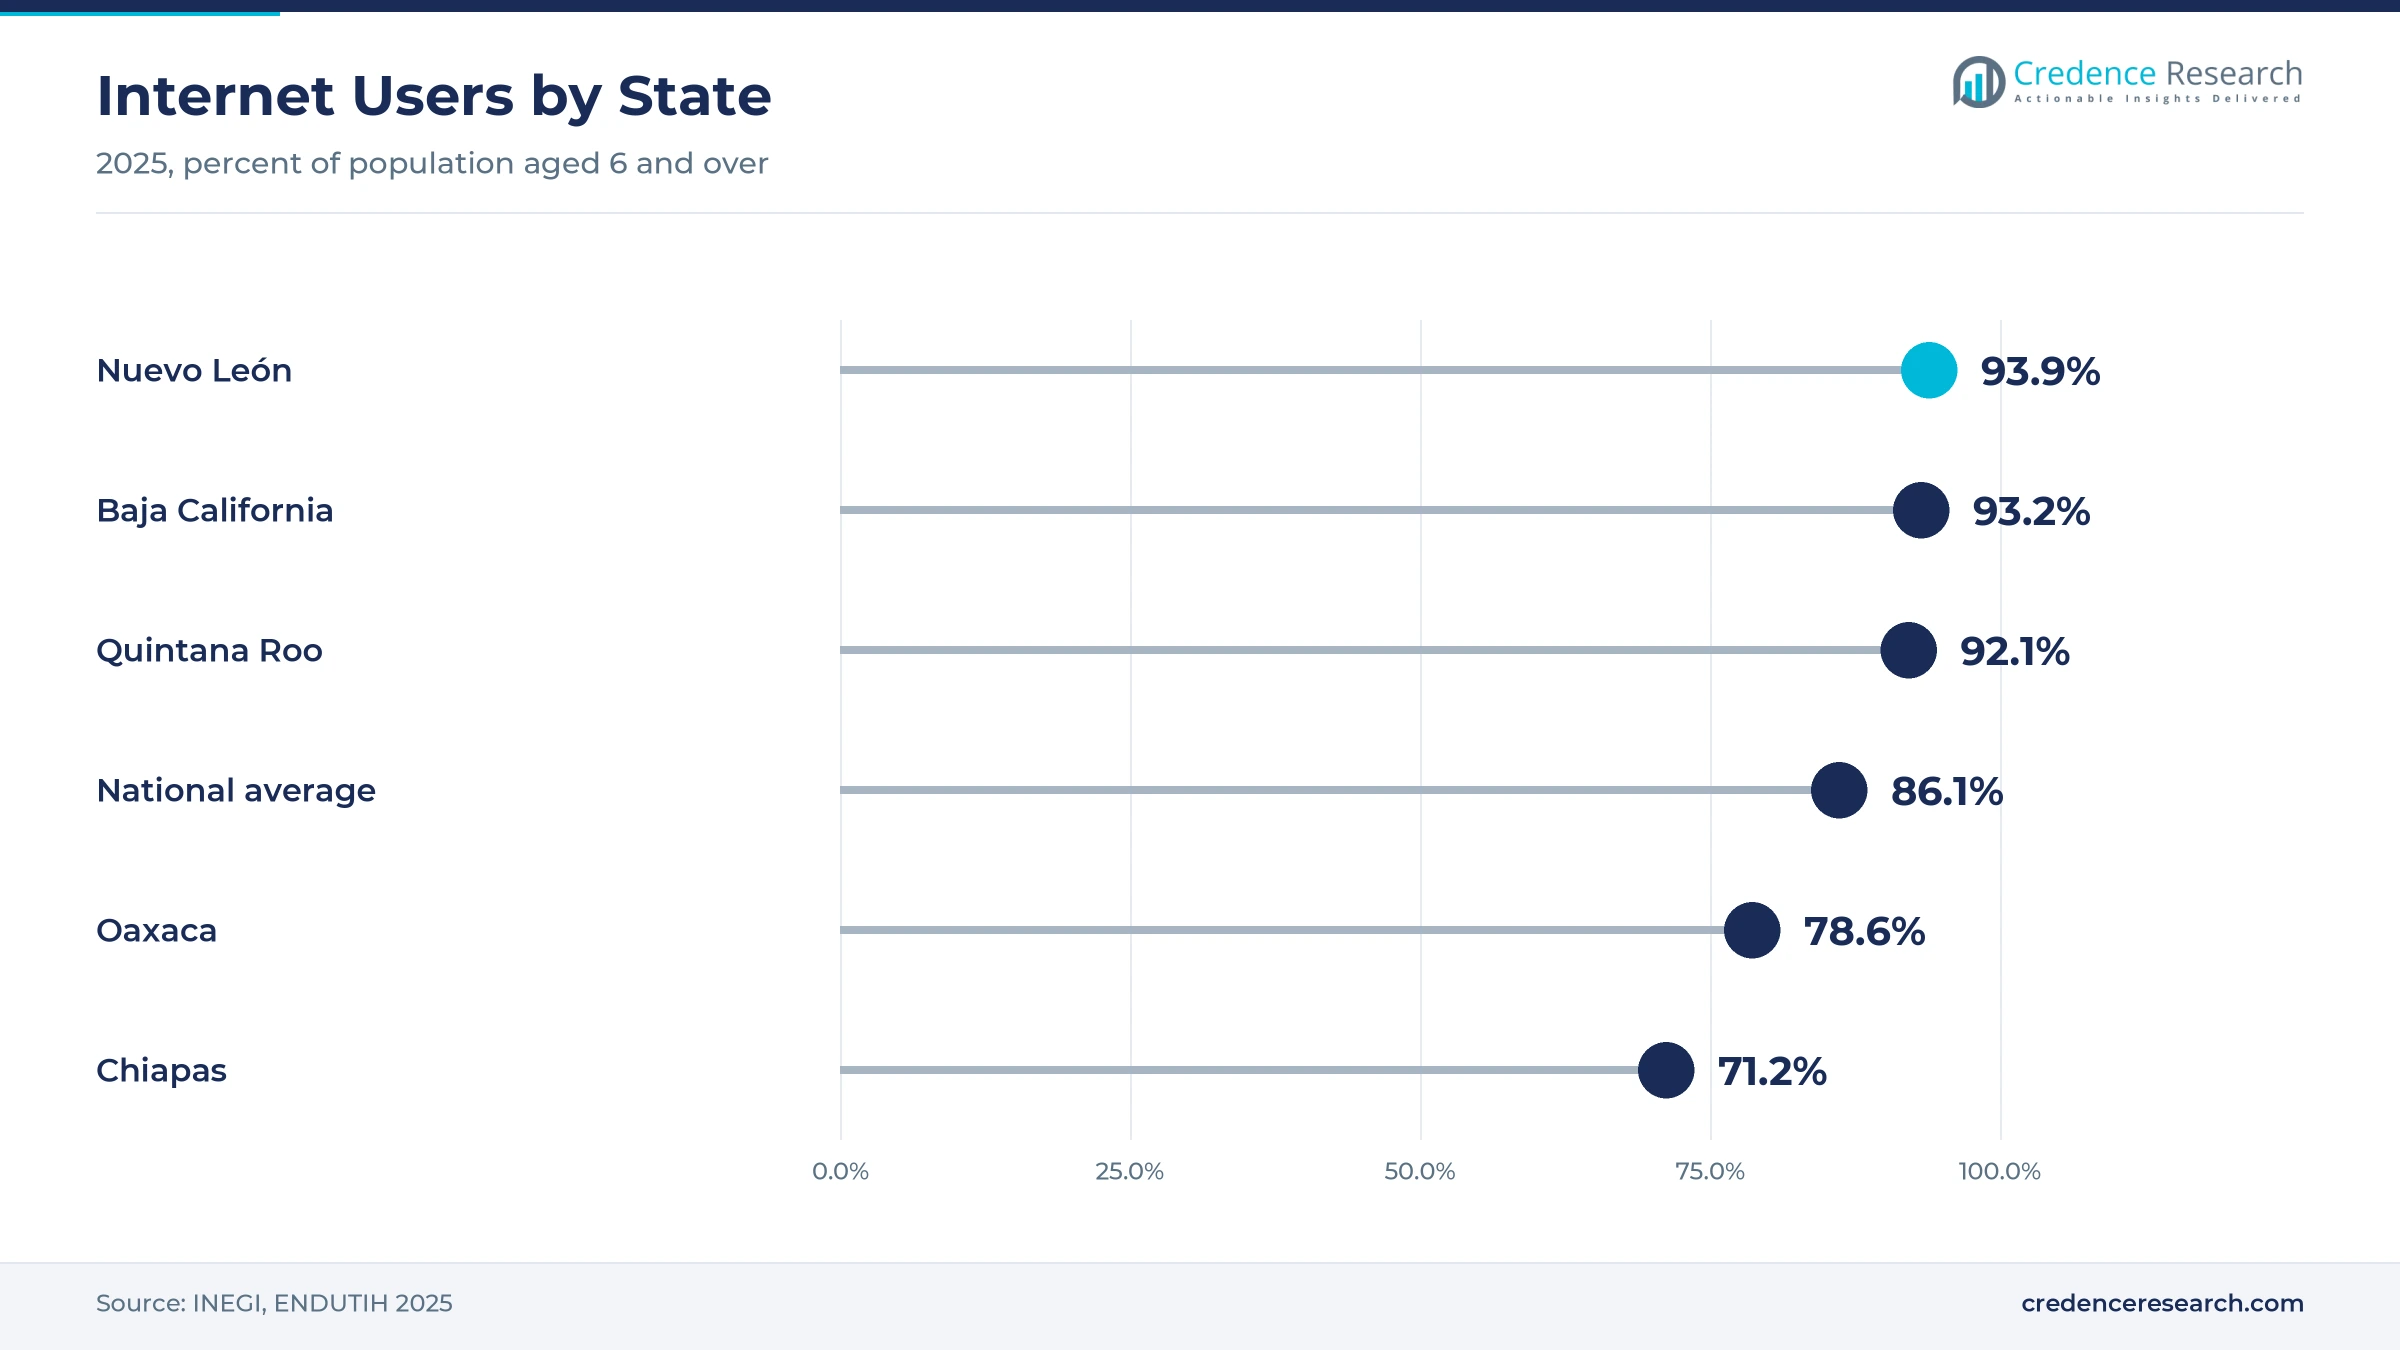
Southern and Southeastern Mexico is a second opening, because internet access there is rising from a lower base. Chiapas had the lowest share of internet users in 2025 at 71.2%, and Oaxaca reached 78.6%, compared with 86.1% nationally. Quintana Roo, by contrast, reached 92.1%, the third-highest share in the country, helped by tourism, hotels and service jobs in Cancún and nearby resort cities. The region held 14.0% of 2025 value in the Credence Research model. Therefore, platforms that offer mobile plans, low prices and regional content can win new households faster than in saturated northern cities such as Monterrey.
Price rises, coverage gaps and rights costs test platforms
How do price rises risk subscriber churn?
Price rises risk subscriber churn, because many households already pay for several services and watch their monthly budgets. Netflix raised every plan in Mexico in April 2026, including its ad plan, which followed earlier increases. As a result, some users rotate subscriptions, cancel after a hit series or share accounts. Platforms can respond with annual plans, cheaper ad tiers and bundles, although each option reduces the revenue earned from every subscriber.
Why do coverage gaps limit the audience?
Coverage gaps limit the audience, because high-quality video needs stable broadband that many rural homes still lack. INEGI found that only 71.2% of people in Chiapas used the internet in 2025, well below the national level. This means that southern and rural households often watch on phones with limited data. Mobile-first plans, lower video quality settings and downloads for offline viewing help platforms serve these users until fixed networks improve.
How do content and rights costs squeeze margins?
Content and rights costs squeeze margins, because local series, films and sports rights become more expensive as platforms compete for the same viewers. Netflix alone plans to spend $1 billion on Mexican productions through 2028. In turn, smaller platforms struggle to match the volume of new titles. Partnerships with broadcasters, shared sports rights and licensing of library titles help firms spread these costs across more viewers and channels.
Why do content rules add uncertainty for music?
Content rules add uncertainty for music, because at least 10 Mexican states restrict narcocorridos at public events. Mexico City joined them when its Congress approved a reform on May 26, 2026. This means that artists in a popular regional genre face limits on live shows, which can reduce promotion of their releases. Platforms respond by widening their regional Mexican catalogs and promoting artists across several genres, although the rules may still widen over time.
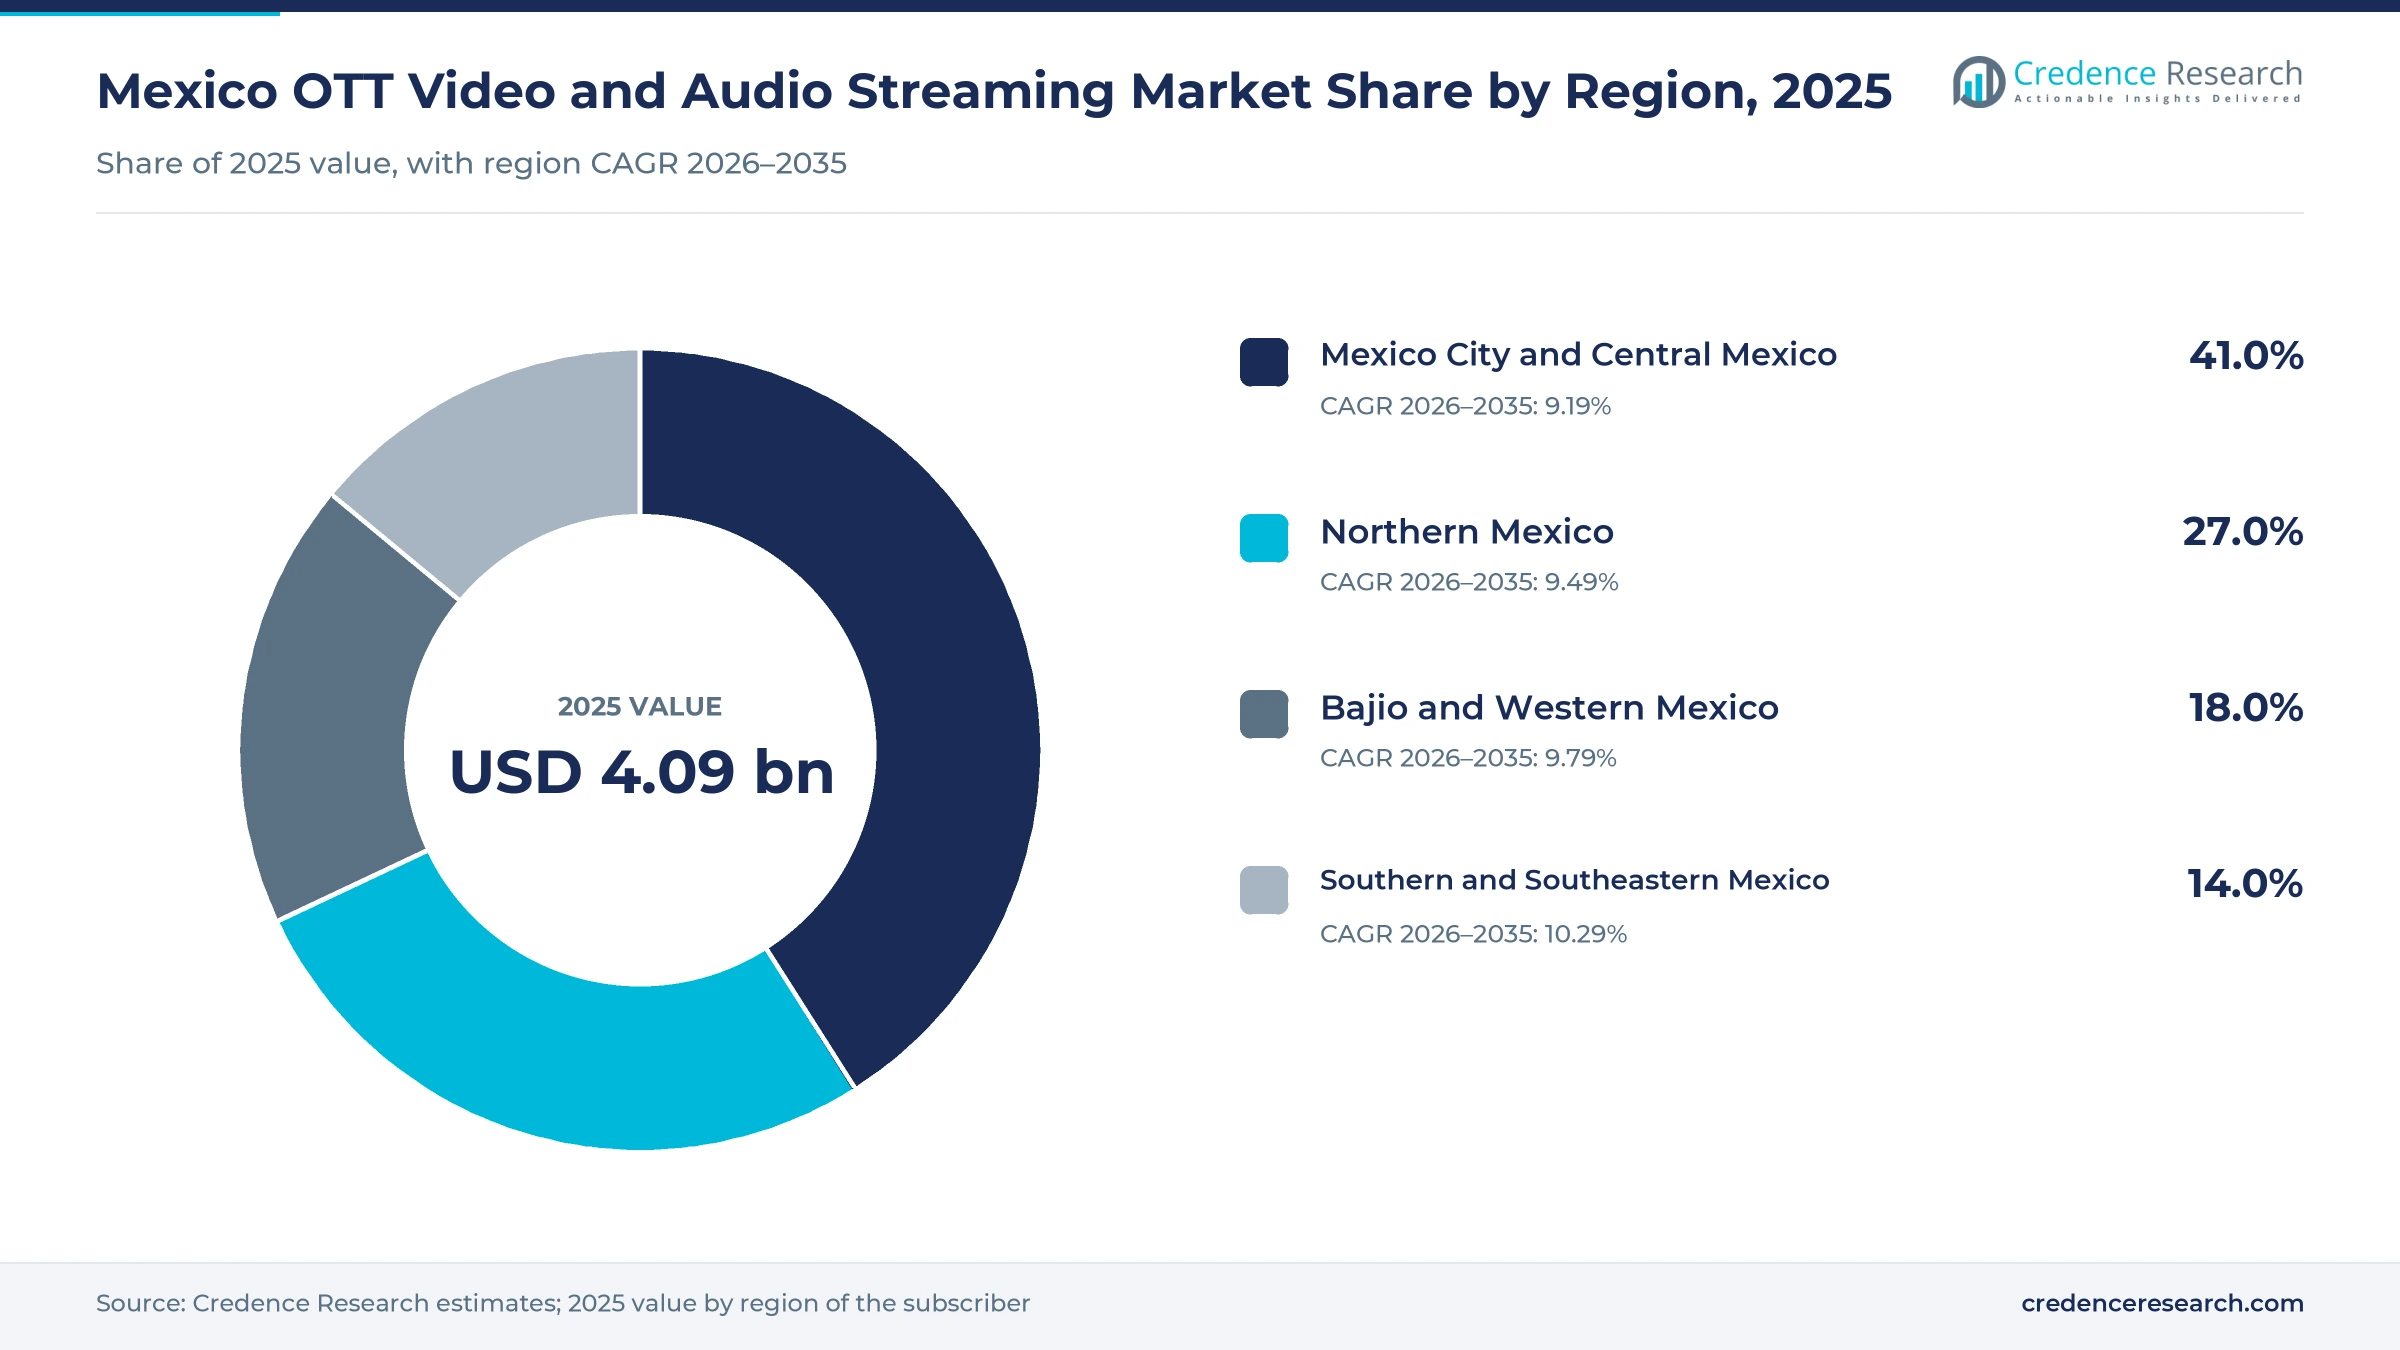
Central Mexico leads while the south grows fastest
| Region | Value, 2025 (USD billion) | Share, 2025 | CAGR, 2026–2035 |
|---|---|---|---|
| Mexico City and Central Mexico | 1.68 | 41.0% | 9.19% |
| Northern Mexico | 1.11 | 27.0% | 9.49% |
| Bajio and Western Mexico | 0.74 | 18.0% | 9.79% |
| Southern and Southeastern Mexico | 0.57 | 14.0% | 10.29% |
Why does Mexico City and Central Mexico hold the largest share?
Mexico City and Central Mexico held 41.0% of 2025 value and grows at 9.19% a year in the regional demand model. Mexico City had internet in 90.5% of households in 2025, one of the highest levels in the country. The region also hosts most production studios, including Churubusco Studios and many company offices, which supports strong demand for premium plans, multiple subscriptions per home and live sports passes.
What sustains demand in northern Mexico?
Northern Mexico held 27.0% of 2025 value and grows at 9.49% a year in the regional demand model. Nuevo León had the highest share of internet users in 2025 at 93.9%, and Baja California followed at 93.2%. Higher industrial wages in Monterrey, Tijuana and other border cities support multiple subscriptions per home, while many households also watch services sold in the United States. Fiber bundles from cable and telecom operators are widely available in these cities.
How does the Bajio and Western Mexico add demand?
Bajio and Western Mexico held 18.0% of 2025 value and grows at 9.79% a year in the regional demand model. Guadalajara, León and Querétaro have growing manufacturing and service jobs that raise incomes, which supports demand for bundles and premium plans. Jalisco is also a center for regional Mexican music, which supports audio streaming and podcasts, while Guanajuato and Querétaro add new suburbs where fiber networks are expanding.
Why is southern and Southeastern Mexico growing fastest?
Southern and Southeastern Mexico held 14.0% of 2025 value and grows fastest at 10.29% a year in the regional demand model. Quintana Roo reached 92.1% internet use in 2025, while Oaxaca and Chiapas remained below 80%, which leaves room for mobile and bundled plans.
Price changes, mergers and a Netflix pledge marked 2024-26
| Development | Status and market relevance |
|---|---|
| In February 2024, Max launched in Mexico and Latin America with a Basic with Ads plan priced at 149 pesos a month. | Replaced HBO Max with a larger library and three plans |
| In June 2024, Disney merged Star+ into Disney+ in Latin America and introduced a Standard with Ads plan. | Added ESPN live sports inside the Disney+ app |
| In February 2025, Netflix announced a $1 billion investment in Mexican series and films for 2025 through 2028. | Includes $2 million to upgrade Churubusco Studios |
| In March 2026, Netflix announced higher prices in Mexico for its ad, Standard and Premium plans. | Effective for current members from April 13, 2026 |
| In August 2026, Totalplay offered a 1,000-megabit package bundling Netflix, Disney+, HBO Max, Universal+ and Apple TV. | Priced at 1,000 pesos a month with prompt payment |
Smart TVs, ad tech and fiber bundles shape the service
- Smart TV operating systems put apps on the main screen of 75.6% of households, which makes the living room the main place to watch.
- Ad insertion and measurement tools let platforms sell cheaper plans with ads and give advertisers audience data by region.
- Fiber and gigabit bundles carry high-definition and 4K video, and new data center capacity brings content closer to viewers.
- Offline downloads and adaptive quality help mobile users in areas with weak coverage keep watching with limited data plans.
Need a Custom Version of This Report?
Tailor the scope, geography, or segments to your exact requirements.
- Custom geography or segment scope
- Direct access to our analyst team
Global apps, ViX and telecom bundles compete for homes
Competition combines global subscription apps, a strong Spanish-language platform and telecom groups that bundle services. Netflix leads in scripted content and is investing $1 billion in Mexican productions through 2028. Disney+ combines family titles with ESPN sports after its 2024 merger with Star+, while Max, now sold again as HBO Max, competes on premium series. Amazon Prime Video added ads in 2024 and ties video to shopping memberships. ViX, owned by TelevisaUnivision, competes on Spanish-language shows and sports, carrying all 104 World Cup matches in 2026. Claro video reaches users through Telcel plans, and Apple TV is part of the Totalplay bundle. YouTube and YouTube Music, Spotify, Apple Music and Paramount+ are also profiled as major services. Rivals compete on local content, sports rights, price tiers and bundle partners.
Companies profiled and their roles in this market
| Company | Type | Role in the market |
|---|---|---|
| Netflix | Global subscription platform | Pledged $1 billion for Mexican series and films from 2025 through 2028 |
| Disney+ | Global subscription platform | Merged Star+ into Disney+ in June 2024 and added an ad plan |
| Max | Global subscription platform | Launched in Mexico in February 2024 with a 149-peso ad plan |
| Amazon Prime Video | Global subscription platform | Began showing ads to members in Mexico in 2024 |
| ViX | Spanish-language platform | Carried all 104 matches of the 2026 World Cup on ViX Premium |
| Claro video | Telecom-owned platform | Included in Telcel Max Play mobile plans since 2020 |
Credence Research view on ad-led, bundled growth
Credence Research's view is that Mexico OTT video and audio streaming value will grow through cheaper ad tiers, bundles and live sports rather than through premium plans alone. Smart TVs already reach three in four households, so the main task is to convert connected homes into paying ones. The south adds the most new users as access improves. Local productions and music exports strengthen loyalty, while price rises and rights costs push platforms toward partnerships.
How the national estimate was built
The report uses 2025 as the base year, with values in USD million at current prices. Market values come from the Credence Research model, and regional, content format, revenue model, access device and distribution channel splits are Credence Research estimates. Inputs include INEGI survey data, World Bank data, company announcements, price lists reported by trade press and music industry data. Regional shares are estimates built from population, internet access and income by state. No interviews or surveys were used in preparing these estimates.
Ad tiers and southern households lead growth to 2035
The Mexico OTT video and audio streaming market is expected to reach USD 10.22 billion by 2035, a 9.54% CAGR during 2026–2035, as ad tiers, bundles and live video keep value rising. Southern and Southeastern Mexico should gain the most share, while Mexico City and Central Mexico stay the largest region. Advertising-supported plans are expected to grow faster than standard monthly subscriptions through 2035. Sharp price rises or weaker household incomes would lower this outlook, while faster broadband rollout in the south would raise it.
Frequently Asked Questions
How big is the Mexico OTT video and audio streaming market?
Which region leads streaming demand in Mexico?
Which region grows fastest?
Which content format holds the largest share?
How many Mexicans use the internet?
Which revenue model grows fastest?
Who are the main companies in the market?
How much is Netflix investing in Mexico?
Table of Content
Chapter 1 Market Segmentation
- 1.1 Segmentation Framework
- 1.1.1 Product and Service Classification
- 1.1.2 Application and End-Use Classification
- 1.1.3 Technology and Solution Classification
- 1.1.4 Customer and Distribution Channel Classification
- 1.1.5 Geographic Segmentation
- 1.1.6 Market Segment Definitions and Boundaries
- 1.2 By Content Format
- 1.2.1 Movies and Series
- 1.2.2 Live Video
- 1.2.3 Music Streaming
- 1.2.4 Podcasts and Spoken Audio
- 1.3 By Revenue Model
- 1.3.1 Subscription
- 1.3.2 Advertising-Supported
- 1.3.3 Transactional
- 1.3.4 Bundled and Freemium
- 1.4 By Access Device
- 1.4.1 Smart TVs and Connected TVs
- 1.4.2 Smartphones
- 1.4.3 Computers and Tablets
- 1.4.4 Streaming Devices and Consoles
Chapter 2 Introduction
- 2.1 Report Objectives and Scope
- 2.2 Product Definition and Industry Terminology
- 2.3 Market Inclusions and Exclusions
- 2.4 Research Process
- 2.4.1 Primary Research and Expert Interviews
- 2.4.2 Secondary Research and Source Review
- 2.4.3 Top-Down and Bottom-Up Estimation
- 2.4.4 Data Triangulation and Verification
- 2.5 Market Size Measurement Basis
- 2.5.1 2025: USD 4.09 billion → 2035: USD 10.22 billion
- 2.6 Historical and Forecast Reference Periods
- 2.6.1 Historical Period: 2018-2025
- 2.6.2 Base Year: 2025
- 2.6.3 Forecast Period: 2025-2035
- 2.7 Research Assumptions and Limitations
Chapter 3 Executive Summary
- 3.1 Market Snapshot and Key Findings
- 3.2 Base-Year Market Size, 2025
- 3.3 Forecast Market Size, 2035
- 3.4 Revenue and Volume Growth Outlook
- 3.5 Key Demand and Supply Indicators
- 3.6 Leading Market Segments
- 3.7 Fastest-Growing Market Opportunities
- 3.8 Regional Performance Highlights
- 3.9 Technology and Industry Transformation
- 3.10 Competitive Landscape Summary
- 3.11 Analyst View and Strategic Implications
Chapter 4 Mexico OTT Video and Audio Streaming Market Trends and Developments
- 4.1 Historical Industry Development, 2018-2025
- 4.2 Recent Market Trends and Developments
- 4.3 Demand and Customer Behavior Trends
- 4.4 Technology and Product Innovation
- 4.5 Artificial Intelligence, Automation and Digitalization
- 4.6 Local Manufacturing and Supply Chain Realignment
- 4.7 Industry Partnerships, Mergers and Acquisitions
- 4.8 Sustainability and Circular Economy Developments
- 4.9 Government and Private Sector Investment Trends
- 4.10 Emerging Business Models and Commercialization
- 4.11 Industry Developments and Announcements
Chapter 5 Mexico OTT Video and Audio Streaming Market Production, Supply and Demand Analysis
- 5.1 Demand Trend and Consumption Analysis, 2018-2025
- 5.2 Demand Forecast, 2025-2035
- 5.3 Production and Output Trend, 2018-2025
- 5.4 Production and Output Forecast, 2025-2035
- 5.5 Installed Capacity and Capacity Utilization
- 5.6 Company-Wise Production Plants and Statistics
- 5.6.1 Installed Production Capacity
- 5.6.2 Actual Production
- 5.6.3 Planned Capacity and Expansion Targets
- 5.7 Supply Chain Structure and Procurement Trends
- 5.8 Supply-Demand Gap and Bottlenecks
- 5.9 Import Dependence and Sourcing Structure
- 5.10 Contract Manufacturing and Outsourcing
- 5.11 Regional Supply and Demand Concentration
Chapter 6 Mexico OTT Video and Audio Streaming Market Pricing Analysis
- 6.1 Pricing Structure and Measurement
- 6.2 Historical Pricing Trends, 2018-2025
- 6.3 Pricing Outlook, 2025-2035
- 6.4 Average Selling Price and Unit Economics
- 6.5 Pricing by Product and Market Segment
- 6.6 Geographic Pricing Differences
- 6.7 Key Input, Energy, Labor and Logistics Costs
- 6.8 Contract Pricing and Purchasing Models
- 6.9 Pricing Sensitivity and Competitive Positioning
- 6.10 Price, Margin and Profitability Implications
Chapter 7 Mexico OTT Video and Audio Streaming Market Dynamics
- 7.1 Market Growth Drivers
- 7.1.1 Demand-Side Drivers
- 7.1.2 Technology and Innovation Drivers
- 7.1.3 Infrastructure and Investment Drivers
- 7.1.4 Regulatory and Policy Drivers
- 7.2 Market Restraints
- 7.2.1 Cost and Affordability Constraints
- 7.2.2 Technology and Adoption Barriers
- 7.2.3 Supply Chain and Operational Constraints
- 7.3 Market Challenges
- 7.3.1 Competitive Pressure and Margin Erosion
- 7.3.2 Skills, Infrastructure and Implementation Gaps
- 7.4 Emerging Market Opportunities
- 7.5 Market Dynamics Impact and Time-Horizon Assessment
Chapter 8 Mexico OTT Video and Audio Streaming Value Chain Analysis
- 8.1 Industry Value Chain Overview
- 8.2 Upstream Suppliers and Critical Inputs
- 8.3 Technology and Component Providers
- 8.4 Manufacturing or Service Delivery
- 8.5 Distribution, Channel Partners and Integrators
- 8.6 Downstream Applications and End Users
- 8.7 Value Addition and Profit Pools
- 8.8 Vertical Integration and Outsourcing
- 8.9 Supplier Concentration and Risk
- 8.10 Supply Chain Localization and Resilience
Chapter 9 Mexico OTT Video and Audio Streaming Market Regulations and Policies
- 9.1 Relevant Laws, Standards and Compliance Frameworks
- 9.2 Product, Service, Safety and Quality Requirements
- 9.3 Government Policies, Incentives and Subsidies
- 9.4 Imports, Exports and Trade Barriers
- 9.5 Public Procurement and Local Content Requirements
- 9.6 Environmental and Sustainability Compliance
- 9.7 Data Protection, AI and Cybersecurity Compliance
- 9.8 Upcoming Policy Changes and Market Implications
Chapter 10 Mexico OTT Video and Audio Streaming Market Hotspots and Opportunities
- 10.1 Market Opportunity Mapping and Growth Hotspots
- 10.2 High-Growth Applications and Customer Groups
- 10.3 Underserved Markets and White-Space Opportunities
- 10.4 Emerging Technology and Product Opportunities
- 10.5 New Capacity and Investment Hotspots
- 10.6 Market Entry and Expansion Opportunities
- 10.7 Distribution and Partnership Opportunities
- 10.8 Near-Term and Long-Term Commercial Potential
- 10.9 Opportunity Attractiveness and Execution Risks
Chapter 11 Mexico OTT Video and Audio Streaming Market Outlook, 2025-2035
- 11.1 Market Size and Analysis
- 11.1.1 Revenue (Market Measurement: 2025: USD 4.09 billion → 2035: USD 10.22 billion)
- 11.1.2 Market Volume and Quantity Sold
- 11.1.3 Historical Market Size, 2018-2025
- 11.1.4 Base-Year Market Size, 2025
- 11.2 Market Forecast, 2025-2035
- 11.2.1 Revenue Forecast to 2035
- 11.2.2 Volume Forecast to 2035
- 11.2.3 CAGR and Year-on-Year Growth
- 11.2.4 Incremental Revenue Opportunity
- 11.3 Forecast Assumptions and Scenario Analysis
- 11.3.1 Base-Case Forecast
- 11.3.2 Optimistic and Conservative Scenarios
- 11.3.3 Technology, Pricing and Policy Sensitivities
- 11.4 Market Attractiveness and Growth Outlook
Chapter 12 Mexico OTT Video and Audio Streaming Market Segmentation and Outlook
- 12.1 Segmentation Summary and Market Shares, 2025
- 12.2 Largest and Fastest-Growing Segments
- 12.3 By Content Format - Market Size and Forecast, 2025-2035
- 12.3.1 Segment Definition and Scope
- 12.3.2 Historical Market Size, 2018-2025
- 12.3.3 Revenue Forecast, 2025-2035
- 12.3.4 Volume Forecast, 2025-2035
- 12.3.5 Base-Year Market Share, 2025
- 12.3.6 Segment CAGR and Growth Drivers
- 12.3.7 Subsegment Market Size and Forecast
- 12.3.7.1 Movies and Series
- 12.3.7.2 Live Video
- 12.3.7.3 Music Streaming
- 12.3.7.4 Podcasts and Spoken Audio
- 12.3.8 Subsegment Pricing and Adoption Trends
- 12.3.9 Leading Suppliers and Competition
- 12.3.10 Regional Demand and Opportunities
- 12.4 By Revenue Model - Market Size and Forecast, 2025-2035
- 12.4.1 Segment Definition and Scope
- 12.4.2 Historical Market Size, 2018-2025
- 12.4.3 Revenue Forecast, 2025-2035
- 12.4.4 Volume Forecast, 2025-2035
- 12.4.5 Base-Year Market Share, 2025
- 12.4.6 Segment CAGR and Growth Drivers
- 12.4.7 Subsegment Market Size and Forecast
- 12.4.7.1 Subscription
- 12.4.7.2 Advertising-Supported
- 12.4.7.3 Transactional
- 12.4.7.4 Bundled and Freemium
- 12.4.8 Subsegment Pricing and Adoption Trends
- 12.4.9 Leading Suppliers and Competition
- 12.4.10 Regional Demand and Opportunities
- 12.5 By Access Device - Market Size and Forecast, 2025-2035
- 12.5.1 Segment Definition and Scope
- 12.5.2 Historical Market Size, 2018-2025
- 12.5.3 Revenue Forecast, 2025-2035
- 12.5.4 Volume Forecast, 2025-2035
- 12.5.5 Base-Year Market Share, 2025
- 12.5.6 Segment CAGR and Growth Drivers
- 12.5.7 Subsegment Market Size and Forecast
- 12.5.7.1 Smart TVs and Connected TVs
- 12.5.7.2 Smartphones
- 12.5.7.3 Computers and Tablets
- 12.5.7.4 Streaming Devices and Consoles
- 12.5.8 Subsegment Pricing and Adoption Trends
- 12.5.9 Leading Suppliers and Competition
- 12.5.10 Regional Demand and Opportunities
- 12.6 Segment Growth Comparison
- 12.7 Segment Attractiveness and Priority Matrix
Chapter 13 Mexico OTT Video and Audio Streaming Geographic Market Outlook, 2025-2035
- 13.1 Regional Market Size and Country-Level Shares, 2025
- 13.2 Country Market Size Comparison, 2025
- 13.3 Country Market Forecasts, 2025-2035
- 13.4 Subregional Industrial and Demand Clusters
- 13.5 Intra-Regional Pricing and Cost Differences
- 13.6 Cross-Border Trade and Supply Networks
- 13.7 Regional Supply and Demand Balances
- 13.8 Country Opportunity Comparison and Prioritization
Note: Every listed country is covered on the structure shown under the first country.
Chapter 14 Mexico OTT Video and Audio Streaming Technology, Innovation and Sustainability Outlook
- 14.1 Technology Landscape and Maturity
- 14.2 Product, Process and Service Innovation
- 14.3 AI, Automation and Digital Tools in the Industry
- 14.4 Technology Adoption and Performance Benchmarking
- 14.5 Innovation Pipeline and R&D Investment
- 14.6 Patent and Intellectual Property Trends
- 14.7 Energy Efficiency and Resource Management
- 14.8 Sustainability, Recycling and Circularity
- 14.9 Technology Roadmap, 2025-2035
- 14.10 Risks of Obsolescence and Technology Substitution
Chapter 15 Mexico OTT Video and Audio Streaming Market Key Strategic Imperatives
- 15.1 Growth and Market Entry Priorities
- 15.2 High-Return Products and Segments
- 15.3 Pricing, Profitability and Cost Optimization
- 15.4 Technology Investment and Product Differentiation
- 15.5 Supply Chain Localization and Resilience
- 15.6 Distribution and Customer Acquisition
- 15.7 Partnership, Acquisition and Capacity Strategy
- 15.8 Regional Expansion Priorities
- 15.9 Short-, Medium- and Long-Term Actions
Chapter 16 Competition Outlook
- 16.1 Industry Competition Characteristics
- 16.2 Market Structure and Concentration
- 16.3 Market Share and Competitive Positioning, 2025
- 16.4 Company-Wise Revenue and Product Benchmarking
- 16.5 Production and Service Capacity Benchmarking
- 16.6 Technology, Pricing and Differentiation
- 16.7 Regional Footprint and Distribution Strength
- 16.8 Mergers, Acquisitions and Strategic Alliances
- 16.9 New Entrants and Competitive Threats
- 16.10 Porter's Five Forces and Industry Attractiveness
- 16.11 Competitive Outlook, 2025-2035
Chapter 17 Company Profiles
- 17.1 Company Coverage and Selection Criteria
- 17.2 Netflix
- 17.2.1 Business Description
- 17.2.2 Company Ownership and Geographic Presence
- 17.2.3 Product and Service Portfolio
- 17.2.4 Manufacturing and Operating Footprint
- 17.2.5 Production Capacity and Expansion Plans
- 17.2.6 Financial Performance and Investment
- 17.2.7 Market Share and Competitive Position
- 17.2.8 Technology and Innovation Capabilities
- 17.2.9 Strategic Alliances or Partnerships
- 17.2.10 Recent Developments
- 17.2.11 Growth Strategy and Outlook
- 17.3 Disney+
- 17.4 Max
- 17.5 Amazon Prime Video
- 17.6 ViX
- 17.7 YouTube and YouTube Music
- 17.8 Spotify
- 17.9 Apple Music and Apple TV+
- 17.10 Paramount+
- 17.11 Claro video
- 17.12 Other Relevant Market Participants
Note: Every listed company is profiled on the structure shown under the first company. The company list is preliminary and may change based on research findings, market developments, data availability and client requirements.
Chapter 18 Disclaimer
- 18.1 Research and Forecast Disclaimer
- 18.2 Data Source and Estimation Limitations
Note: The depth of individual sections depends on data availability for this market. Volume, capacity, trade and other unit-based metrics are included where applicable.

