
Critical minerals and digital sites reshape mine leadership
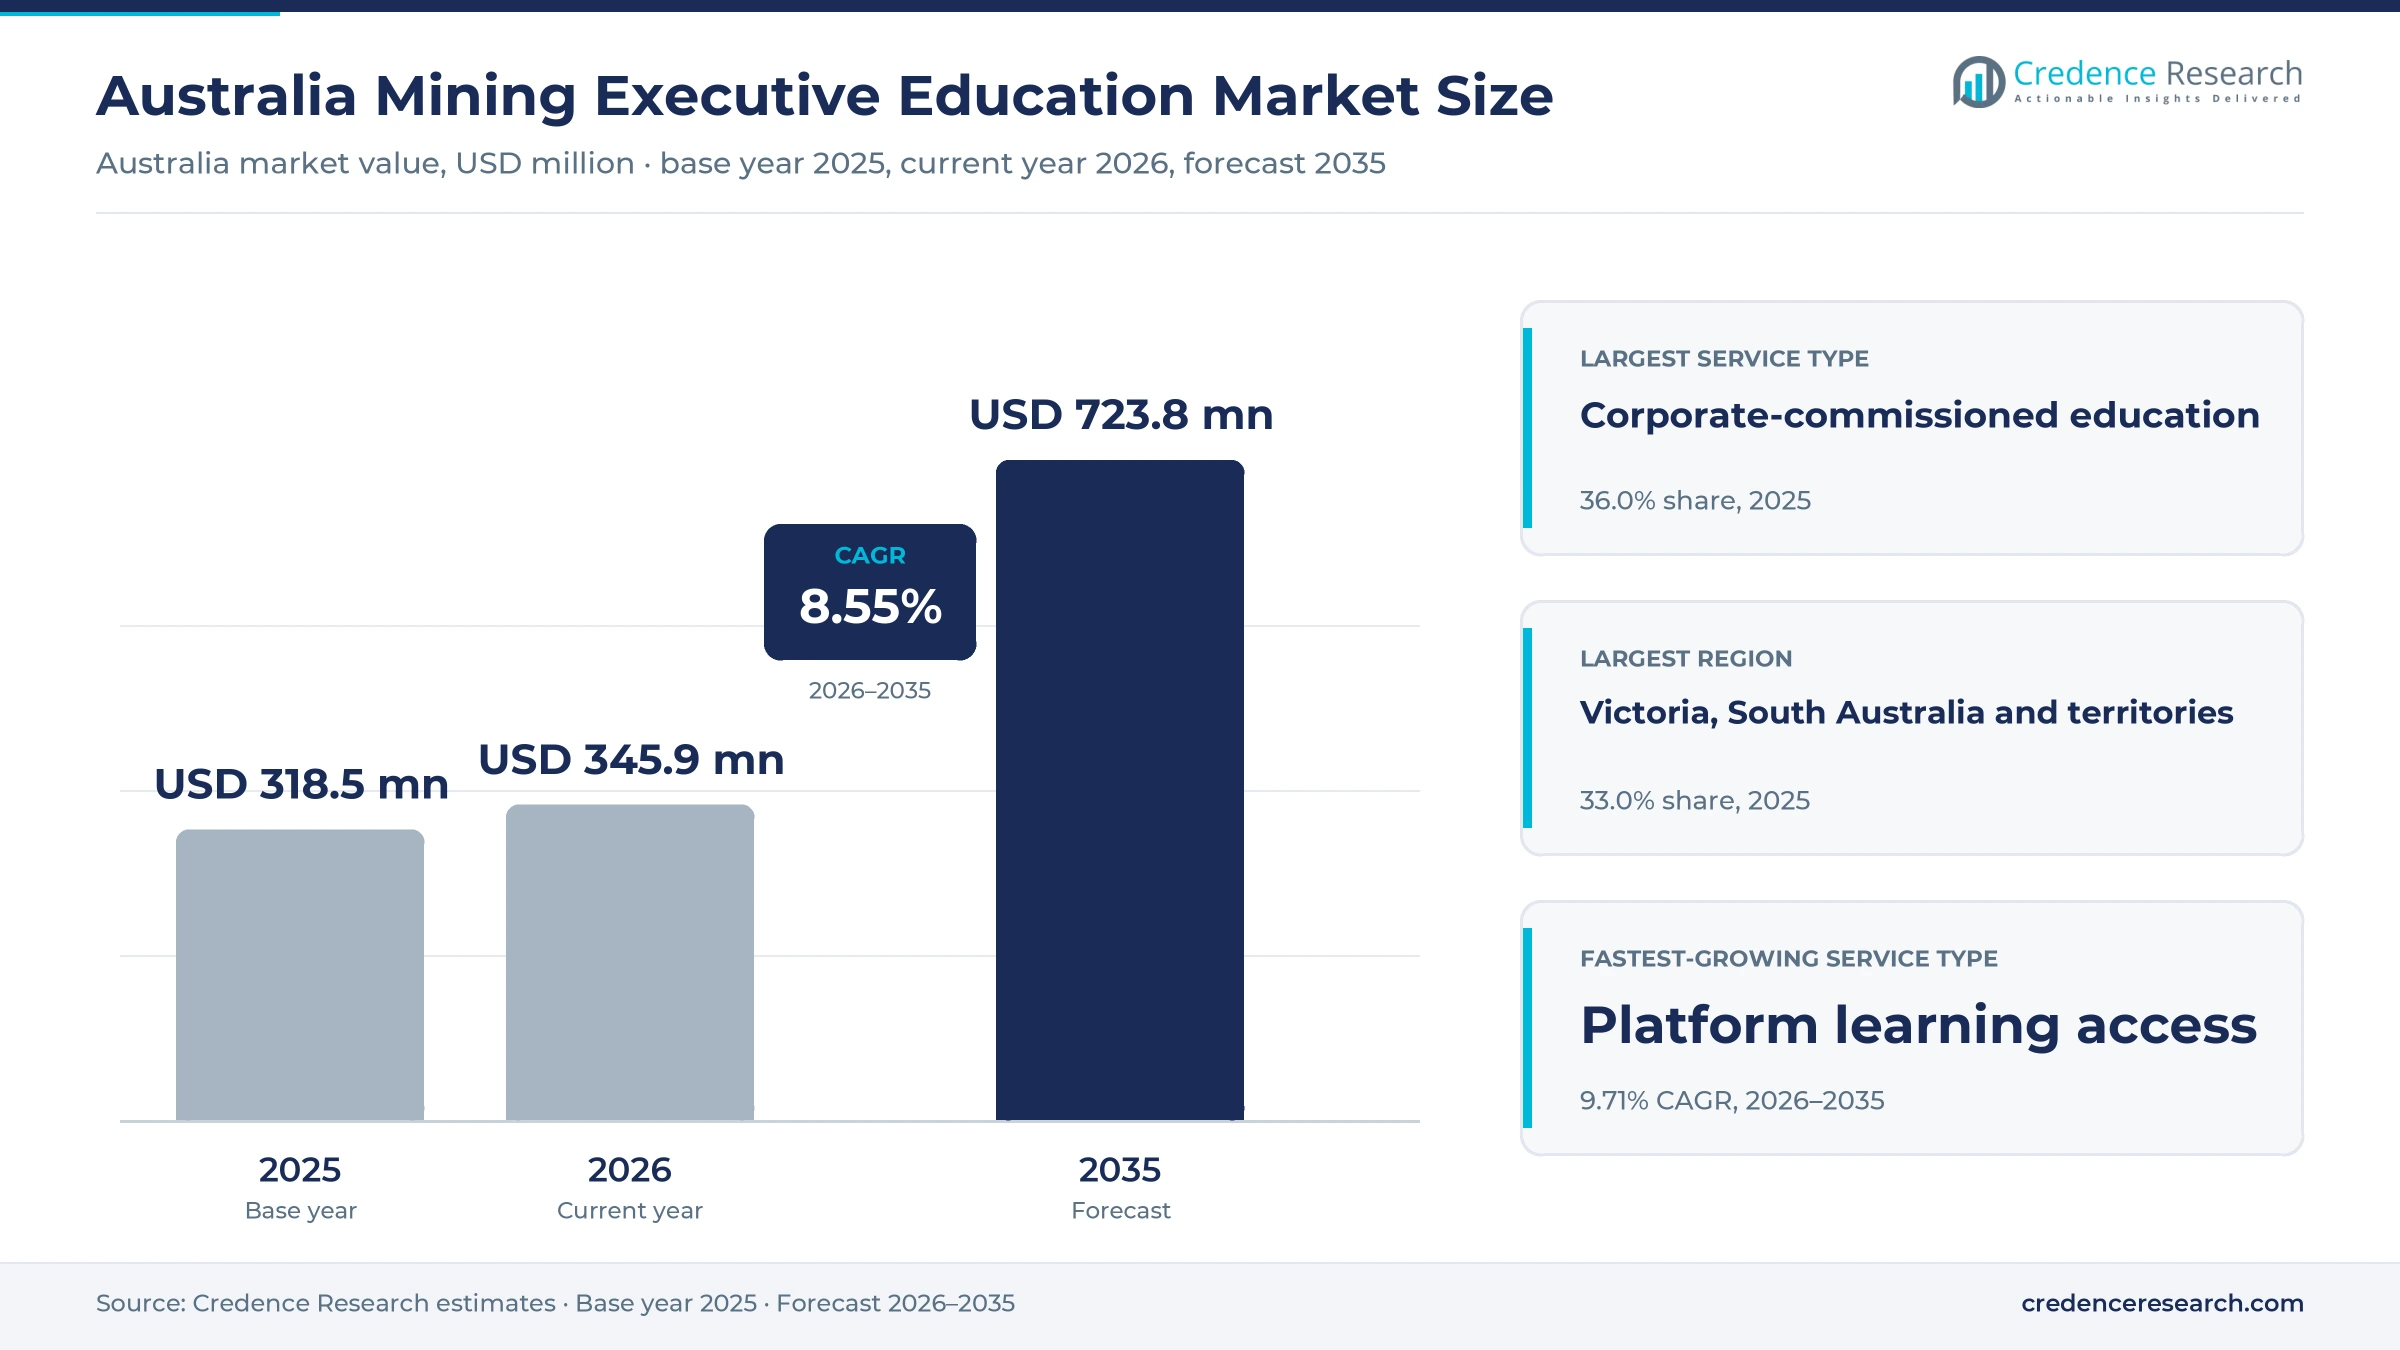
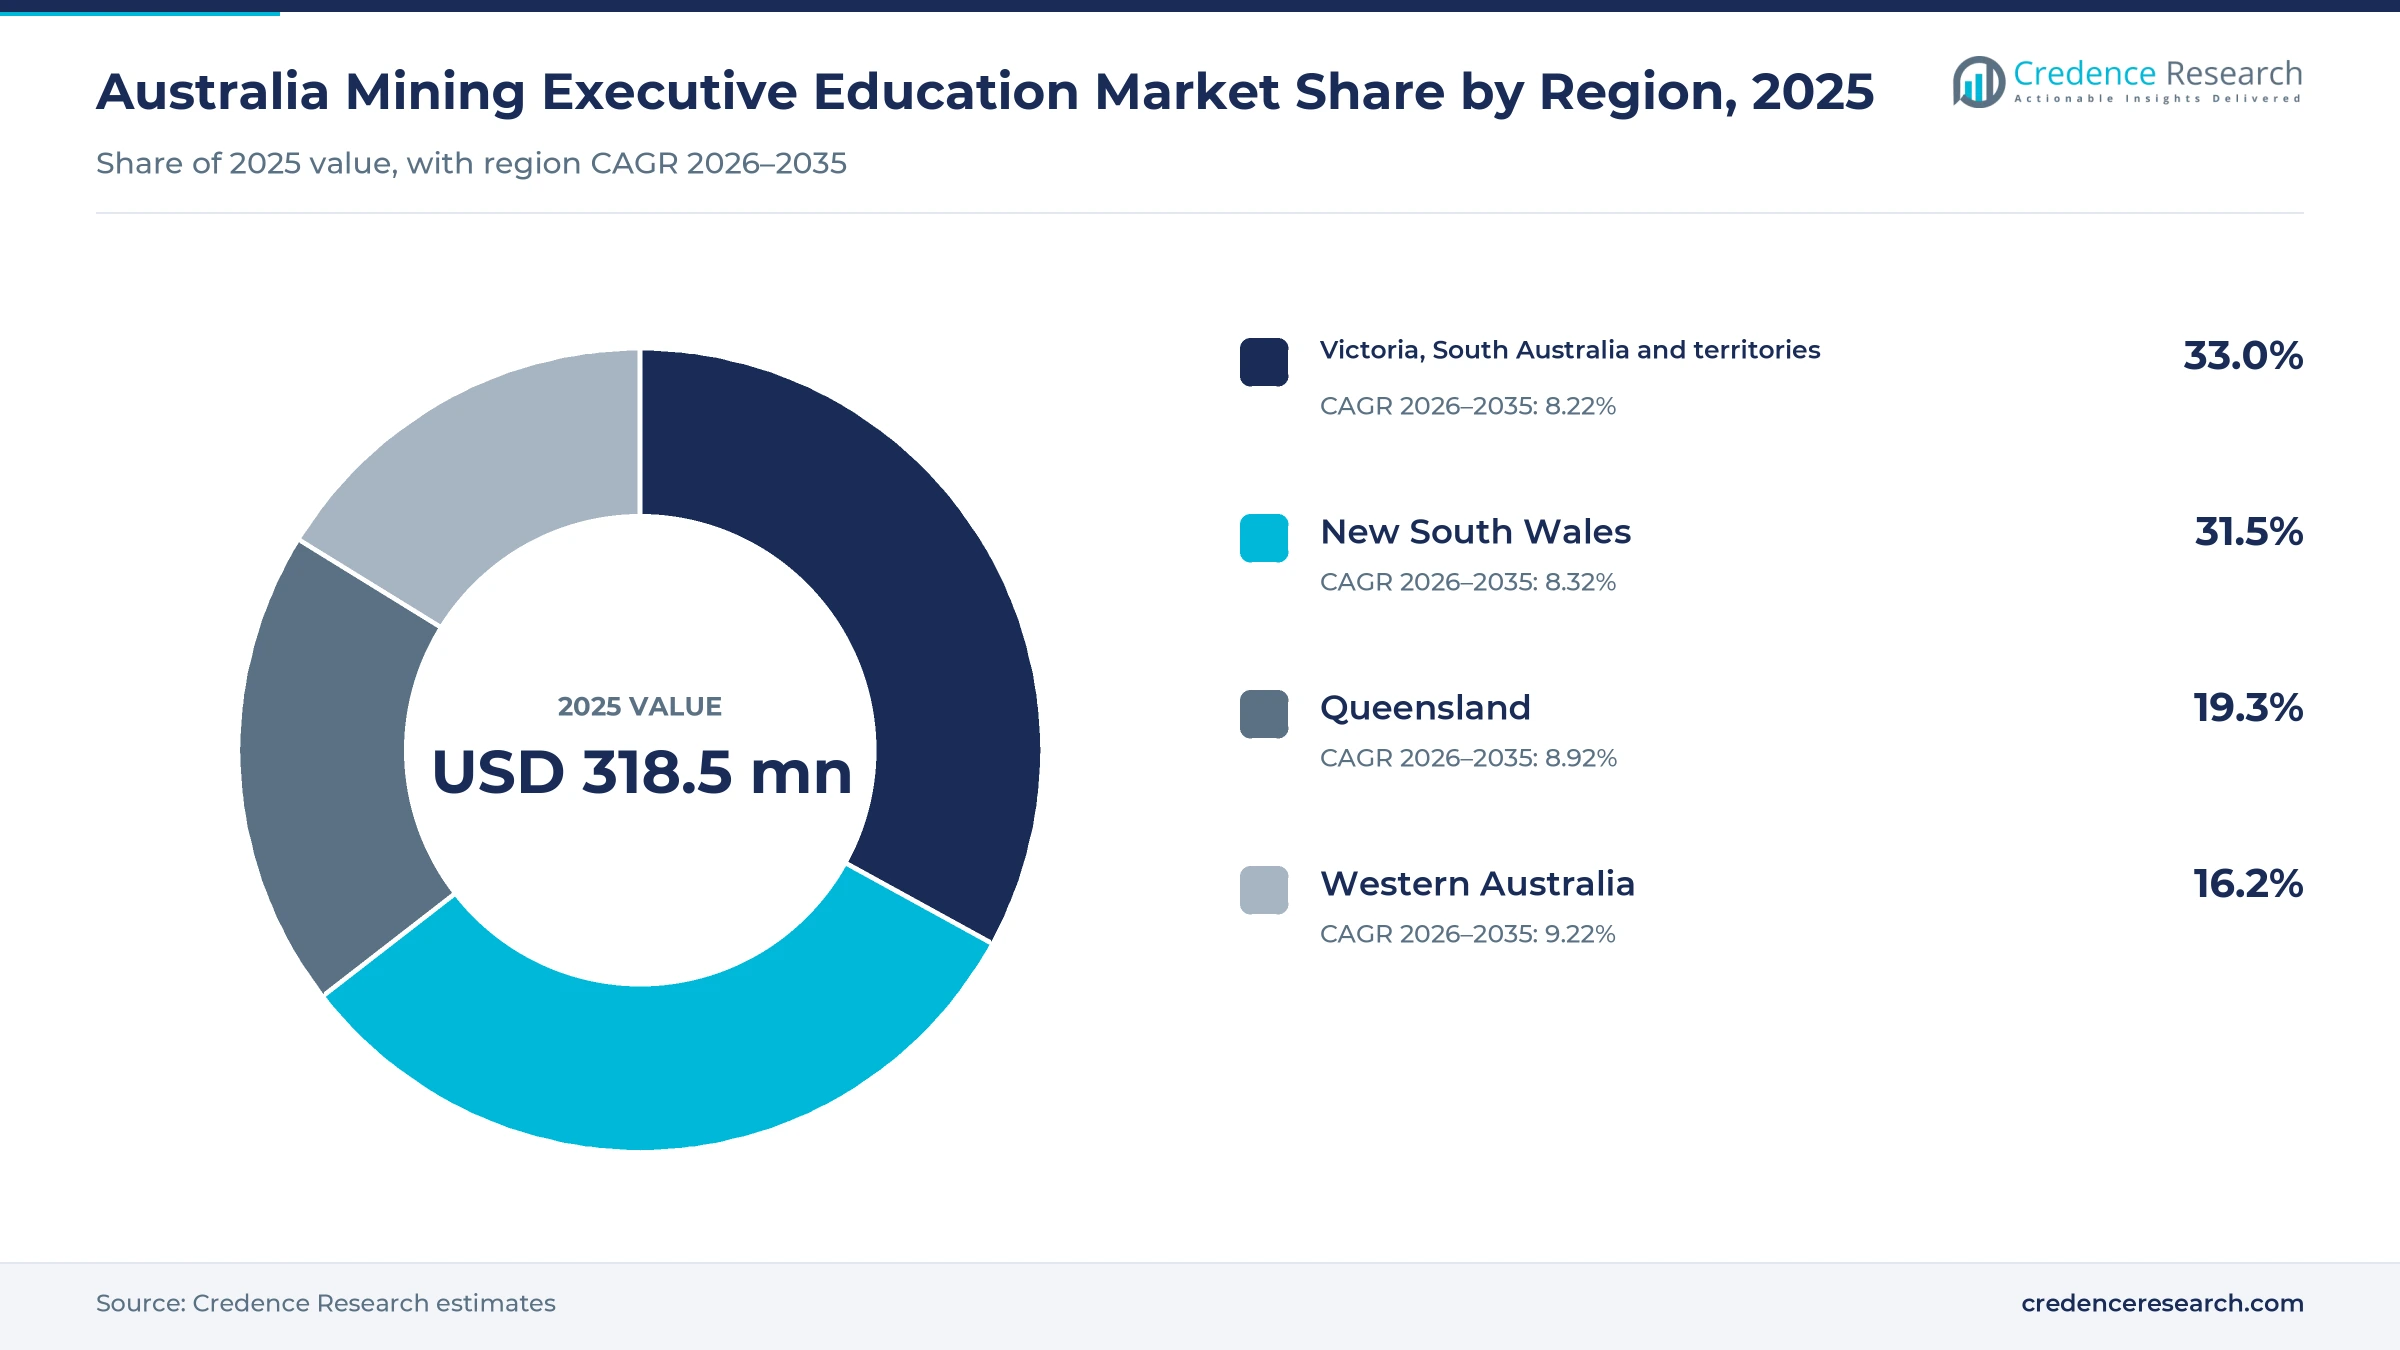
The Australia mining executive education market was valued at USD 318.5 million in 2025 and is projected to increase from USD 345.9 million in 2026 to USD 723.8 million by 2035, registering a CAGR of 8.55% during 2026–2035. Demand comes from mining companies, contractors and mining services firms that pay for leadership, commercial and technical management programs for their managers and engineers. Victoria, South Australia and the territories held the largest regional share, 33.0% in 2025, because Melbourne and Adelaide host corporate offices, business schools and professional bodies that run these programs. Western Australia is the fastest-growing region at 9.22% a year, as lithium and other critical minerals projects add new management roles. In turn, a federal production tax incentive for processing 31 critical minerals, passed in February 2025, pushes companies to build processing and project leadership skills before it starts in July 2027.
Which mine leadership programs are counted in Australia?
The estimate measures spending in Australia on open-enrolment courses, platform learning access, corporate-commissioned programs and leadership coaching bought for mining executives, managers, technical professionals and supervisors. It covers short courses, professional certificates, postgraduate award programs and structured coaching delivered online, blended, on campus or at employer sites. Values are stated in USD million at current prices and exclude goods and services tax.
The estimate excludes undergraduate degrees, vocational trade training, statutory safety induction and equipment operator training sold as separate services. The value chain runs from universities, business schools, professional associations and specialist consultants through learning platforms and corporate learning teams to mining companies, contractors and their staff.
Australia Mining Executive Education Market Insights
- The Australia mining executive education market was valued at USD 318.5 million in 2025 and is projected to reach USD 723.8 million by 2035, at an 8.55% CAGR during 2026–2035.
- Victoria, South Australia and the territories held 33.0% of 2025 value, because corporate offices and business schools in Melbourne and Adelaide buy and run many programs.
- Corporate-commissioned education led service types with 36.0% of 2025 value, as mining companies buy cohort programs for whole management layers.
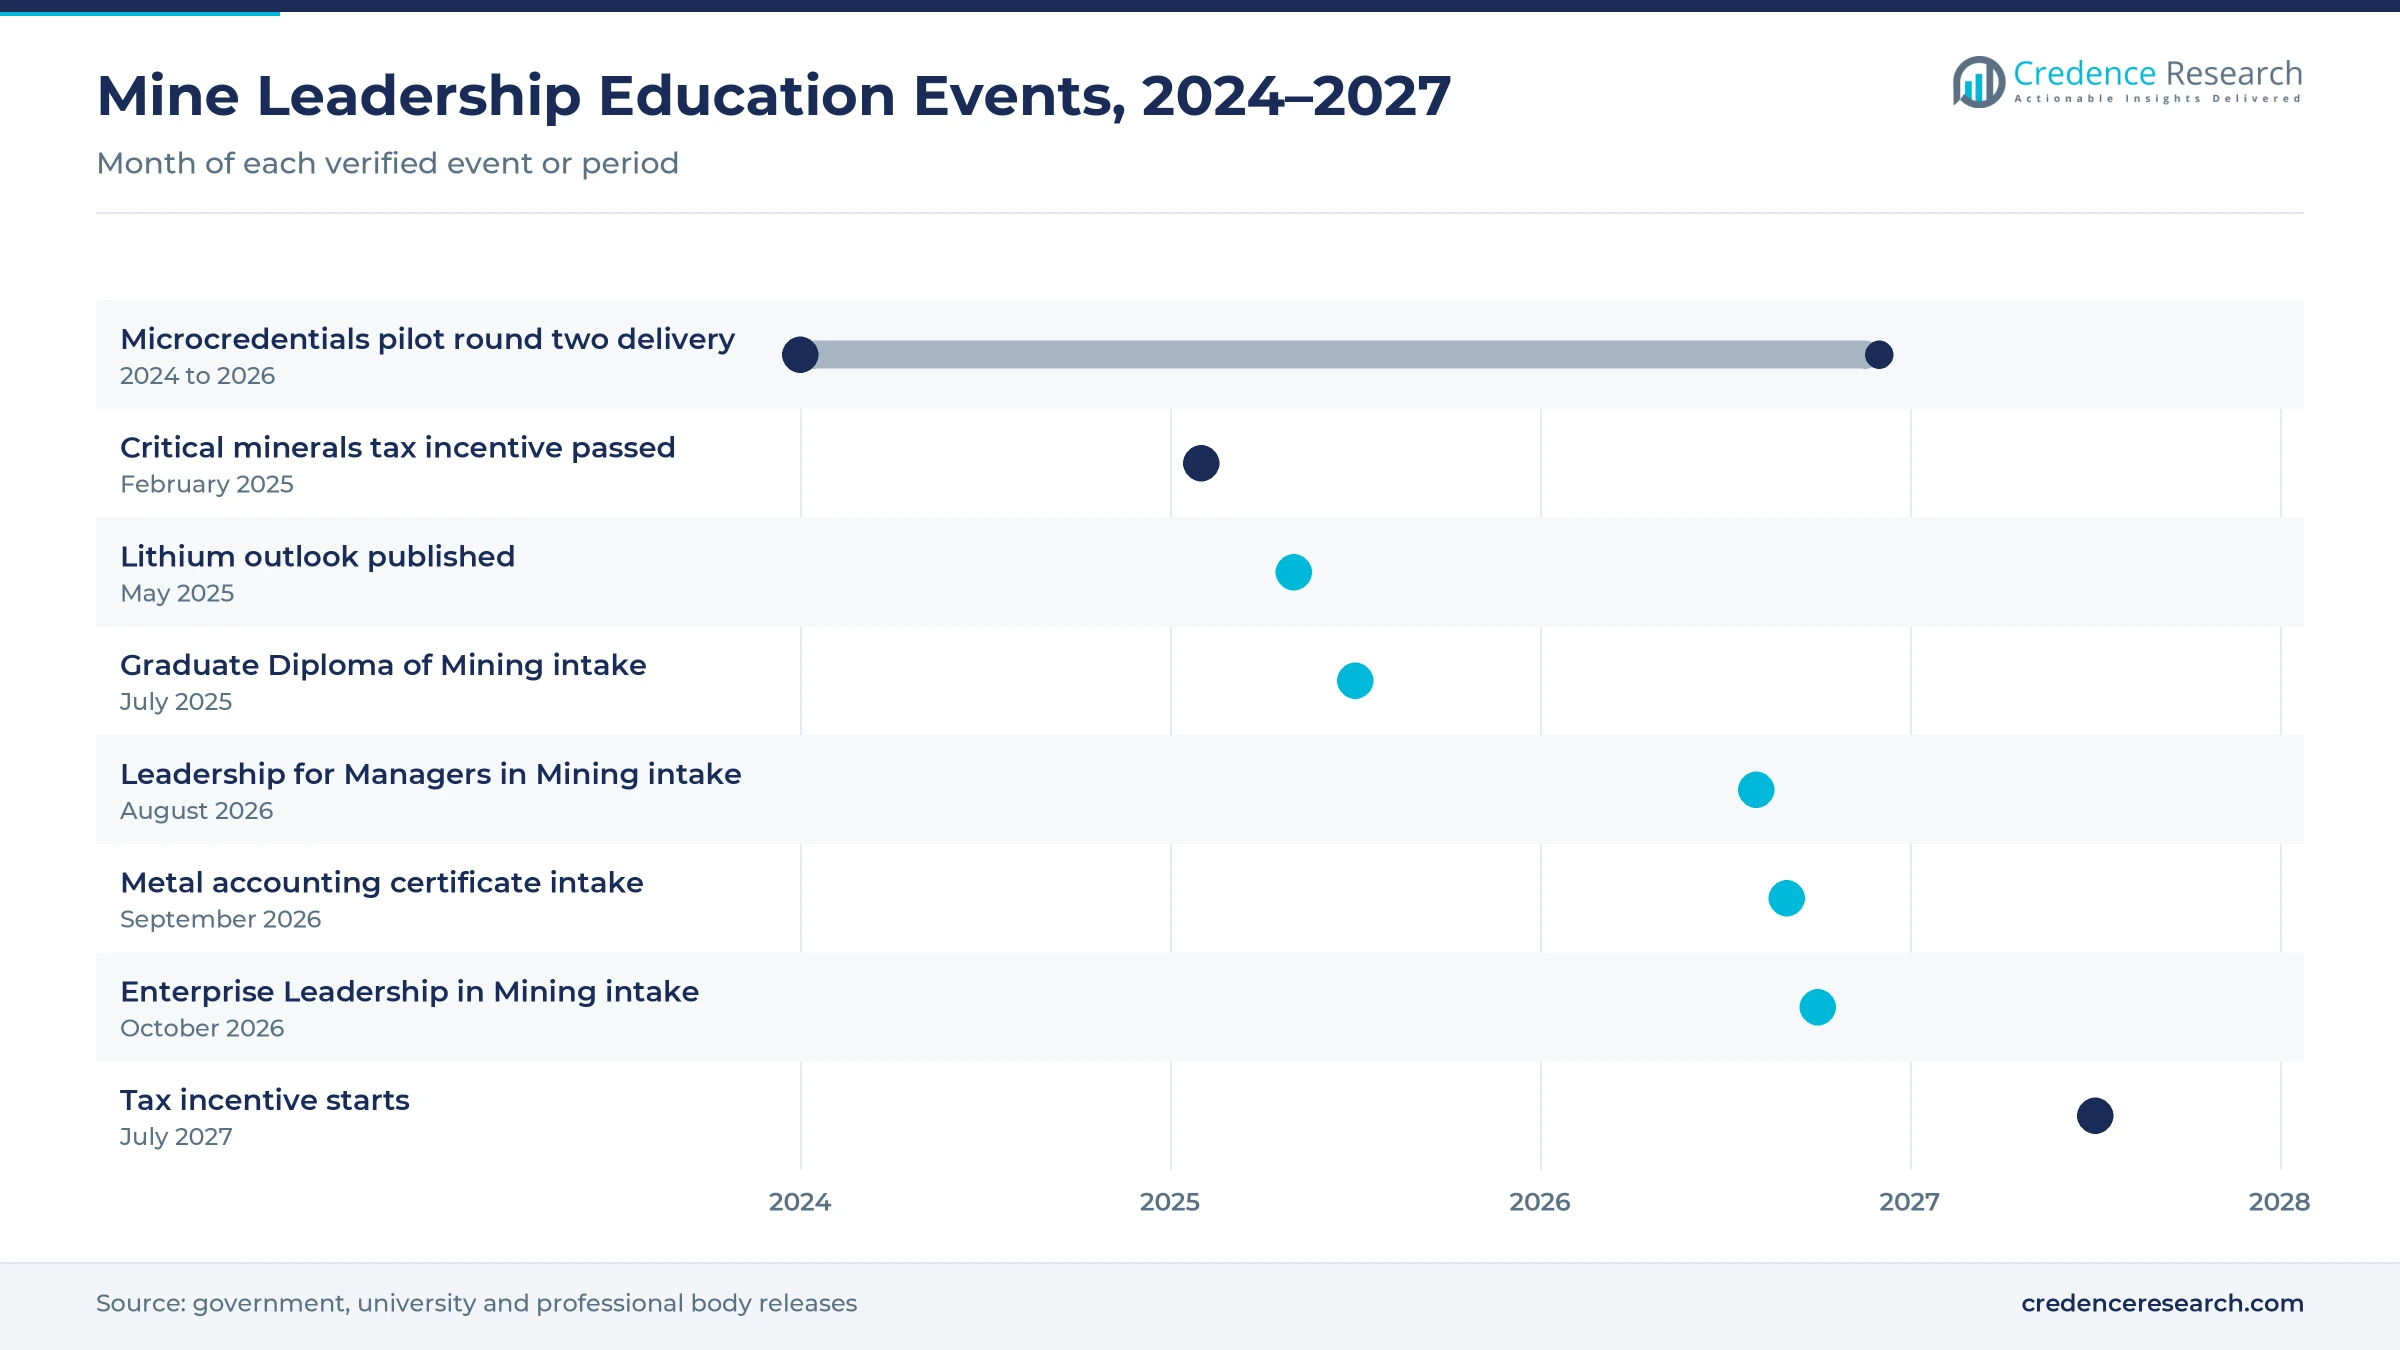
- In February 2025, federal Parliament passed a 10% refundable tax offset for processing 31 critical minerals, available from July 1, 2027.
- Platform learning access grows fastest at 9.71% a year during 2026–2035, as managers on site rosters study online between shifts.
Commissioned programs lead as platform access grows fastest
Why do commissioned programs lead service spending?
Based on service type, the market is categorized into open-enrolment education, platform learning access, corporate-commissioned education and leadership consulting and coaching. Corporate-commissioned education led with 36.0% of 2025 value, because large miners prefer cohort programs built around their own sites and systems. Platform learning access grows fastest at 9.71% a year, as companies buy online course libraries for staff on remote rosters.
Which learners account for the most program spending?
Based on learner segment, the market is categorized into executive leaders, senior managers and managers, technical professionals and supervisors and team leaders. Senior managers and managers led with 35.0% of 2025 value, because operations and functional managers form the largest paid cohorts. Technical professionals grow fastest at 8.91% a year, as engineers and geologists move into project and commercial leadership roles.
How do site rosters shape delivery choices?
Based on delivery model, the market is categorized into online, blended, campus-based and employer-site delivery. Blended led with 30.0% of 2025 value, because companies combine short campus blocks with online study around fly-in fly-out rosters. Online grows fastest at 9.39% a year, as professional bodies and universities move whole courses to virtual classrooms. In turn, campus-based study keeps a role for senior executive education cohorts that value face-to-face networking.
Why do short courses keep the largest program share?
Based on program type, the market is categorized into short courses and masterclasses, professional certificates, postgraduate award programs and structured coaching programs. Short courses and masterclasses led with 38.0% of 2025 value, because managers can finish them within one roster cycle. Professional certificates grow fastest at 9.13% a year, as employers ask for recognized credentials in metallurgy, data analytics and leadership.
| Segment Group | Leading Sub-segment | Share, 2025 | Fastest-growing Sub-segment | CAGR, 2026–2035 |
|---|---|---|---|---|
| By Service Type | Corporate-commissioned education | 36.0% | Platform learning access | 9.71% |
| By Learner Segment | Senior managers and managers | 35.0% | Technical professionals | 8.91% |
| By Delivery Model | Blended | 30.0% | Online | 9.39% |
| By Program Type | Short courses and masterclasses | 38.0% | Professional certificates | 9.13% |
Request a Free Sample
Fill in your details and we'll send you a free sample report.
- Sample data tables & charts
- Research methodology
Minerals growth, data skills and flexible study lift demand
How does critical minerals growth raise management training needs?
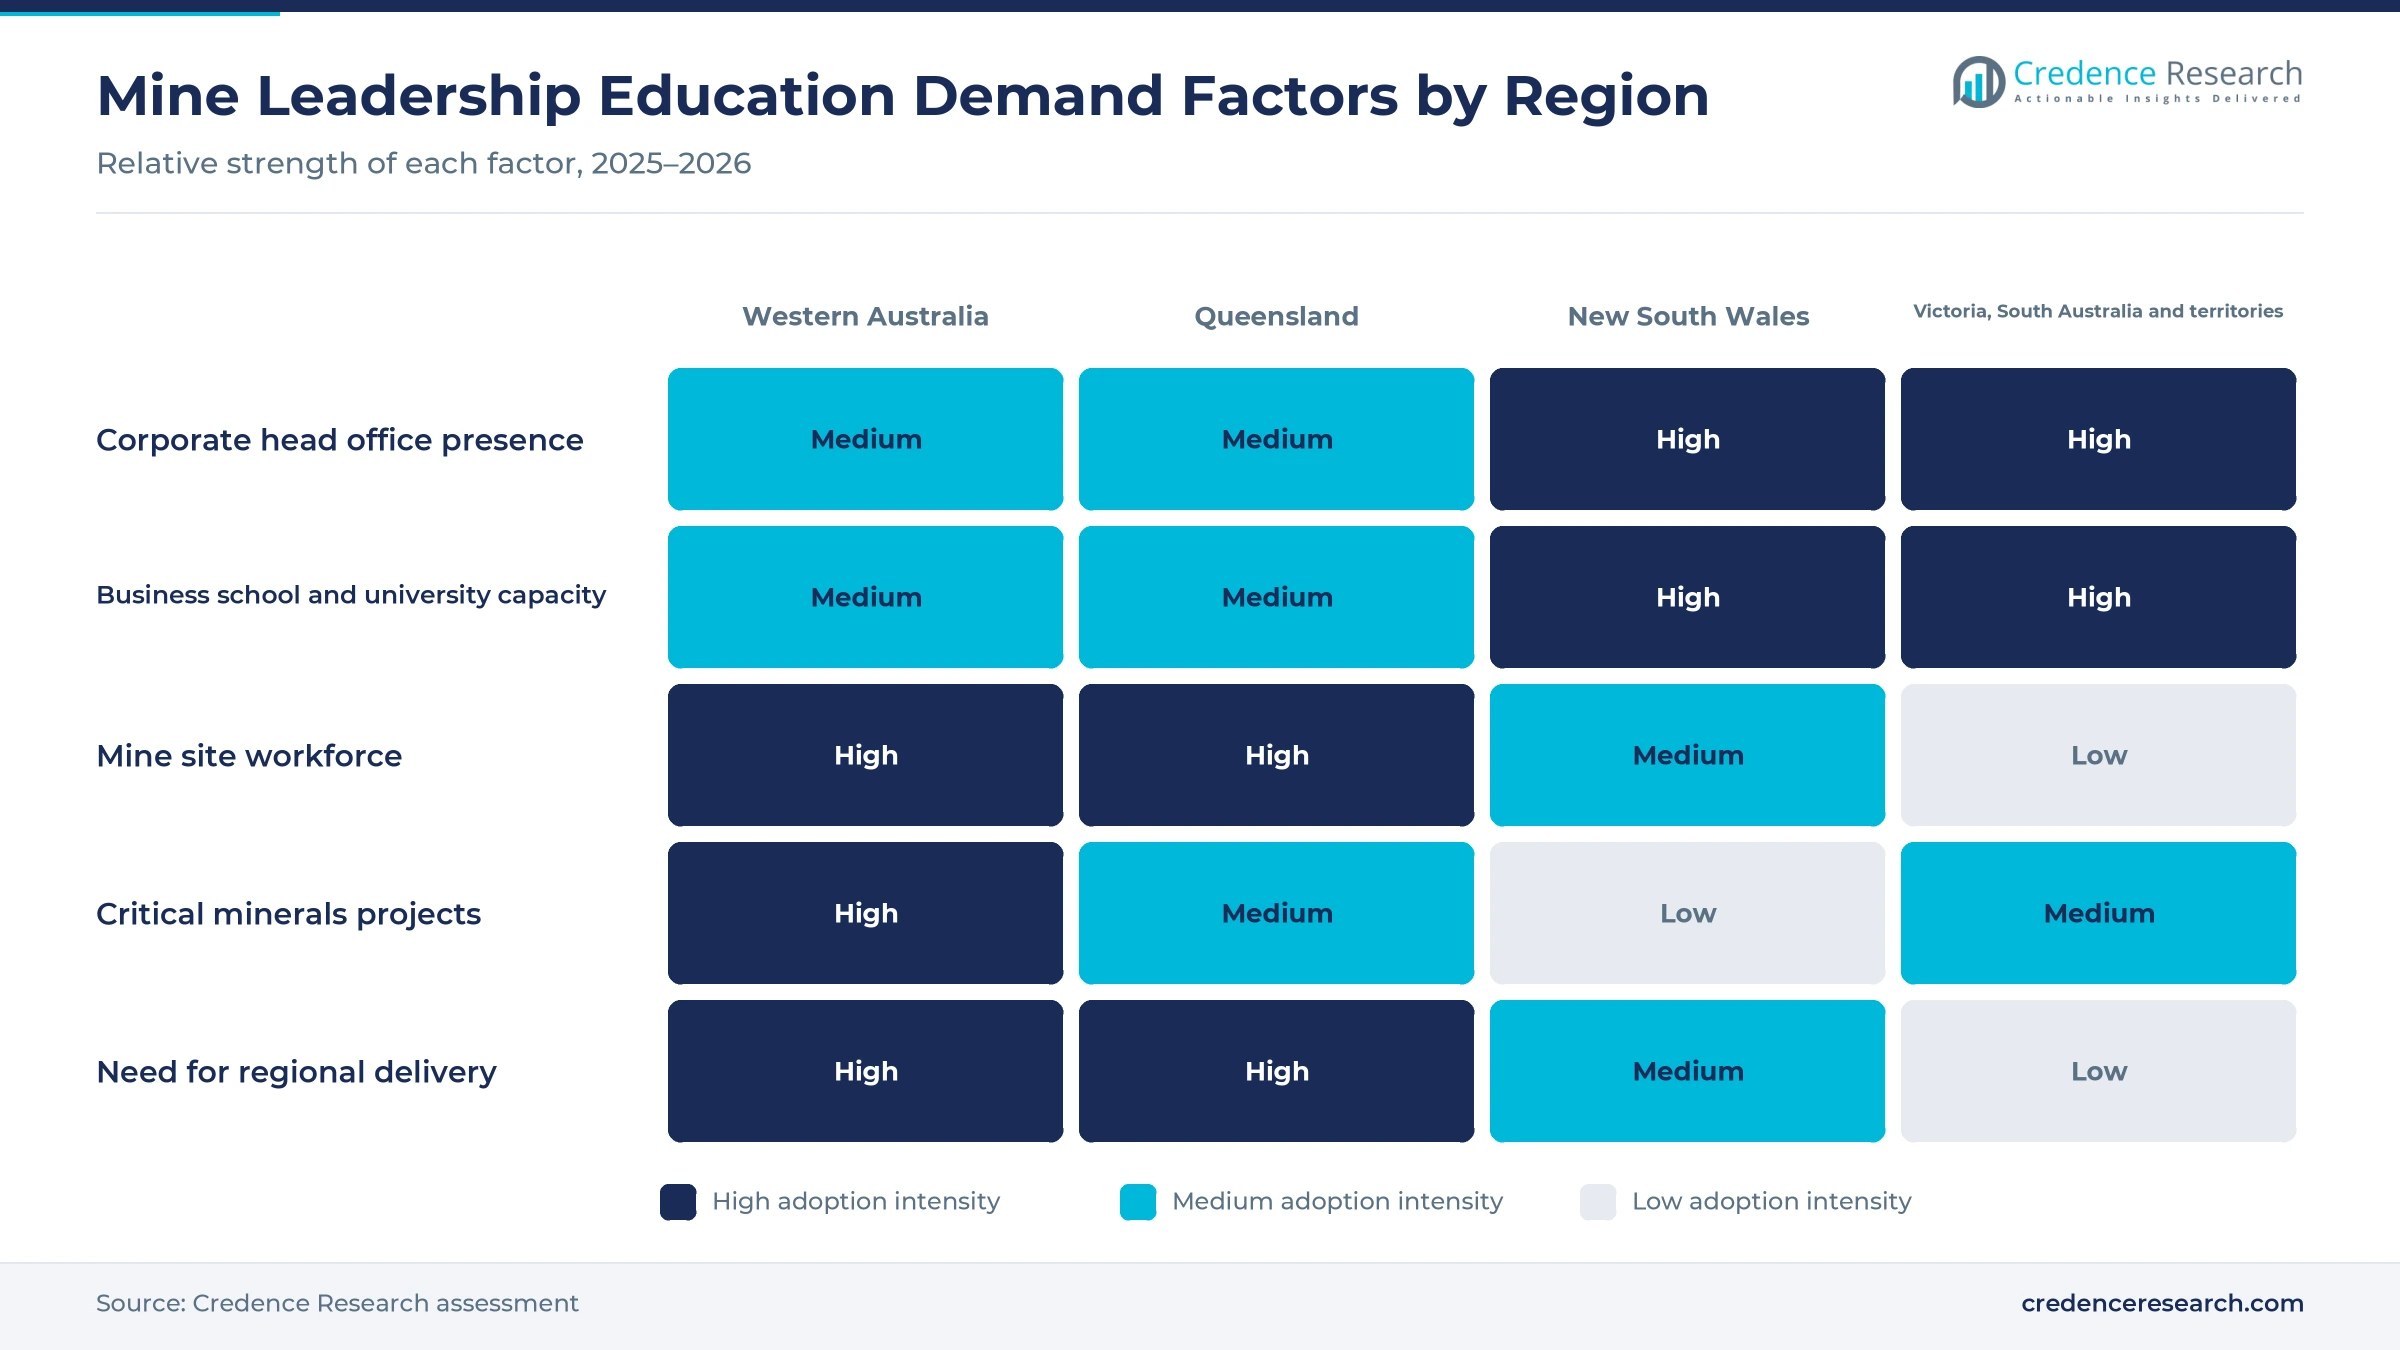
Critical minerals growth raises management training needs, because new lithium, nickel and rare earth projects need leaders who understand processing, offtake and approvals. Global lithium demand reached 205 kt in 2024, up from 95 kt in 2021, according to the International Energy Agency. Australia also offers a 10% refundable tax offset for processing 31 critical minerals from July 1, 2027, to June 30, 2040, as set out by the tax office. In addition, the national critical minerals strategy reports shortages of mining engineers, geologists, metallurgists and processing engineers. As a result, technical professionals grow fastest among learners at 8.91% a year, as engineers move into commercial and project leadership roles.
Why do digital mining decisions need new skills?
Digital mining decisions need new skills, because automated fleets, sensors and process data now shape daily operating choices at large sites. A professional body runs a data analytics and machine learning course of about 20 hours for plant engineers, improvement specialists and senior operations managers. The University of Adelaide also teaches a 2026 mine automation course that covers sensors, remote control, digital twins and system integration. Curtin University and Fortescue created a professor of practice role in mining automation and data analysis at the WA School of Mines in August 2020. Consequently, platform learning access grows fastest among service types at 9.71% a year, as operators that buy automation systems train managers to use the data.
How does flexible professional learning widen access?
Flexible professional learning widens access, because site rosters make long campus programs hard for managers who work fly-in fly-out shifts. One leadership course for managers in mining, co-developed with Melbourne Business School, runs fully online over five weeks with about 20 hours of learning and a member fee of AUD 1,550. The federal microcredentials pilot also commits AUD 18.5 million, with round two courses delivered from 2024 to 2026 in fields that include engineering, according to the education department. Federation University offers its Graduate Diploma of Mining fully online or on campus for working engineers. As a result, online delivery grows fastest at 9.39% a year, while blended programs lead with 30.0% of 2025 value.
Why does workforce renewal keep leadership pipelines busy?
Workforce renewal keeps leadership pipelines busy, because a large mining workforce needs a steady flow of new supervisors and managers each year. Mining employed 314,800 people in November 2024, according to Jobs and Skills Australia. The median mining worker is 41 years old, which means many senior managers will retire within the forecast period. The national critical minerals strategy also notes that women make up 18% of the Australian mining workforce and calls for removing barriers to their retention. In turn, corporate-commissioned education leads service types with 36.0% of 2025 value, as miners buy cohort programs and corporate leadership training for whole management layers.
Partnerships, regional delivery and certificates gain ground
How is the rise of university and industry partnerships changing programs?
The rise of university and industry partnerships is changing programs, because buyers want courses that mix academic method with site practice. A leadership course for managers in mining is co-developed by a professional body and delivered by Melbourne Business School, and its next intake opened on Aug. 3, 2026. The University of Queensland built its Resource Development graduate certificates and graduate diploma in partnership with Thiess. Its Sustainable Minerals Institute also delivered more than 120 online and in-person courses to over 2,000 participants in 2025. Consequently, providers that pair content with leadership coaching win larger cohort contracts and longer executive education agreements.
Why is the shift to regional and on-site delivery rising?
The shift to regional and on-site delivery is rising, because many mine managers live and work far from capital city campuses. Regional areas held 65.78% of the Queensland mining workforce in 2024, according to a national skills council bulletin. The University of Queensland now runs programs in regional centers at Cloncurry and Moranbah, close to major mining districts. More than 73% of regional metal ore mining workers nationally also worked over 45 hours a week in 2024. Capital cities still held 55.17% of the national mining workforce in 2024, which keeps head office cohorts important. As a result, employer-site delivery holds a steady place in the mix, and providers bring trainers to sites rather than flying whole management teams to campus.
Can processing and metallurgy certificates open new demand?
Processing and metallurgy certificates open new demand, because more Australian ore will be refined at home if processing projects proceed. Lithium, copper and nickel made up about 6% of resource exports in 2025, and the industry department projects around 10% by 2030, according to a central bank bulletin from October 2025. A professional body also runs an online Professional Certificate in Metal Accounting from Sept. 7 to Nov. 1, 2026. The processing tax incentive is estimated to cost AUD 7 billion over the decade, which supports new refinery management roles. In turn, professional certificates grow fastest among program types at 9.13% a year as processing teams expand.
Is there room to grow with stackable graduate certificates?
Stackable graduate certificates offer a clear opening, because working engineers want credentials that count toward a full master's degree later. UNSW Sydney offers a Graduate Certificate in Mining Engineering of four core courses over about 0.7 years, with block mode and fully online options. Entry accepts at least four years of relevant industry experience, which suits supervisors without a mining degree. Federation University also opened a July 21, 2025, intake for its Graduate Diploma of Mining, which some states accept toward Mine Managers' Certificates. As a result, postgraduate award programs keep 38.0% of value within reach for providers that link them to professional upskilling platforms.
Rosters, commodity cycles and proof of return slow buyers
How do site rosters limit study time?
Site rosters limit study time, because long shifts and fly-in fly-out cycles leave managers little energy for coursework. More than 73% of regional metal ore mining workers worked over 45 hours a week in 2024. As a result, completion rates fall when programs demand fixed weekly sessions or long campus blocks. Providers respond with recorded virtual classrooms, short modules and employer-site sessions timed around roster breaks. However, these formats cost more to run, which raises fees for smaller buyers.
Why do commodity cycles cut training budgets?
Commodity cycles cut training budgets, because miners reduce discretionary spending quickly when prices fall. Many lithium projects were postponed or canceled in 2024 because of low prices, according to the federal geological survey of the United States. Consequently, companies delay leadership cohorts and coaching contracts until prices recover. Providers reduce this risk by selling subscriptions and multiyear cohort agreements that spread spending across the cycle. Even so, smaller miners and contractors often cut executive education first when margins tighten.
How does weak proof of return slow purchases?
Weak proof of return slows purchases, because finance teams want clear links between programs and safety, productivity or retention results. Leadership outcomes take years to show up in site performance data. In turn, learning managers struggle to defend large commissioned programs in budget reviews. Providers address this with pre and post assessments, project-based learning and reports that track promotion and retention of participants. Such evidence takes time to collect, so early adopters still carry most of the risk.
Will scarce industry faculty limit program growth?
Scarce industry faculty can limit program growth, because credible mine leadership teaching needs people with senior operating experience. The same skills shortages that affect mining engineers and metallurgists also reduce the pool of experienced teachers. As a result, providers compete for a small group of practitioners. Universities answer with professor of practice roles, adjunct appointments and co-delivery with professional bodies. These arrangements help, although they rarely match the full demand for experienced executive education faculty.
Eastern head offices lead as Western Australia grows fastest
| Region | Value, 2025 (USD million) | Share, 2025 | CAGR, 2026–2035 |
|---|---|---|---|
| Victoria, South Australia and territories | 105.1 | 33.0% | 8.22% |
| New South Wales | 100.3 | 31.5% | 8.32% |
| Queensland | 61.5 | 19.3% | 8.92% |
| Western Australia | 51.6 | 16.2% | 9.22% |
Why do Victoria, South Australia and the territories lead?
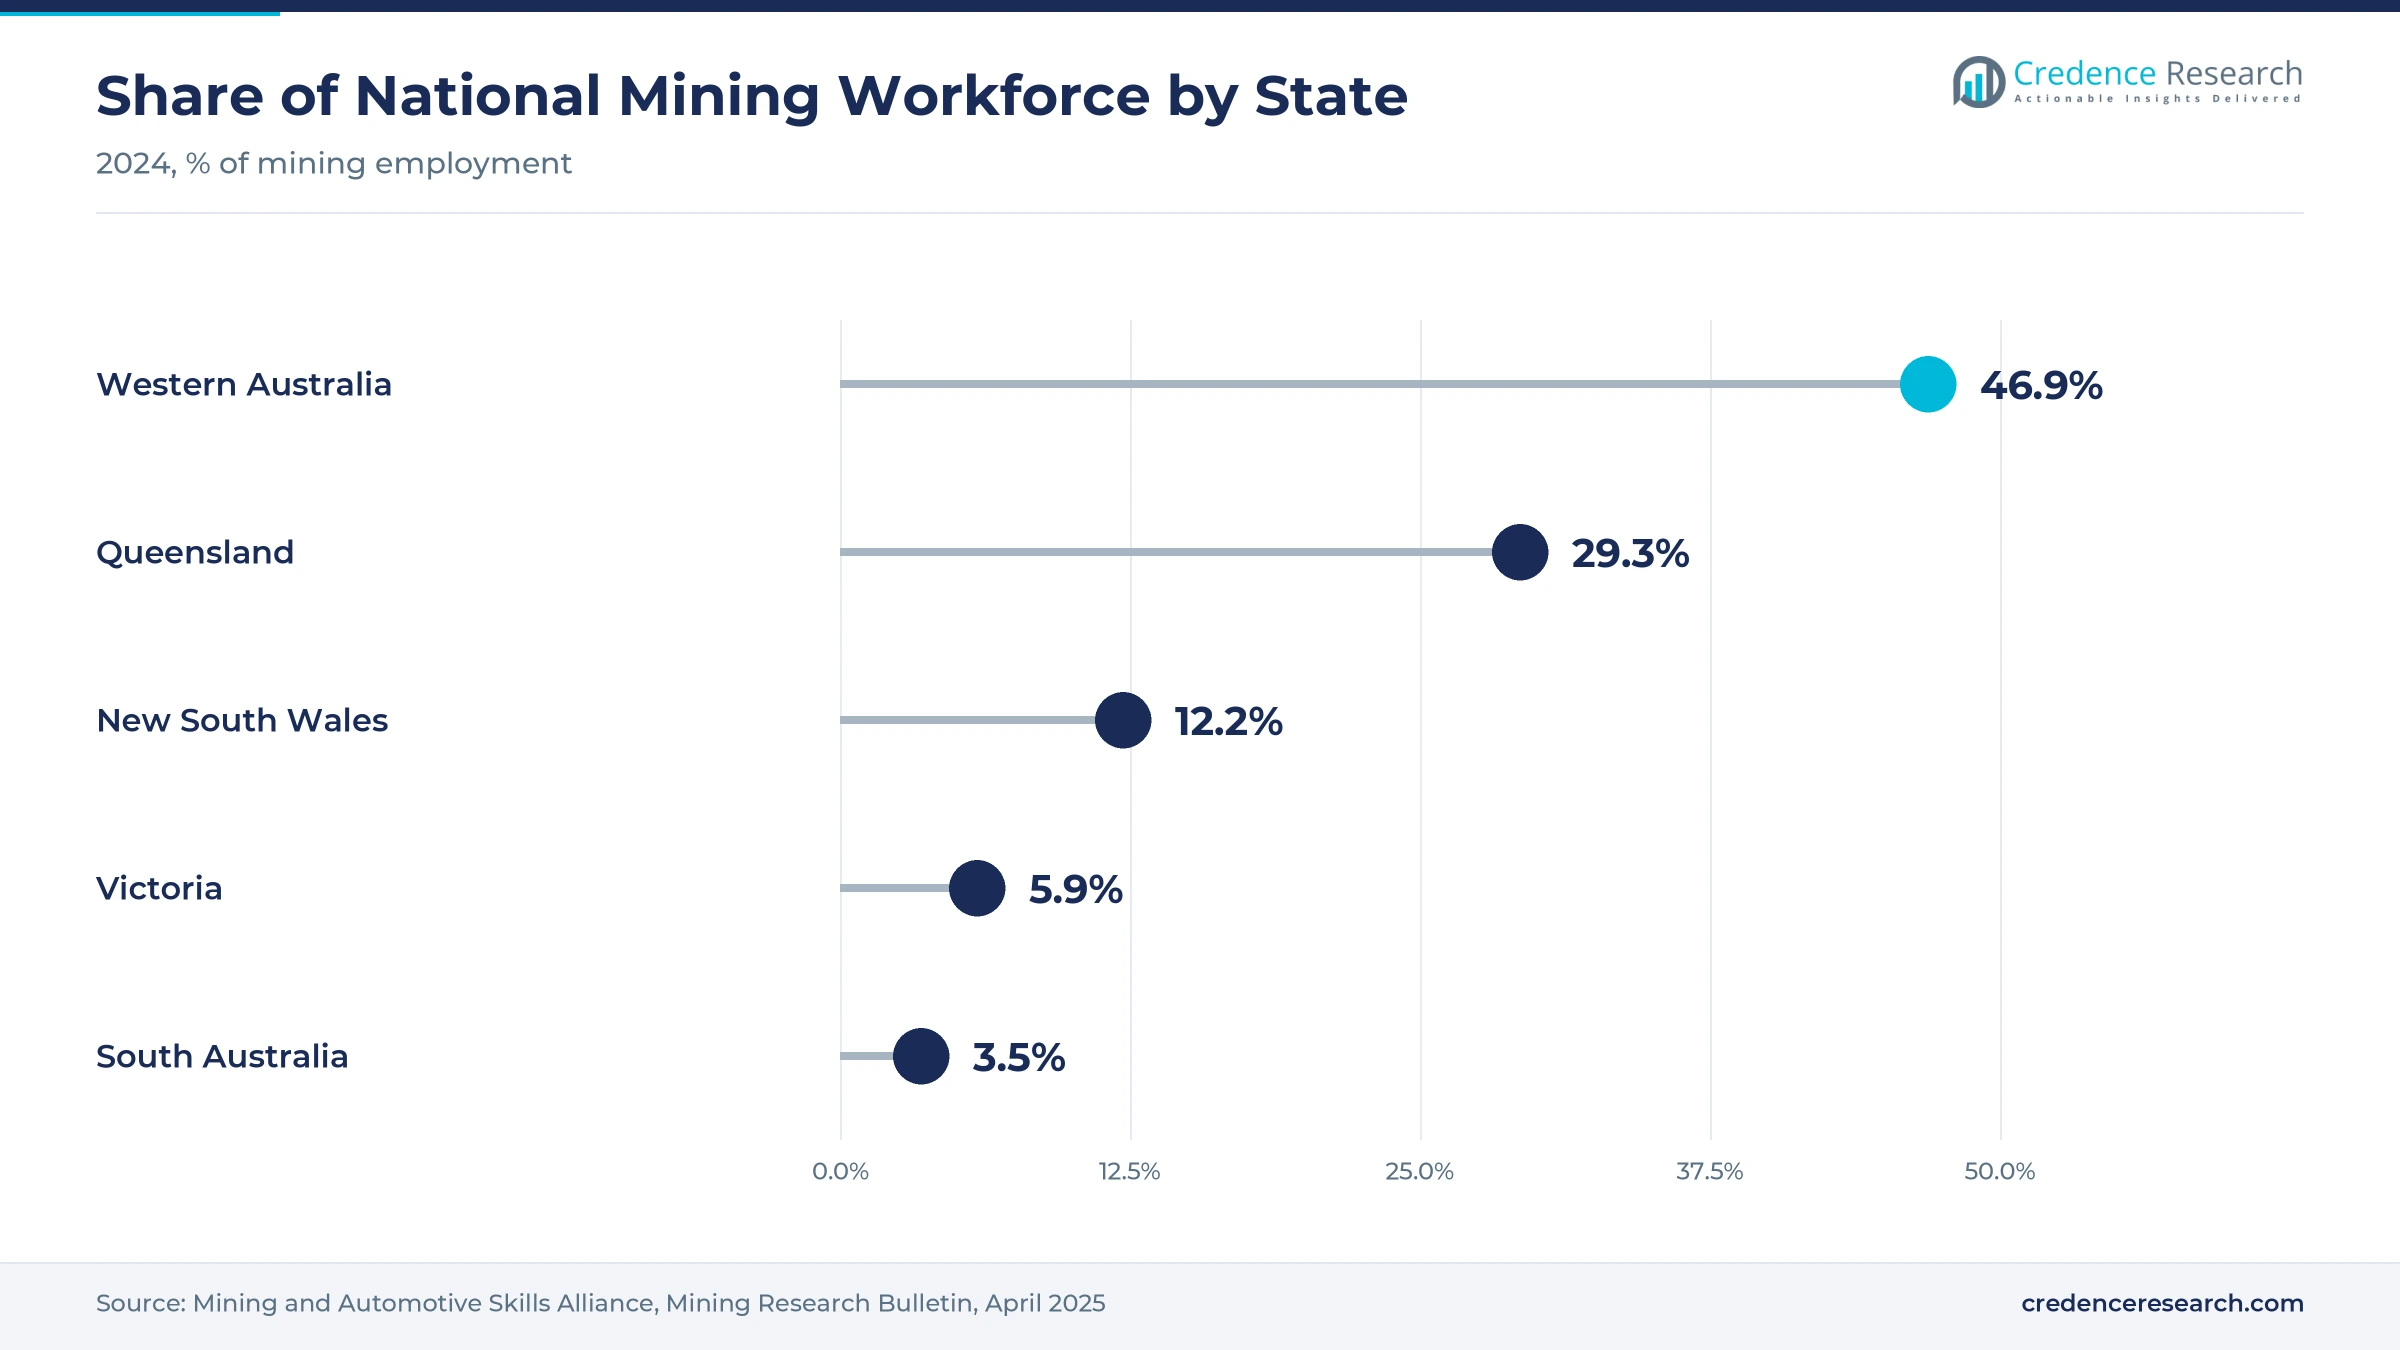
Victoria, South Australia and the territories held a 33.0% share of 2025 value and grow at 8.22% a year. Melbourne Business School and Federation University in Ballarat deliver mining leadership and graduate programs from this zone. Adelaide also held 39.29% of the South Australian metal ore mining workforce in 2024. As a result, head office cohorts and national programs keep this zone in the lead.
How does new South Wales support program spending?
New South Wales held a 31.5% share of 2025 value and grows at 8.32% a year. The state held 12.21% of the national mining workforce in 2024, mainly in coal regions such as the Hunter. UNSW Sydney runs graduate certificate and master's programs in mining engineering from its Kensington campus. In turn, Sydney head offices and university programs support steady demand for leadership and technical courses.
Why does Queensland need regional delivery?
Queensland held a 19.3% share of 2025 value and grows at 8.92% a year. The state held 29.34% of the national mining workforce in 2024, and regional areas held 65.78% of its mining jobs. The University of Queensland runs programs in Cloncurry and Moranbah as well as Brisbane. Consequently, regional delivery and online study shape most program spending in this state.
Why is Western Australia the fastest-growing region?
Western Australia held a 16.2% share of 2025 value and grows fastest at 9.22% a year. The state held 46.88% of the national mining workforce in 2024, and it led population growth at 2.1% in the year to March 2026. Curtin University runs the WA School of Mines in Kalgoorlie. As a result, lithium and nickel projects add new leadership demand that local providers increasingly capture.
Tax incentives and new course intakes from 2025 to 2026
| Development | Status and market relevance |
|---|---|
| In February 2025, federal Parliament passed the Critical Minerals Production Tax Incentive, a 10% refundable offset for processing 31 critical minerals. | Starts July 1, 2027 |
| In July 2025, Federation University Australia opened a July 21 intake for its Graduate Diploma of Mining, offered online or on campus. | Recognized by AusIMM |
| In February 2026, the University of Queensland Sustainable Minerals Institute reported more than 120 courses delivered to over 2,000 participants in 2025. | Includes regional centers |
| In August 2026, AusIMM and Melbourne Business School opened an intake for Leadership for Managers in Mining, a five-week online course. | Four weekly modules |
| In October 2026, AusIMM opened an intake for Enterprise Leadership in Mining for professionals moving beyond functional roles. | Senior leadership pathway |
Virtual classrooms and analytics labs reshape study
- Recorded virtual classrooms let managers on remote rosters join live sessions or watch them within 24 hours, which raises completion rates.
- Cloud learning management systems run courses on computers, tablets and phones, which suits staff who study between shifts at remote sites.
- Cloud-based process analytics labs let learners build machine learning models from real plant data, which links training to daily operating decisions.
- Digital twin and simulation exercises let teams test mine plans and automation choices safely, which builds decision skills before changes reach the site.
Need a Custom Version of This Report?
Tailor the scope, geography, or segments to your exact requirements.
- Custom geography or segment scope
- Direct access to our analyst team
Universities and professional bodies lead competition
Competition combines universities, business schools, professional associations and specialist consultants, with learning platforms adding online reach. AusIMM runs short courses, associate certificates and professional certificates in leadership, metal accounting and data analytics, often with partners. Melbourne Business School delivers a leadership course for managers in mining that the professional body co-developed. The University of Queensland, UNSW Sydney, Federation University Australia and Curtin University offer graduate certificates and diplomas aimed at working engineers. Specialist consultancies such as Snowden Optiro and SRK Consulting Australasia compete in technical training linked to their advisory work. Providers compete on industry credibility, roster-friendly delivery, credential recognition, price and the ability to tailor cohorts for single companies.
Companies profiled and their roles in this market
| Company | Type | Role in the market |
|---|---|---|
| AusIMM | Professional association | Leadership, metal accounting and data analytics courses for minerals professionals |
| Melbourne Business School | Business school | Delivers Leadership for Managers in Mining with a professional body |
| University of Queensland | University | Sustainable Minerals Institute courses and Resource Development postgraduate programs |
| UNSW Sydney | University | Graduate Certificate in Mining Engineering with online and block options |
| Federation University Australia | University | Graduate Diploma of Mining online or at Mt Helen |
| Curtin University | University | WA School of Mines with a mining automation professor of practice |
Credence Research view on mine leadership education
Credence Research's view is that Australian spending on mine leadership education will grow strongly through 2035, as critical minerals processing, automation and workforce renewal raise the bar for managers. Corporate-commissioned programs should keep the largest share, while platform access grows fastest as companies buy online libraries. Western Australia will add demand fastest, although eastern head offices keep the largest shares. However, commodity price swings will reward providers that sell flexible subscriptions, recognized credentials and clear proof of results.
How the mine leadership education estimate was built
The report uses 2025 as the base year, with values in USD million at current prices. Market values come from the Credence Research model, which combines mining employment, management ratios, training spend per learner and program price tiers. Regional shares follow the client zone split, and segment splits by service type, learner segment, delivery model and program type are Credence Research estimates. Sources used are official statistics, government releases, skills council bulletins, provider course pages and news reports, and no interviews or surveys were used.
Processing projects and data skills shape demand to 2035
The market is expected to reach USD 723.8 million by 2035, an 8.55% CAGR during 2026–2035, as processing projects, digital operations and leadership renewal keep demand rising. Growth should be strongest in platform learning access, online delivery, technical professionals and Western Australia, while eastern zones keep the largest shares. The processing tax incentive from July 2027 should support new management roles at refineries. In contrast, long commodity downturns could delay cohort programs and push buyers toward shorter online courses.
Frequently Asked Questions
How big is the Australia mining executive education market?
Which region leads mine leadership education spending?
Which region grows fastest?
Which service type holds the largest share?
Why do critical minerals lift program demand?
Which delivery model grows fastest?
Who are the leading providers in this market?
What are the main risks to growth?
Table of Content
Chapter 1 Market Segmentation
- 1.1 Segmentation Framework
- 1.1.1 Product and Service Classification
- 1.1.2 Application and End-Use Classification
- 1.1.3 Technology and Solution Classification
- 1.1.4 Customer and Distribution Channel Classification
- 1.1.5 Geographic Segmentation
- 1.1.6 Market Segment Definitions and Boundaries
- 1.2 By Service Type
- 1.2.1 Open-enrolment education
- 1.2.2 Platform learning access
- 1.2.3 Corporate-commissioned education
- 1.2.4 Leadership consulting and coaching
- 1.3 By Learner Segment
- 1.3.1 Executive leaders
- 1.3.2 Senior managers and managers
- 1.3.3 Technical professionals
- 1.3.4 Supervisors and team leaders
- 1.4 By Delivery Model
- 1.4.1 Online
- 1.4.2 Blended
- 1.4.3 Campus-based
- 1.4.4 Employer-site delivery
- 1.5 By Program Type
- 1.5.1 Short courses and masterclasses
- 1.5.2 Professional certificates
- 1.5.3 Postgraduate award programs
- 1.5.4 Structured coaching programs
Chapter 2 Introduction
- 2.1 Report Objectives and Scope
- 2.2 Product Definition and Industry Terminology
- 2.3 Market Inclusions and Exclusions
- 2.4 Research Process
- 2.4.1 Primary Research and Expert Interviews
- 2.4.2 Secondary Research and Source Review
- 2.4.3 Top-Down and Bottom-Up Estimation
- 2.4.4 Data Triangulation and Verification
- 2.5 Market Size Measurement Basis
- 2.5.1 2025: USD 318.5 million → 2035: USD 723.8 million
- 2.6 Historical and Forecast Reference Periods
- 2.6.1 Historical Period: 2018-2025
- 2.6.2 Base Year: 2025
- 2.6.3 Forecast Period: 2025-2035
- 2.7 Research Assumptions and Limitations
Chapter 3 Executive Summary
- 3.1 Market Snapshot and Key Findings
- 3.2 Base-Year Market Size, 2025
- 3.3 Forecast Market Size, 2035
- 3.4 Revenue and Volume Growth Outlook
- 3.5 Key Demand and Supply Indicators
- 3.6 Leading Market Segments
- 3.7 Fastest-Growing Market Opportunities
- 3.8 Regional Performance Highlights
- 3.9 Technology and Industry Transformation
- 3.10 Competitive Landscape Summary
- 3.11 Analyst View and Strategic Implications
Chapter 4 Australia Mining Executive Education Market Trends and Developments
- 4.1 Historical Industry Development, 2018-2025
- 4.2 Recent Market Trends and Developments
- 4.3 Demand and Customer Behavior Trends
- 4.4 Technology and Product Innovation
- 4.5 Artificial Intelligence, Automation and Digitalization
- 4.6 Local Manufacturing and Supply Chain Realignment
- 4.7 Industry Partnerships, Mergers and Acquisitions
- 4.8 Sustainability and Circular Economy Developments
- 4.9 Government and Private Sector Investment Trends
- 4.10 Emerging Business Models and Commercialization
- 4.11 Industry Developments and Announcements
Chapter 5 Australia Mining Executive Education Market Production, Supply and Demand Analysis
- 5.1 Demand Trend and Consumption Analysis, 2018-2025
- 5.2 Demand Forecast, 2025-2035
- 5.3 Production and Output Trend, 2018-2025
- 5.4 Production and Output Forecast, 2025-2035
- 5.5 Installed Capacity and Capacity Utilization
- 5.6 Company-Wise Production Plants and Statistics
- 5.6.1 Installed Production Capacity
- 5.6.2 Actual Production
- 5.6.3 Planned Capacity and Expansion Targets
- 5.7 Supply Chain Structure and Procurement Trends
- 5.8 Supply-Demand Gap and Bottlenecks
- 5.9 Import Dependence and Sourcing Structure
- 5.10 Contract Manufacturing and Outsourcing
- 5.11 Regional Supply and Demand Concentration
Chapter 6 Australia Mining Executive Education Market Pricing Analysis
- 6.1 Pricing Structure and Measurement
- 6.2 Historical Pricing Trends, 2018-2025
- 6.3 Pricing Outlook, 2025-2035
- 6.4 Average Selling Price and Unit Economics
- 6.5 Pricing by Product and Market Segment
- 6.6 Geographic Pricing Differences
- 6.7 Key Input, Energy, Labor and Logistics Costs
- 6.8 Contract Pricing and Purchasing Models
- 6.9 Pricing Sensitivity and Competitive Positioning
- 6.10 Price, Margin and Profitability Implications
Chapter 7 Australia Mining Executive Education Market Dynamics
- 7.1 Market Growth Drivers
- 7.1.1 Demand-Side Drivers
- 7.1.2 Technology and Innovation Drivers
- 7.1.3 Infrastructure and Investment Drivers
- 7.1.4 Regulatory and Policy Drivers
- 7.2 Market Restraints
- 7.2.1 Cost and Affordability Constraints
- 7.2.2 Technology and Adoption Barriers
- 7.2.3 Supply Chain and Operational Constraints
- 7.3 Market Challenges
- 7.3.1 Competitive Pressure and Margin Erosion
- 7.3.2 Skills, Infrastructure and Implementation Gaps
- 7.4 Emerging Market Opportunities
- 7.5 Market Dynamics Impact and Time-Horizon Assessment
Chapter 8 Australia Mining Executive Education Value Chain Analysis
- 8.1 Industry Value Chain Overview
- 8.2 Upstream Suppliers and Critical Inputs
- 8.3 Technology and Component Providers
- 8.4 Manufacturing or Service Delivery
- 8.5 Distribution, Channel Partners and Integrators
- 8.6 Downstream Applications and End Users
- 8.7 Value Addition and Profit Pools
- 8.8 Vertical Integration and Outsourcing
- 8.9 Supplier Concentration and Risk
- 8.10 Supply Chain Localization and Resilience
Chapter 9 Australia Mining Executive Education Market Regulations and Policies
- 9.1 Relevant Laws, Standards and Compliance Frameworks
- 9.2 Product, Service, Safety and Quality Requirements
- 9.3 Government Policies, Incentives and Subsidies
- 9.4 Imports, Exports and Trade Barriers
- 9.5 Public Procurement and Local Content Requirements
- 9.6 Environmental and Sustainability Compliance
- 9.7 Upcoming Policy Changes and Market Implications
Chapter 10 Australia Mining Executive Education Market Hotspots and Opportunities
- 10.1 Market Opportunity Mapping and Growth Hotspots
- 10.2 High-Growth Applications and Customer Groups
- 10.3 Underserved Markets and White-Space Opportunities
- 10.4 Emerging Technology and Product Opportunities
- 10.5 New Capacity and Investment Hotspots
- 10.6 Market Entry and Expansion Opportunities
- 10.7 Distribution and Partnership Opportunities
- 10.8 Near-Term and Long-Term Commercial Potential
- 10.9 Opportunity Attractiveness and Execution Risks
Chapter 11 Australia Mining Executive Education Market Outlook, 2025-2035
- 11.1 Market Size and Analysis
- 11.1.1 Revenue (Market Measurement: 2025: USD 318.5 million → 2035: USD 723.8 million)
- 11.1.2 Market Volume and Quantity Sold
- 11.1.3 Historical Market Size, 2018-2025
- 11.1.4 Base-Year Market Size, 2025
- 11.2 Market Forecast, 2025-2035
- 11.2.1 Revenue Forecast to 2035
- 11.2.2 Volume Forecast to 2035
- 11.2.3 CAGR and Year-on-Year Growth
- 11.2.4 Incremental Revenue Opportunity
- 11.3 Forecast Assumptions and Scenario Analysis
- 11.3.1 Base-Case Forecast
- 11.3.2 Optimistic and Conservative Scenarios
- 11.3.3 Technology, Pricing and Policy Sensitivities
- 11.4 Market Attractiveness and Growth Outlook
Chapter 12 Australia Mining Executive Education Market Segmentation and Outlook
- 12.1 Segmentation Summary and Market Shares, 2025
- 12.2 Largest and Fastest-Growing Segments
- 12.3 By Service Type - Market Size and Forecast, 2025-2035
- 12.3.1 Segment Definition and Scope
- 12.3.2 Historical Market Size, 2018-2025
- 12.3.3 Revenue Forecast, 2025-2035
- 12.3.4 Volume Forecast, 2025-2035
- 12.3.5 Base-Year Market Share, 2025
- 12.3.6 Segment CAGR and Growth Drivers
- 12.3.7 Subsegment Market Size and Forecast
- 12.3.7.1 Open-enrolment education
- 12.3.7.2 Platform learning access
- 12.3.7.3 Corporate-commissioned education
- 12.3.7.4 Leadership consulting and coaching
- 12.3.8 Subsegment Pricing and Adoption Trends
- 12.3.9 Leading Suppliers and Competition
- 12.3.10 Regional Demand and Opportunities
- 12.4 By Learner Segment - Market Size and Forecast, 2025-2035
- 12.4.1 Segment Definition and Scope
- 12.4.2 Historical Market Size, 2018-2025
- 12.4.3 Revenue Forecast, 2025-2035
- 12.4.4 Volume Forecast, 2025-2035
- 12.4.5 Base-Year Market Share, 2025
- 12.4.6 Segment CAGR and Growth Drivers
- 12.4.7 Subsegment Market Size and Forecast
- 12.4.7.1 Executive leaders
- 12.4.7.2 Senior managers and managers
- 12.4.7.3 Technical professionals
- 12.4.7.4 Supervisors and team leaders
- 12.4.8 Subsegment Pricing and Adoption Trends
- 12.4.9 Leading Suppliers and Competition
- 12.4.10 Regional Demand and Opportunities
- 12.5 By Delivery Model - Market Size and Forecast, 2025-2035
- 12.5.1 Segment Definition and Scope
- 12.5.2 Historical Market Size, 2018-2025
- 12.5.3 Revenue Forecast, 2025-2035
- 12.5.4 Volume Forecast, 2025-2035
- 12.5.5 Base-Year Market Share, 2025
- 12.5.6 Segment CAGR and Growth Drivers
- 12.5.7 Subsegment Market Size and Forecast
- 12.5.7.1 Online
- 12.5.7.2 Blended
- 12.5.7.3 Campus-based
- 12.5.7.4 Employer-site delivery
- 12.5.8 Subsegment Pricing and Adoption Trends
- 12.5.9 Leading Suppliers and Competition
- 12.5.10 Regional Demand and Opportunities
- 12.6 By Program Type - Market Size and Forecast, 2025-2035
- 12.6.1 Segment Definition and Scope
- 12.6.2 Historical Market Size, 2018-2025
- 12.6.3 Revenue Forecast, 2025-2035
- 12.6.4 Volume Forecast, 2025-2035
- 12.6.5 Base-Year Market Share, 2025
- 12.6.6 Segment CAGR and Growth Drivers
- 12.6.7 Subsegment Market Size and Forecast
- 12.6.7.1 Short courses and masterclasses
- 12.6.7.2 Professional certificates
- 12.6.7.3 Postgraduate award programs
- 12.6.7.4 Structured coaching programs
- 12.6.8 Subsegment Pricing and Adoption Trends
- 12.6.9 Leading Suppliers and Competition
- 12.6.10 Regional Demand and Opportunities
- 12.7 Segment Growth Comparison
- 12.8 Segment Attractiveness and Priority Matrix
Chapter 13 Australia Mining Executive Education Geographic Market Outlook, 2025-2035
- 13.1 Domestic Market Distribution and Demand Clusters
- 13.2 State- or Province-Wise Market Size and Forecast, 2025-2035
- 13.3 City and Metropolitan Market Outlook
- 13.4 Industrial, Manufacturing and Commercial Clusters
- 13.5 Geographic Concentration of Key End Users
- 13.6 Local Pricing and Purchasing Differences
- 13.7 Domestic Production Facilities and Capacity Map
- 13.8 Local Infrastructure and Project Pipeline
- 13.9 State-Level Policy and Incentive Differences
- 13.10 Subnational Investment Hotspots and Opportunities
- 13.11 Distribution and Logistics Networks
- 13.12 Domestic Competitive Footprint
Chapter 14 Australia Mining Executive Education Technology, Innovation and Sustainability Outlook
- 14.1 Technology Landscape and Maturity
- 14.2 Product, Process and Service Innovation
- 14.3 AI, Automation and Digital Tools in the Industry
- 14.4 Technology Adoption and Performance Benchmarking
- 14.5 Innovation Pipeline and R&D Investment
- 14.6 Patent and Intellectual Property Trends
- 14.7 Energy Efficiency and Resource Management
- 14.8 Sustainability, Recycling and Circularity
- 14.9 Technology Roadmap, 2025-2035
- 14.10 Risks of Obsolescence and Technology Substitution
Chapter 15 Australia Mining Executive Education Market Key Strategic Imperatives
- 15.1 Growth and Market Entry Priorities
- 15.2 High-Return Products and Segments
- 15.3 Pricing, Profitability and Cost Optimization
- 15.4 Technology Investment and Product Differentiation
- 15.5 Supply Chain Localization and Resilience
- 15.6 Distribution and Customer Acquisition
- 15.7 Partnership, Acquisition and Capacity Strategy
- 15.8 Regional Expansion Priorities
- 15.9 Short-, Medium- and Long-Term Actions
Chapter 16 Competition Outlook
- 16.1 Industry Competition Characteristics
- 16.2 Market Structure and Concentration
- 16.3 Market Share and Competitive Positioning, 2025
- 16.4 Company-Wise Revenue and Product Benchmarking
- 16.5 Production and Service Capacity Benchmarking
- 16.6 Technology, Pricing and Differentiation
- 16.7 Regional Footprint and Distribution Strength
- 16.8 Mergers, Acquisitions and Strategic Alliances
- 16.9 New Entrants and Competitive Threats
- 16.10 Porter's Five Forces and Industry Attractiveness
- 16.11 Competitive Outlook, 2025-2035
Chapter 17 Company Profiles
- 17.1 Company Coverage and Selection Criteria
- 17.2 Curtin University
- 17.2.1 Business Description
- 17.2.2 Company Ownership and Geographic Presence
- 17.2.3 Product and Service Portfolio
- 17.2.4 Manufacturing and Operating Footprint
- 17.2.5 Production Capacity and Expansion Plans
- 17.2.6 Financial Performance and Investment
- 17.2.7 Market Share and Competitive Position
- 17.2.8 Technology and Innovation Capabilities
- 17.2.9 Strategic Alliances or Partnerships
- 17.2.10 Recent Developments
- 17.2.11 Growth Strategy and Outlook
- 17.3 University of Queensland
- 17.4 UNSW Sydney
- 17.5 University of Western Australia
- 17.6 AusIMM
- 17.7 Melbourne Business School
- 17.8 Federation University Australia
- 17.9 Engineering Institute of Technology
- 17.10 Snowden Optiro
- 17.11 SRK Consulting Australasia
- 17.12 Other Relevant Market Participants
Note: Every listed company is profiled on the structure shown under the first company. The company list is preliminary and may change based on research findings, market developments, data availability and client requirements.
Chapter 18 Disclaimer
- 18.1 Research and Forecast Disclaimer
- 18.2 Data Source and Estimation Limitations
Note: The depth of individual sections depends on data availability for this market. Volume, capacity, trade and other unit-based metrics are included where applicable.

