
Direct Reduced Iron (DRI) Market Overview:
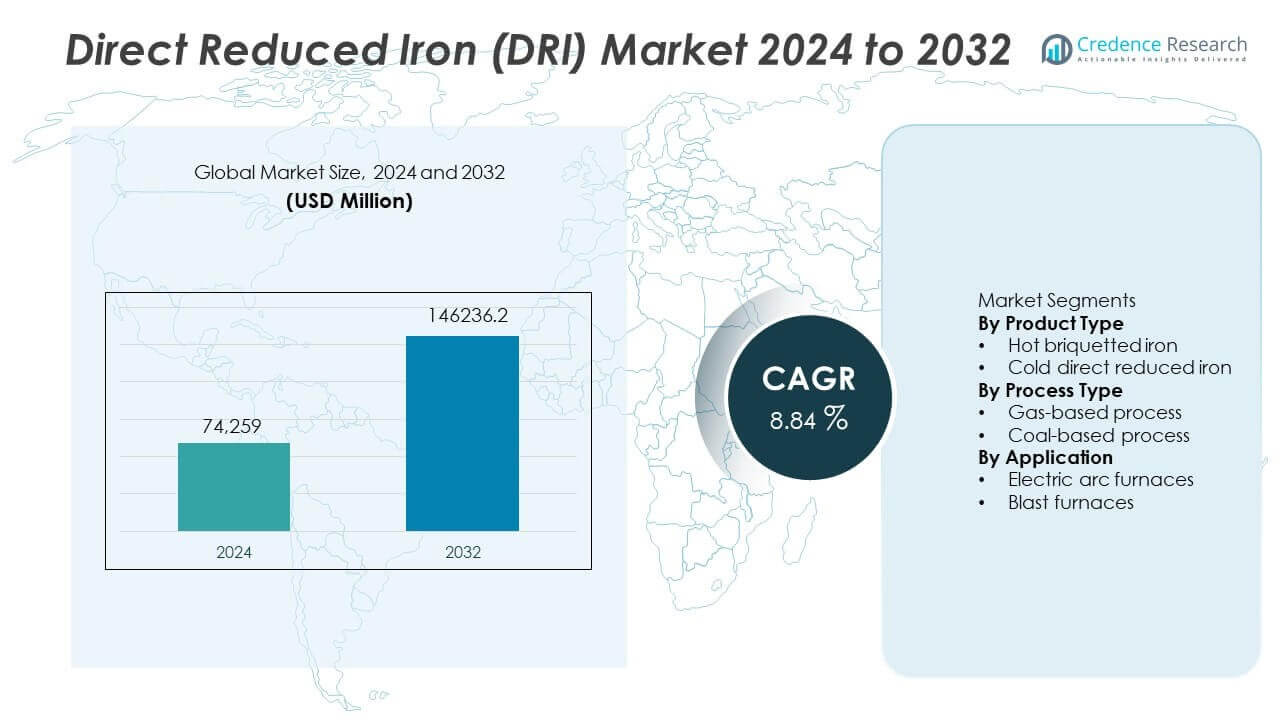
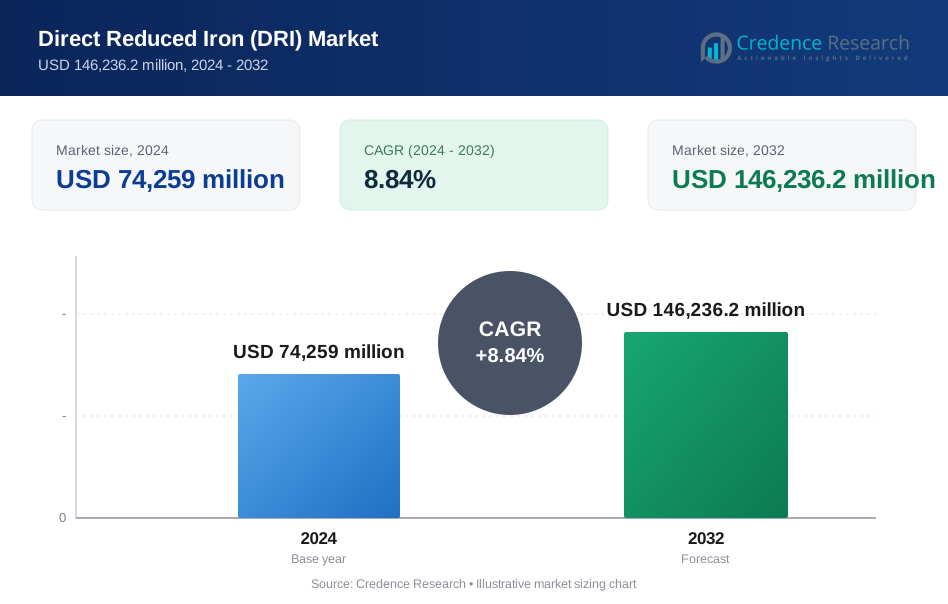
The Direct Reduced Iron (DRI) market was valued at USD 74,259 million in 2024. The market is projected to reach USD 146,236.2 million by 2032. Growth is expected at a CAGR of 8.84% during the forecast period.
| REPORT ATTRIBUTE | DETAILS |
|---|---|
| Historical Period | 2020-2024 |
| Base Year | 2025 |
| Forecast Period | 2026-2032 |
| Direct Reduced Iron (DRI) Market Size 2024 | USD 74,259 million |
| Direct Reduced Iron (DRI) Market, CAGR | 8.84% |
| Direct Reduced Iron (DRI) Market Size 2032 | USD 146,236.2 million |
Direct Reduced Iron (DRI) Market Insights
- Rising adoption of electric arc furnaces, demand for low-carbon steel, and limited scrap availability drive Direct Reduced Iron market growth.
- Gas-based processes dominate with a 67% segment share, driven by lower emissions, higher efficiency, and natural gas availability.
- Competitive intensity remains high as producers invest in hydrogen-ready DRI technologies, capacity expansion, and long-term energy sourcing.
- Asia Pacific leads with a 41% regional share, followed by North America at 22% and Europe at 20%, reflecting steel production scale, EAF expansion, and regulatory pressure.
Direct Reduced Iron (DRI) Market Segmentation Analysis:
By Product Type
Hot briquetted iron dominates the Direct Reduced Iron (DRI) market with a 58% segment share. Steelmakers prefer hot briquetted iron due to higher density and safer handling. Improved transport stability reduces oxidation risks during shipping. Global trade favors hot briquetted iron for cross-border supply. Cold direct reduced iron holds a 42% share, supported by captive steel plants with nearby consumption. Hot briquetted iron leads because it suits large-scale electric arc furnace operations. Growing international DRI trade strengthens demand for compact and durable briquetted formats. Capacity expansions in export-oriented regions further support dominance.
- For instance, Tata Steel is implementing gas-based DRI technology designed to supply hot DRI via pneumatic transport directly to electric arc furnaces within the integrated facility to maximize energy efficiency.
By Process Type
Gas-based processes lead the DRI market with a 67% market share. Natural gas-based reduction delivers lower carbon emissions. Steel producers adopt gas-based routes to meet decarbonization targets. Higher metallization rates improve steel quality. Coal-based processes account for a 33% share, mainly in regions with abundant coal reserves. Gas-based dominance reflects environmental regulations and energy efficiency benefits. Access to low-cost natural gas strengthens adoption. Hydrogen-ready gas-based technologies also support future transition plans. Sustainability goals continue shifting investments toward gas-based DRI facilities.
- For instance, Indian rotary kiln units operated by JSW Steel run with kiln lengths exceeding 70 meters, supporting continuous coal-based reduction.
By Application
Electric arc furnaces represent the largest application segment with a 72% market share. DRI improves scrap quality and consistency in electric arc furnace steelmaking. Growing electric arc furnace capacity drives strong DRI consumption. Low impurity levels enhance final steel properties. Blast furnaces hold a 28% share, using DRI as a supplemental charge material. Electric arc furnace dominance reflects global steel decarbonization strategies. Flexible production and lower emissions favor electric arc furnace routes. Rising green steel investments further accelerate DRI use in electric arc furnace applications.
Key Growth Drivers
Global Shift Toward Low-Carbon Steelmaking
Steel producers actively reduce carbon emissions across operations. Direct Reduced Iron supports lower-emission steel routes. Electric arc furnaces increasingly replace blast furnaces. DRI enables cleaner metallic charge materials. Regulatory pressure accelerates decarbonization investments. Green steel commitments influence capacity additions. DRI integrates well with renewable-powered furnaces. Corporate sustainability targets favor gas-based reduction. Governments support low-carbon steel incentives. This driver strongly accelerates DRI adoption across developed and emerging steel markets.
- For instance, ArcelorMittal’s hydrogen-ready DRI plant in Hamburg operates with a shaft furnace capacity of 100,000 tons per year, supporting low-emission trials.
Expansion of Electric Arc Furnace Capacity
Electric arc furnace installations continue rising globally. Scrap availability alone cannot meet quality needs. DRI improves consistency and purity of steel output. Steelmakers blend DRI with scrap to optimize chemistry. Flexible furnace operations support varied input materials. EAF routes require reliable metallic feedstock. Infrastructure investment supports EAF expansion. Urban steel demand favors decentralized production. This driver directly increases DRI consumption volumes worldwide.
- For instance, Nucor blends DRI produced at its Louisiana plant with rated capacity of 2.5 million tons per year into EAF operations.
Availability of Natural Gas and Process Efficiency
Regions with natural gas access favor gas-based DRI routes. Gas-based reduction offers higher metallization efficiency. Energy efficiency lowers operational costs. Stable gas supply supports continuous production. Producers achieve better yield control with gas processes. Cleaner reduction improves downstream steel quality. Infrastructure development supports gas availability. This driver sustains long-term investment in DRI plants.
Key Trends & Opportunities
Development of Hydrogen-Based DRI Technologies
Hydrogen-based DRI gains strong strategic interest. Steelmakers pilot low-carbon reduction processes. Green hydrogen supports near-zero emission steelmaking. Governments fund hydrogen infrastructure projects. Early adopters gain regulatory and brand advantages. Technology partnerships accelerate innovation. Transition-ready plants reduce future retrofit costs. This trend creates long-term growth opportunities in sustainable steel production.
- For instance, Tenova validated ENERGIRON reactors with hydrogen injection rates exceeding 30 normal cubic meters per ton of DRI. Transition-ready designs lower long-term retrofit costs and compliance risks.
Growth in International DRI Trade
Global DRI trade volumes continue expanding. Hot briquetted iron supports safe long-distance transport. Export-oriented regions invest in capacity. Import-dependent steelmakers secure alternative metallic inputs. Trade flexibility improves supply chain resilience. Port infrastructure supports bulk handling. Price competitiveness attracts global buyers. This trend expands DRI market reach beyond domestic consumption.
- For instance, the Saudi Iron & Steel Company (Hadeed) supplies direct reduced iron products from its Saudi facilities to support both domestic manufacturing and regional export markets.
Key Challenges
High Capital Investment Requirements
DRI plant construction requires significant capital. Gas infrastructure adds to upfront costs. Financing remains challenging in emerging markets. Long payback periods increase risk exposure. Technology upgrades raise capital intensity. Smaller producers face entry barriers. Cost overruns affect project timelines. This challenge slows rapid capacity expansion in cost-sensitive regions.
Dependence on Energy Prices and Availability
DRI production depends heavily on energy inputs. Natural gas price volatility affects margins. Supply disruptions impact plant utilization. Coal-based routes face environmental constraints. Energy insecurity raises operational risk. Long-term contracts limit flexibility. Price spikes reduce competitiveness. This challenge requires robust energy sourcing and risk management strategies.
Regional Analysis
North America
North America holds a 22% market share in the Direct Reduced Iron market. Strong electric arc furnace capacity supports steady DRI demand. Access to low-cost natural gas favors gas-based reduction routes. Steelmakers use DRI to improve scrap quality and consistency. Decarbonization targets accelerate investment in low-emission steelmaking. Hot briquetted iron imports support supply flexibility. Infrastructure and port access enable efficient logistics. Corporate sustainability commitments influence procurement decisions. Policy support for cleaner steel strengthens long-term demand across the United States and Canada.
Europe
Europe accounts for a 20% market share in the Direct Reduced Iron market. Stringent emissions regulations drive adoption of low-carbon inputs. Electric arc furnace expansion increases DRI consumption. Hydrogen-ready DRI projects gain traction under green steel initiatives. Limited scrap availability raises reliance on high-purity metallics. Imports of hot briquetted iron supplement domestic supply. Energy transition policies shape investment priorities. Collaboration between steelmakers and energy providers supports innovation. Stable demand reflects regulatory pressure and strong decarbonization roadmaps.
Asia Pacific
Asia Pacific represents a 41% market share in the Direct Reduced Iron market. Rapid steel production growth drives high DRI usage. Expanding electric arc furnace capacity boosts consumption. Coal-based processes remain relevant in coal-rich regions. Gas-based projects grow where natural gas access improves. Infrastructure expansion supports large-scale operations. Urbanization and construction demand sustain steel output. Export-oriented production increases hot briquetted iron trade. Cost competitiveness and scale underpin the region’s market leadership.
Rest of the World
The rest of the world holds a 17% market share in the Direct Reduced Iron market. The Middle East and Latin America lead regional demand. Abundant natural gas supports gas-based DRI production. Export-focused plants supply hot briquetted iron globally. Steelmakers use DRI to diversify metallic inputs. Infrastructure investments improve logistics and port handling. Energy availability attracts capacity additions. Policy support varies by country but favors efficiency gains. The region offers growth through exports and new projects.
Direct Reduced Iron (DRI) Market Segmentations:
By Product Type
- Hot briquetted iron
- Cold direct reduced iron
By Process Type
- Gas-based process
- Coal-based process
By Application
- Electric arc furnaces
- Blast furnaces
By Geography
- North America
- U.S.
- Canada
- Mexico
- Europe
- Germany
- France
- U.K.
- Italy
- Spain
- Rest of Europe
- Asia Pacific
- China
- Japan
- India
- South Korea
- South-east Asia
- Rest of Asia Pacific
- Latin America
- Brazil
- Argentina
- Rest of Latin America
- Middle East & Africa
- GCC Countries
- South Africa
- Rest of the Middle East and Africa
Competitive Landscape
Competitive landscape analysis highlights ArcelorMittal, MIDREX Technologies, Tenova, Nucor Corporation, and Tata Steel as key participants in the Direct Reduced Iron market. These players compete through capacity scale, process efficiency, and technology leadership. Market leaders prioritize gas-based and hydrogen-ready DRI routes to meet decarbonization targets. Long-term natural gas access and vertical integration strengthen cost control. Technology providers focus on improving metallization rates and energy efficiency. Steel producers expand captive DRI units to secure high-quality metallic inputs for electric arc furnaces. Strategic partnerships support hydrogen pilots and low-carbon transitions. Export-oriented producers leverage hot briquetted iron for global trade. Competitive intensity remains high as sustainability mandates, energy costs, and green steel demand reshape investment decisions and capacity planning.
Key Player Analysis
- ArcelorMittal
- MIDREX Technologies
- Tenova
- Voestalpine AG
- JSW Steel
- Nucor Corporation
- Metinvest Group
- Tata Steel
- Essar Steel
- Hadeed (SABIC)
Recent Developments
- In November 2025, JSW Steel secured supply from a new green hydrogen unit at Vijayanagar. The project targets 3,800 tons per year of green hydrogen for the DRI unit.
- In July 2025, voestalpine AG produced the world’s first hydrogen-based rail. The rail used hydrogen-reduced iron made in the HYFOR pilot plant.
- In March 2024, Tenova won a contract to supply an experimental hydrogen DRI plant in Japan. The plant uses the ENERGIRON® direct reduction technology.
Report Coverage
The research report offers an in-depth analysis based on Product Type, Process Type, Application and Geography. It details leading market players, providing an overview of their business, product offerings, investments, revenue streams, and key applications. Additionally, the report includes insights into the competitive environment, SWOT analysis, current market trends, as well as the primary drivers and constraints. Furthermore, it discusses various factors that have driven market expansion in recent years. The report also explores market dynamics, regulatory scenarios, and technological advancements that are shaping the industry. It assesses the impact of external factors and global economic changes on market growth. Lastly, it provides strategic recommendations for new entrants and established companies to navigate the complexities of the market.
Future Outlook
- Low-carbon steelmaking will continue driving DRI demand growth.
- Electric arc furnace expansion will increase DRI consumption volumes.
- Gas-based reduction routes will remain the dominant production method.
- Hydrogen-ready DRI plants will gain strategic importance.
- International trade of hot briquetted iron will expand further.
- Energy efficiency improvements will enhance process competitiveness.
- Emerging markets will invest in new DRI capacity.
- Long-term energy sourcing will influence plant location decisions.
- Technology partnerships will accelerate decarbonization progress.
- Policy support for green steel will strengthen DRI adoption globally.
Request a Free Sample
Fill in your details and we'll send you a free sample report.
- Sample data tables & charts
- Research methodology
Need a Custom Version of This Report?
Tailor the scope, geography, or segments to your exact requirements.
- Custom geography or segment scope
- Direct access to our analyst team
Frequently Asked Questions
What is the current market size for Direct Reduced Iron (DRI) market, and what is its projected size in 2032?
At what Compound Annual Growth Rate is the Direct Reduced Iron (DRI) market projected to grow between 2024 and 2032?
Which Direct Reduced Iron (DRI) market segment held the largest share in 2024?
What are the primary factors fueling the growth of the Direct Reduced Iron (DRI) market?
Who are the leading companies in the Direct Reduced Iron (DRI) market?
Which region commanded the largest share of the Direct Reduced Iron (DRI) market in 2024?
Table of Content
Chapter 1. Report Introduction
- 1.1 Report Description & Purpose
- 1.1.1 Report Title & Market Definition
- 1.1.2 Unique Selling Propositions (USP) & Key Differentiators
- 1.1.3 Value Proposition for Stakeholders
- 1.2 Research Objectives
- 1.2.1 Market Sizing Objectives (Volume & Revenue)
- 1.2.2 Segmentation Objectives
- 1.2.3 Competitive Intelligence Objectives
- 1.2.4 Forecast & Scenario Objectives
- 1.3 Report Scope
- 1.3.1 Direct Reduced Iron (DRI) Scope – Types & Subtypes Covered
- 1.3.2 Geographic Scope – Regions & Countries Covered
- 1.3.3 Historical Period, Base Year & Forecast Period (2024; forecast to 2032)
- 1.3.4 Inclusions & Exclusions
- 1.4 HS Code & Classification Framework
- 1.5 Currency, Units & Pricing Basis
- 1.6 Target Stakeholders
- 1.7 Limitations & Assumptions
Chapter 2. Executive Summary
- 2.1 Global Direct Reduced Iron (DRI) Market Snapshot
- 2.1.1 Market Size – Historical (2024) & Forecast (2024-2032) (2024: USD 74,259 million → 2032: USD 146,236.2 million)
- 2.1.2 Volume & Revenue – Global Totals
- 2.1.3 Key Market Highlights – Top Five Facts
- 2.2 Direct Reduced Iron (DRI) Market Segmentation Snapshot
- 2.2.1 Market Split by Region – 2024 vs. 2032
- 2.3 Competitive Snapshot
- 2.3.1 Top 10 Players by Revenue Share – 2024
- 2.3.2 Top 10 Players by Volume Share – 2024
- 2.3.3 Recent Strategic Developments (18-Month Summary)
- 2.4 Key Investment Highlights & Strategic Conclusions
Chapter 3. Direct Reduced Iron (DRI) Market Dynamics & Industry Analysis
- 3.1 Market Overview & Context
- 3.1.1 Direct Reduced Iron (DRI) Market Position in the Broader Automotive Value Chain
- 3.1.2 OEM vs. Replacement Market Dynamics
- 3.1.3 Market Maturity & Development Stage by Region
- 3.2 Direct Reduced Iron (DRI) Market Drivers
- 3.3 Direct Reduced Iron (DRI) Market Restraints & Challenges
- 3.4 Direct Reduced Iron (DRI) Market Opportunities
- 3.5 Porter's Five Forces Analysis
- 3.5.1 Threat of New Entrants
- 3.5.2 Bargaining Power of Suppliers
- 3.5.3 Bargaining Power of Buyers
- 3.5.4 Threat of Substitutes
- 3.5.5 Competitive Rivalry – Intensity Assessment
- 3.6 Direct Reduced Iron (DRI) Value Chain Analysis
- 3.6.1 Upstream – Raw Material/Input Suppliers
- 3.6.1.1 Raw Material/Input 1
- 3.6.1.2 Raw Material/Input 2
- 3.6.1.3 Raw Material/Input 3
- 3.6.2 Midstream – Production/Manufacturing/Service Delivery
- 3.6.2.1 Production/Process Overview
- 3.6.2.2 Key Facility Locations & Capacity by Manufacturer
- 3.6.3 Downstream – Distribution & End Consumer
- 3.6.3.1 Primary Channel – B2B/OEM
- 3.6.3.2 Secondary Channels – Dealer, Retail, Online, Direct
- 3.6.4 Value Chain Profitability Analysis
- 3.6.1 Upstream – Raw Material/Input Suppliers
- 3.7 PESTEL Analysis
- 3.7.1 Political Factors
- 3.7.2 Economic Factors
- 3.7.3 Social Factors
- 3.7.4 Technological Factors
- 3.7.5 Environmental Factors
- 3.7.6 Legal Factors
- 3.8 Direct Reduced Iron (DRI) Supply Chain Analysis
- 3.8.1 Raw Material/Input Supply Risk Assessment
- 3.8.2 Manufacturing Concentration Risk (Geographic Exposure)
- 3.8.3 Trade Disruption Impact Analysis
- 3.9 Regulatory & Policy Landscape
Note: The regulatory and policy landscape section covers regulations based on their applicability to the market, Direct Reduced Iron (DRI) category, geography, and scope of the study. Only regulatory frameworks with a material impact on operations, compliance, trade, sustainability, or market access are analyzed in detail.
Chapter 4. Key Investment Pockets & Opportunity Analysis
- 4.1 Direct Reduced Iron (DRI) Market Attractiveness Analysis
- 4.1.1 By Region – Investment Attractiveness Matrix (Volume × CAGR)
- 4.2 Absolute Revenue Growth Opportunity
- 4.2.1 By Region – Absolute USD Growth Through 2032
- 4.3 Incremental Volume Opportunity
- 4.3.1 By Region – Incremental Volume Through 2032
- 4.3.2 Segment – Incremental Volume
- 4.4 Emerging Submarket Opportunity Deep Dive (Subject to Applicability)
- 4.5 Emerging Market Opportunity Scorecards
- 4.5.1 United States
- 4.5.2 Europe
- 4.5.3 Asia
- 4.5.4 Middle East & Africa
Note: Emerging Market Opportunity Scorecards will be included based on relevance and strategic importance. Regions listed are indicative and may vary depending on data availability and market dynamics.
Chapter 5. Direct Reduced Iron (DRI) Import-Export Analysis & Trade Flows
- 5.1 Global Trade Overview
- 5.1.1 Global Export Value by Country (2024)
- 5.1.2 Global Export Volume by Country (2024)
- 5.1.3 Global Import Value by Country (2024)
- 5.1.4 Global Import Volume by Country (2024)
- 5.1.5 Net Trade Balance by Country (2024)
- 5.2 Export Analysis – Segment
- 5.2.1 Type 1 (HS Code)
- 5.2.2 Type 2 (HS Code)
- 5.2.3 Type 3 (HS Code)
- 5.2.4 Type 4 (HS Code)
- 5.2.5 Type 5 (HS Code)
- 5.3 Import Analysis – Segment
- 5.3.1 Type 1 (HS Code)
- 5.3.2 Type 2 (HS Code)
- 5.3.3 Type 3 (HS Code)
- 5.3.4 Type 4 (HS Code)
- 5.3.5 Type 5 (HS Code)
- 5.4 Average Unit Trade Prices
- 5.4.1 Average Export Price – Segment & Country
- 5.4.2 Average Import Price – Segment & Source Country
- 5.4.3 Price Trends (2024)
- 5.5 Key Trade Route Analysis
- 5.5.1 Trade Route 1
- 5.5.2 Trade Route 2
- 5.5.3 Trade Route 3
- 5.5.4 Trade Route 4
- 5.5.5 Trade Route 5
- 5.6 Trade Policy Impact Assessment
- 5.6.1 US Anti-Dumping & Section 301 Tariffs
- 5.6.2 EU Customs Union Impact
- 5.6.3 Major Free Trade Agreements
- 5.6.4 USMCA Rules of Origin
Note: Trade policy analysis will be included only where relevant to the Direct Reduced Iron (DRI) market.
Chapter 6. Competitive Landscape & Company Benchmarking
- 6.1 Direct Reduced Iron (DRI) Market Concentration & Structure
- 6.1.1 Herfindahl-Hirschman Index (HHI) – vs. 2024
- 6.1.2 Tier 1, Tier 2 & Tier 3 Market Structure
- 6.1.3 Global, Regional & Local Player Dynamics
- 6.2 Direct Reduced Iron (DRI) Market Share Analysis – 2024
- 6.2.1 Global Revenue Share by Company
- 6.2.2 Global Volume Share by Company
- 6.2.3 Regional Revenue Share
- 6.2.4 Market Share Evolution ( vs. 2024)
- 6.2.5 OEM Segment Share by Company
- 6.2.6 Replacement Segment Share by Company
- 6.3 Production/Delivery Capacity & Facility Analysis
- 6.3.1 Global Installed Capacity
- 6.3.2 Capacity Utilization Rates
- 6.3.3 Production/Output Volume
- 6.3.4 Facility Locations & Capacity Map
- 6.3.5 Planned Capacity Additions
- 6.4 Direct Reduced Iron (DRI) Competitive Benchmarking Matrix
- 6.4.1 Revenue, Volume, CAGR & Profitability Comparison
- 6.4.2 Channel Revenue Mix
- 6.4.3 Geographic Revenue Exposure
- 6.4.4 R&D Intensity
- 6.4.5 Sustainability Maturity
- 6.5 Strategic Developments in Direct Reduced Iron (DRI) (Last 24 Months)
- 6.5.1 Mergers, Acquisitions & Divestments
- 6.5.2 New Direct Reduced Iron (DRI) Launches
- 6.5.3 Facility Expansions
- 6.5.4 Strategic Alliances, Joint Ventures & Partnerships
- 6.5.5 Distribution Expansion & Market Entry
- 6.5.6 Sustainability & ESG Initiatives
- 6.6 Competitive Strategy Mapping
- 6.6.1 Leader, Challenger, Follower & Niche Classification
- 6.6.2 Pricing Strategy Comparison
- 6.6.3 Channel Strategy Matrix
Note: Strategic developments are included based on their materiality and the availability of reliable information.
Chapter 7. Global Direct Reduced Iron (DRI) Market – By Distribution Channel
- 7.1 Segment Overview
- 7.1.1 Volume & Revenue Split by Channel (2024 & 2032)
- 7.1.2 Channel Mix Evolution (2024-2032)
Chapter 8. Regional Market Analysis – Global Overview
- 8.1 Global Regional Overview
- 8.1.1 Regional Volume Share
- 8.1.2 Regional Revenue Share
- 8.1.3 Regional Volume by Region
- 8.1.4 Regional Revenue by Region
- 8.1.5 Regional Forecast Through 2032
- 8.2 Cross-Regional Segment Analysis
- 8.2.1 By Distribution Channel
- 8.2.2 By Brand/Price Tier
Chapter 9. North America Direct Reduced Iron (DRI) Market
- 9.1 United States
- 9.2 Canada
- 9.3 Mexico
Chapter 10. Europe Direct Reduced Iron (DRI) Market
- 10.1 Germany
- 10.2 France
- 10.3 Italy
- 10.4 United Kingdom
- 10.5 Spain
- 10.6 Poland
- 10.7 Russia
- 10.8 Netherlands
- 10.9 Belgium
- 10.10 Sweden
- 10.11 Denmark
- 10.12 Norway
- 10.13 Rest of Europe
Chapter 11. Asia Pacific Direct Reduced Iron (DRI) Market
- 11.1 China
- 11.2 India
- 11.3 Japan
- 11.4 South Korea
- 11.5 Thailand
- 11.6 Indonesia
- 11.7 Vietnam
- 11.8 Malaysia
- 11.9 Australia
- 11.10 Rest of Asia Pacific
Chapter 12. Latin America Direct Reduced Iron (DRI) Market
- 12.1 Brazil
- 12.2 Argentina
- 12.3 Colombia
- 12.4 Chile
- 12.5 Rest of Latin America
Chapter 13. Middle East Direct Reduced Iron (DRI) Market
- 13.1 Saudi Arabia
- 13.2 United Arab Emirates
- 13.3 Turkey
- 13.4 Israel
- 13.5 Iran
- 13.6 Rest of the Middle East
Chapter 14. Africa Direct Reduced Iron (DRI) Market
- 14.1 South Africa
- 14.2 Egypt
- 14.3 Nigeria
- 14.4 Morocco
- 14.5 Rest of Africa
Chapter 15. Direct Reduced Iron (DRI) Company Profiles
- 15.1 [Company 01]
- 15.1.1 Company Overview
- 15.1.2 Key Management Personnel
- 15.1.3 Products & Services Portfolio
- 15.1.4 Financial Performance
- 15.1.5 Key Market Focus & Geographic Presence
- 15.1.6 Recent Developments & Strategic Initiatives
Note: The company profile list is preliminary and may change based on research findings, market developments, data availability, and client requirements.
Chapter 16. Appendices
- Appendix A – List of Abbreviations & Acronyms
- Appendix B – Industry Classification Code Reference – Full Series
- Appendix C – Production & Capacity Data Tables
- Appendix D – End-Use & Demand Base Tables
- Appendix E – Consumption & Replacement Rate Assumptions
- Appendix F – ASP Reference Tables
- Appendix G – Manufacturing & Facility Database
- Appendix H – Import-Export Data Tables
- Appendix I – Regulatory Summary Tables
- Appendix J – Primary Research Participant List (Anonymized)
- Appendix K – Primary Research Questionnaire Framework
- Appendix L – Data Sources & Bibliography
- Appendix M – Market Size Divergence & Source Comparison
Chapter 17. Research Methodology
- 17.1 Research Framework & Philosophy
- 17.2 Secondary Research – Sources, Hierarchy & Data Extraction
- 17.3 Data Modeling – Bottom-Up & Top-Down Market Sizing
- 17.4 Primary Research – Stakeholder Framework, LOI & Sample Sizes
- 17.5 Forecast Methodology – Regression, Scenario & Sensitivity Analysis
- 17.6 Quality Control – Four-Layer Validation Framework
- 17.7 Limitations & Standard Assumptions
- 17.8 Disclaimer
