
Aluminum Smelting Market Overview:
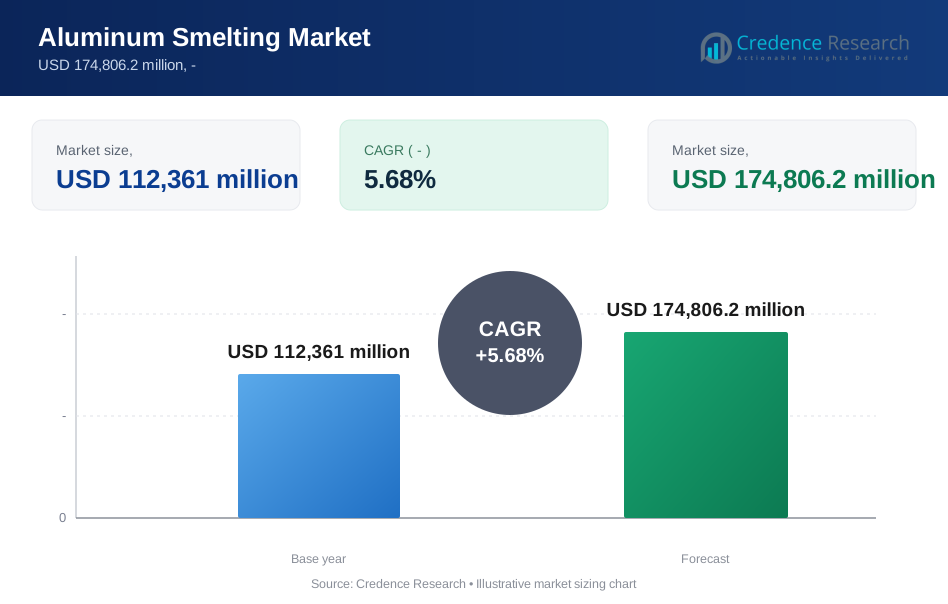
The Aluminum Smelting market was valued at USD 112,361 million in 2024 and is projected to reach USD 174,806.2 million by 2032, expanding at a CAGR of 5.68% during the forecast period.
| REPORT ATTRIBUTE | DETAILS |
|---|---|
| Historical Period | 2020-2023 |
| Base Year | 2024 |
| Forecast Period | 2025-2032 |
| Aluminum Smelting Market Size 2024 | USD 112,361 million |
| Aluminum Smelting Market, CAGR | 5.68% |
| Aluminum Smelting Market Size 2032 | USD 174,806.2 million |
Aluminum Smelting Market Insights
- Strong demand from transportation and construction drives primary aluminum growth, holding over 55% share, supported by lightweight material use in vehicles, buildings, and equipment.
- Producers invest in low-carbon technology and digital smelting upgrades, increasing efficiency and reducing emissions in line with global sustainability targets.
- Asia Pacific leads with over 55% share, followed by Europe at more than 20%, supported by strong manufacturing output and expanding end-use sectors.
- Energy price volatility and high operating costs remain key restraints, especially in regions without stable power supply, increasing risk across production cycles and limiting new smelting installations.
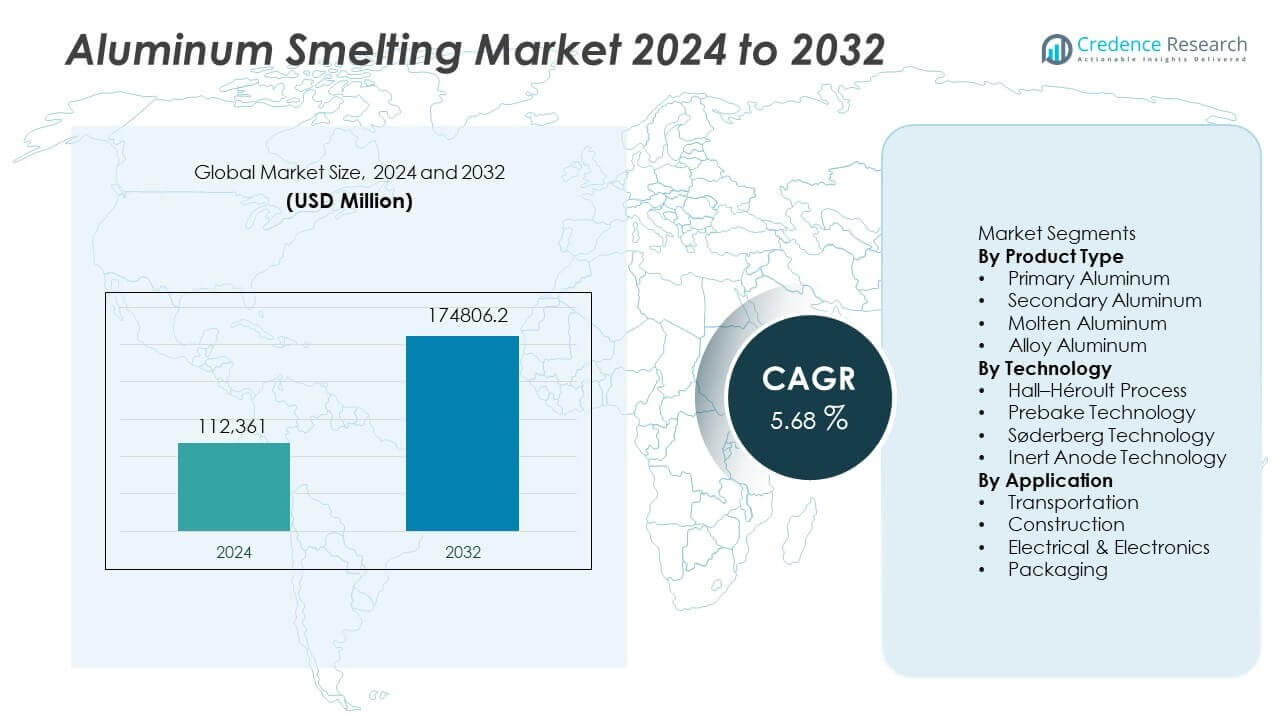
Aluminum Smelting Market Segmentation Analysis:
By Product Type:
Primary aluminum held the largest share of the aluminum smelting market at over 55% in 2024. Growth in lightweight materials for transportation, industrial machinery, and structural components supports its lead. Secondary aluminum also gained traction due to recycling demand and lower energy needs. Molten aluminum and alloy grades expanded in line with higher production flexibility and custom performance needs across end-use industries. Strong investment in smelting efficiency and environmental compliance further increased output in primary production. Rising focus on sustainability and circular material use supported future gains across secondary production.
- For instance, Rio Tinto increased production at its ISAL smelter, driven by process upgrades that improved casting output.
By Technology:
The Hall–Héroult process dominated the technology landscape with more than 70% share in 2024, driven by proven efficiency, established smelter infrastructure, and wide industry acceptance. Prebake technology continued to expand due to lower emissions and enhanced energy control. Søderberg technology maintained limited use, mainly in older facilities. Inert anode technology gained visibility as producers explored low-carbon output models. Increasing focus on energy optimization, operational reliability, and emission reduction strengthened advances in next-generation smelting methods. Producers continued to modernize facilities to reduce input costs, improve furnace life, and achieve long-term sustainability targets.
- For instance, Alcoa produced 2.1 million tonnes of primary aluminum in 2023 using Hall–Héroult lines across its global smelters.
By Application:
Transportation remained the largest application segment with over 40% market share in 2024, supported by ongoing demand for lightweight automotive and aerospace components. Construction followed due to extensive use in windows, frames, roof panels, and structural systems. Electrical and electronics applications advanced due to rising demand for conductors, wiring, and thermal components. Packaging applications expanded based on recyclable metal use in cans and industrial containers. More end users adopted aluminum to reduce weight, cut emissions, and improve fuel economy. Strong industrial manufacturing growth and higher urban development supported wider market acceptance across application areas.
Key Growth Drivers
Rising Demand from Transportation and Construction
Strong growth in vehicle production and infrastructure projects drives wider use of aluminum smelting output. Automakers adopt lightweight aluminum to improve fuel efficiency and reduce emissions, increasing material demand across body structures, wheels, and engine parts. Construction activity expands aluminum use in framing, cladding, roofing, and architectural components. Global investments in road, rail, and commercial buildings support continuous smelting output. Higher infrastructure spending in Asia Pacific reinforces demand momentum. These factors encourage producers to enhance capacity, improve metal purity, and strengthen supply reliability to meet growing needs across mobility and construction markets.
- For instance, Hyundai Motor Group has expanded its use of aluminum in vehicle bodies and components to support weight reduction, which directly enhances fuel efficiency and extends the driving range of its electrified fleet.
Shift Toward Low-Carbon and Recyclable Materials
Demand for sustainable and low-emission materials fuels market expansion as industries replace heavier metals with eco-aligned aluminum products. Producers invest in recycling capacity, renewable energy integration, and improved electrolytic efficiency to reduce carbon footprints. Recycled aluminum offers major energy savings compared to primary production, supporting circular manufacturing adoption. Governments strengthen emissions regulations and encourage responsible sourcing practices, boosting environmentally aligned product demand. These developments increase interest in smelting upgrades, technological modernization, and new energy storage integration. End users in packaging, automotive, and consumer goods accelerate material shifts to support clean manufacturing targets.
- For instance, Norsk Hydro increased its intake of post-consumer scrap and successfully reduced direct carbon emissions at several of its primary production facilities.
Rising Electronics and Power Sector Applications
Growth in electrical and electronics output supports stronger demand for smelted aluminum across wiring systems, storage components, and conductive applications. Expanded power transmission infrastructure increases use of aluminum conductors, busbars, and heat management materials. Rapid adoption of smart devices and renewable energy installations sustains traction for high-performance metal solutions. Aluminum offers conductivity advantages at lower weight and cost, making it suitable for large-scale utility systems. Market expansion in semiconductors, battery housings, and electrical enclosures reinforces long-term demand. These trends motivate producers to develop alloy enhancements and improve casting consistency for advanced electrical applications.
Key Trends & Opportunities
Technological Modernization and Energy Efficiency Gains
Producers advance smelting performance through digital monitoring, automated cell control, and improved thermal management systems. Modernization projects reduce power consumption, increase cell life, and enhance output predictability. Newer inert anode and advanced prebake technologies present strong future potential for low-carbon production. Digital twins, robotics, and predictive analytics support cost reduction and stability improvements. These developments create investment opportunities for smelter upgrades and new capacity additions. Continuous innovation in refineries and electrolytic cells strengthens operational returns and supports global expansion for aluminum producers.
- For instance, Chalco reduced electricity consumption to 12.8 megawatt-hours per tonne at key sites in 2023 after automated cell upgrades and thermal insulation improvements.
Expansion of Recycling Capacity and Secondary Production
Growing demand for recycled aluminum offers strong opportunities for secondary smelting expansion. Secondary metal production requires significantly less energy than primary output, lowering cost and emissions. Increasing scrap availability from transportation, packaging, and industrial sources supports recycling scale. Producers invest in sorting, melting, and purification systems to improve yield and quality. Policies promoting circular manufacturing and landfill reduction drive recycling growth. This shift enhances supply security while reducing exposure to raw material price volatility. Rising scrap processing efficiency supports longer-term market competitiveness across multiple end-use industries.
- For instance, Novelis processed 2,341 thousand tonnes of recycled aluminum in 2023 and improved melting yield through advanced scrap purification systems.
Key Challenges
High Energy Consumption and Cost Exposure
Aluminum smelting remains energy intensive, and rising power prices continue to pressure operating margins. Many smelters rely on electricity contracts tied to volatile fuel markets, creating financial uncertainty. Limited access to low-cost renewable power further impacts competitiveness. Producers attempt to reduce energy load through technology upgrades, but capital demands are substantial. In some regions, high power tariffs force production curtailments, reducing supply stability. Managing energy risk remains a priority, especially for standalone smelters without integrated power supply.
Environmental Impact and Regulatory Compliance Pressure
Stricter emission and waste treatment rules increase compliance costs, especially for older smelting assets. Carbon emissions, spent pot lining disposal, and fluoride control require advanced mitigation systems. Regulatory pressure accelerates modernization, but upgrading aging infrastructure demands major investment. Failure to meet standards may risk fines, shutdowns, or permitting delays. Producers must also address stakeholder expectations related to sustainability, transparency, and supply chain ethics. Increasing environmental reporting and certification requirements add operational complexity as companies shift toward cleaner production pathways.
Regional Analysis
North America
North America held a market share of over 15% in 2024, supported by strong demand from automotive, aerospace, and electrical industries. The United States remained the key contributor, driven by investment in lightweight materials and advanced smelting technologies. Smelter upgrades improved operational efficiency and reduced energy intensity, helping offset production costs. Growth in electric vehicles and renewable energy supported aluminum conductor and component use. Increasing recycling capacity strengthened secondary aluminum output and reduced reliance on imports. The region continued to emphasize sustainability and energy transition initiatives to enhance long-term competitiveness in the aluminum smelting sector.
Europe
Europe accounted for more than 20% market share in 2024, driven by demand from automotive, construction, and packaging applications. Countries such as Germany, France, and Norway benefited from strong industrial bases and renewable power access. Producers advanced low-carbon metal initiatives and invested in green smelting technology to align with regulatory targets. Rising EV adoption supported material use in lightweight vehicle structures and electrical components. The region’s strong recycling network helped improve metal availability. However, high power prices and carbon compliance requirements continued to challenge sector profitability, increasing the need for technology upgrades and energy-efficient processes.
Asia Pacific
Asia Pacific led the global market with over 55% share in 2024, driven by large-scale industrial output and strong infrastructure growth. China dominated regional production, supported by extensive smelting capacity, integrated supply chains, and growing alloy development. India and Southeast Asia contributed through construction, automotive production, and public infrastructure expansion. Rising investment in renewable energy supported long-term energy security for smelters. Increasing demand from electronics, machinery, and transportation strengthened aluminum use across multiple sectors. Government-backed manufacturing programs and export strength enhanced the region’s competitive position, supporting continued capacity additions and technology upgrades in the smelting industry.
Latin America, Middle East & Africa
Latin America, the Middle East, and Africa represented close to 10% market share in 2024, driven by expanding industrial bases and rising infrastructure investment. The Middle East continued to strengthen its position through low-cost energy access and integrated smelting facilities, particularly in the UAE and Bahrain. Africa demonstrated expansion potential due to mineral resource availability and emerging industrial demand. Latin America advanced through increased aluminum use in construction and transportation. Supportive trade policies and modernization programs encouraged future capacity development. However, regional market growth remained sensitive to energy pricing, logistics costs, and import–export dynamics.
Aluminum Smelting Market Segmentations:
By Product Type
- Primary Aluminum
- Secondary Aluminum
- Molten Aluminum
- Alloy Aluminum
By Technology
- Hall–Héroult Process
- Prebake Technology
- Søderberg Technology
- Inert Anode Technology
By Application
- Transportation
- Construction
- Electrical & Electronics
- Packaging
By Geography
- North America
- U.S.
- Canada
- Mexico
- Europe
- Germany
- France
- U.K.
- Italy
- Spain
- Rest of Europe
- Asia Pacific
- China
- Japan
- India
- South Korea
- South-east Asia
- Rest of Asia Pacific
- Latin America
- Brazil
- Argentina
- Rest of Latin America
- Middle East & Africa
- GCC Countries
- South Africa
- Rest of the Middle East and Africa
Competitive Landscape
The competitive landscape of the aluminum smelting market includes major players such as Rio Tinto, Alcoa Corporation, Rusal, China Hongqiao Group, Norsk Hydro ASA, Vedanta Limited, Emirates Global Aluminium, South32, Century Aluminum Company, and Aluminium Bahrain. Companies compete on technology advancement, production efficiency, energy management, and sustainability performance. Producers invest in low-carbon aluminum, recycling systems, and renewable energy integration to enhance environmental alignment and reduce operational costs. Strategic partnerships strengthen supply chain security and support expansion in transportation, construction, and electrical sectors. Leading companies continue to modernize smelter operations through digital control systems, inert anode development, and advanced prebake technology. Capacity expansion in Asia Pacific improves global output and reinforces competitive positioning. Market participants also focus on product quality, alloy innovation, and customer-specific solutions to meet evolving industrial needs. Rising regulatory expectations and energy price volatility influence investment decisions and drive long-term modernization strategies across global smelting facilities.
Key Player Analysis
- Rio Tinto
- Alcoa Corporation
- Rusal
- China Hongqiao Group
- Norsk Hydro ASA
- Vedanta Limited
- Emirates Global Aluminium
- South32
- Century Aluminum Company
- Aluminium Bahrain (Alba)
Recent Developments
- In November 2025, Rio Tinto & Alcoa (via Elysis) announced a breakthrough in scaling carbon-free smelting technology at an industrial site in Quebec.
- In April 2025, Rio Tinto signed an MOU with India’s AMG Metals & Materials to explore a renewable-powered low-carbon aluminium smelter project.
- In 2025, China Hongqiao Group continued to lead global smelting output with expansion into low-emission regions and renewable power use.
Report Coverage
The research report offers an in-depth analysis based on Product Type, Technology, Application and Geography. It details leading market players, providing an overview of their business, product offerings, investments, revenue streams, and key applications. Additionally, the report includes insights into the competitive environment, SWOT analysis, current market trends, as well as the primary drivers and constraints. Furthermore, it discusses various factors that have driven market expansion in recent years. The report also explores market dynamics, regulatory scenarios, and technological advancements that are shaping the industry. It assesses the impact of external factors and global economic changes on market growth. Lastly, it provides strategic recommendations for new entrants and established companies to navigate the complexities of the market.
Future Outlook
- Global smelting capacity will continue to expand to meet rising industrial demand.
- Primary aluminum production will strengthen due to transportation and construction needs.
- Secondary aluminum output will grow as recycling technology improves.
- Energy efficiency upgrades will reshape smelter operations and reduce emissions.
- Inert anode development will gain traction as low-carbon output becomes a priority.
- Asia Pacific will retain market leadership due to strong manufacturing activity.
- Electric vehicle adoption will increase aluminum use in automotive structures and parts.
- Smelters will integrate more renewable power sources to reduce operating costs.
- Digital monitoring and automation will improve production control and equipment life.
- Investment in new alloys and high-performance grades will increase end-use applications.
Request a Free Sample
Fill in your details and we'll send you a free sample report.
- Sample data tables & charts
- Research methodology
Need a Custom Version of This Report?
Tailor the scope, geography, or segments to your exact requirements.
- Custom geography or segment scope
- Direct access to our analyst team
Table of Content
Chapter 1. Report Introduction
- 1.1 Report Description & Purpose
- 1.1.1 Report Title & Market Definition
- 1.1.2 Unique Selling Propositions (USP) & Key Differentiators
- 1.1.3 Value Proposition for Stakeholders
- 1.2 Research Objectives
- 1.2.1 Market Sizing Objectives (Volume & Revenue)
- 1.2.2 Segmentation Objectives
- 1.2.3 Competitive Intelligence Objectives
- 1.2.4 Forecast & Scenario Objectives
- 1.3 Report Scope
- 1.3.1 Aluminum Smelting Scope – Types & Subtypes Covered
- 1.3.2 Geographic Scope – Regions & Countries Covered
- 1.3.3 Historical Period, Base Year & Forecast Period (the historical period; forecast to the forecast period)
- 1.3.4 Inclusions & Exclusions
- 1.4 HS Code & Classification Framework
- 1.5 Currency, Units & Pricing Basis
- 1.6 Target Stakeholders
- 1.7 Limitations & Assumptions
Chapter 2. Executive Summary
- 2.1 Global Aluminum Smelting Market Snapshot
- 2.1.1 Market Size – Historical (the historical period) & Forecast (the forecast period) (base year: USD 112,361 million → forecast year: USD 174,806.2 million)
- 2.1.2 Volume & Revenue – Global Totals
- 2.1.3 Key Market Highlights – Top Five Facts
- 2.2 Aluminum Smelting Market Segmentation Snapshot
- 2.2.1 Market Split by Region – vs.
- 2.3 Competitive Snapshot
- 2.3.1 Top 10 Players by Revenue Share –
- 2.3.2 Top 10 Players by Volume Share –
- 2.3.3 Recent Strategic Developments (18-Month Summary)
- 2.4 Key Investment Highlights & Strategic Conclusions
Chapter 3. Aluminum Smelting Market Dynamics & Industry Analysis
- 3.1 Market Overview & Context
- 3.1.1 Aluminum Smelting Market Position in the Broader Automotive Value Chain
- 3.1.2 OEM vs. Replacement Market Dynamics
- 3.1.3 Market Maturity & Development Stage by Region
- 3.2 Aluminum Smelting Market Drivers
- 3.3 Aluminum Smelting Market Restraints & Challenges
- 3.4 Aluminum Smelting Market Opportunities
- 3.5 Porter's Five Forces Analysis
- 3.5.1 Threat of New Entrants
- 3.5.2 Bargaining Power of Suppliers
- 3.5.3 Bargaining Power of Buyers
- 3.5.4 Threat of Substitutes
- 3.5.5 Competitive Rivalry – Intensity Assessment
- 3.6 Aluminum Smelting Value Chain Analysis
- 3.6.1 Upstream – Raw Material/Input Suppliers
- 3.6.1.1 Raw Material/Input 1
- 3.6.1.2 Raw Material/Input 2
- 3.6.1.3 Raw Material/Input 3
- 3.6.2 Midstream – Production/Manufacturing/Service Delivery
- 3.6.2.1 Production/Process Overview
- 3.6.2.2 Key Facility Locations & Capacity by Manufacturer
- 3.6.3 Downstream – Distribution & End Consumer
- 3.6.3.1 Primary Channel – B2B/OEM
- 3.6.3.2 Secondary Channels – Dealer, Retail, Online, Direct
- 3.6.4 Value Chain Profitability Analysis
- 3.6.1 Upstream – Raw Material/Input Suppliers
- 3.7 PESTEL Analysis
- 3.7.1 Political Factors
- 3.7.2 Economic Factors
- 3.7.3 Social Factors
- 3.7.4 Technological Factors
- 3.7.5 Environmental Factors
- 3.7.6 Legal Factors
- 3.8 Aluminum Smelting Supply Chain Analysis
- 3.8.1 Raw Material/Input Supply Risk Assessment
- 3.8.2 Manufacturing Concentration Risk (Geographic Exposure)
- 3.8.3 Trade Disruption Impact Analysis
- 3.9 Regulatory & Policy Landscape
Note: The regulatory and policy landscape section covers regulations based on their applicability to the market, Aluminum Smelting category, geography, and scope of the study. Only regulatory frameworks with a material impact on operations, compliance, trade, sustainability, or market access are analyzed in detail.
Chapter 4. Key Investment Pockets & Opportunity Analysis
- 4.1 Aluminum Smelting Market Attractiveness Analysis
- 4.1.1 By Region – Investment Attractiveness Matrix (Volume × CAGR)
- 4.2 Absolute Revenue Growth Opportunity
- 4.2.1 By Region – Absolute USD Growth Through the forecast period
- 4.3 Incremental Volume Opportunity
- 4.3.1 By Region – Incremental Volume Through the forecast period
- 4.3.2 Segment – Incremental Volume
- 4.4 Emerging Submarket Opportunity Deep Dive (Subject to Applicability)
- 4.5 Emerging Market Opportunity Scorecards
- 4.5.1 United States
- 4.5.2 Europe
- 4.5.3 Asia
- 4.5.4 Middle East & Africa
Note: Emerging Market Opportunity Scorecards will be included based on relevance and strategic importance. Regions listed are indicative and may vary depending on data availability and market dynamics.
Chapter 5. Aluminum Smelting Import-Export Analysis & Trade Flows
- 5.1 Global Trade Overview
- 5.1.1 Global Export Value by Country (the historical period)
- 5.1.2 Global Export Volume by Country (the historical period)
- 5.1.3 Global Import Value by Country (the historical period)
- 5.1.4 Global Import Volume by Country (the historical period)
- 5.1.5 Net Trade Balance by Country (the historical period)
- 5.2 Export Analysis – Segment
- 5.2.1 Type 1 (HS Code)
- 5.2.2 Type 2 (HS Code)
- 5.2.3 Type 3 (HS Code)
- 5.2.4 Type 4 (HS Code)
- 5.2.5 Type 5 (HS Code)
- 5.3 Import Analysis – Segment
- 5.3.1 Type 1 (HS Code)
- 5.3.2 Type 2 (HS Code)
- 5.3.3 Type 3 (HS Code)
- 5.3.4 Type 4 (HS Code)
- 5.3.5 Type 5 (HS Code)
- 5.4 Average Unit Trade Prices
- 5.4.1 Average Export Price – Segment & Country
- 5.4.2 Average Import Price – Segment & Source Country
- 5.4.3 Price Trends (the historical period)
- 5.5 Key Trade Route Analysis
- 5.5.1 Trade Route 1
- 5.5.2 Trade Route 2
- 5.5.3 Trade Route 3
- 5.5.4 Trade Route 4
- 5.5.5 Trade Route 5
- 5.6 Trade Policy Impact Assessment
- 5.6.1 US Anti-Dumping & Section 301 Tariffs
- 5.6.2 EU Customs Union Impact
- 5.6.3 Major Free Trade Agreements
- 5.6.4 USMCA Rules of Origin
Note: Trade policy analysis will be included only where relevant to the Aluminum Smelting market.
Chapter 6. Competitive Landscape & Company Benchmarking
- 6.1 Aluminum Smelting Market Concentration & Structure
- 6.1.1 Herfindahl-Hirschman Index (HHI) – vs.
- 6.1.2 Tier 1, Tier 2 & Tier 3 Market Structure
- 6.1.3 Global, Regional & Local Player Dynamics
- 6.2 Aluminum Smelting Market Share Analysis –
- 6.2.1 Global Revenue Share by Company
- 6.2.2 Global Volume Share by Company
- 6.2.3 Regional Revenue Share
- 6.2.4 Market Share Evolution ( vs. )
- 6.2.5 OEM Segment Share by Company
- 6.2.6 Replacement Segment Share by Company
- 6.3 Production/Delivery Capacity & Facility Analysis
- 6.3.1 Global Installed Capacity
- 6.3.2 Capacity Utilization Rates
- 6.3.3 Production/Output Volume
- 6.3.4 Facility Locations & Capacity Map
- 6.3.5 Planned Capacity Additions
- 6.4 Aluminum Smelting Competitive Benchmarking Matrix
- 6.4.1 Revenue, Volume, CAGR & Profitability Comparison
- 6.4.2 Channel Revenue Mix
- 6.4.3 Geographic Revenue Exposure
- 6.4.4 R&D Intensity
- 6.4.5 Sustainability Maturity
- 6.5 Strategic Developments in Aluminum Smelting (Last 24 Months)
- 6.5.1 Mergers, Acquisitions & Divestments
- 6.5.2 New Aluminum Smelting Launches
- 6.5.3 Facility Expansions
- 6.5.4 Strategic Alliances, Joint Ventures & Partnerships
- 6.5.5 Distribution Expansion & Market Entry
- 6.5.6 Sustainability & ESG Initiatives
- 6.6 Competitive Strategy Mapping
- 6.6.1 Leader, Challenger, Follower & Niche Classification
- 6.6.2 Pricing Strategy Comparison
- 6.6.3 Channel Strategy Matrix
Note: Strategic developments are included based on their materiality and the availability of reliable information.
Chapter 7. Global Aluminum Smelting Market – By Distribution Channel
- 7.1 Segment Overview
- 7.1.1 Volume & Revenue Split by Channel ( & )
- 7.1.2 Channel Mix Evolution (the forecast period)
Chapter 8. Regional Market Analysis – Global Overview
- 8.1 Global Regional Overview
- 8.1.1 Regional Volume Share
- 8.1.2 Regional Revenue Share
- 8.1.3 Regional Volume by Region
- 8.1.4 Regional Revenue by Region
- 8.1.5 Regional Forecast Through the forecast period
- 8.2 Cross-Regional Segment Analysis
- 8.2.1 By Distribution Channel
- 8.2.2 By Brand/Price Tier
Chapter 9. North America Aluminum Smelting Market
- 9.1 United States
- 9.2 Canada
- 9.3 Mexico
Chapter 10. Europe Aluminum Smelting Market
- 10.1 Germany
- 10.2 France
- 10.3 Italy
- 10.4 United Kingdom
- 10.5 Spain
- 10.6 Poland
- 10.7 Russia
- 10.8 Netherlands
- 10.9 Belgium
- 10.10 Sweden
- 10.11 Denmark
- 10.12 Norway
- 10.13 Rest of Europe
Chapter 11. Asia Pacific Aluminum Smelting Market
- 11.1 China
- 11.2 India
- 11.3 Japan
- 11.4 South Korea
- 11.5 Thailand
- 11.6 Indonesia
- 11.7 Vietnam
- 11.8 Malaysia
- 11.9 Australia
- 11.10 Rest of Asia Pacific
Chapter 12. Latin America Aluminum Smelting Market
- 12.1 Brazil
- 12.2 Argentina
- 12.3 Colombia
- 12.4 Chile
- 12.5 Rest of Latin America
Chapter 13. Middle East Aluminum Smelting Market
- 13.1 Saudi Arabia
- 13.2 United Arab Emirates
- 13.3 Turkey
- 13.4 Israel
- 13.5 Iran
- 13.6 Rest of the Middle East
Chapter 14. Africa Aluminum Smelting Market
- 14.1 South Africa
- 14.2 Egypt
- 14.3 Nigeria
- 14.4 Morocco
- 14.5 Rest of Africa
Chapter 15. Aluminum Smelting Company Profiles
- 15.1 [Company 01]
- 15.1.1 Company Overview
- 15.1.2 Key Management Personnel
- 15.1.3 Products & Services Portfolio
- 15.1.4 Financial Performance
- 15.1.5 Key Market Focus & Geographic Presence
- 15.1.6 Recent Developments & Strategic Initiatives
Note: The company profile list is preliminary and may change based on research findings, market developments, data availability, and client requirements.
Chapter 16. Appendices
- Appendix A – List of Abbreviations & Acronyms
- Appendix B – Industry Classification Code Reference – Full Series
- Appendix C – Production & Capacity Data Tables
- Appendix D – End-Use & Demand Base Tables
- Appendix E – Consumption & Replacement Rate Assumptions
- Appendix F – ASP Reference Tables
- Appendix G – Manufacturing & Facility Database
- Appendix H – Import-Export Data Tables
- Appendix I – Regulatory Summary Tables
- Appendix J – Primary Research Participant List (Anonymized)
- Appendix K – Primary Research Questionnaire Framework
- Appendix L – Data Sources & Bibliography
- Appendix M – Market Size Divergence & Source Comparison
Chapter 17. Research Methodology
- 17.1 Research Framework & Philosophy
- 17.2 Secondary Research – Sources, Hierarchy & Data Extraction
- 17.3 Data Modeling – Bottom-Up & Top-Down Market Sizing
- 17.4 Primary Research – Stakeholder Framework, LOI & Sample Sizes
- 17.5 Forecast Methodology – Regression, Scenario & Sensitivity Analysis
- 17.6 Quality Control – Four-Layer Validation Framework
- 17.7 Limitations & Standard Assumptions
- 17.8 Disclaimer
