
Defense builds and mine equipment renewal lift alloy demand
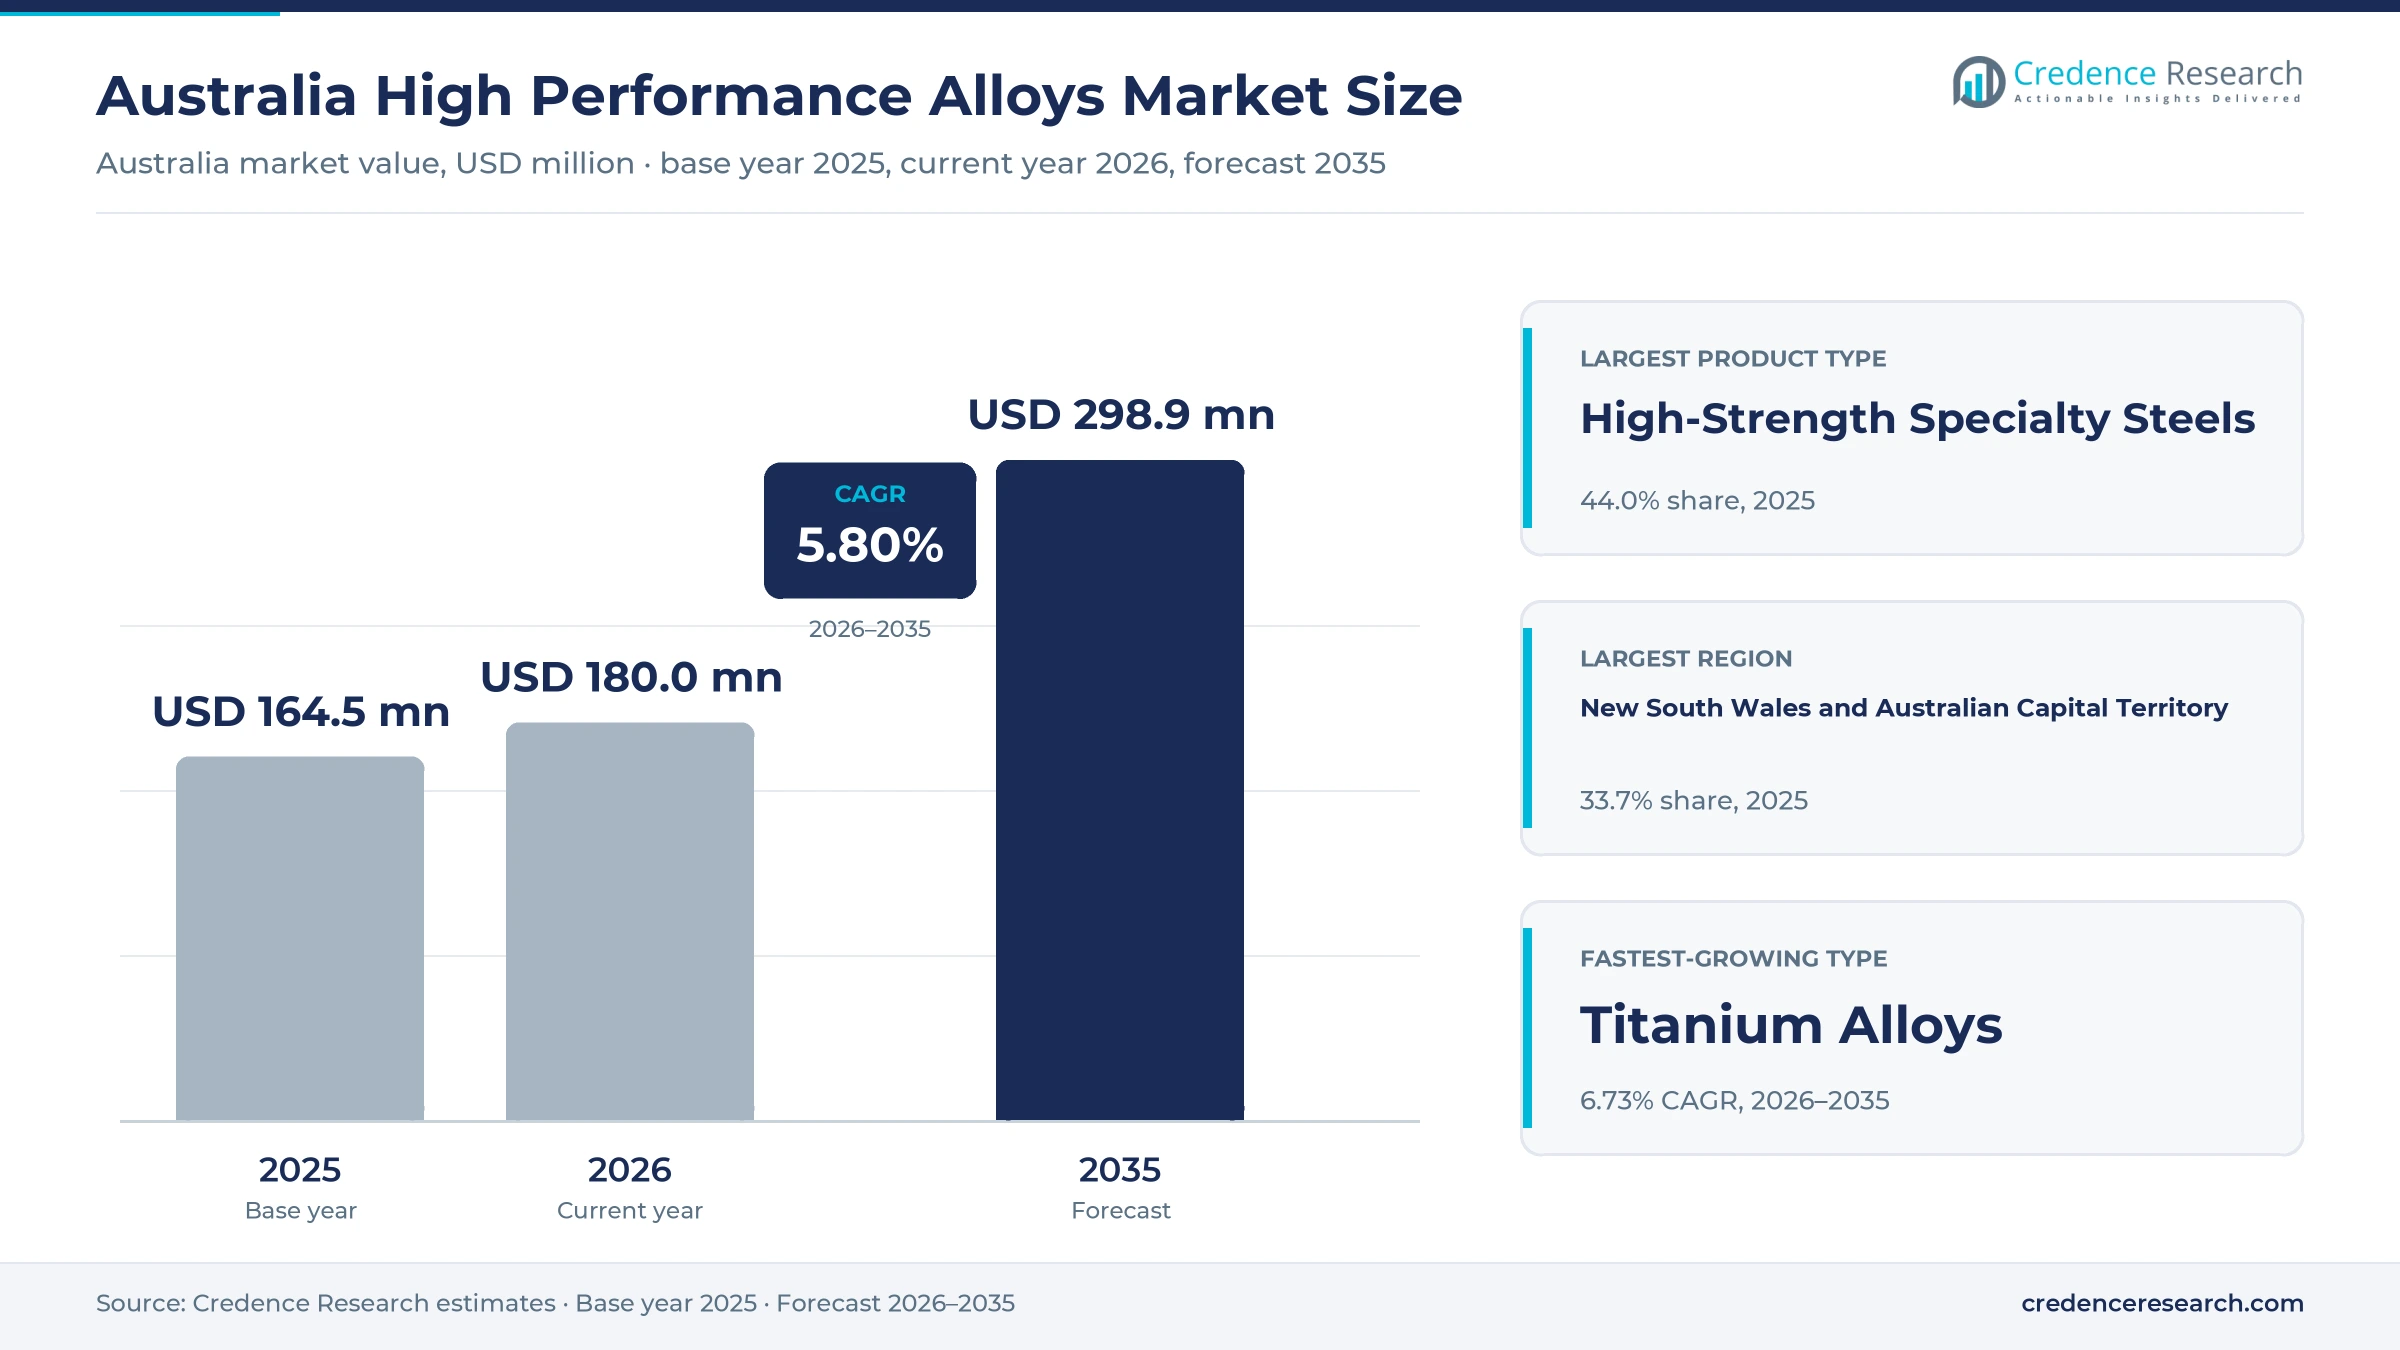
The Australia high performance alloys market was valued at USD 164.5 million in 2025 and is projected to increase from USD 180.0 million in 2026 to USD 298.9 million by 2035, registering a CAGR of 5.80% during 2026–2035. Demand comes from mine operators, defense contractors, aircraft and vehicle makers, energy and chemical plants, medical device makers and fabricators that need steels and alloys able to resist wear, corrosion and heat. New South Wales and the Australian Capital Territory held the largest regional share, 33.7% in 2025, because armor steel mills, specialty stockists and defense buyers cluster around Sydney and the Illawarra. Western Australia is the fastest-growing region at 6.36% a year, as mining equipment renewal and naval sustainment lift orders. In turn, defense vehicle programs and critical mineral policy are pushing buyers toward locally qualified supply.
What steels, superalloys and titanium grades fall in scope?
The estimate measures spending in Australia on high-strength specialty steels, nickel-based alloys, titanium alloys and cobalt, refractory and specialty non-ferrous alloys in plate, bar, sheet, tube, castings and powder. It covers wear, corrosion, heat and precision uses in aerospace and defense, mining and resources, energy and chemical processing, medical, transport and specialist manufacturing. Values are stated in USD million at current prices and exclude goods and services tax.
The estimate excludes commodity carbon steel, standard stainless grades, aluminum alloys, finished machines and fabrication labor billed separately. The value chain runs from local plate mills and overseas alloy mills through stockists and processors that cut, heat treat and certify material to fabricators, original equipment makers and asset owners.
Australia High Performance Alloys Market Insights
- The Australia high performance alloys market was valued at USD 164.5 million in 2025 and is projected to reach USD 298.9 million by 2035, at a 5.80% CAGR during 2026–2035.
- New South Wales and the Australian Capital Territory held 33.7% of 2025 value, as armor steel mills and specialty stockists cluster there.
- Mining and resources led end uses with 34.0% of 2025 value, because wear plate and alloy parts keep haul trucks and crushers running.
- Hanwha Aerospace completed its armored vehicle factory in Geelong on Aug. 27, 2024, where 129 Redback vehicles will be built after prototype delivery.
- Titanium alloys grow fastest at 6.73% a year during 2026–2035, as aircraft, drone and medical programs need light, strong and corrosion-resistant metal.
Specialty steels lead while titanium alloys grow fastest
Why do specialty steels lead alloy demand?
Based on product type, the market is categorized into high-strength specialty steels, nickel-based alloys, titanium alloys and cobalt, refractory and specialty non-ferrous alloys. High-Strength Specialty Steels led with 44.0% of 2025 value, because quenched and tempered plate is made locally and used widely in mining and armor. Titanium Alloys grow fastest at 6.73% a year, as aircraft and drone work expands.
Which industries buy the most alloys?
Based on end-use industry, the market is categorized into aerospace and defense, mining and resources, energy and chemical processing, medical and transport and specialist manufacturing. Mining and Resources led with 34.0% of 2025 value, because wear parts on trucks, crushers and chutes need frequent renewal. Aerospace and defense grows fastest at 6.82% a year, as vehicle and drone plants ramp up.
Which uses account for most alloy spending?
Based on application, the market is categorized into wear and load-bearing components, corrosion-resistant equipment, high-temperature components and precision and biocompatible components. Wear and Load-Bearing Components led with 40.0% of 2025 value, because mines replace liners, buckets and plates on short cycles. Precision and Biocompatible Components grow fastest at 6.59% a year, as implant and aerospace machining demand rises.
Stockists, mills or processing contracts?
Based on sales channel, the market is categorized into stockist sales, direct mill contracts, project supply agreements and integrated processing contracts. Stockist Sales led with 42.0% of 2025 value, because fabricators buy small lots of many grades from local warehouses. Integrated Processing Contracts grow fastest at 6.51% a year, as buyers want cut, heat-treated and certified parts from one supplier.
| Segment Group | Leading Sub-segment | Share, 2025 | Fastest-growing Sub-segment | CAGR, 2026–2035 |
|---|---|---|---|---|
| By Product Type | High-Strength Specialty Steels | 44.0% | Titanium Alloys | 6.73% |
| By End-Use Industry | Mining and Resources | 34.0% | Aerospace and Defence | 6.82% |
| By Application | Wear and Load-Bearing Components | 40.0% | Precision and Biocompatible Components | 6.59% |
| By Sales Channel | Stockist Sales | 42.0% | Integrated Processing Contracts | 6.51% |
Request a Free Sample
Fill in your details and we'll send you a free sample report.
- Sample data tables & charts
- Research methodology
Defense qualification, mine renewal and corrosion needs
How does defense material qualification lift demand?
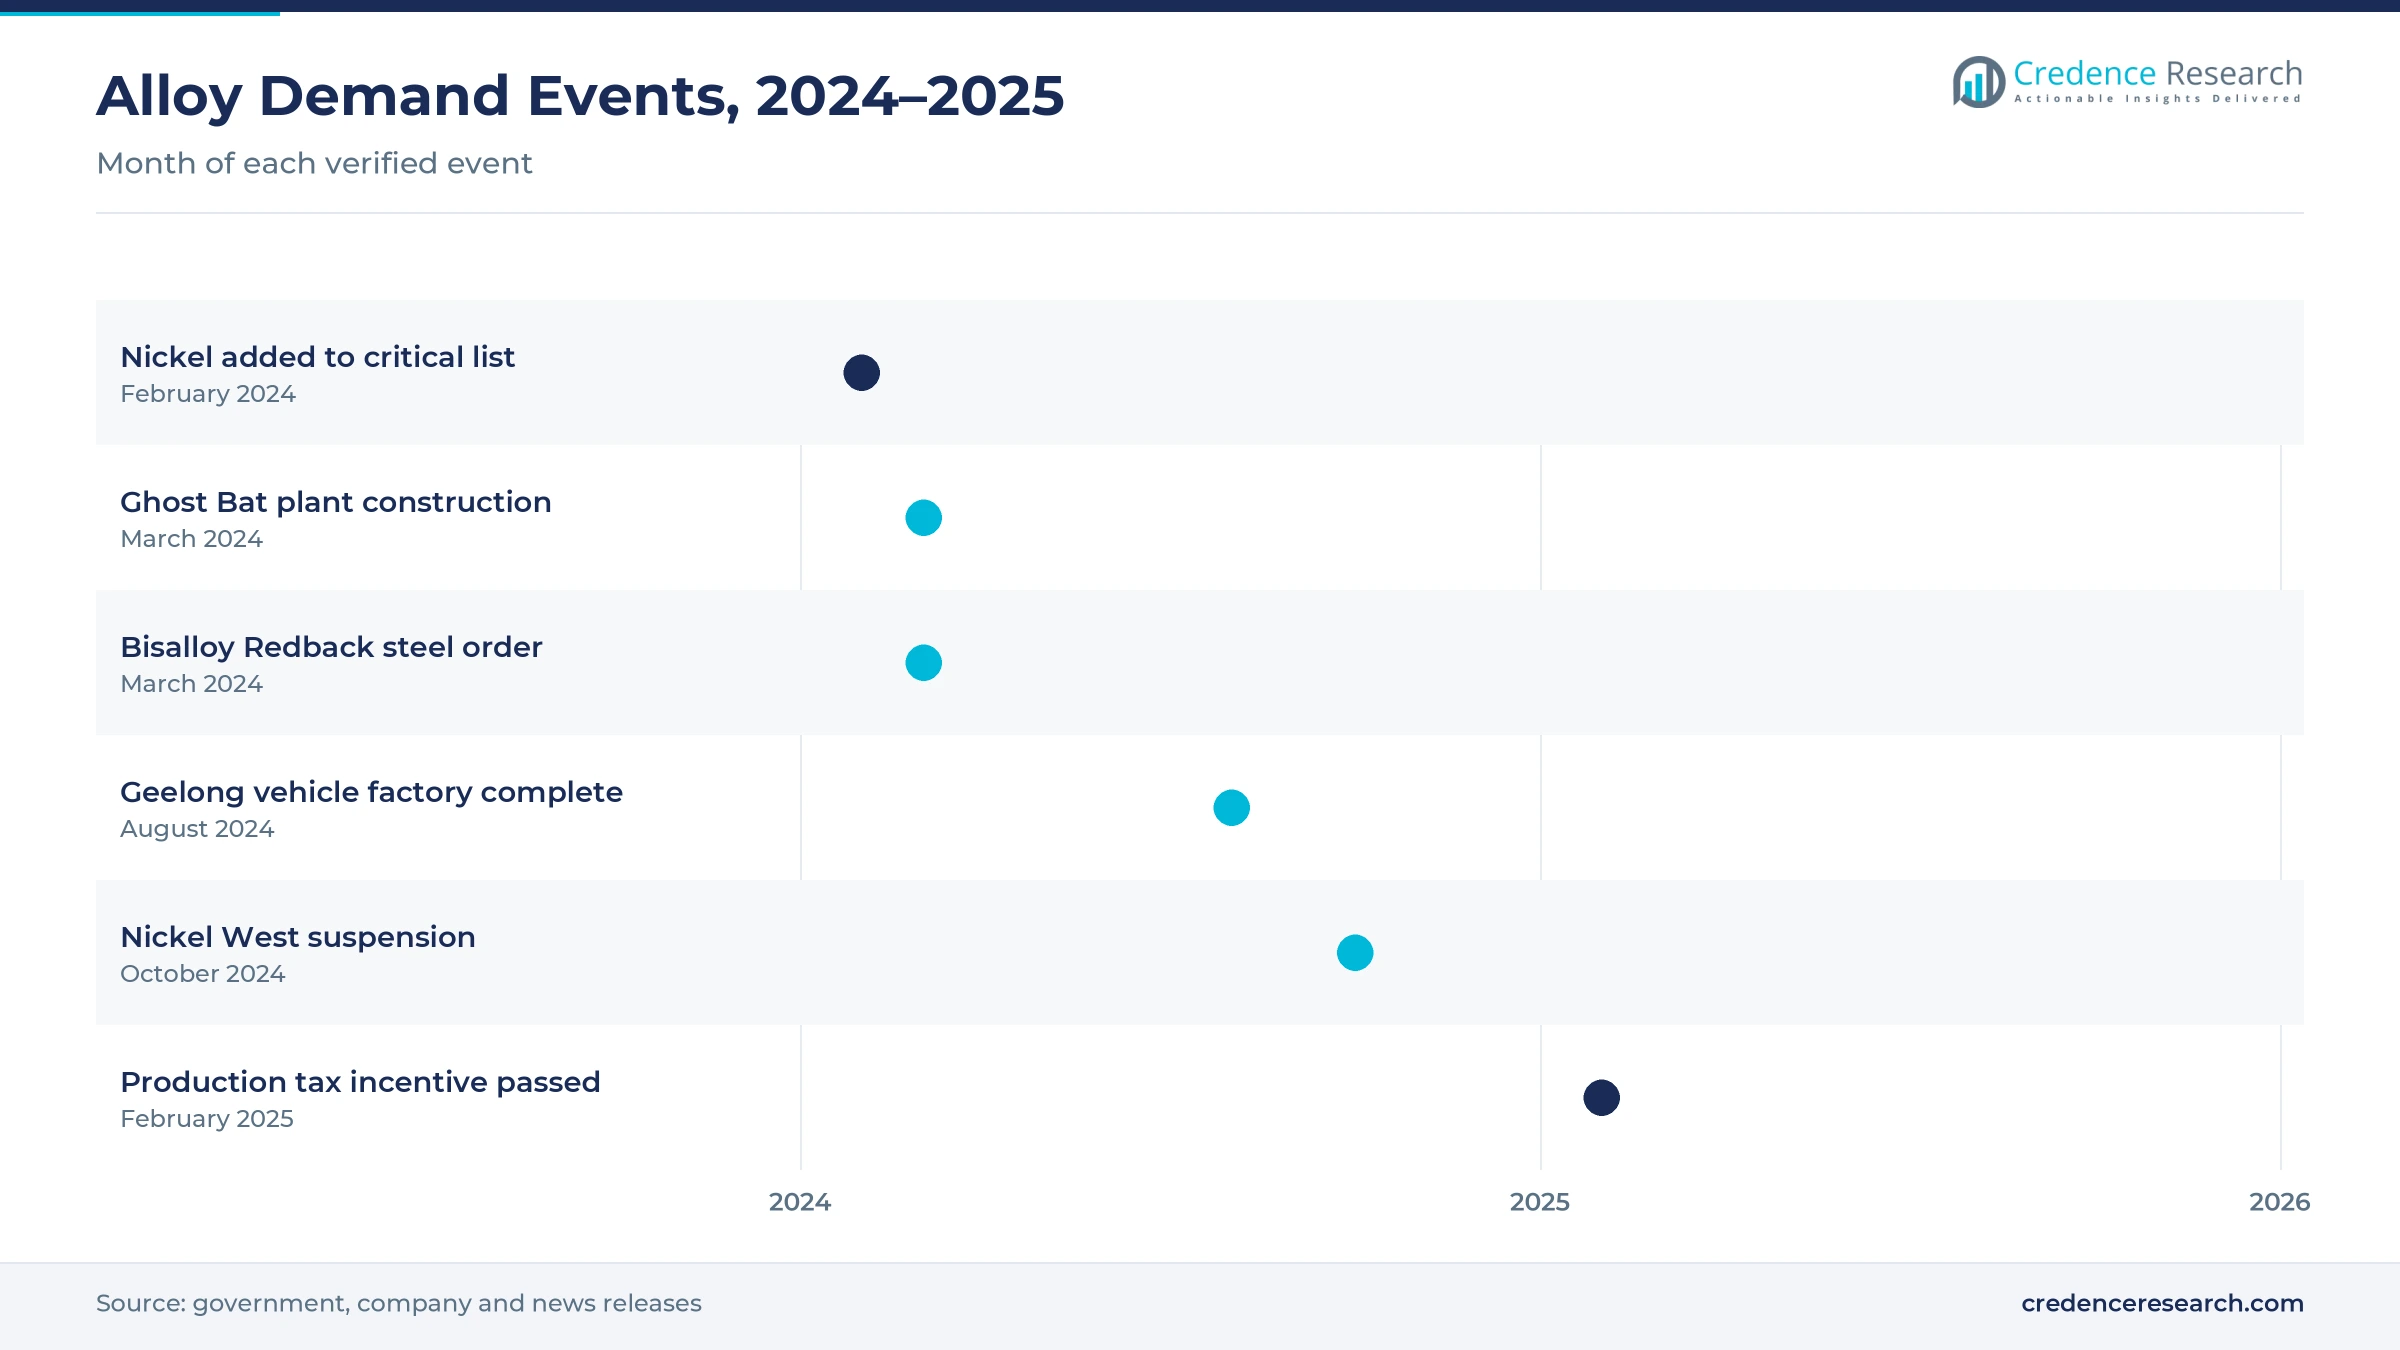
Defense material qualification lifts demand, because armored vehicles, ships and aircraft need steels and alloys tested and approved for each program. On March 29, 2024, Bisalloy Steel agreed to supply steel for Redback prototype vehicles, refined at its Unanderra site from Port Kembla steel, according to a regional news report. Hanwha Aerospace completed its 150,000 square meter Geelong factory on Aug. 27, 2024, with 11 facilities for 129 Redback vehicles and 30 AS9 howitzers, according to the company. As a result, aerospace and defense grows fastest among end uses at 6.82% a year, as approved armor plate and heat-treated steel plates move into serial production.
Why does resource equipment renewal sustain orders?
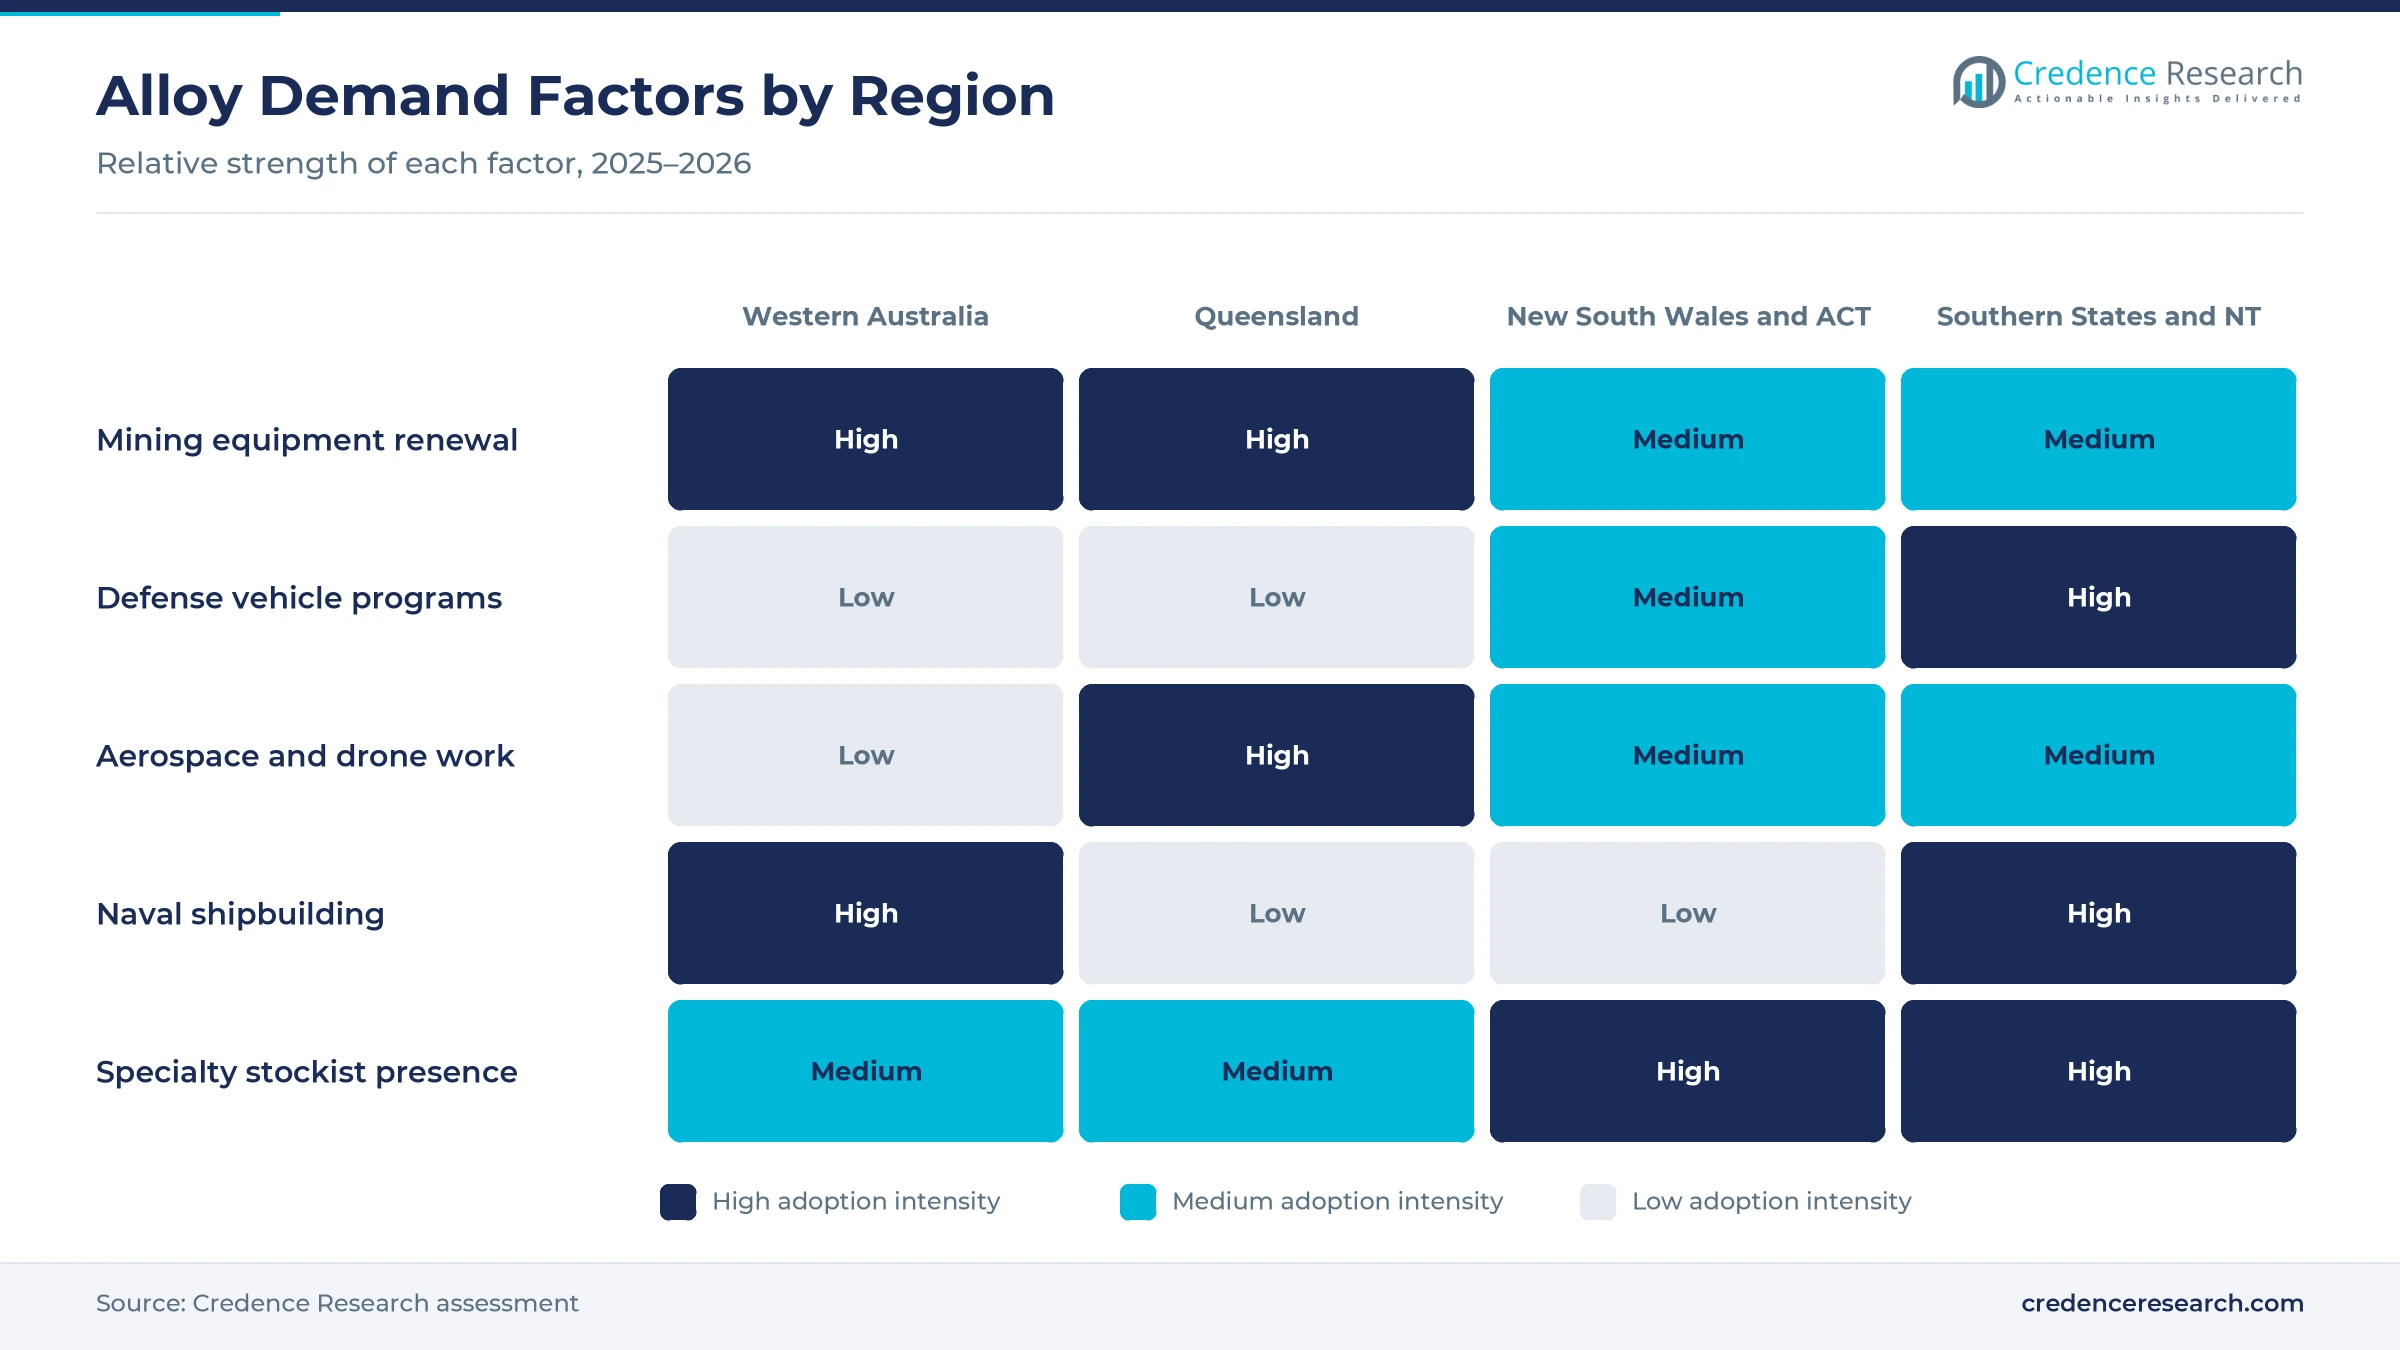
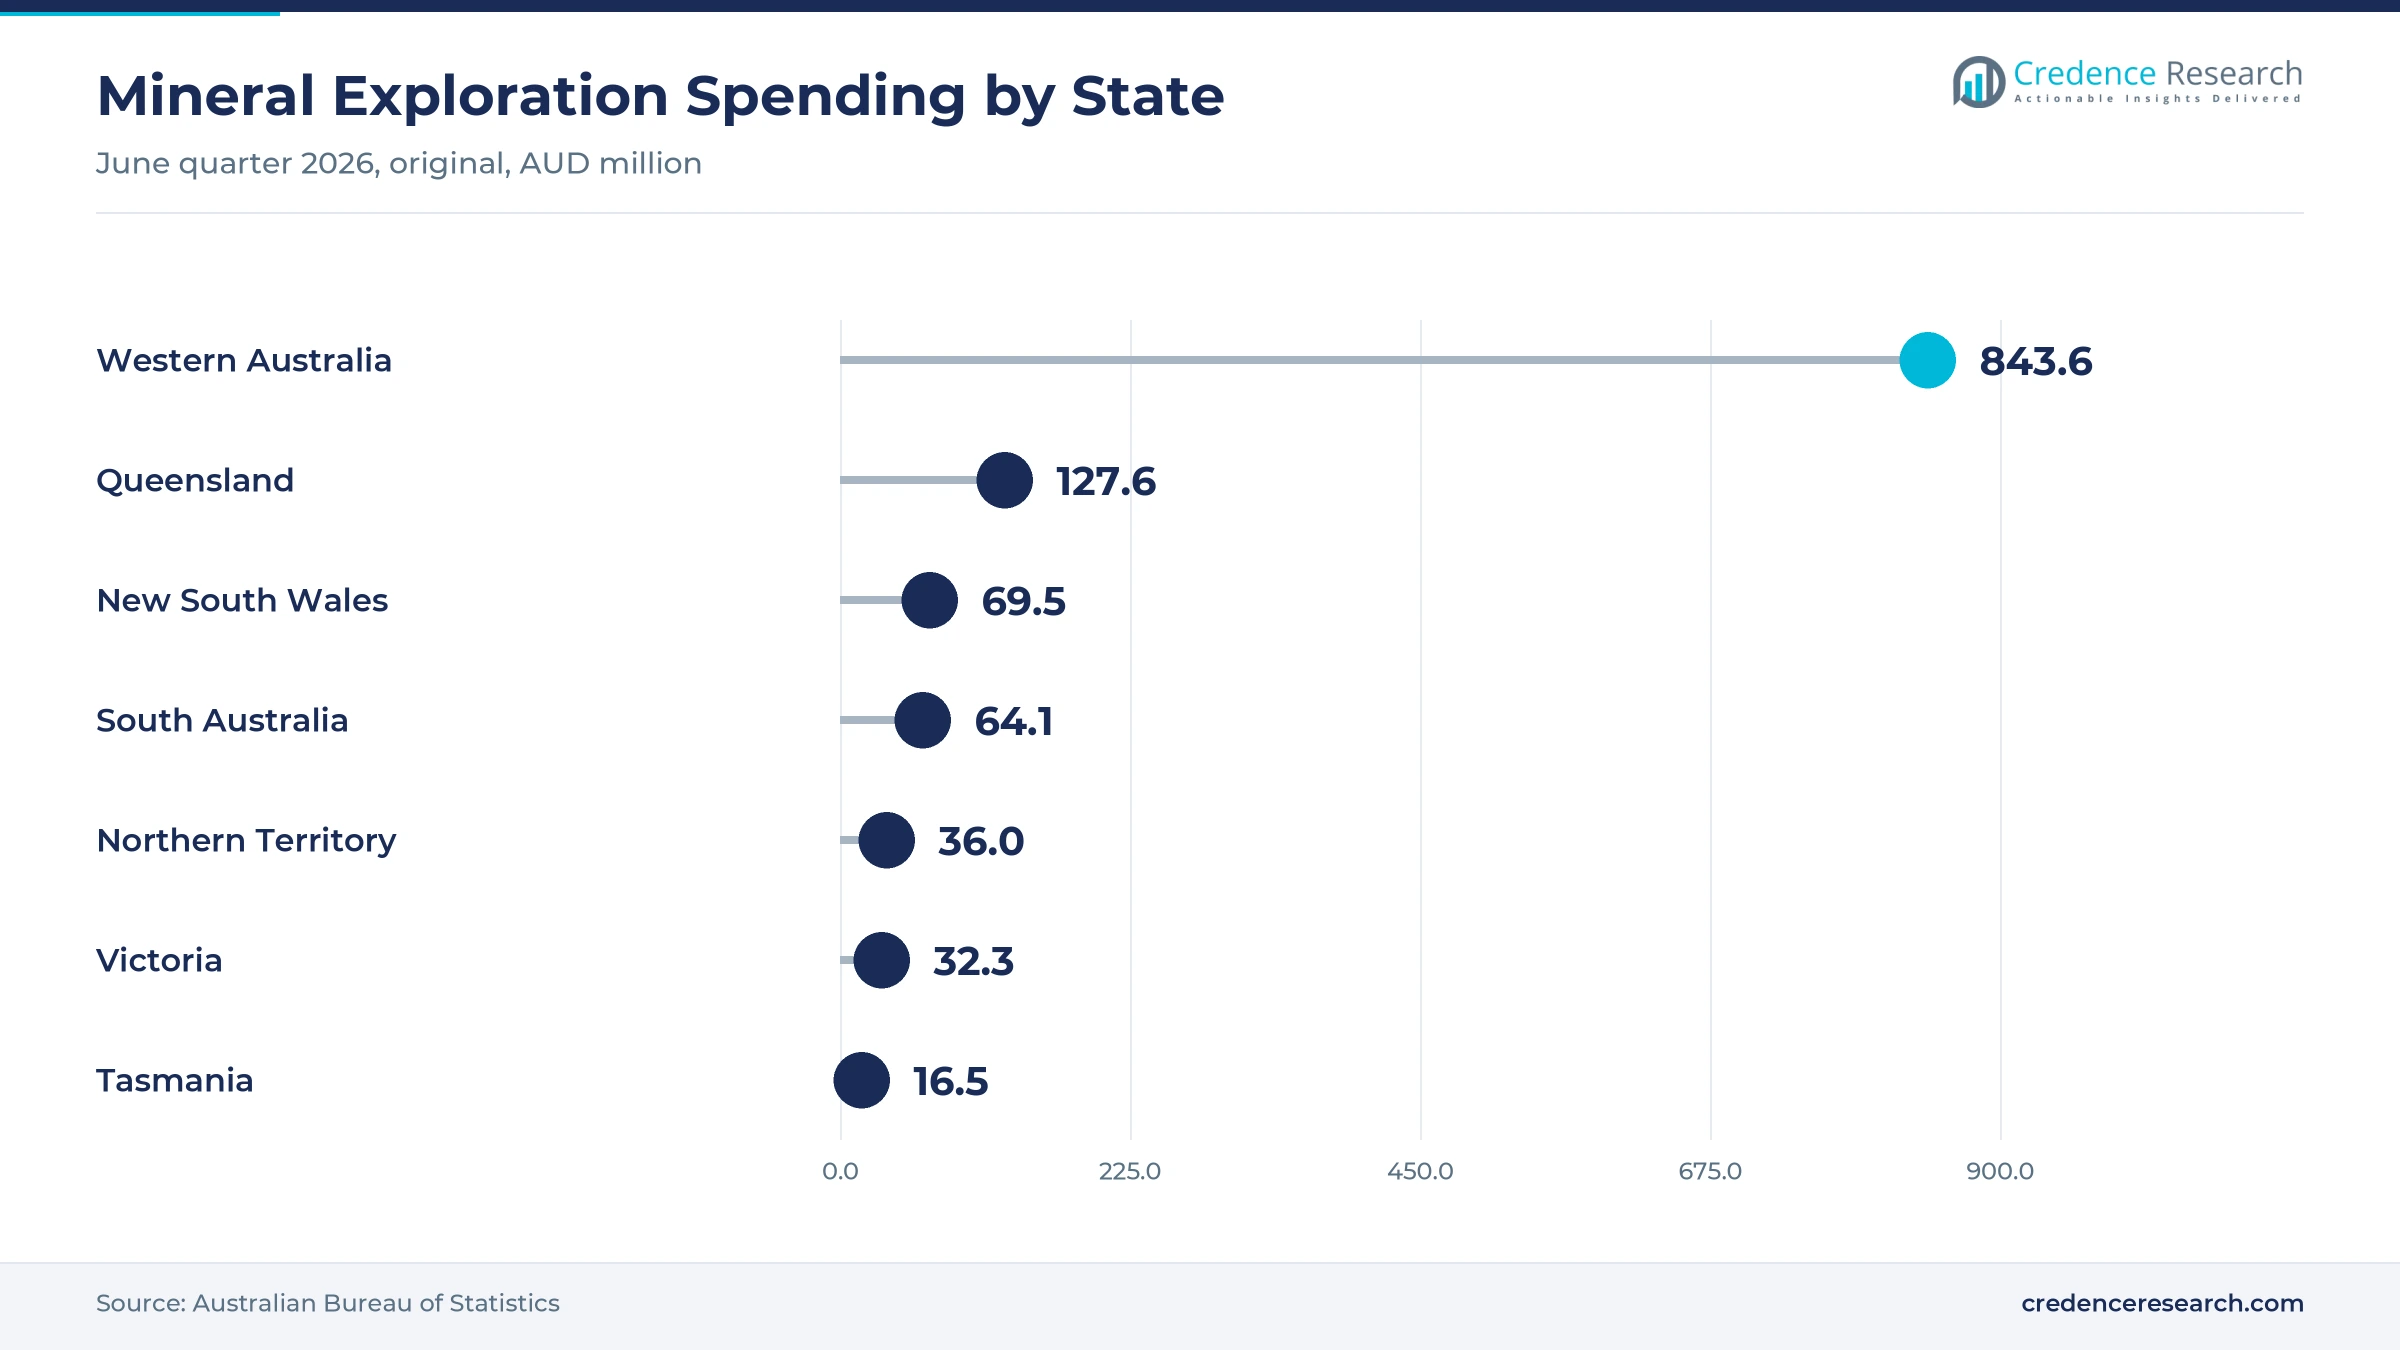
Resource equipment renewal sustains orders, because haul trucks, crushers, chutes and drill rigs wear through liners and load-bearing parts on short cycles. Private mining capital expenditure reached AUD 13.2 billion in the June quarter 2026, seasonally adjusted, up 1.6% on the prior quarter. Mineral exploration spending also rose 3.9% to AUD 1,142.9 million in that quarter and was 17.9% higher than a year earlier, according to the Australian Bureau of Statistics. Consequently, mining and resources lead end uses with 34.0% of 2025 value, as fleets of underground mining equipment and surface machines need wear plate and alloy parts.
How do corrosion and heat requirements support upgrades?
Corrosion and heat requirements support alloy upgrades, because offshore platforms, chemical plants and ships fail early when standard steels meet seawater, acids or high temperatures. Austral Wright Metals has supplied nickel and high performance alloys for more than 75 years and stocks Inconel 625 bar from 16 to 203 millimeters. Its range also covers Monel 400, alloy C276 and copper nickel pipe for shipbuilding, petroleum and offshore work. Prochem supplies copper nickel and duplex piping for naval programs from stocking branches across Australia. In turn, corrosion-resistant equipment remains a core application, while nickel-based alloys gain from heat exchanger and process plant maintenance.
Why does critical mineral policy favor local alloy supply?
Critical mineral policy favors local alloy supply, because the government wants more processing of nickel, cobalt, titanium and tungsten onshore. Nickel was added to the Critical Minerals List in February 2024, joining titanium, cobalt, tungsten, vanadium and niobium, according to the International Energy Agency. Parliament passed the Critical Minerals Production Tax Incentive on Feb. 11, 2025, worth 10% of eligible processing costs from 2027 to 2040, according to the Department of Industry. The incentive covers 31 critical minerals and can be claimed for up to 10 years. As a result, alloy makers and stockists plan for more local feed, while titanium sponge projects attract interest.
Powders, processing services and naval work gain ground
How is the rise of alloy powders changing supply?
The rise of alloy powders is changing supply, because additive manufacturing lets defense, mining and medical buyers print complex parts close to where they are used. voestalpine High Performance Metals Australia offers cobalt-, iron- and nickel-based additive manufacturing powders from its Orchard Hills headquarters in New South Wales. The company also provides heat treatment, forgings, cutting and sawing as value-added services. thyssenkrupp Materials Australia stocks titanium Grade 5 and 6Al-4V with AS9120 certification and Airbus approvals. Consequently, powder and deposition processing gains share in repair and spare parts work, while titanium alloys grow fastest among products at 6.73% a year.
Why is the shift to integrated processing rising?
The shift to integrated processing is rising, because fabricators want material cut, machined and certified before it reaches the workshop. Stirlings Performance Steels runs five warehouses in Bibra Lake, Ingleburn, Archerfield, Derwent Park and Hallam with more than 160 staff. It laser cuts plate up to 150 millimeters thick and stocks nickel alloys and copper nickel alongside stainless steel. thyssenkrupp Materials Australia offers water jet, plate saw and band saw cutting with delivery across five states. As a result, integrated processing contracts grow fastest among sales channels at 6.51% a year, as buyers cut in-house handling, scrap and waiting time at busy fabrication shops.
Can aerospace and drone programs open new demand?
Aerospace and drone programs open a clear opening, because new aircraft plants need certified titanium, nickel and specialty steel for structures and tooling. Boeing announced construction of a 9,000 square meter MQ-28 Ghost Bat production facility at Wellcamp near Toowoomba in March 2024. The facility is Boeing's first final assembly site outside North America and was expected to be operational within three years. Boeing Australia also employs 4,800 people across the country, which gives the program a deep local workforce. Consequently, Queensland suppliers that hold aerospace approvals can win long contracts, while airframe makers combine alloy parts with aerospace composites.
Is there room to grow in naval sustainment?
Naval sustainment offers a growth opening, because warships need corrosion-resistant piping, valves and fittings that are replaced across long service lives. Prochem supplies piping, tube, fittings and flanges for the Hunter program and is an original equipment supplier on the LHD and DDG programs. The company holds ISO 9001 certification and works with BAE Systems, Austal, Navantia and Civmec. Austral Wright Metals also stocks Aqualoy 17 and 22 boat shaft grades and copper nickel pipe for shipbuilding. The 2024 Defence Industry Development Strategy also lists continuous naval shipbuilding and sustainment among seven sovereign priorities. As a result, copper nickel, duplex and nickel-based alloys gain from shipyards in South Australia and Western Australia.
Imports, certification costs and metal prices slow growth
How does import dependence slow supply?
Import dependence slows supply, because most nickel, titanium and cobalt alloys are melted overseas and shipped to Australian stockists. BHP suspended its Western Australia nickel operations in October 2024, removing a local feed source until at least a review in February 2027. As a result, lead times stretch when overseas mills are busy. Stockists respond by holding deeper inventory and sourcing sizes not in stock from approved overseas mills under long-term supply agreements.
Why do certification costs limit new entrants?
Certification costs limit new entrants, because aerospace, defense and medical buyers need traceable material with mill certificates, approvals and audited quality systems. Approvals such as AS9120 and customer audits take time and money to win. Consequently, small fabricators may struggle to bid for defense work. Larger stockists respond by sharing certified supply, testing and documentation with smaller partners in each program, which spreads the cost of compliance across more contracts.
How do metal price swings squeeze margins?
Metal price swings squeeze margins, because nickel, cobalt and molybdenum prices can move sharply within months. Fixed-price project contracts can then leave suppliers exposed when input costs rise. In turn, buyers may delay orders or switch to cheaper grades. Suppliers reduce this risk with surcharge clauses, shorter quote validity and hedged purchasing for large contracts, while buyers lock in volumes early for long programs such as armored vehicle builds.
Will skills shortages hold back processing?
Skills shortages can hold back processing, because welding, machining and heat treating these alloys need trained staff and strict procedures. Titanium and nickel alloys also tool and weld differently from carbon steel. As a result, some workshops turn away complex jobs or extend delivery dates. Suppliers respond with training, automated cutting and preprocessed parts that reduce work at the customer site and ease pressure on scarce trades.
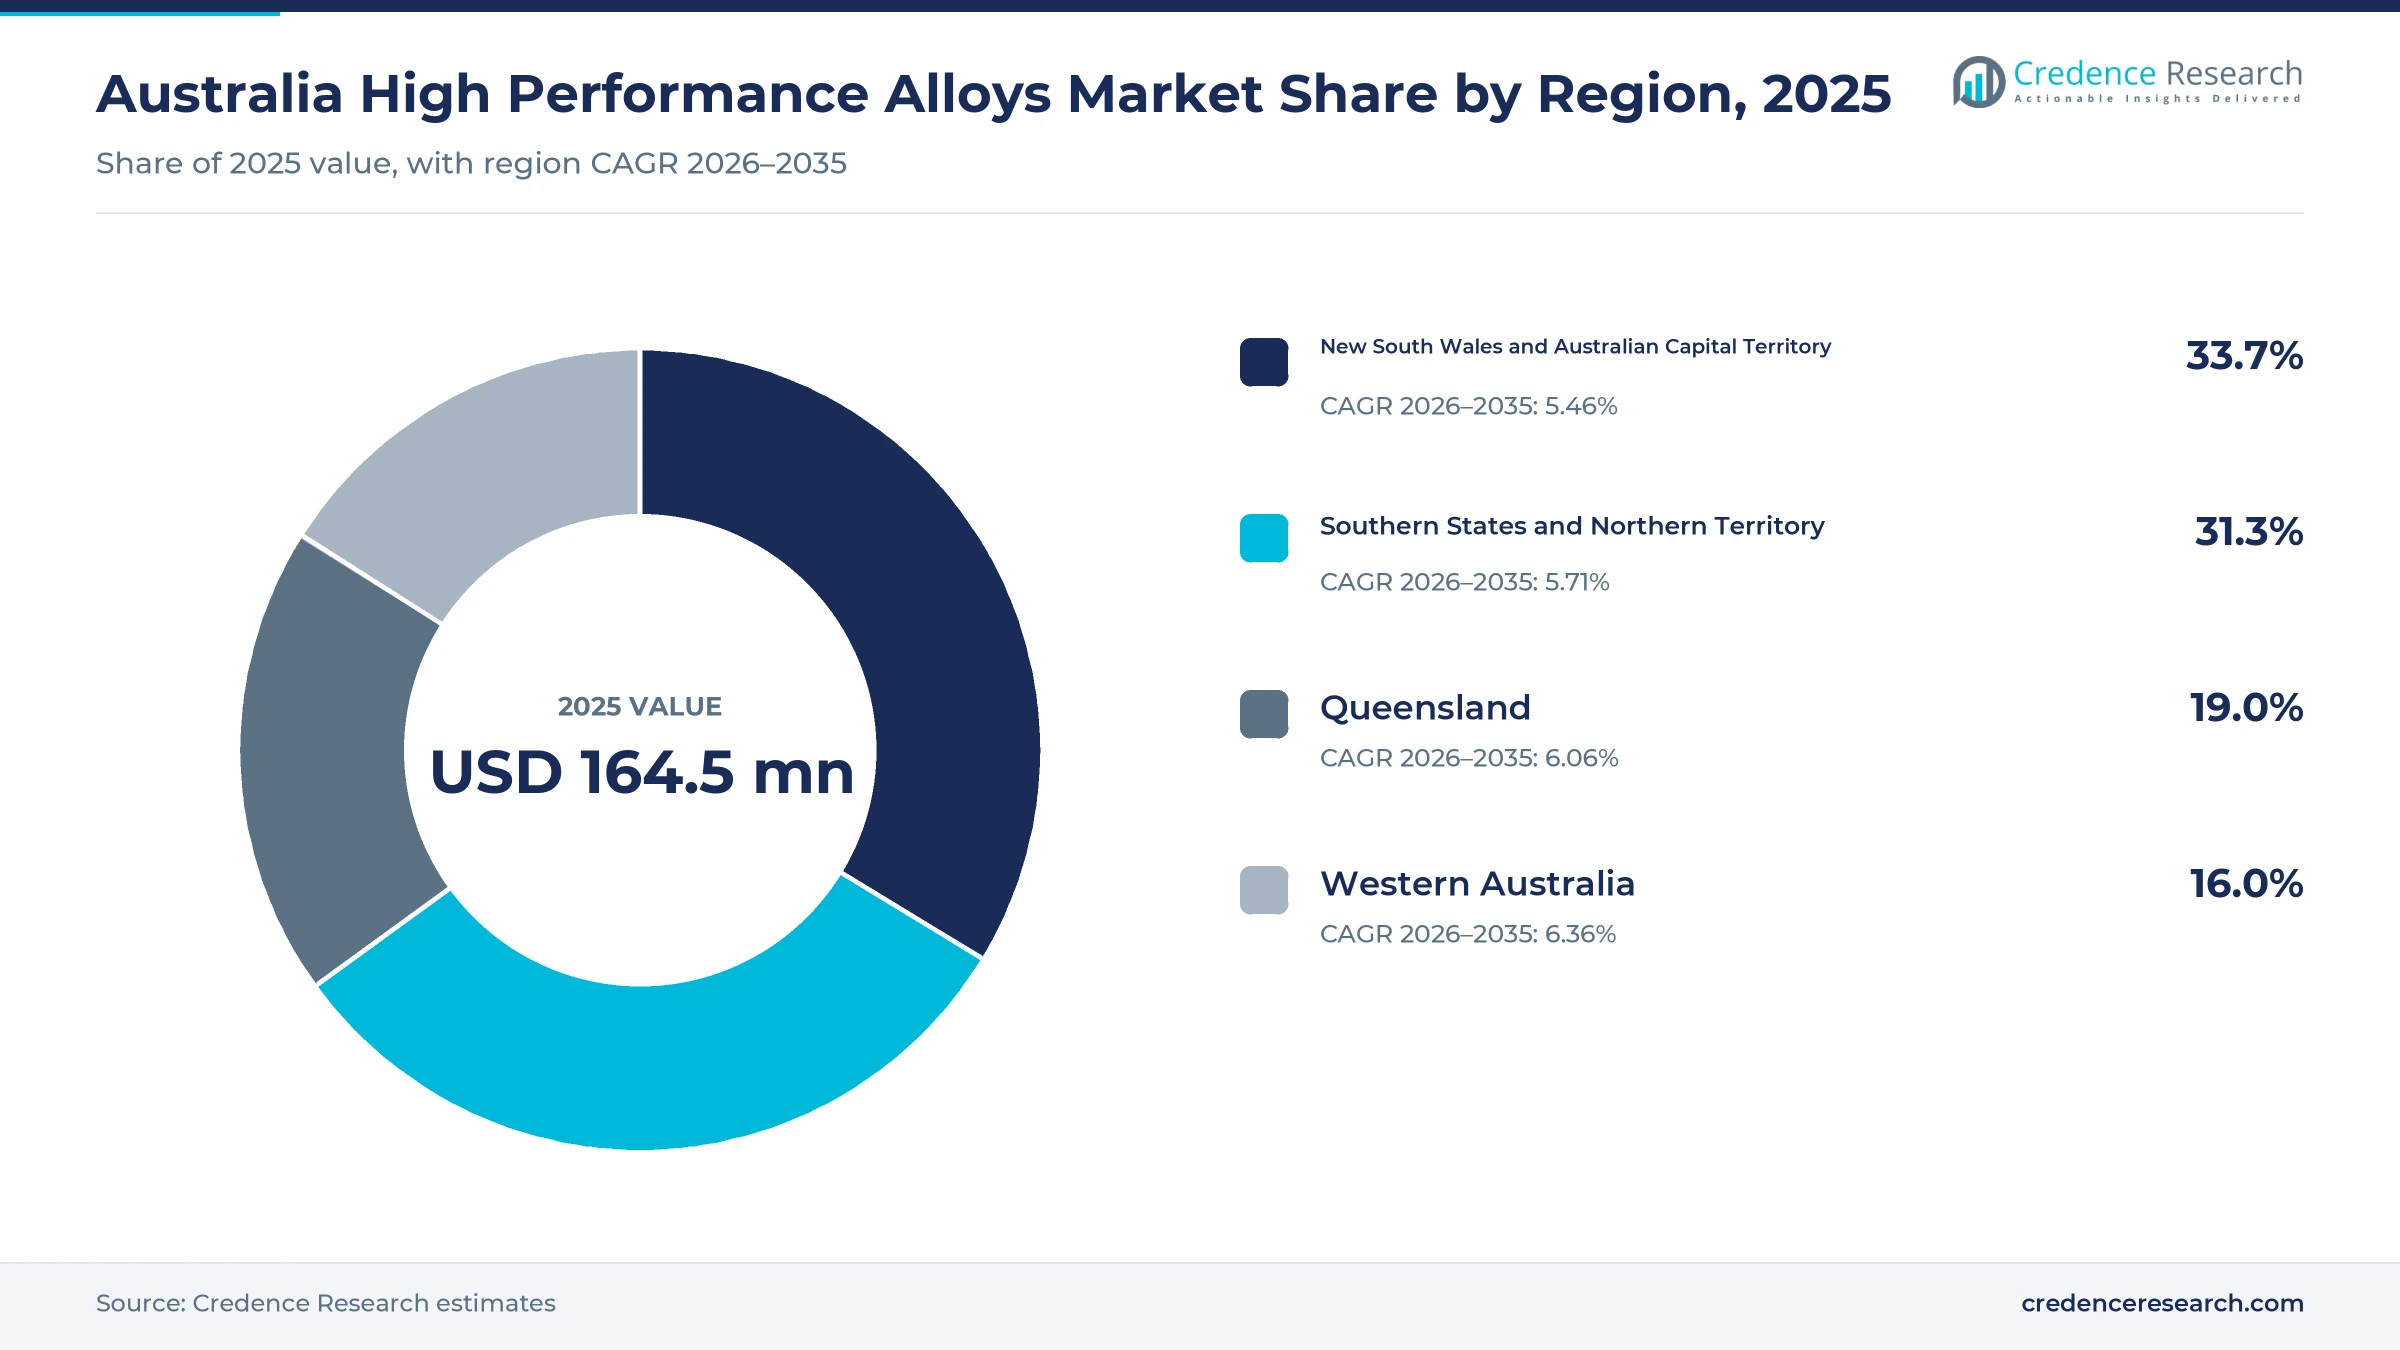
New South Wales leads as Western Australia grows fastest
| Region | Value, 2025 (USD million) | Share, 2025 | CAGR, 2026–2035 |
|---|---|---|---|
| New South Wales and Australian Capital Territory | 55.4 | 33.7% | 5.46% |
| Southern States and Northern Territory | 51.5 | 31.3% | 5.71% |
| Queensland | 31.3 | 19.0% | 6.06% |
| Western Australia | 26.3 | 16.0% | 6.36% |
Mills and stockists keep New South Wales and the ACT ahead
New South Wales and the Australian Capital Territory held 33.7% of 2025 value and grow at 5.46% a year. Bisalloy refines quenched and tempered plate at Unanderra, while voestalpine and thyssenkrupp run their Australian bases at Orchard Hills and Wetherill Park. The two jurisdictions had about 9.16 million residents at March 2026. As a result, the region keeps the largest share of armor, tool steel and aerospace alloy sales.
How do the southern states and NT add demand?
The southern states and Northern Territory held 31.3% of 2025 value and grow at 5.71% a year. Hanwha's Geelong factory will build 129 Redback vehicles, while Prochem in Cavan, South Australia, supplies naval piping for the Hunter program. Mineral exploration in South Australia, Victoria, Tasmania and the Northern Territory reached AUD 148.9 million in the June quarter 2026. Consequently, demand here comes from armored vehicles, shipbuilding and mining.
Why does Queensland add aerospace and mining demand?
Queensland held 19.0% of 2025 value and grows at 6.06% a year, because coal and metal mines need wear parts and Toowoomba hosts the MQ-28 Ghost Bat production facility. Mineral exploration in the state reached AUD 127.6 million in the June quarter 2026, the second highest of any state. The population also grew 1.6% to 5.74 million in the year to March 2026. In turn, the state adds orders for wear plate, titanium and nickel alloys.
Exploration and fleet renewal put Western Australia in front
Western Australia held 16.0% of 2025 value and grows fastest at 6.36% a year. The state accounted for AUD 843.6 million of AUD 1,189.8 million in mineral exploration spending in the June quarter 2026. Stirlings Performance Steels also runs a warehouse at Bibra Lake. As a result, mine equipment renewal and naval work lift demand fastest here.
Armor steel, vehicle plants and mineral policy, 2024–2025
| Development | Status and market relevance |
|---|---|
| In March 2024, Boeing announced construction of a 9,000 square meter MQ-28 Ghost Bat production facility at Wellcamp, Queensland. | Adds aerospace alloy demand |
| In March 2024, Bisalloy Steel announced it would supply steel for the Redback prototype vehicles from its Unanderra site. | Qualifies local armor plate |
| In August 2024, Hanwha Aerospace announced completion of its armored vehicle factory in Geelong for 129 Redback vehicles and 30 AS9 howitzers. | Creates serial demand for armor steel |
| In July 2024, BHP announced it would suspend its Western Australia nickel operations from October 2024, with a review by February 2027. | Removes a local nickel feed source |
| In February 2025, the government announced that Parliament had passed the Critical Minerals Production Tax Incentive, worth 10% of eligible processing costs from 2027. | Encourages onshore processing |
Powders, castings and wrought routes reshape alloy supply
- Wrought processing still supplies most plate, bar and sheet, with quenching and tempering giving armor and wear steels their hardness.
- Alloy casting produces complex pump, valve and wear parts in nickel and cobalt grades for mines and chemical plants.
- Powder and deposition processing lets suppliers print or clad parts in cobalt, iron and nickel powders, which cuts machining waste.
- Laser and water jet cutting gives stockists precise parts from thick plate, which shortens lead times for fabricators.
Need a Custom Version of This Report?
Tailor the scope, geography, or segments to your exact requirements.
- Custom geography or segment scope
- Direct access to our analyst team
Mills and stockists compete on grades, approvals and speed
Competition combines a local plate mill, global alloy groups and Australian stockists. Bisalloy Steel makes quenched and tempered plate at Unanderra and supplied steel for the Redback prototypes in 2024. voestalpine High Performance Metals Australia offers tool steels, nickel alloys and additive manufacturing powders, while thyssenkrupp Materials Australia serves aerospace and defense buyers with titanium and nickel alloys. Austral Wright Metals stocks nickel, titanium and copper nickel grades in four state capitals, and Stirlings Performance Steels runs five warehouses. Prochem supplies naval piping, Atlas Steels has supplied steel since 1939 and Austral Alloys works with Inconel castings in Bankstown. Applied Alloys International and Alloys International are also covered in the supplier field. Companies compete on grade range, approvals, stock depth, processing services and delivery speed.
Companies profiled and their roles in this market
| Company | Type | Role in the market |
|---|---|---|
| Bisalloy Steel Group | Local plate mill | Quenched and tempered plate; Redback prototype steel, 2024 |
| voestalpine High Performance Metals Australia | Global alloy group | Tool steels, nickel alloys and AM powders; Orchard Hills base |
| thyssenkrupp Materials Australia | Global distributor | Titanium and nickel alloys; AS9120; Wetherill Park |
| Austral Wright Metals | Stockist | Inconel, Monel, titanium and copper nickel; 75+ years |
| Stirlings Performance Steels | Stockist and processor | Five warehouses, nickel alloys, plate cutting to 150 mm |
| Prochem | Naval piping supplier | Copper nickel and duplex piping for Hunter, LHD and DDG programs |
| Atlas Steels | Distributor | Steel supplier since 1939 |
| Austral Alloys | Foundry | Inconel 600 and 625 castings; Bankstown |
Credence Research sees defense setting the pace
Credence Research's view is that Australian demand for high performance alloys will grow steadily through 2035, as defense vehicle, drone and naval programs move into production and mines renew wear parts. High-strength specialty steels should keep the largest product share, while titanium alloys gain most from aerospace and medical work. New South Wales and the Australian Capital Territory will remain the largest region, although Western Australia adds demand fastest. However, import dependence and price swings will reward suppliers with deep stock and approvals.
Equipment fleets and alloy intensity anchor the model
The report uses 2025 as the base year, with values in USD million at current prices. Market values come from the Credence Research model, which combines equipment fleets, defense program schedules, alloy intensity and price tiers. Regional shares follow the client data set, while regional growth and segment splits by product type, end-use industry, application and sales channel are Credence Research estimates. Sources used are official statistics, government releases, company pages and news reports, and no interviews or surveys were used.
Defense, mining and naval work shape alloy demand to 2035
The market is expected to reach USD 298.9 million by 2035, a 5.80% CAGR during 2026–2035, as defense production, mine equipment renewal and naval sustainment keep demand rising. Growth should be strongest in titanium alloys, aerospace and defense and Western Australia, while New South Wales and the Australian Capital Territory keep the largest share. Local processing incentives from 2027 may also widen domestic feed for alloy makers. In contrast, import delays, certification costs and metal price swings could slow orders in some years.
Frequently Asked Questions
How big is the Australia high performance alloys market?
Which region leads alloy demand?
Which region grows fastest?
Which product type holds the largest share?
How does defense work affect demand?
Which product type grows fastest?
Who are the leading companies in this market?
What are the main risks to growth?
Table of Content
Chapter 1 Market Segmentation
- 1.1 Segmentation Framework
- 1.1.1 Product and Service Classification
- 1.1.2 Application and End-Use Classification
- 1.1.3 Technology and Solution Classification
- 1.1.4 Customer and Distribution Channel Classification
- 1.1.5 Geographic Segmentation
- 1.1.6 Market Segment Definitions and Boundaries
- 1.2 By Product Type
- 1.2.1 High-Strength Specialty Steels
- 1.2.2 Nickel-Based Alloys
- 1.2.3 Titanium Alloys
- 1.2.4 Cobalt, Refractory and Specialty Non-Ferrous Alloys
- 1.3 By End-Use Industry
- 1.3.1 Aerospace and Defence
- 1.3.2 Mining and Resources
- 1.3.3 Energy and Chemical Processing
- 1.3.4 Medical
- 1.3.5 Transport and Specialist Manufacturing
- 1.4 By Application
- 1.4.1 Wear and Load-Bearing Components
- 1.4.2 Corrosion-Resistant Equipment
- 1.4.3 High-Temperature Components
- 1.4.4 Precision and Biocompatible Components
- 1.5 By Sales Channel
- 1.5.1 Stockist Sales
- 1.5.2 Direct Mill Contracts
- 1.5.3 Project Supply Agreements
- 1.5.4 Integrated Processing Contracts
Chapter 2 Introduction
- 2.1 Report Objectives and Scope
- 2.2 Product Definition and Industry Terminology
- 2.3 Market Inclusions and Exclusions
- 2.4 Research Process
- 2.4.1 Primary Research and Expert Interviews
- 2.4.2 Secondary Research and Source Review
- 2.4.3 Top-Down and Bottom-Up Estimation
- 2.4.4 Data Triangulation and Verification
- 2.5 Market Size Measurement Basis
- 2.5.1 2025: USD 164.5 million → 2035: USD 298.9 million
- 2.6 Historical and Forecast Reference Periods
- 2.6.1 Historical Period: 2018-2025
- 2.6.2 Base Year: 2025
- 2.6.3 Forecast Period: 2025-2035
- 2.7 Research Assumptions and Limitations
Chapter 3 Executive Summary
- 3.1 Market Snapshot and Key Findings
- 3.2 Base-Year Market Size, 2025
- 3.3 Forecast Market Size, 2035
- 3.4 Revenue and Volume Growth Outlook
- 3.5 Key Demand and Supply Indicators
- 3.6 Leading Market Segments
- 3.7 Fastest-Growing Market Opportunities
- 3.8 Regional Performance Highlights
- 3.9 Technology and Industry Transformation
- 3.10 Competitive Landscape Summary
- 3.11 Analyst View and Strategic Implications
Chapter 4 Australia High Performance Alloys Market Trends and Developments
- 4.1 Historical Industry Development, 2018-2025
- 4.2 Recent Market Trends and Developments
- 4.3 Demand and Customer Behavior Trends
- 4.4 Technology and Product Innovation
- 4.5 Artificial Intelligence, Automation and Digitalization
- 4.6 Local Manufacturing and Supply Chain Realignment
- 4.7 Industry Partnerships, Mergers and Acquisitions
- 4.8 Sustainability and Circular Economy Developments
- 4.9 Government and Private Sector Investment Trends
- 4.10 Emerging Business Models and Commercialization
- 4.11 Industry Developments and Announcements
Chapter 5 Australia High Performance Alloys Market Production, Supply and Demand Analysis
- 5.1 Demand Trend and Consumption Analysis, 2018-2025
- 5.2 Demand Forecast, 2025-2035
- 5.3 Production and Output Trend, 2018-2025
- 5.4 Production and Output Forecast, 2025-2035
- 5.5 Installed Capacity and Capacity Utilization
- 5.6 Company-Wise Production Plants and Statistics
- 5.6.1 Installed Production Capacity
- 5.6.2 Actual Production
- 5.6.3 Planned Capacity and Expansion Targets
- 5.7 Supply Chain Structure and Procurement Trends
- 5.8 Supply-Demand Gap and Bottlenecks
- 5.9 Import Dependence and Sourcing Structure
- 5.10 Contract Manufacturing and Outsourcing
- 5.11 Regional Supply and Demand Concentration
Chapter 6 Australia High Performance Alloys Market Pricing Analysis
- 6.1 Pricing Structure and Measurement
- 6.2 Historical Pricing Trends, 2018-2025
- 6.3 Pricing Outlook, 2025-2035
- 6.4 Average Selling Price and Unit Economics
- 6.5 Pricing by Product and Market Segment
- 6.6 Geographic Pricing Differences
- 6.7 Key Input, Energy, Labor and Logistics Costs
- 6.8 Contract Pricing and Purchasing Models
- 6.9 Pricing Sensitivity and Competitive Positioning
- 6.10 Price, Margin and Profitability Implications
Chapter 7 Australia High Performance Alloys Market Dynamics
- 7.1 Market Growth Drivers
- 7.1.1 Demand-Side Drivers
- 7.1.2 Technology and Innovation Drivers
- 7.1.3 Infrastructure and Investment Drivers
- 7.1.4 Regulatory and Policy Drivers
- 7.2 Market Restraints
- 7.2.1 Cost and Affordability Constraints
- 7.2.2 Technology and Adoption Barriers
- 7.2.3 Supply Chain and Operational Constraints
- 7.3 Market Challenges
- 7.3.1 Competitive Pressure and Margin Erosion
- 7.3.2 Skills, Infrastructure and Implementation Gaps
- 7.4 Emerging Market Opportunities
- 7.5 Market Dynamics Impact and Time-Horizon Assessment
Chapter 8 Australia High Performance Alloys Value Chain Analysis
- 8.1 Industry Value Chain Overview
- 8.2 Upstream Suppliers and Critical Inputs
- 8.3 Technology and Component Providers
- 8.4 Manufacturing or Service Delivery
- 8.5 Distribution, Channel Partners and Integrators
- 8.6 Downstream Applications and End Users
- 8.7 Value Addition and Profit Pools
- 8.8 Vertical Integration and Outsourcing
- 8.9 Supplier Concentration and Risk
- 8.10 Supply Chain Localization and Resilience
Chapter 9 Australia High Performance Alloys Market Regulations and Policies
- 9.1 Relevant Laws, Standards and Compliance Frameworks
- 9.2 Product, Service, Safety and Quality Requirements
- 9.3 Government Policies, Incentives and Subsidies
- 9.4 Imports, Exports and Trade Barriers
- 9.5 Public Procurement and Local Content Requirements
- 9.6 Environmental and Sustainability Compliance
- 9.7 Upcoming Policy Changes and Market Implications
Chapter 10 Australia High Performance Alloys Market Hotspots and Opportunities
- 10.1 Market Opportunity Mapping and Growth Hotspots
- 10.2 High-Growth Applications and Customer Groups
- 10.3 Underserved Markets and White-Space Opportunities
- 10.4 Emerging Technology and Product Opportunities
- 10.5 New Capacity and Investment Hotspots
- 10.6 Market Entry and Expansion Opportunities
- 10.7 Distribution and Partnership Opportunities
- 10.8 Near-Term and Long-Term Commercial Potential
- 10.9 Opportunity Attractiveness and Execution Risks
Chapter 11 Australia High Performance Alloys Market Outlook, 2025-2035
- 11.1 Market Size and Analysis
- 11.1.1 Revenue (Market Measurement: 2025: USD 164.5 million → 2035: USD 298.9 million)
- 11.1.2 Market Volume and Quantity Sold
- 11.1.3 Historical Market Size, 2018-2025
- 11.1.4 Base-Year Market Size, 2025
- 11.2 Market Forecast, 2025-2035
- 11.2.1 Revenue Forecast to 2035
- 11.2.2 Volume Forecast to 2035
- 11.2.3 CAGR and Year-on-Year Growth
- 11.2.4 Incremental Revenue Opportunity
- 11.3 Forecast Assumptions and Scenario Analysis
- 11.3.1 Base-Case Forecast
- 11.3.2 Optimistic and Conservative Scenarios
- 11.3.3 Technology, Pricing and Policy Sensitivities
- 11.4 Market Attractiveness and Growth Outlook
Chapter 12 Australia High Performance Alloys Market Segmentation and Outlook
- 12.1 Segmentation Summary and Market Shares, 2025
- 12.2 Largest and Fastest-Growing Segments
- 12.3 By Product Type - Market Size and Forecast, 2025-2035
- 12.3.1 Segment Definition and Scope
- 12.3.2 Historical Market Size, 2018-2025
- 12.3.3 Revenue Forecast, 2025-2035
- 12.3.4 Volume Forecast, 2025-2035
- 12.3.5 Base-Year Market Share, 2025
- 12.3.6 Segment CAGR and Growth Drivers
- 12.3.7 Subsegment Market Size and Forecast
- 12.3.7.1 High-Strength Specialty Steels
- 12.3.7.2 Nickel-Based Alloys
- 12.3.7.3 Titanium Alloys
- 12.3.7.4 Cobalt, Refractory and Specialty Non-Ferrous Alloys
- 12.3.8 Subsegment Pricing and Adoption Trends
- 12.3.9 Leading Suppliers and Competition
- 12.3.10 Regional Demand and Opportunities
- 12.4 By End-Use Industry - Market Size and Forecast, 2025-2035
- 12.4.1 Segment Definition and Scope
- 12.4.2 Historical Market Size, 2018-2025
- 12.4.3 Revenue Forecast, 2025-2035
- 12.4.4 Volume Forecast, 2025-2035
- 12.4.5 Base-Year Market Share, 2025
- 12.4.6 Segment CAGR and Growth Drivers
- 12.4.7 Subsegment Market Size and Forecast
- 12.4.7.1 Aerospace and Defence
- 12.4.7.2 Mining and Resources
- 12.4.7.3 Energy and Chemical Processing
- 12.4.7.4 Medical
- 12.4.7.5 Transport and Specialist Manufacturing
- 12.4.8 Subsegment Pricing and Adoption Trends
- 12.4.9 Leading Suppliers and Competition
- 12.4.10 Regional Demand and Opportunities
- 12.5 By Application - Market Size and Forecast, 2025-2035
- 12.5.1 Segment Definition and Scope
- 12.5.2 Historical Market Size, 2018-2025
- 12.5.3 Revenue Forecast, 2025-2035
- 12.5.4 Volume Forecast, 2025-2035
- 12.5.5 Base-Year Market Share, 2025
- 12.5.6 Segment CAGR and Growth Drivers
- 12.5.7 Subsegment Market Size and Forecast
- 12.5.7.1 Wear and Load-Bearing Components
- 12.5.7.2 Corrosion-Resistant Equipment
- 12.5.7.3 High-Temperature Components
- 12.5.7.4 Precision and Biocompatible Components
- 12.5.8 Subsegment Pricing and Adoption Trends
- 12.5.9 Leading Suppliers and Competition
- 12.5.10 Regional Demand and Opportunities
- 12.6 By Sales Channel - Market Size and Forecast, 2025-2035
- 12.6.1 Segment Definition and Scope
- 12.6.2 Historical Market Size, 2018-2025
- 12.6.3 Revenue Forecast, 2025-2035
- 12.6.4 Volume Forecast, 2025-2035
- 12.6.5 Base-Year Market Share, 2025
- 12.6.6 Segment CAGR and Growth Drivers
- 12.6.7 Subsegment Market Size and Forecast
- 12.6.7.1 Stockist Sales
- 12.6.7.2 Direct Mill Contracts
- 12.6.7.3 Project Supply Agreements
- 12.6.7.4 Integrated Processing Contracts
- 12.6.8 Subsegment Pricing and Adoption Trends
- 12.6.9 Leading Suppliers and Competition
- 12.6.10 Regional Demand and Opportunities
- 12.7 Segment Growth Comparison
- 12.8 Segment Attractiveness and Priority Matrix
Chapter 13 Australia High Performance Alloys End-Use and Application Market Outlook
- 13.1 End-Use Industry and Customer Demand Structure
- 13.2 Leading Applications and Customer Groups
- 13.3 End-Use Market Size, Share and Forecast
- 13.4 Major End-Use Industry Deep Dives
- 13.4.1 Customer Requirements and Use Cases
- 13.4.2 Demand and Replacement Cycles
- 13.4.3 Technical and Regulatory Considerations
- 13.4.4 Purchasing and Procurement Models
- 13.4.5 Leading Vendors and Distribution Channels
- 13.4.6 Forecast and Commercial Opportunities
- 13.5 Emerging Applications and Cross-Segment Demand
- 13.6 End-Use Industry Investment Priorities
Chapter 14 Australia High Performance Alloys Geographic Market Outlook, 2025-2035
- 14.1 Domestic Market Distribution and Demand Clusters
- 14.2 State- or Province-Wise Market Size and Forecast, 2025-2035
- 14.3 City and Metropolitan Market Outlook
- 14.4 Industrial, Manufacturing and Commercial Clusters
- 14.5 Geographic Concentration of Key End Users
- 14.6 Local Pricing and Purchasing Differences
- 14.7 Domestic Production Facilities and Capacity Map
- 14.8 Local Infrastructure and Project Pipeline
- 14.9 State-Level Policy and Incentive Differences
- 14.10 Subnational Investment Hotspots and Opportunities
- 14.11 Distribution and Logistics Networks
- 14.12 Domestic Competitive Footprint
Chapter 15 Australia High Performance Alloys Technology, Innovation and Sustainability Outlook
- 15.1 Technology Landscape and Maturity
- 15.2 Product, Process and Service Innovation
- 15.3 AI, Automation and Digital Tools in the Industry
- 15.4 Technology Adoption and Performance Benchmarking
- 15.5 Innovation Pipeline and R&D Investment
- 15.6 Patent and Intellectual Property Trends
- 15.7 Energy Efficiency and Resource Management
- 15.8 Sustainability, Recycling and Circularity
- 15.9 Technology Roadmap, 2025-2035
- 15.10 Risks of Obsolescence and Technology Substitution
Chapter 16 Australia High Performance Alloys Market Key Strategic Imperatives
- 16.1 Growth and Market Entry Priorities
- 16.2 High-Return Products and Segments
- 16.3 Pricing, Profitability and Cost Optimization
- 16.4 Technology Investment and Product Differentiation
- 16.5 Supply Chain Localization and Resilience
- 16.6 Distribution and Customer Acquisition
- 16.7 Partnership, Acquisition and Capacity Strategy
- 16.8 Regional Expansion Priorities
- 16.9 Short-, Medium- and Long-Term Actions
Chapter 17 Competition Outlook
- 17.1 Industry Competition Characteristics
- 17.2 Market Structure and Concentration
- 17.3 Market Share and Competitive Positioning, 2025
- 17.4 Company-Wise Revenue and Product Benchmarking
- 17.5 Production and Service Capacity Benchmarking
- 17.6 Technology, Pricing and Differentiation
- 17.7 Regional Footprint and Distribution Strength
- 17.8 Mergers, Acquisitions and Strategic Alliances
- 17.9 New Entrants and Competitive Threats
- 17.10 Porter's Five Forces and Industry Attractiveness
- 17.11 Competitive Outlook, 2025-2035
Chapter 18 Company Profiles
- 18.1 Company Coverage and Selection Criteria
- 18.2 Bisalloy Steel Group
- 18.2.1 Business Description
- 18.2.2 Company Ownership and Geographic Presence
- 18.2.3 Product and Service Portfolio
- 18.2.4 Manufacturing and Operating Footprint
- 18.2.5 Production Capacity and Expansion Plans
- 18.2.6 Financial Performance and Investment
- 18.2.7 Market Share and Competitive Position
- 18.2.8 Technology and Innovation Capabilities
- 18.2.9 Strategic Alliances or Partnerships
- 18.2.10 Recent Developments
- 18.2.11 Growth Strategy and Outlook
- 18.3 voestalpine High Performance Metals Australia
- 18.4 thyssenkrupp Materials Australia
- 18.5 Atlas Steels
- 18.6 Austral Wright Metals
- 18.7 Applied Alloys International
- 18.8 Stirlings Performance Steels
- 18.9 Prochem
- 18.10 Alloys International
- 18.11 Austral Alloys
- 18.12 Other Relevant Market Participants
Note: Every listed company is profiled on the structure shown under the first company. The company list is preliminary and may change based on research findings, market developments, data availability and client requirements.
Chapter 19 Disclaimer
- 19.1 Research and Forecast Disclaimer
- 19.2 Data Source and Estimation Limitations
Note: The depth of individual sections depends on data availability for this market. Volume, capacity, trade and other unit-based metrics are included where applicable.

