
Mine wear and defense programs shape Australian plate demand
The Australia heat-treated steel plates market was valued at USD 328.5 million in 2025 and is projected to increase from USD 344.0 million in 2026 to USD 518.0 million by 2035, registering a CAGR of 4.65% during 2026–2035. Demand comes from mining equipment makers, fabricators, maintenance teams and defense contractors that need quenched and tempered plate for wear liners, buckets, truck bodies, load-bearing structures and armored hulls. New South Wales and the Australian Capital Territory held the largest regional share, 33.7% in 2025, because the Illawarra region hosts local plate making and heat treatment. Victoria, South Australia, Tasmania and the Northern Territory form the fastest-growing zone at 4.96% a year, as armored vehicle production builds near Geelong. Imports compete with local supply under anti-dumping measures that were continued in October 2024. A first order for Australian-processed submarine steel in July 2026 also opened a new export path.
Which quenched and heat-treated plate grades does the estimate cover?
The estimate measures the value of steel plate that has been quenched and tempered, normalized or otherwise heat treated to reach set hardness, strength or toughness levels and is sold for use in Australia. It covers abrasion-resistant wear plate, high-strength structural plate, pressure-vessel plate and armor plate. Values are stated at producer and distributor selling prices and include imported plate sold through local service centers.
The estimate excludes untreated hot-rolled plate, coated sheet, finished wear parts sold as components, and plate built into imported machinery. The value chain runs from steelmakers that roll raw plate through heat treatment lines, importers and stockholding service centers to equipment makers, fabricators, mine maintenance teams and defense prime contractors across the resources, transport, construction, energy and defense sectors.
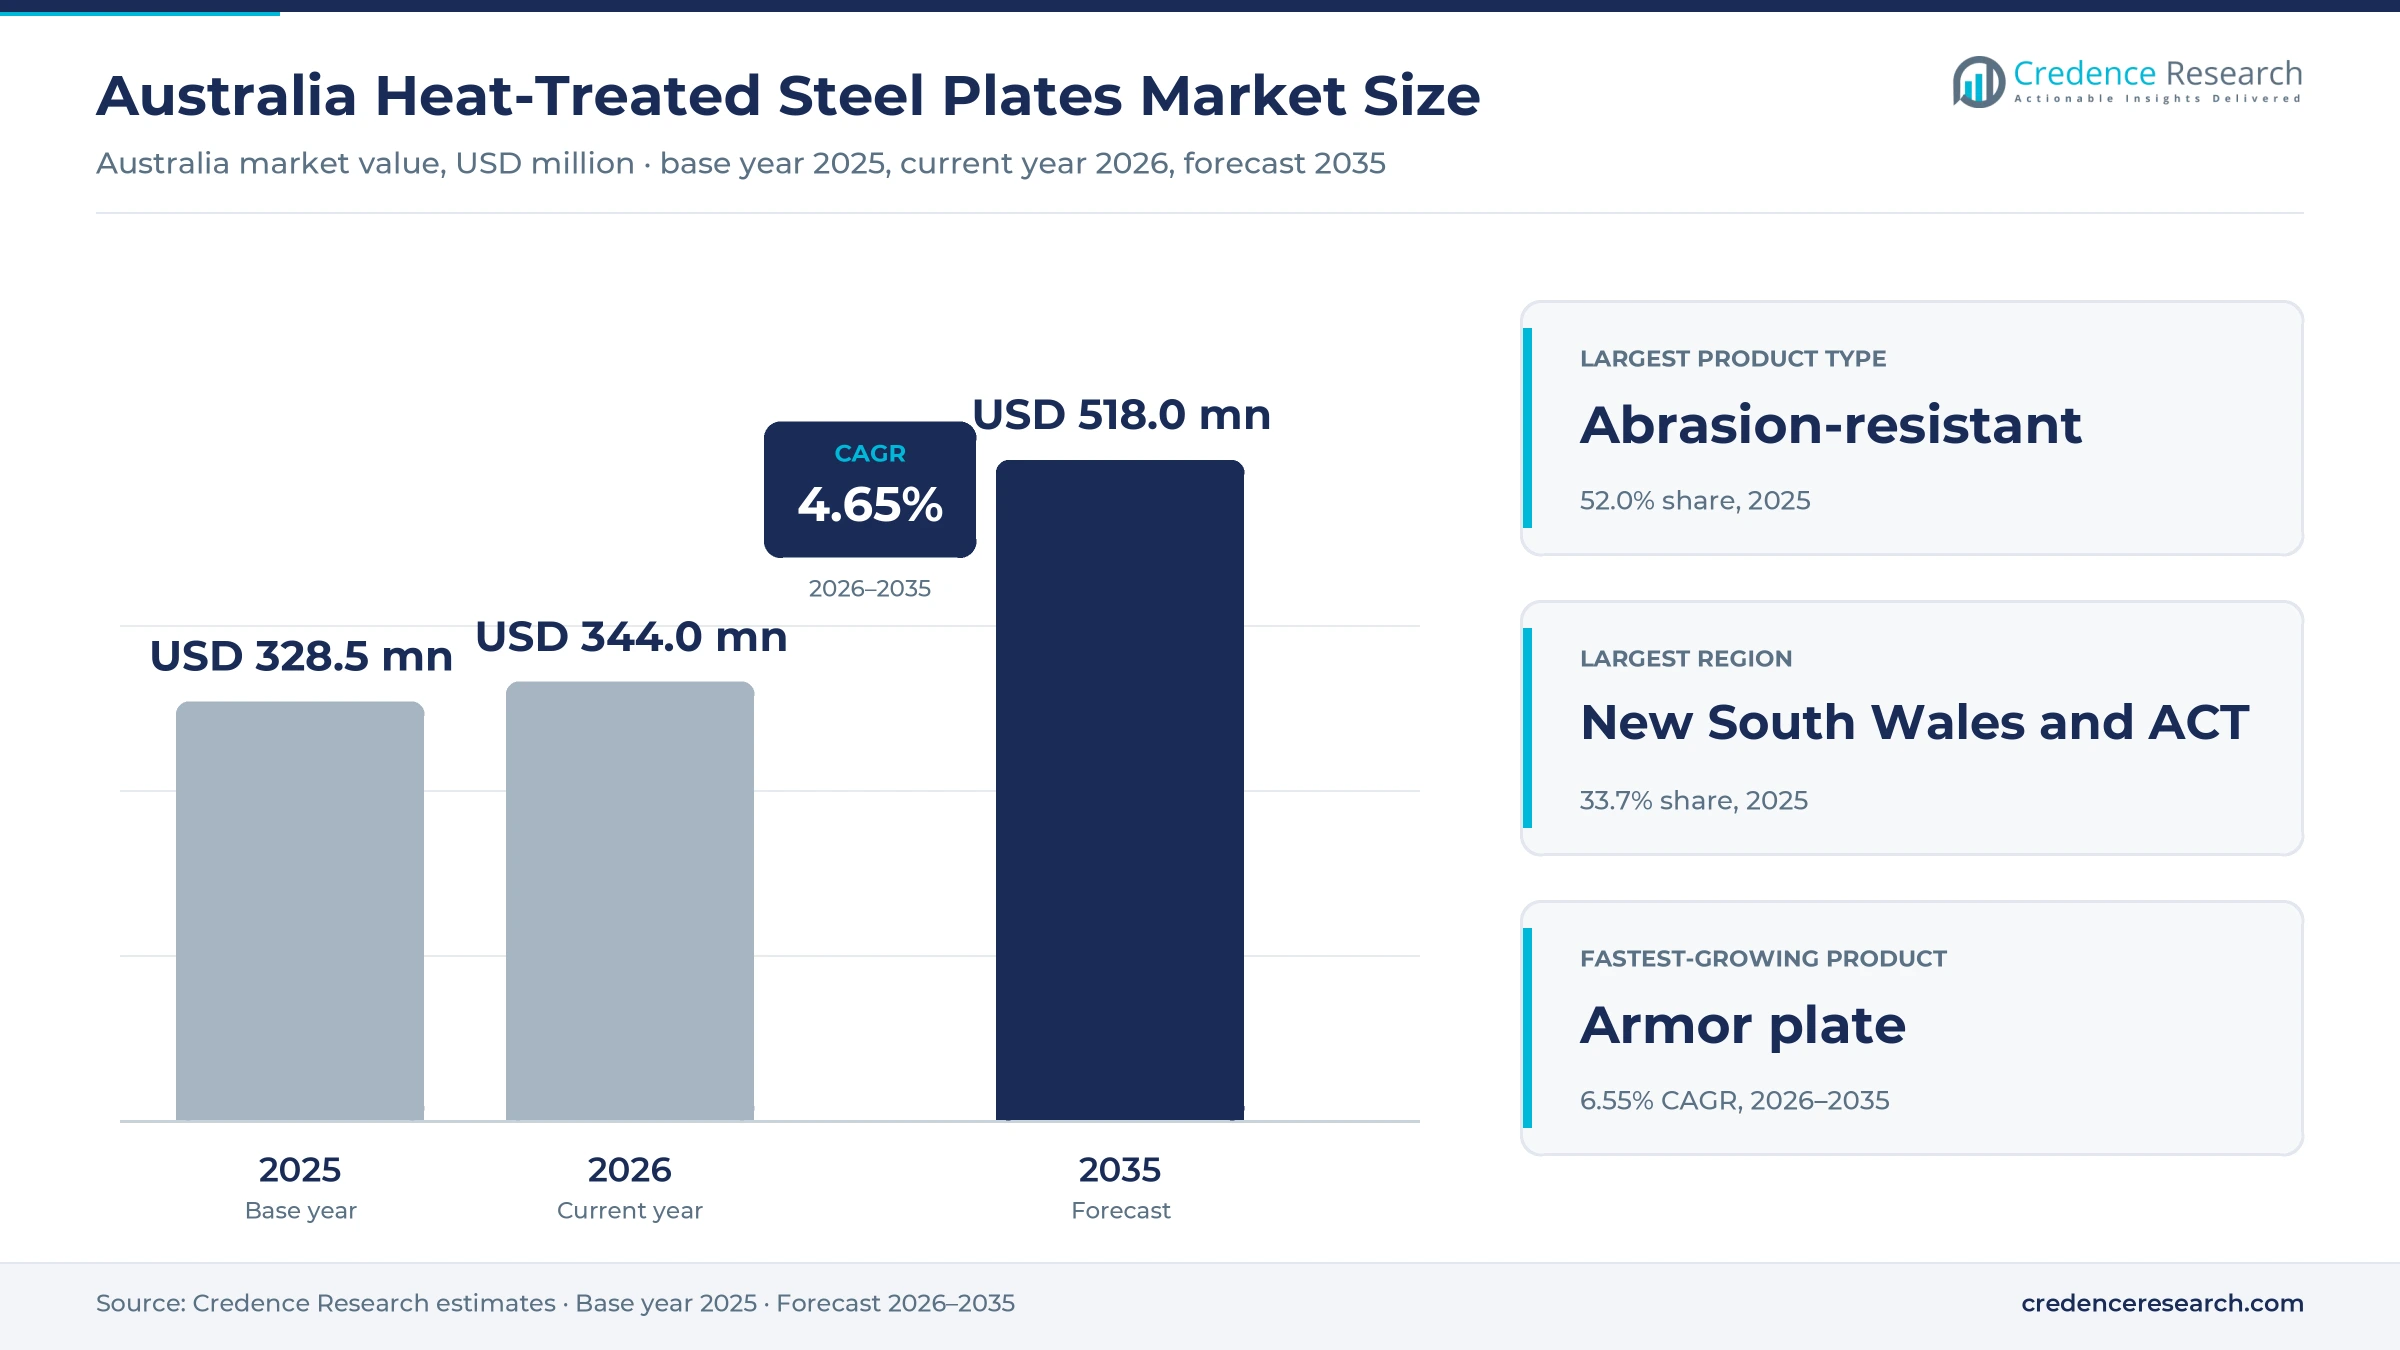
Australia Heat-Treated Steel Plates Market Insights
- The Australia heat-treated steel plates market was valued at USD 328.5 million in 2025 and is projected to reach USD 518.0 million by 2035, registering a CAGR of 4.65% during 2026–2035.
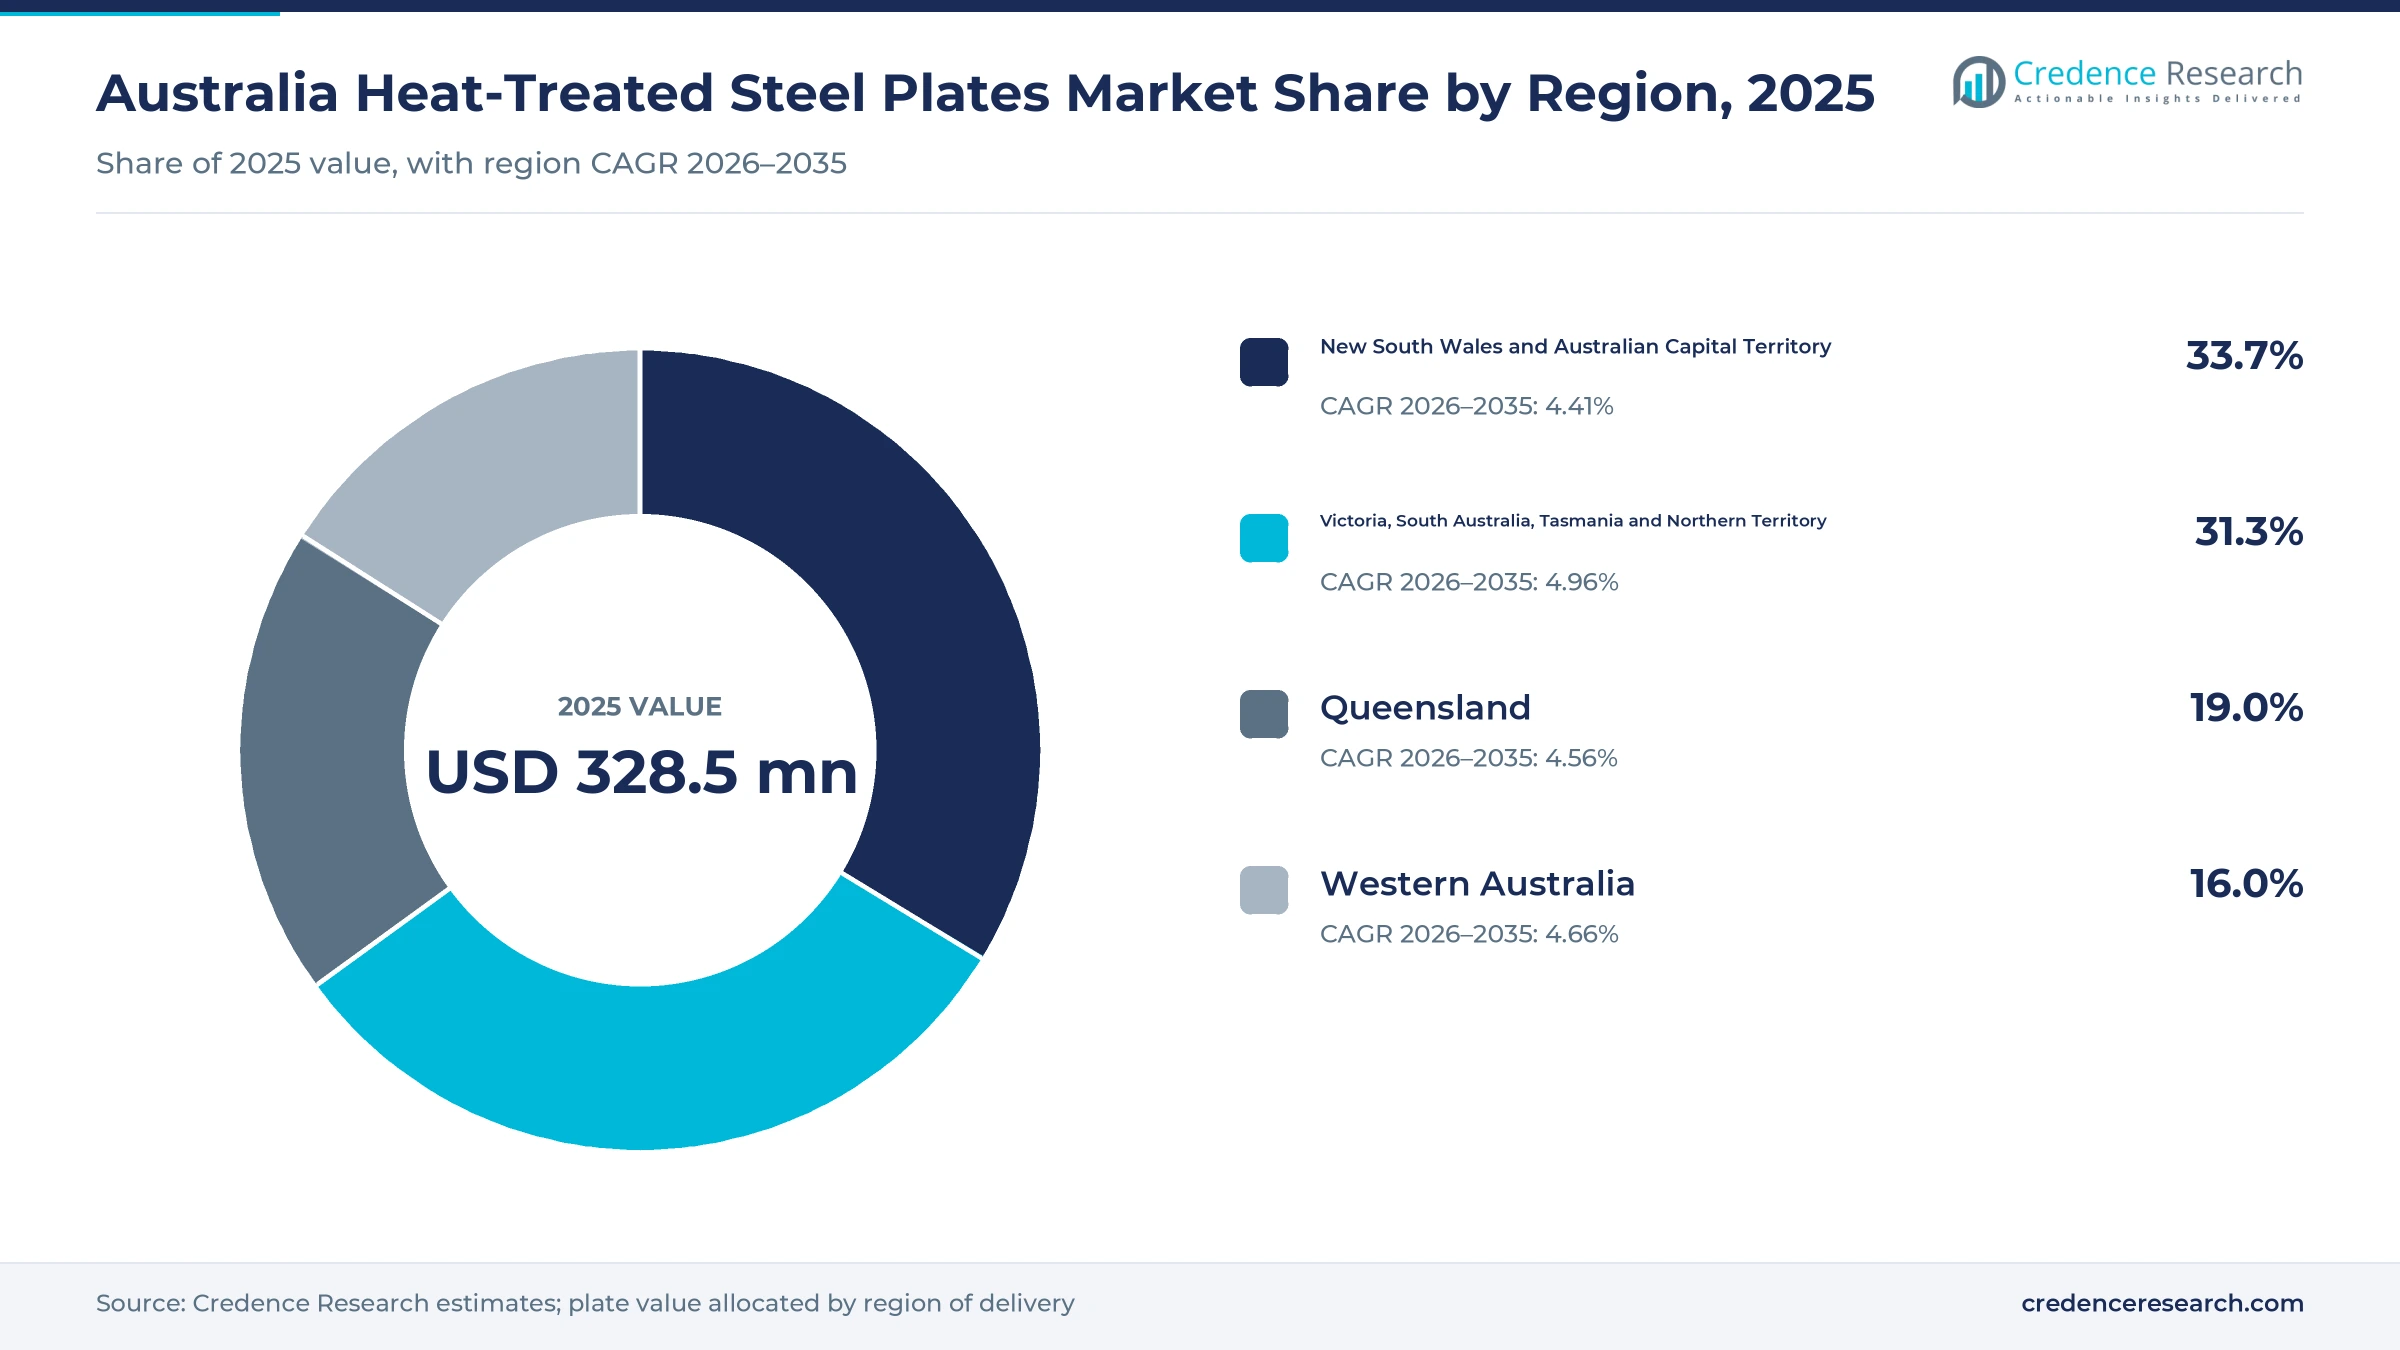
- New South Wales and the Australian Capital Territory held a 33.7% share of 2025 value, because the Illawarra region hosts local plate making and heat treatment.
- Abrasion-resistant plate led with a 52.0% share of 2025 value, because mines replace worn liners, buckets and truck trays on a regular cycle.
- Anti-dumping measures on certain quenched and tempered plate from Finland, Japan and Sweden were continued in October 2024 and affirmed on review in August 2025.
- Bisalloy reported that armor and protection plate volumes into global markets grew 229% in the year to June 2026, which lifts the defense share of local output.
Wear plate leads while armor grades grow fastest
Why does abrasion-resistant plate lead product demand?
Based on product type, the market is categorized into abrasion-resistant plate, high-strength structural plate, pressure-vessel plate and armour plate. Abrasion-Resistant Plate led with a 52.0% share of 2025 value, because mines replace worn liners, chutes and truck trays on a regular cycle. Armour Plate grows fastest at 6.55% a year, as local vehicle builds and export orders lift armor volumes.
How does mining and resources dominate end use?
Based on end-use industry, the market is categorized into mining and resources, building and construction, heavy transport and fabrication, energy and infrastructure, and defense and security. Mining & Resources led with a 48.0% share of 2025 value, because excavators, crushers and haul trucks wear through plate quickly. Defence & Security grows fastest at 6.77% a year, as armored vehicle and submarine programs expand.
Why do equipment manufacturers buy the most plate?
Based on customer type, the market is categorized into equipment manufacturers, fabrication contractors, asset owner maintenance teams and defense prime contractors. Equipment Manufacturers led with a 38.0% share of 2025 value, because builders of buckets, trays and attachments buy plate in large lots. Defence Prime Contractors grow fastest at 6.52% a year, as qualified suppliers win vehicle and naval steel orders.
How do service centers and direct contracts reach buyers?
Based on sales channel, the market is categorized into direct producer contracts, stockholding service centers and project-based import contracts. Stockholding Service Centres led with a 45.0% share of 2025 value, because fabricators and maintenance teams need cut-to-size plate at short notice. Direct Producer Contracts grow fastest at 4.98% a year, as defense primes and large equipment makers sign qualified supply agreements.
| Segment Group | Leading Sub-segment | Share, 2025 | Fastest-growing Sub-segment | CAGR, 2026–2035 |
|---|---|---|---|---|
| By Product Type | Abrasion-Resistant Plate | 52.0% | Armour Plate | 6.55% |
| By End-Use Industry | Mining & Resources | 48.0% | Defence & Security | 6.77% |
| By Customer Type | Equipment Manufacturers | 38.0% | Defence Prime Contractors | 6.52% |
| By Sales Channel | Stockholding Service Centres | 45.0% | Direct Producer Contracts | 4.98% |
Request a Free Sample
Fill in your details and we'll send you a free sample report.
- Sample data tables & charts
- Research methodology
Mine wear, defense work and heavier equipment lift demand
How does recurring mining wear replacement sustain demand?
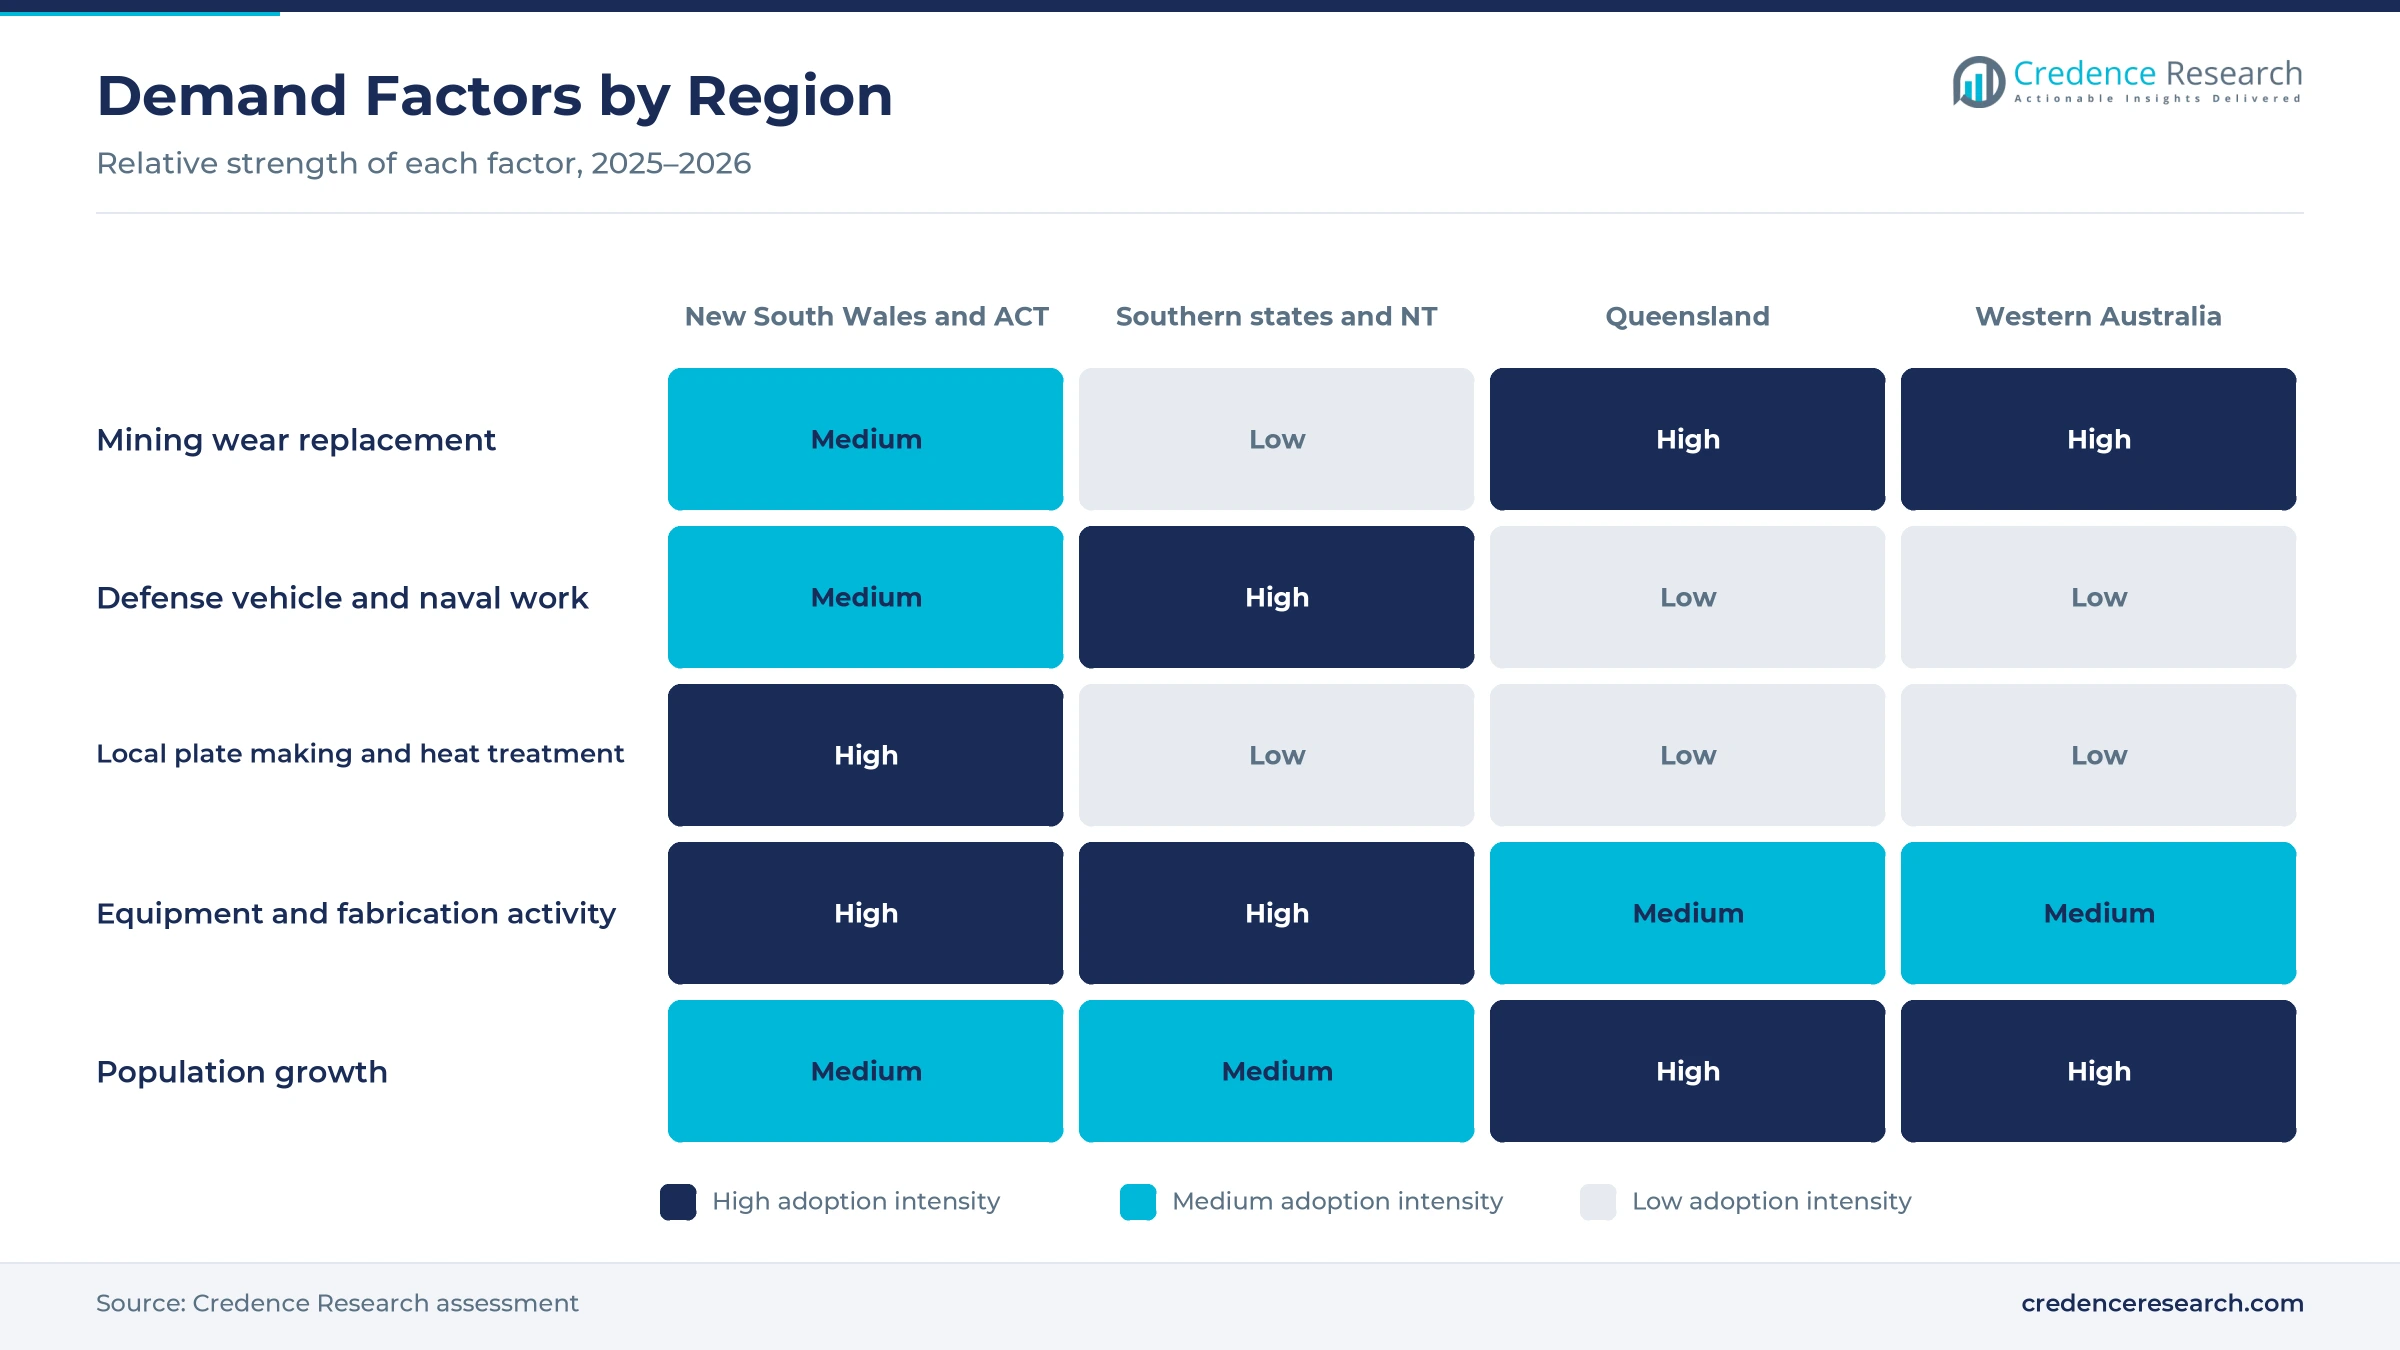
Recurring mining wear replacement sustains demand, because buckets, chutes, crushers and haul truck trays wear through plate and must be relined on a regular schedule. Australia earned an estimated $385 billion from resources and energy exports in 2024-25, according to the September 2025 Resources and Energy Quarterly. Gold export earnings were forecast to rise to $60 billion in 2025-26 from $47 billion, which supports active mines and processing plants. Seasonally adjusted mining capital expenditure also rose 1.6% in the June 2026 quarter, according to the Australian Bureau of Statistics. As a result, mining and resources hold a 48.0% share of 2025 value, as owners of underground mining equipment keep replacing wear parts.
Why does qualified defense procurement lift armor demand?
Qualified defense procurement lifts armor demand, because vehicle and naval programs require plate that has passed strict testing for hardness, toughness and ballistic performance. The government set $330 billion for the Integrated Investment Program over the decade to 2033-34 in April 2024, with defense spending projected at about 2.4% of GDP. The Armoured Vehicle Centre of Excellence near Geelong opened on Aug. 23, 2024, to build 28 Huntsman howitzers and later 129 Redback vehicles, according to the Defense Minister. The site is expected to support 1,800 jobs once all phases are complete. In turn, defense and security grows at 6.77% a year, the fastest end-use rate.
How does high-strength equipment redesign raise plate value?
High-strength equipment redesign raises plate value, because equipment makers use harder and stronger grades to cut weight, lift payloads and extend service life. Quenched and tempered plate comprises wear, structural and armor grades used in mining, construction and machinery, according to the Anti-Dumping Commission. Seasonally adjusted spending on equipment, plant and machinery rose 18.7% in the year to the June 2026 quarter, reaching $25.1 billion in that quarter. SSAB also promotes its Hardox wear plate and Hardox certified equipment program to Australian buyers. As a result, equipment manufacturers hold a 38.0% share of 2025 value, as builders of trays and buckets specify thinner, harder plate.
Why do infrastructure and energy projects widen plate use?
Infrastructure and energy projects widen plate use, because bridges, cranes, transmission structures and wind foundations need high-strength plate that carries heavy loads. Infrastructure Australia reported in November 2025 that the five-year major public infrastructure pipeline grew $29 billion to $242 billion. Renewable projects such as transmission, solar, wind and pumped hydro total $163 billion over five years, while energy utility spending more than doubles to $36 billion. Manufacturing value added also held at about 5.3% of GDP in 2025, according to World Bank data, which keeps local fabrication active. In turn, energy and infrastructure grows faster than mining over the forecast, as fabricators order structural plate for project packages.
Armor exports and trade remedies reshape plate supply
How is the shift to armor exports changing local output?
The shift to armor exports is changing local output, because qualified plate made in Australia now reaches overseas defense programs as well as local ones. Bisalloy reported that armor and protection plate volumes into global markets grew 229% in the year to June 2026. The company also completed its contract with the Australian Submarine Agency and won its first order to supply HY80 steel to the U.S. submarine industry. BlueScope makes the raw plate in Australia, while Bisalloy carries out the heat treatment, according to the Australian Submarine Agency. As a result, armour plate grows at 6.55% a year, the fastest product rate, as demand from armored vehicles and submarines expands.
Why is the rise of trade remedies shaping import pricing?
The rise of trade remedies is shaping import pricing, because anti-dumping duties set a floor under imported quenched and tempered plate from three countries. The Anti-Dumping Commission found preliminary dumping margins of 18.4% for Japan and 56.9% for Sweden in its July 2024 continuation inquiry. Notice of the decision to continue the measures was published on Oct. 4, 2024, with proposed duty rates lower than before. A review panel then recommended in August 2025 that the decision be affirmed. However, Bisalloy described a more competitive Australian trading environment in the year to June 2026, which keeps prices under pressure for stockholding service centers.
Can naval and submarine programs open a new supply path?
Naval and submarine programs open a new supply path, because hull steel must pass long qualification steps that favor established local suppliers. Bisalloy completed qualification through the Defence Industry Vendor Qualification program before its first HY80 order in July 2026. Bisalloy and BlueScope were both in prequalification to supply submarine steel under AUKUS in March 2024, according to the Illawarra Mercury. The 2024 investment program also added $11.1 billion over the decade for the surface combatant fleet. In turn, defense prime contractors grow at 6.52% a year, the fastest customer rate, as qualified plate wins naval work.
Is there room to grow wear parts and certified fabrication?
Wear parts and certified fabrication leave room to grow, because mines want ready-to-fit liners and parts rather than raw plate. SSAB promotes Hardox Wearparts centers and Duroxite overlay products for extreme abrasion and impact wear. Bisalloy said it would recruit additional specialist sales staff to grow its BISPLATE volumes after a challenging year at home. The Australian market was also larger than before the 2019 continuation of trade measures, according to the 2024 inquiry. As a result, abrasion-resistant plate keeps a 52.0% share of 2025 value, as service centers add cutting, bending and abrasion-resistant sheet processing.
Mining cycles, import pricing and qualification test mills
How do mining cycles make wear plate demand volatile?
Mining cycles make wear plate demand volatile, because mine owners delay relining and new equipment when commodity prices fall. Bisalloy reported softer demand from parts of the resources sector in Western Australia and Queensland in the year to June 2026. As a result, wear and structural plate sales declined over the year. Suppliers respond by targeting gold mines, defense work and export markets that move on different cycles.
Why does import competition squeeze local margins?
Import competition squeezes local margins, because global mills sell branded wear and structural plate through local distributors at competitive prices. The Anti-Dumping Commission found that the local industry's market share kept declining even as the market expanded in its 2024 inquiry. In turn, local producers must match import prices on many orders. Suppliers respond with faster delivery, cut-to-size processing and technical support that imports find harder to match.
How does a single local producer concentrate supply risk?
A single local producer concentrates supply risk, because the Anti-Dumping Commission found that the Australian industry solely consists of Bisalloy. Any outage at that plant would push buyers toward imports with longer lead times. As a result, defense and mining buyers often hold safety stock or qualify more than one source. The producer responds by adding capacity and investing in its defense and international positions.
Why do qualification steps slow new defense suppliers?
Qualification steps slow new defense suppliers, because naval and armor programs require long testing before any plate can be used. Bisalloy needed the Defence Industry Vendor Qualification program before it won its first submarine steel order. In turn, new entrants face years of cost before earning revenue from armor materials. Governments respond with vendor qualification support that helps local firms meet U.S. submarine supply chain standards.
New South Wales leads while southern states grow fastest
| Region | Value, 2025 (USD million) | Share, 2025 | CAGR, 2026–2035 |
|---|---|---|---|
| New South Wales and Australian Capital Territory | 110.7 | 33.7% | 4.41% |
| Victoria, South Australia, Tasmania and Northern Territory | 102.8 | 31.3% | 4.96% |
| Queensland | 62.4 | 19.0% | 4.56% |
| Western Australia | 52.6 | 16.0% | 4.66% |
Why does new South Wales hold the largest share?
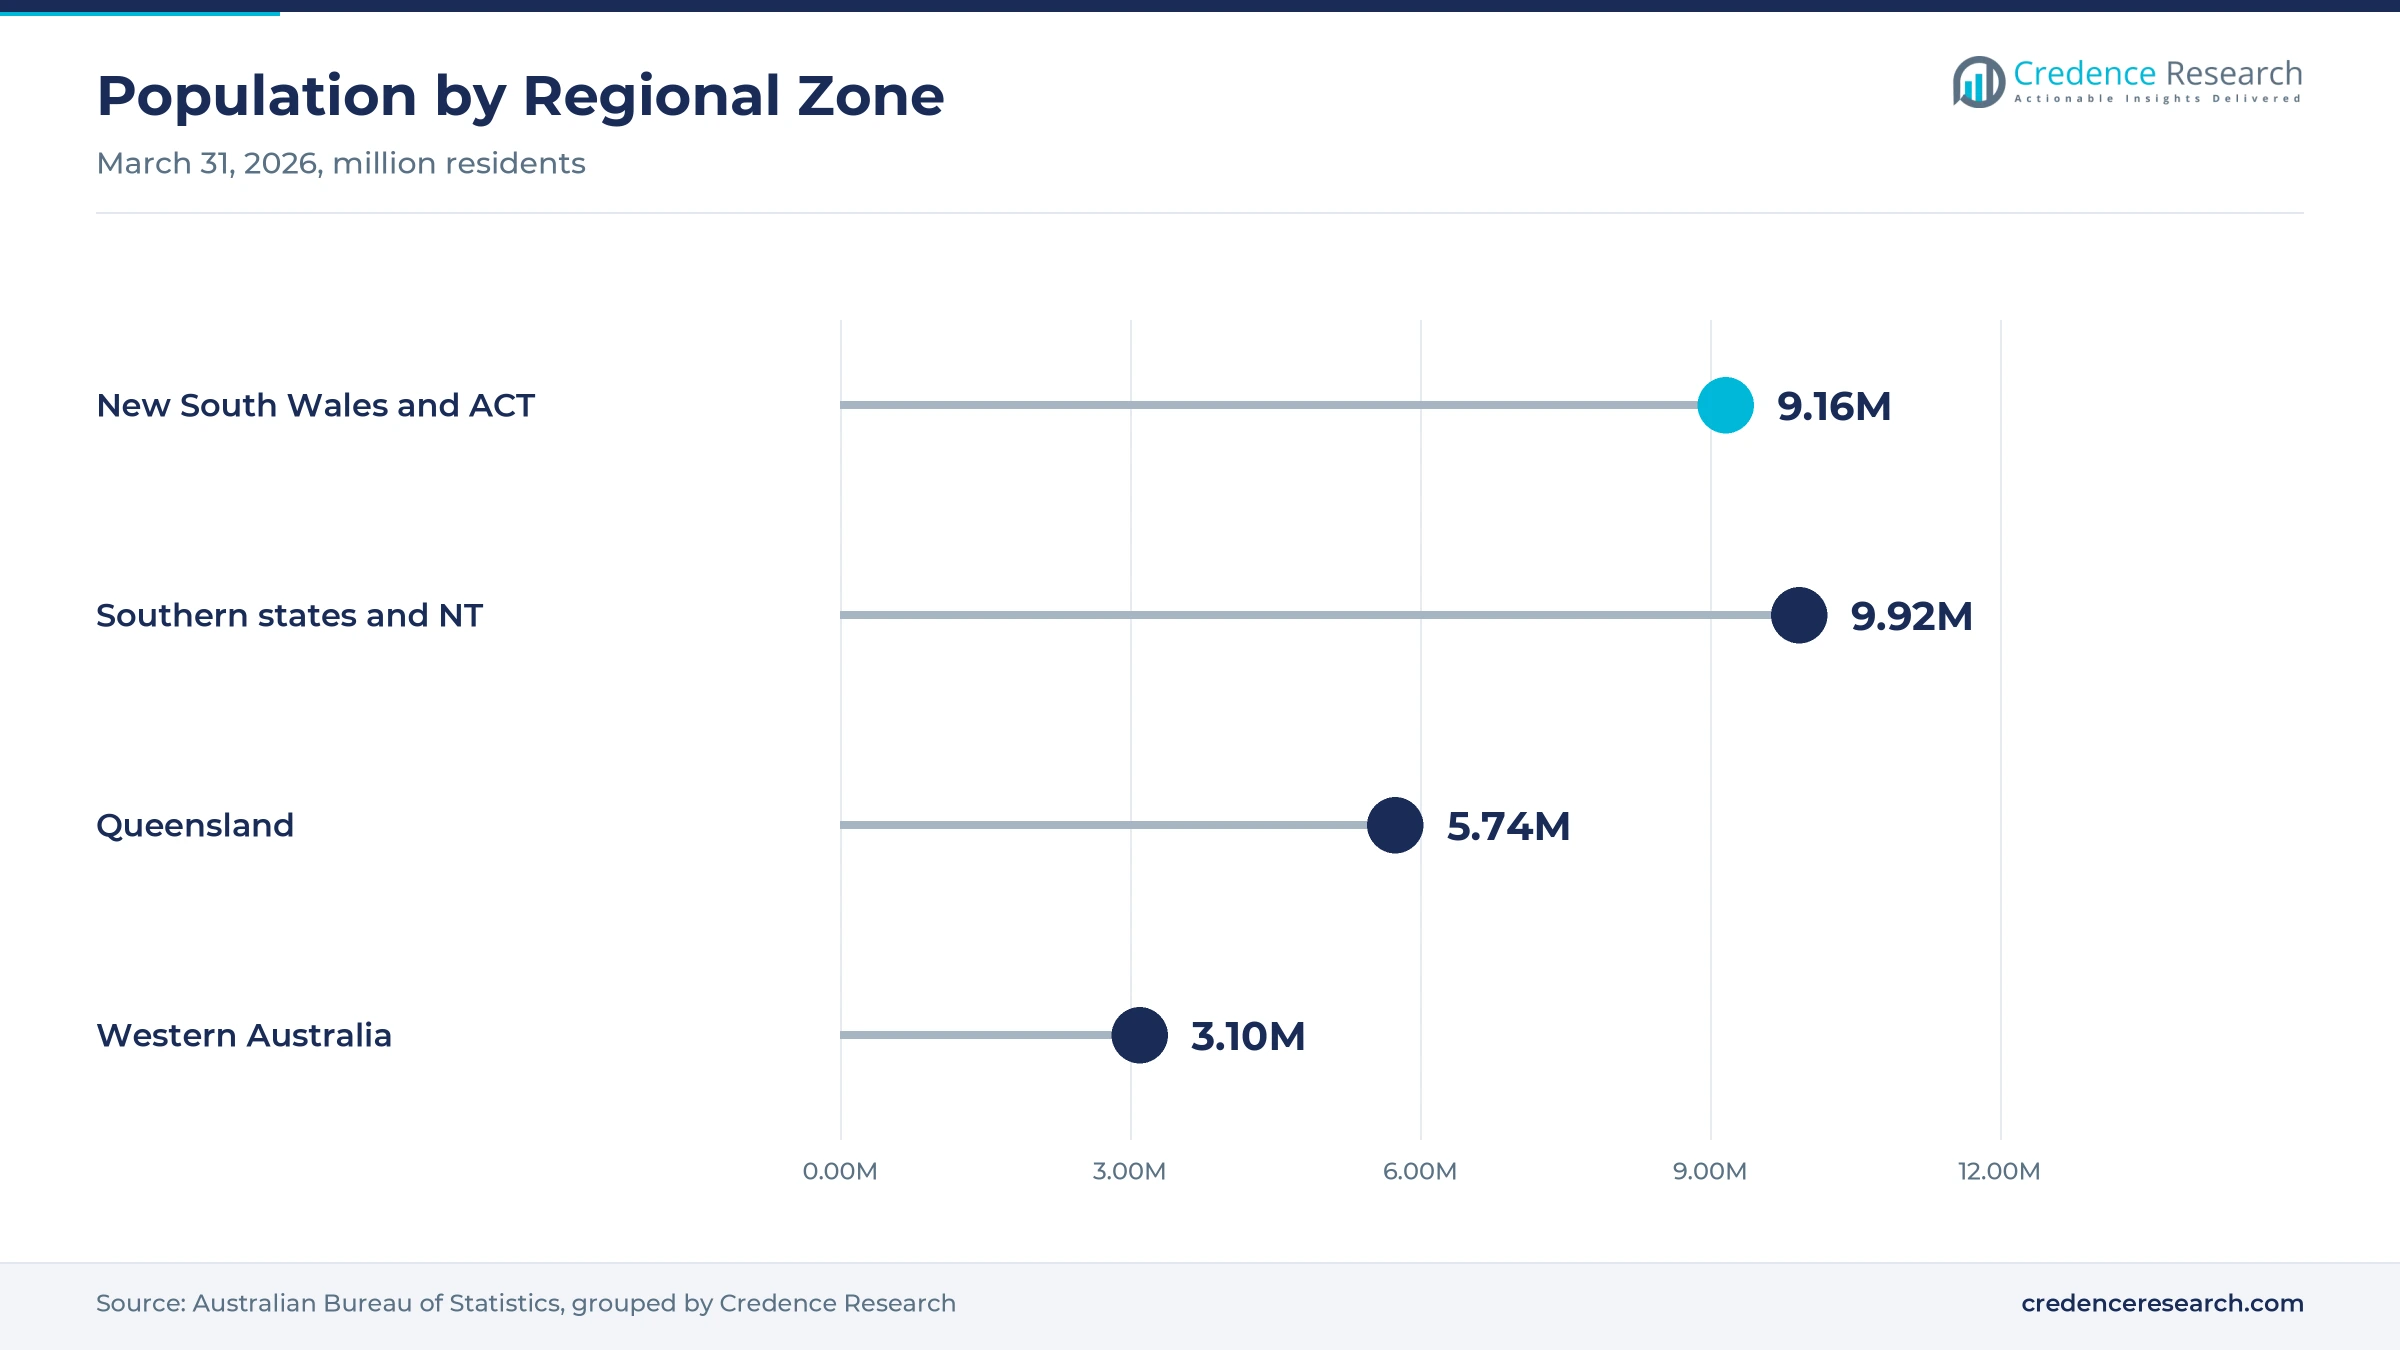
New South Wales and the Australian Capital Territory held a 33.7% share of 2025 value and grow at 4.41% a year, because the Illawarra region hosts local plate making and heat treatment. Bisalloy refines steel produced at the Port Kembla steelworks at its Unanderra yard. The two jurisdictions also had about 9.16 million residents at March 31, 2026. However, growth is slower than in the southern zone because defense vehicle assembly is based near Geelong.
Why are the southern states the fastest-growing zone?
Victoria, South Australia, Tasmania and the Northern Territory held a 31.3% share of 2025 value and grow fastest at 4.96% a year, because armored vehicle production builds near Geelong. The $170 million Hanwha facility at the Avalon Airport Precinct opened in August 2024. The site will build 28 Huntsman howitzers and later 129 Redback vehicles, which lifts orders for qualified armor plate. The zone also had about 9.92 million residents in March 2026, which supports construction and fabrication demand.
How does Queensland support wear plate demand?
Queensland held a 19.0% share of 2025 value and grows at 4.56% a year, because resource mines need regular replacement of liners, buckets and truck trays. Bisalloy reported softer resources demand in the state in the year to June 2026. However, the state added about 90,100 residents over the year to March 2026, which supports construction and transport fabrication. Its population growth rate of 1.6% also matched Victoria over the same period, which keeps local equipment and trailer builders busy.
What drives plate demand in Western Australia?
Western Australia held a 16.0% share of 2025 value and grows at 4.66% a year, because large resource operations wear through high volumes of plate in crushers, chutes and haul trucks. The state had the fastest population growth at 2.1% in the year to March 2026. However, softer resources demand in the year to June 2026 slowed orders for wear and structural plate.
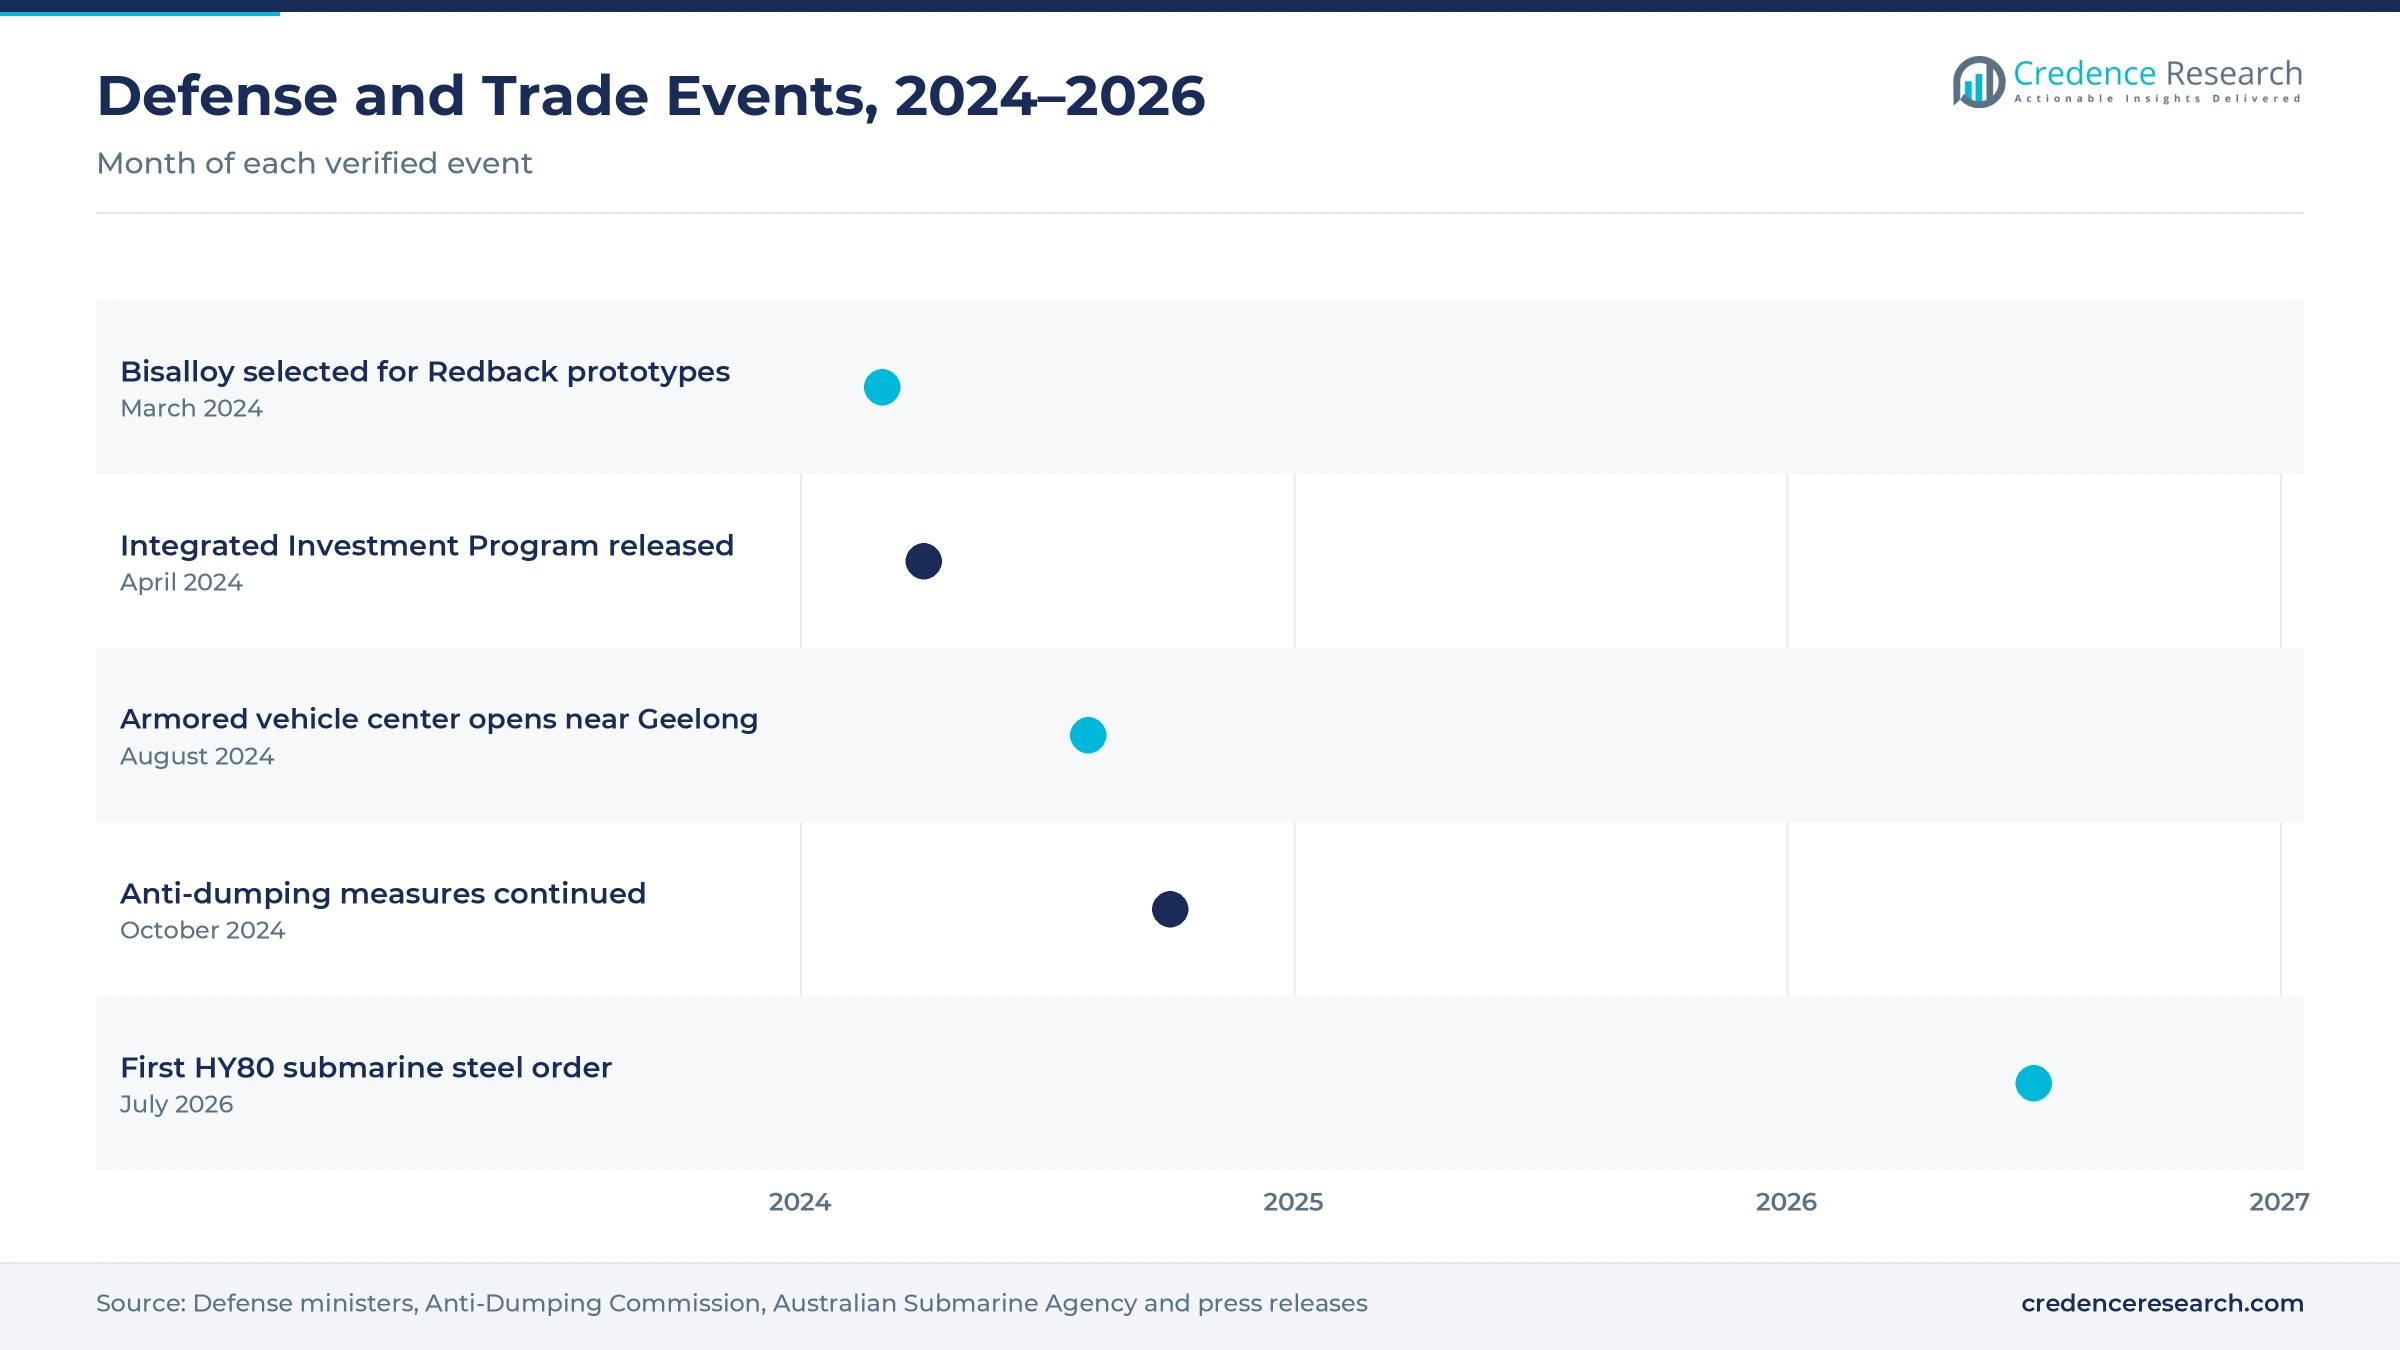
Vehicle, submarine and trade decisions marked 2024 to 2026
| Development | Status and market relevance |
|---|---|
| In March 2024, Hanwha selected Bisalloy to supply steel for prototype Redback infantry fighting vehicles. | First local plate supply for the Redback program |
| In April 2024, the government set $330 billion for the Integrated Investment Program to 2033-34. | Raised the long-term outlook for armor and naval steel |
| In August 2024, the Armoured Vehicle Centre of Excellence near Geelong opened. | Will build Huntsman howitzers and 129 Redback vehicles |
| In October 2024, anti-dumping measures on certain quenched and tempered plate were continued. | Covered exports from Finland, Japan and Sweden |
| In July 2026, Bisalloy won a first order to supply HY80 steel for Virginia-class submarines. | First Australian-made steel for U.S. submarine construction |
Quenching, tempering and qualification shape plate supply
- Quenching and tempering lines heat plate and cool it rapidly before reheating, which sets the hardness and toughness of wear and armor grades.
- Normalizing furnaces refine the grain structure of pressure-vessel and structural plate, which improves toughness for welded equipment.
- Ballistic and hardness testing confirms that armor plate meets program limits, which supports qualification for vehicle and naval work.
- Overlay and cladding products such as Duroxite add hard surface layers to base plate, which extends life in extreme abrasion and impact.
Need a Custom Version of This Report?
Tailor the scope, geography, or segments to your exact requirements.
- Custom geography or segment scope
- Direct access to our analyst team
Local processing and imported brands compete on grade
Competition combines one local heat treater with imported branded grades sold through service centers. Bisalloy is the sole Australian industry member for quenched and tempered plate, according to the Anti-Dumping Commission, and it processes raw plate made by BlueScope at Port Kembla. Bisalloy also supplied steel for prototype Redback vehicles and won a first HY80 submarine steel order in 2026. SSAB sells Hardox wear plate, Hardox Wearparts services and Duroxite overlay products to Australian buyers, and Swedish exports face continued anti-dumping measures. Imports from Finland and Japan are also covered by those measures. Industeel and JFE Steel also make quenched and heat-treated grades, although their Australian activity could not be verified for this report. Rivals compete on hardness range, toughness, qualification records, delivery speed and cut-to-size processing.
Companies profiled and their roles in this market
| Company | Type | Role in the market |
|---|---|---|
| Bisalloy Steel Group | Local heat treater | Sole Australian producer of quenched and tempered plate |
| BlueScope Steel | Steelmaker | Makes raw plate in Australia for Bisalloy heat treatment |
| SSAB | Importer brand | Sells Hardox wear plate and Hardox Wearparts services |
Credence Research view on Australian quenched plate
Credence Research's view is that Australian demand for heat-treated plate will grow steadily because mines keep replacing wear parts while defense programs add a fast-growing armor segment. Wear plate remains the core of the market, while armor and naval grades gain share. A $330 billion defense investment program and new submarine steel orders give local processing a stronger base. However, mining cycles and import pricing will keep pressure on margins. Suppliers with qualified grades, local processing and service center reach should gain share fastest.
How the Australian plate estimate was built
The report uses 2025 as the base year on a calendar basis, and market values come from the Credence Research model. That model combines anti-dumping inquiry findings, resources export data, capital expenditure statistics, population statistics, World Bank manufacturing data, defense program releases and company announcements on supply contracts. Segment splits and regional growth rates are Credence Research estimates, while regional shares follow the client-defined split. Sources used are public reports, official statistics, trade press, government releases and company filings, and no interviews or surveys were used.
Wear parts and defense programs carry demand to 2035
Plate sales are expected to reach USD 518.0 million by 2035, a 4.65% CAGR during 2026–2035, as mine wear replacement, defense programs and equipment redesign keep demand rising. Growth should pick up from 2027 as Redback production scales and submarine steel orders build. After that, armor and naval grades will carry more growth as wear plate matures. A long mining downturn would lower this outlook, while faster naval shipbuilding would raise it. Suppliers with qualified grades and local processing are expected to gain the most.
Frequently Asked Questions
How big is the Australia heat-treated steel plates market?
Which product type leads quenched plate demand in Australia?
Which region leads the Australia heat-treated steel plates market?
Why is defense demand growing fastest?
What trade measures affect imported plate?
Which sales channel is growing fastest?
Who are the leading plate suppliers in Australia?
What are the main challenges for plate suppliers?
Table of Content
Chapter 1 Market Segmentation
- 1.1 Segmentation Framework
- 1.1.1 Product and Service Classification
- 1.1.2 Application and End-Use Classification
- 1.1.3 Technology and Solution Classification
- 1.1.4 Customer and Distribution Channel Classification
- 1.1.5 Geographic Segmentation
- 1.1.6 Market Segment Definitions and Boundaries
- 1.2 By Product Type
- 1.2.1 Abrasion-Resistant Plate
- 1.2.2 High-Strength Structural Plate
- 1.2.3 Pressure-Vessel Plate
- 1.2.4 Armour Plate
- 1.3 By End-Use Industry
- 1.3.1 Mining & Resources
- 1.3.2 Heavy Transport & Fabrication
- 1.3.3 Building & Construction
- 1.3.4 Energy & Infrastructure
- 1.3.5 Defence & Security
- 1.4 By Customer Type
- 1.4.1 Equipment Manufacturers
- 1.4.2 Fabrication Contractors
- 1.4.3 Asset Owner Maintenance Teams
- 1.4.4 Defence Prime Contractors
- 1.5 By Sales Channel
- 1.5.1 Stockholding Service Centres
- 1.5.2 Direct Producer Contracts
- 1.5.3 Project-Based Import Contracts
Chapter 2 Introduction
- 2.1 Report Objectives and Scope
- 2.2 Product Definition and Industry Terminology
- 2.3 Market Inclusions and Exclusions
- 2.4 Research Process
- 2.4.1 Primary Research and Expert Interviews
- 2.4.2 Secondary Research and Source Review
- 2.4.3 Top-Down and Bottom-Up Estimation
- 2.4.4 Data Triangulation and Verification
- 2.5 Market Size Measurement Basis
- 2.5.1 2025: USD 328.5 million → 2035: USD 518.0 million
- 2.6 Historical and Forecast Reference Periods
- 2.6.1 Historical Period: 2018-2025
- 2.6.2 Base Year: 2025
- 2.6.3 Forecast Period: 2025-2035
- 2.7 Research Assumptions and Limitations
Chapter 3 Executive Summary
- 3.1 Market Snapshot and Key Findings
- 3.2 Base-Year Market Size, 2025
- 3.3 Forecast Market Size, 2035
- 3.4 Revenue and Volume Growth Outlook
- 3.5 Key Demand and Supply Indicators
- 3.6 Leading Market Segments
- 3.7 Fastest-Growing Market Opportunities
- 3.8 Regional Performance Highlights
- 3.9 Technology and Industry Transformation
- 3.10 Competitive Landscape Summary
- 3.11 Analyst View and Strategic Implications
Chapter 4 Australia Heat-Treated Steel Plates Market Trends and Developments
- 4.1 Historical Industry Development, 2018-2025
- 4.2 Recent Market Trends and Developments
- 4.3 Demand and Customer Behavior Trends
- 4.4 Technology and Product Innovation
- 4.5 Artificial Intelligence, Automation and Digitalization
- 4.6 Local Manufacturing and Supply Chain Realignment
- 4.7 Industry Partnerships, Mergers and Acquisitions
- 4.8 Sustainability and Circular Economy Developments
- 4.9 Government and Private Sector Investment Trends
- 4.10 Emerging Business Models and Commercialization
- 4.11 Industry Developments and Announcements
Chapter 5 Australia Heat-Treated Steel Plates Market Production, Supply and Demand Analysis
- 5.1 Demand Trend and Consumption Analysis, 2018-2025
- 5.2 Demand Forecast, 2025-2035
- 5.3 Production and Output Trend, 2018-2025
- 5.4 Production and Output Forecast, 2025-2035
- 5.5 Installed Capacity and Capacity Utilization
- 5.6 Company-Wise Production Plants and Statistics
- 5.6.1 Installed Production Capacity
- 5.6.2 Actual Production
- 5.6.3 Planned Capacity and Expansion Targets
- 5.7 Supply Chain Structure and Procurement Trends
- 5.8 Supply-Demand Gap and Bottlenecks
- 5.9 Import Dependence and Sourcing Structure
- 5.10 Contract Manufacturing and Outsourcing
- 5.11 Regional Supply and Demand Concentration
Chapter 6 Australia Heat-Treated Steel Plates Market Pricing Analysis
- 6.1 Pricing Structure and Measurement
- 6.2 Historical Pricing Trends, 2018-2025
- 6.3 Pricing Outlook, 2025-2035
- 6.4 Average Selling Price and Unit Economics
- 6.5 Pricing by Product and Market Segment
- 6.6 Geographic Pricing Differences
- 6.7 Key Input, Energy, Labor and Logistics Costs
- 6.8 Contract Pricing and Purchasing Models
- 6.9 Pricing Sensitivity and Competitive Positioning
- 6.10 Price, Margin and Profitability Implications
Chapter 7 Australia Heat-Treated Steel Plates Market Dynamics
- 7.1 Market Growth Drivers
- 7.1.1 Demand-Side Drivers
- 7.1.2 Technology and Innovation Drivers
- 7.1.3 Infrastructure and Investment Drivers
- 7.1.4 Regulatory and Policy Drivers
- 7.2 Market Restraints
- 7.2.1 Cost and Affordability Constraints
- 7.2.2 Technology and Adoption Barriers
- 7.2.3 Supply Chain and Operational Constraints
- 7.3 Market Challenges
- 7.3.1 Competitive Pressure and Margin Erosion
- 7.3.2 Skills, Infrastructure and Implementation Gaps
- 7.4 Emerging Market Opportunities
- 7.5 Market Dynamics Impact and Time-Horizon Assessment
Chapter 8 Australia Heat-Treated Steel Plates Value Chain Analysis
- 8.1 Industry Value Chain Overview
- 8.2 Upstream Suppliers and Critical Inputs
- 8.3 Technology and Component Providers
- 8.4 Manufacturing or Service Delivery
- 8.5 Distribution, Channel Partners and Integrators
- 8.6 Downstream Applications and End Users
- 8.7 Value Addition and Profit Pools
- 8.8 Vertical Integration and Outsourcing
- 8.9 Supplier Concentration and Risk
- 8.10 Supply Chain Localization and Resilience
Chapter 9 Australia Heat-Treated Steel Plates Market Regulations and Policies
- 9.1 Relevant Laws, Standards and Compliance Frameworks
- 9.2 Product, Service, Safety and Quality Requirements
- 9.3 Government Policies, Incentives and Subsidies
- 9.4 Imports, Exports and Trade Barriers
- 9.5 Public Procurement and Local Content Requirements
- 9.6 Environmental and Sustainability Compliance
- 9.7 Upcoming Policy Changes and Market Implications
Chapter 10 Australia Heat-Treated Steel Plates Market Hotspots and Opportunities
- 10.1 Market Opportunity Mapping and Growth Hotspots
- 10.2 High-Growth Applications and Customer Groups
- 10.3 Underserved Markets and White-Space Opportunities
- 10.4 Emerging Technology and Product Opportunities
- 10.5 New Capacity and Investment Hotspots
- 10.6 Market Entry and Expansion Opportunities
- 10.7 Distribution and Partnership Opportunities
- 10.8 Near-Term and Long-Term Commercial Potential
- 10.9 Opportunity Attractiveness and Execution Risks
Chapter 11 Australia Heat-Treated Steel Plates Market Outlook, 2025-2035
- 11.1 Market Size and Analysis
- 11.1.1 Revenue (Market Measurement: 2025: USD 328.5 million → 2035: USD 518.0 million)
- 11.1.2 Market Volume and Quantity Sold
- 11.1.3 Historical Market Size, 2018-2025
- 11.1.4 Base-Year Market Size, 2025
- 11.2 Market Forecast, 2025-2035
- 11.2.1 Revenue Forecast to 2035
- 11.2.2 Volume Forecast to 2035
- 11.2.3 CAGR and Year-on-Year Growth
- 11.2.4 Incremental Revenue Opportunity
- 11.3 Forecast Assumptions and Scenario Analysis
- 11.3.1 Base-Case Forecast
- 11.3.2 Optimistic and Conservative Scenarios
- 11.3.3 Technology, Pricing and Policy Sensitivities
- 11.4 Market Attractiveness and Growth Outlook
Chapter 12 Australia Heat-Treated Steel Plates Market Segmentation and Outlook
- 12.1 Segmentation Summary and Market Shares, 2025
- 12.2 Largest and Fastest-Growing Segments
- 12.3 By Product Type - Market Size and Forecast, 2025-2035
- 12.3.1 Segment Definition and Scope
- 12.3.2 Historical Market Size, 2018-2025
- 12.3.3 Revenue Forecast, 2025-2035
- 12.3.4 Volume Forecast, 2025-2035
- 12.3.5 Base-Year Market Share, 2025
- 12.3.6 Segment CAGR and Growth Drivers
- 12.3.7 Subsegment Market Size and Forecast
- 12.3.7.1 Abrasion-Resistant Plate
- 12.3.7.2 High-Strength Structural Plate
- 12.3.7.3 Pressure-Vessel Plate
- 12.3.7.4 Armour Plate
- 12.3.8 Subsegment Pricing and Adoption Trends
- 12.3.9 Leading Suppliers and Competition
- 12.3.10 Regional Demand and Opportunities
- 12.4 By End-Use Industry - Market Size and Forecast, 2025-2035
- 12.4.1 Segment Definition and Scope
- 12.4.2 Historical Market Size, 2018-2025
- 12.4.3 Revenue Forecast, 2025-2035
- 12.4.4 Volume Forecast, 2025-2035
- 12.4.5 Base-Year Market Share, 2025
- 12.4.6 Segment CAGR and Growth Drivers
- 12.4.7 Subsegment Market Size and Forecast
- 12.4.7.1 Mining & Resources
- 12.4.7.2 Heavy Transport & Fabrication
- 12.4.7.3 Building & Construction
- 12.4.7.4 Energy & Infrastructure
- 12.4.7.5 Defence & Security
- 12.4.8 Subsegment Pricing and Adoption Trends
- 12.4.9 Leading Suppliers and Competition
- 12.4.10 Regional Demand and Opportunities
- 12.5 By Customer Type - Market Size and Forecast, 2025-2035
- 12.5.1 Segment Definition and Scope
- 12.5.2 Historical Market Size, 2018-2025
- 12.5.3 Revenue Forecast, 2025-2035
- 12.5.4 Volume Forecast, 2025-2035
- 12.5.5 Base-Year Market Share, 2025
- 12.5.6 Segment CAGR and Growth Drivers
- 12.5.7 Subsegment Market Size and Forecast
- 12.5.7.1 Equipment Manufacturers
- 12.5.7.2 Fabrication Contractors
- 12.5.7.3 Asset Owner Maintenance Teams
- 12.5.7.4 Defence Prime Contractors
- 12.5.8 Subsegment Pricing and Adoption Trends
- 12.5.9 Leading Suppliers and Competition
- 12.5.10 Regional Demand and Opportunities
- 12.6 By Sales Channel - Market Size and Forecast, 2025-2035
- 12.6.1 Segment Definition and Scope
- 12.6.2 Historical Market Size, 2018-2025
- 12.6.3 Revenue Forecast, 2025-2035
- 12.6.4 Volume Forecast, 2025-2035
- 12.6.5 Base-Year Market Share, 2025
- 12.6.6 Segment CAGR and Growth Drivers
- 12.6.7 Subsegment Market Size and Forecast
- 12.6.7.1 Stockholding Service Centres
- 12.6.7.2 Direct Producer Contracts
- 12.6.7.3 Project-Based Import Contracts
- 12.6.8 Subsegment Pricing and Adoption Trends
- 12.6.9 Leading Suppliers and Competition
- 12.6.10 Regional Demand and Opportunities
- 12.7 Segment Growth Comparison
- 12.8 Segment Attractiveness and Priority Matrix
Chapter 13 Australia Heat-Treated Steel Plates End-Use and Application Market Outlook
- 13.1 End-Use Industry and Customer Demand Structure
- 13.2 Leading Applications and Customer Groups
- 13.3 End-Use Market Size, Share and Forecast
- 13.4 Major End-Use Industry Deep Dives
- 13.4.1 Customer Requirements and Use Cases
- 13.4.2 Demand and Replacement Cycles
- 13.4.3 Technical and Regulatory Considerations
- 13.4.4 Purchasing and Procurement Models
- 13.4.5 Leading Vendors and Distribution Channels
- 13.4.6 Forecast and Commercial Opportunities
- 13.5 Emerging Applications and Cross-Segment Demand
- 13.6 End-Use Industry Investment Priorities
Chapter 14 Australia Heat-Treated Steel Plates Geographic Market Outlook, 2025-2035
- 14.1 Domestic Market Distribution and Demand Clusters
- 14.2 State- or Province-Wise Market Size and Forecast, 2025-2035
- 14.3 City and Metropolitan Market Outlook
- 14.4 Industrial, Manufacturing and Commercial Clusters
- 14.5 Geographic Concentration of Key End Users
- 14.6 Local Pricing and Purchasing Differences
- 14.7 Domestic Production Facilities and Capacity Map
- 14.8 Local Infrastructure and Project Pipeline
- 14.9 State-Level Policy and Incentive Differences
- 14.10 Subnational Investment Hotspots and Opportunities
- 14.11 Distribution and Logistics Networks
- 14.12 Domestic Competitive Footprint
Chapter 15 Australia Heat-Treated Steel Plates Technology, Innovation and Sustainability Outlook
- 15.1 Technology Landscape and Maturity
- 15.2 Product, Process and Service Innovation
- 15.3 AI, Automation and Digital Tools in the Industry
- 15.4 Technology Adoption and Performance Benchmarking
- 15.5 Innovation Pipeline and R&D Investment
- 15.6 Patent and Intellectual Property Trends
- 15.7 Energy Efficiency and Resource Management
- 15.8 Sustainability, Recycling and Circularity
- 15.9 Technology Roadmap, 2025-2035
- 15.10 Risks of Obsolescence and Technology Substitution
Chapter 16 Australia Heat-Treated Steel Plates Market Key Strategic Imperatives
- 16.1 Growth and Market Entry Priorities
- 16.2 High-Return Products and Segments
- 16.3 Pricing, Profitability and Cost Optimization
- 16.4 Technology Investment and Product Differentiation
- 16.5 Supply Chain Localization and Resilience
- 16.6 Distribution and Customer Acquisition
- 16.7 Partnership, Acquisition and Capacity Strategy
- 16.8 Regional Expansion Priorities
- 16.9 Short-, Medium- and Long-Term Actions
Chapter 17 Competition Outlook
- 17.1 Industry Competition Characteristics
- 17.2 Market Structure and Concentration
- 17.3 Market Share and Competitive Positioning, 2025
- 17.4 Company-Wise Revenue and Product Benchmarking
- 17.5 Production and Service Capacity Benchmarking
- 17.6 Technology, Pricing and Differentiation
- 17.7 Regional Footprint and Distribution Strength
- 17.8 Mergers, Acquisitions and Strategic Alliances
- 17.9 New Entrants and Competitive Threats
- 17.10 Porter's Five Forces and Industry Attractiveness
- 17.11 Competitive Outlook, 2025-2035
Chapter 18 Company Profiles
- 18.1 Company Coverage and Selection Criteria
- 18.2 BlueScope Steel
- 18.2.1 Business Description
- 18.2.2 Company Ownership and Geographic Presence
- 18.2.3 Product and Service Portfolio
- 18.2.4 Manufacturing and Operating Footprint
- 18.2.5 Production Capacity and Expansion Plans
- 18.2.6 Financial Performance and Investment
- 18.2.7 Market Share and Competitive Position
- 18.2.8 Technology and Innovation Capabilities
- 18.2.9 Strategic Alliances or Partnerships
- 18.2.10 Recent Developments
- 18.2.11 Growth Strategy and Outlook
- 18.3 Bisalloy Steel Group
- 18.4 SSAB
- 18.5 JFE Steel
- 18.6 Industeel
- 18.7 Other Relevant Market Participants
Note: Every listed company is profiled on the structure shown under the first company. The company list is preliminary and may change based on research findings, market developments, data availability and client requirements.
Chapter 19 Disclaimer
- 19.1 Research and Forecast Disclaimer
- 19.2 Data Source and Estimation Limitations
Note: The depth of individual sections depends on data availability for this market. Volume, capacity, trade and other unit-based metrics are included where applicable.

