
Aluminum Honeycomb Market Overview:
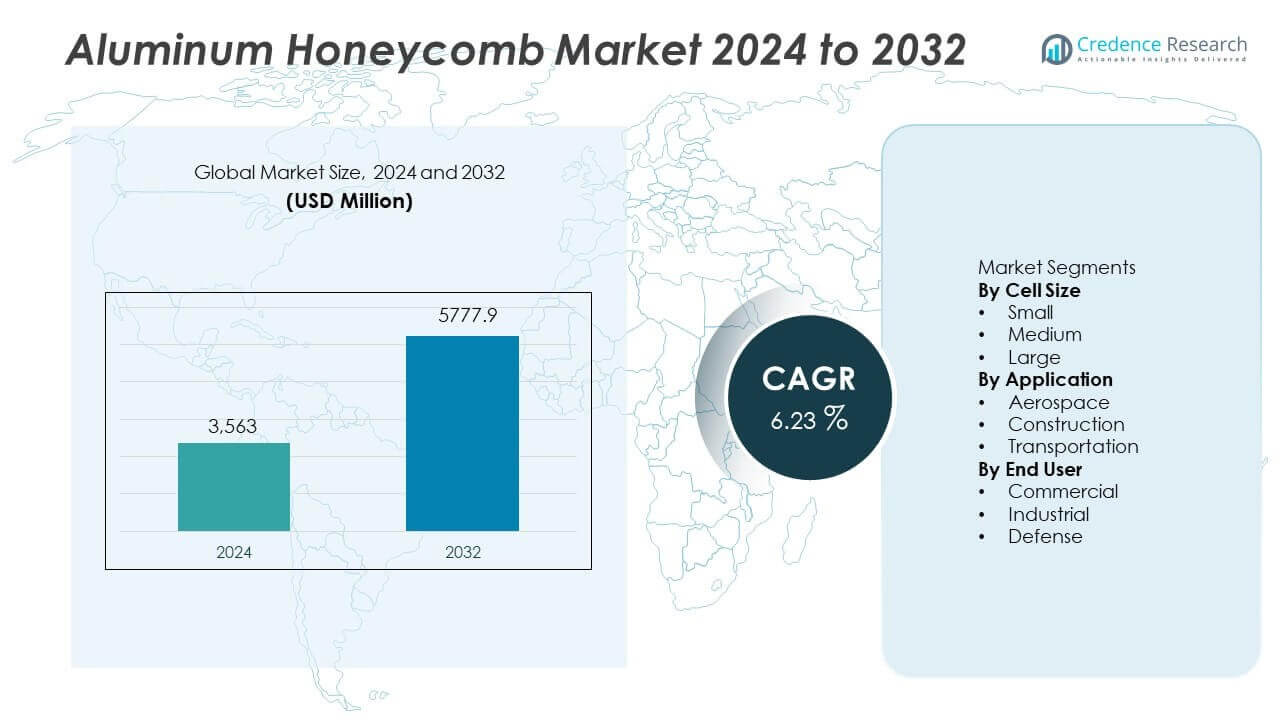
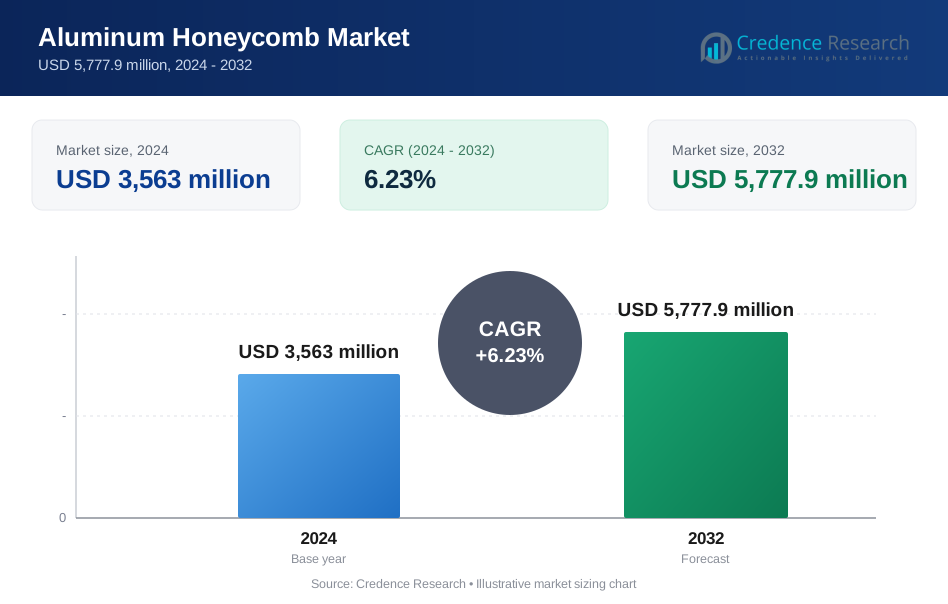
The Aluminum Honeycomb market size stood at USD 3,563 million in 2024, and the value is projected to reach USD 5,777.9 million by 2032, reflecting a CAGR of 6.23% during the forecast period.
| REPORT ATTRIBUTE | DETAILS |
|---|---|
| Historical Period | 2020-2023 |
| Base Year | 2024 |
| Forecast Period | 2025-2032 |
| Aluminum Honeycomb Market Size 2024 | USD 3,563 million |
| Aluminum Honeycomb Market, CAGR | 6.23% |
| Aluminum Honeycomb Market Size 2032 | USD 5,777.9 million |
Aluminum Honeycomb Market Insights
- Strong demand for lightweight materials in aerospace, transport, and construction drives growth, led by small cell size with 46% share in 2024 due to strength, low weight, and design flexibility.
- Key trends include sustainable and recyclable core solutions, precision manufacturing, and customized panel formats, helping raise product performance and open new uses.
- Competitive activity remains steady as major players expand automation, bonding quality, and regional supply networks to support faster delivery and secure contracts in high-value sectors.
- North America leads with 36% share in 2024, followed by Europe at 30% and Asia Pacific at 27%, supported by aerospace expansion, construction upgrades, and transport fleet growth across these regions.
Aluminum Honeycomb Market Segmentation Analysis:
By Cell Size
Small cell size leads this segment with 46% share in 2024, supported by strong demand for lightweight structural panels in aerospace and transport systems. These cells offer high strength-to-weight ratio, energy absorption, and improved design flexibility. Medium cell size follows due to wider use in building panels and machinery parts. Large cell size finds use in marine and industrial insulation structures. Users prefer small cells to reduce total system weight and improve fuel use, while makers enhance core stability and fire safety to support wider adoption across compact and complex structures.
- For instance, Hexcel reports aluminum honeycomb cores with cell sizes under 3.2 mm used on aircraft flooring systems that deliver compressive strengths above 5.5 MPa at a density of 64 kg/m³.
By Application
Aerospace holds 52% share in 2024, driven by high use in aircraft floors, wings, partitions, and control surfaces. Lightweight cores help cut fuel use and improve payload capacity. Construction follows due to demand for façade panels, interiors, and cleanroom structures. Transportation expands with rising use in rail, road, and marine segments. Aerospace users value aluminum honeycomb for strength, corrosion resistance, and thermal stability. Strong growth in commercial and defense aviation keeps aerospace in the lead, supported by certification standards and rising aircraft output.
- For instance, Airbus utilizes advanced honeycomb sandwich panels on the A350 XWB to optimize structural mass and enhance fuel efficiency.
By End User
Commercial end users lead with 58% share in 2024, driven by use in civil aircraft, building panels, rail coaches, and marine vessels. The segment values low weight, durability, and design flexibility. Industrial users adopt aluminum honeycomb for machinery, cold storage units, and equipment housing. Defense users increase intake for aircraft, naval platforms, and advanced structures. Commercial growth stays strong as makers improve production scale and cost control. Higher demand for energy-efficient transport and sustainable building materials supports continued lead in commercial applications.
Key Growth Drivers
Rising Demand for Lightweight Materials
Aerospace, transport, and building sectors seek lighter materials to reduce fuel use and structural load. Aluminum honeycomb offers high strength-to-weight ratio, thermal stability, and corrosion resistance, leading to wider adoption. Aircraft floors, rail interiors, and façade panels use the material to enhance durability and improve performance. Makers invest in new grades and faster production to meet growing orders. Strong sustainability goals and rising fuel cost support the long-term shift toward lightweight cores.
- For instance, Plascore reports aluminum honeycomb panels used in rail interiors with panel densities near 56 kg/m³ and compressive strengths reaching 5.1 MPa, lowering carriage weight by 280 kg per car.
Expansion in Aerospace and Defense Production
Growth in new aircraft builds and defense platforms boosts demand for strong, consistent core materials. Aluminum honeycomb provides high structural support, fire safety, and energy absorption needed in flight and naval systems. Upgrades to fleets and rising cargo and passenger traffic shape higher intake. Makers expand certified product lines and testing to meet strict standards. This driver supports premium pricing and long-term supply contracts across global OEM networks.
- For instance, Euro-Composites supplies aerospace panels tested to meet FAR 25.853 flammability criteria, reaching shear strengths above 1.5 MPa on 6.35 mm core thickness used in wing and partition assemblies.
Increasing Use in Modern Construction Systems
Advanced building designs adopt aluminum honeycomb for façades, ceilings, and cleanroom panels due to fire safety, rigidity, and low maintenance needs. Developers target efficient, high-performance structures with precise tolerances and fast installation. The material helps reduce overall building weight and improve thermal control. Demand rises in commercial, industrial, and public-use buildings. Growing interest in modular and prefabricated systems supports higher usage across regions.
Key Trends and Opportunities
Growth of Sustainable and Recyclable Core Materials
Sustainability targets push users to select recyclable and low-emission materials. Aluminum honeycomb fits these goals with a recyclable metal base and long service life. Makers promote greener sourcing and optimize scrap recovery. Users in transport and construction consider the material for lifecycle gains and compliance. This trend opens opportunities for low-carbon alloys and thin-gauge cores that maintain high strength.
- For instance, Alucoil reports aluminum honeycomb panel recycling rates near 95% through closed-loop scrap recovery systems that process more than 1,200 tons each year.
Advances in Manufacturing and Customization
Automation, bonding upgrades, and precision cutting improve output quality and lower scrap. Customized cell sizes and panel formats help match complex aerospace and transport needs. Digital design models speed development and reduce weight. These advances enhance durability and allow broader design use. Makers leverage these gains to serve niche roles and expand global reach.
- For instance, Corex Honeycomb uses laser-cutting lines that produce over 6,000 m² of custom core per day with dimensional tolerances below 0.2 mm.
Key Challenges
High Production and Material Costs
Aluminum honeycomb production involves precise forming, bonding, and quality checks, driving higher cost than basic metal sheets. Users weigh performance benefits against budget limits, especially in price-sensitive sectors. Raw material price swings add risk. Cost pressure slows uptake in lower-value building and industrial roles. Makers must improve scale and reduce waste to support wider use.
Certification and Performance Compliance
Aerospace and defense markets require strict testing and documentation, raising entry barriers and lead times. Any deviation in bonding or geometry affects structural integrity. These demands limit supplier options and add cost. Meeting global standards requires sustained investment in labs, audits, and traceability. Compliance pressure shapes supply stability and slows rapid product change.
Regional Analysis
North America
North America holds 36% share in 2024, driven by strong aerospace and construction demand. Plane makers use aluminum honeycomb to cut weight and improve fuel use. Builders adopt panels for façades and interior walls. Long-term air travel growth and steady public projects support future intake. Firms invest in recycling and thin-gauge cores, helping shape product range.
Europe
Europe accounts for 30% share in 2024, backed by strict energy and safety rules. Aerospace and rail fleets upgrade interiors and floors to cut weight. Builders add honeycomb panels to improve fire safety and reduce load. Strong focus on green buildings boosts intake in façades and ceilings. Regional R&D helps improve bonding and surface finish.
Asia Pacific
Asia Pacific holds 27% share in 2024, led by China, Japan, and India. Air fleets expand, and transport networks grow fast across rail and road. Builders choose lightweight panels to shorten install times and lower cost. Local producers scale output and widen cell size options. Rising urban projects and export growth drive future gains.
Latin America
Latin America captures 4% share in 2024, supported by transport and public works. Users adopt honeycomb cores to improve durability and reduce maintenance. Aircraft service sites grow across key hubs, lifting intake for interior parts. Builders test lightweight panels in airports and civic sites. Currency swings and limited supply slow wider use.
Middle East & Africa
Middle East & Africa represent 3% share in 2024, driven by major builds. Airports, rail links, and civic centers use lightweight panels to reduce load. Aerospace service zones grow in Gulf states, lifting demand for interior parts. Defense and marine roles show early interest. Limited local supply keeps imports in lead, yet long-term plans support growth.
Aluminum Honeycomb Market Segmentations:
By Cell Size
- Small
- Medium
- Large
By Application
- Aerospace
- Construction
- Transportation
By End User
- Commercial
- Industrial
- Defense
By Geography
- North America
- U.S.
- Canada
- Mexico
- Europe
- Germany
- France
- U.K.
- Italy
- Spain
- Rest of Europe
- Asia Pacific
- China
- Japan
- India
- South Korea
- South-east Asia
- Rest of Asia Pacific
- Latin America
- Brazil
- Argentina
- Rest of Latin America
- Middle East & Africa
- GCC Countries
- South Africa
- Rest of the Middle East and Africa
Competitive Landscape
Competitive landscape features key companies including Hexcel Corporation, Euro-Composites S.A., The Gill Corporation, Corex Honeycomb, Plascore Incorporated, Honeylite, Toray Advanced Composites, Alucoil, Argosy International Inc., and Pacific Panels Inc. These companies focus on aluminum honeycomb cores and panels tailored to aerospace, transport, and building sectors. They invest in automation, advanced bonding, and precision cutting to enhance consistency and production scale. Partnerships with aircraft OEMs, construction firms, and transport suppliers help secure long-term contracts. Firms expand product grades, fire-safe solutions, and recyclable formats to meet higher safety and sustainability expectations. Many players grow regional service and distribution networks to support fast delivery and technical support. Competitive analysis shows rising differentiation through cell optimization, surface treatments, and customized panel systems. Industry leaders also target cost control and higher throughput while exploring new aerospace and building programs.
Key Player Analysis
- Hexcel Corporation
- Euro-Composites S.A.
- The Gill Corporation
- Corex Honeycomb
- Plascore Incorporated
- Honeylite
- Toray Advanced Composites
- Alucoil
- Argosy International Inc.
- Pacific Panels Inc.
Recent Developments
- In April 2025, HONYLITE was noted as a key manufacturer of laminated aluminum honeycomb panels, serving industrial and architectural sectors.
- In 2025, Alucoil achieved “Zero Waste” sustainability certification with a valuation of 98.83%, positioning it as a leader in eco-friendly aluminum sector practices.
- In January 2024, Plascore, Inc. introduced fire-resistant aluminum honeycomb panels designed for commercial aircraft interiors to improve safety and regulatory compliance.
Report Coverage
The research report offers an in-depth analysis based on Cell Size, Application, End User and Geography. It details leading market players, providing an overview of their business, product offerings, investments, revenue streams, and key applications. Additionally, the report includes insights into the competitive environment, SWOT analysis, current market trends, as well as the primary drivers and constraints. Furthermore, it discusses various factors that have driven market expansion in recent years. The report also explores market dynamics, regulatory scenarios, and technological advancements that are shaping the industry. It assesses the impact of external factors and global economic changes on market growth. Lastly, it provides strategic recommendations for new entrants and established companies to navigate the complexities of the market.
Future Outlook
- Demand will rise as users replace heavier materials in core structures.
- Aerospace growth will support wider use in interior and flight surfaces.
- Construction uptake will expand with façade and cleanroom panels.
- Transport roles will increase in rail, marine, and commercial vehicles.
- Cell and panel customization will grow to match design needs.
- Automation gains will cut cost and improve forming accuracy.
- Recycling focus will lift interest in low-carbon and reusable cores.
- Regional supply networks will expand to reduce lead time.
- Certification strength will help secure long-term aerospace contracts.
- Product innovation will improve fire safety, rigidity, and durability.
Request a Free Sample
Fill in your details and we'll send you a free sample report.
- Sample data tables & charts
- Research methodology
Need a Custom Version of This Report?
Tailor the scope, geography, or segments to your exact requirements.
- Custom geography or segment scope
- Direct access to our analyst team
Frequently Asked Questions
What is the current market size for Aluminum Honeycomb market, and what is its projected size in 2032?
At what Compound Annual Growth Rate is the Aluminum Honeycomb market projected to grow between 2024 and 2032?
Which Aluminum Honeycomb market segment held the largest share in 2024?
What are the primary factors fueling the growth of the Aluminum Honeycomb market?
Who are the leading companies in the Aluminum Honeycomb market?
Which region commanded the largest share of the Aluminum Honeycomb market in 2024?
Table of Content
Chapter 1. Report Introduction
- 1.1 Report Description & Purpose
- 1.1.1 Report Title & Market Definition
- 1.1.2 Unique Selling Propositions (USP) & Key Differentiators
- 1.1.3 Value Proposition for Stakeholders
- 1.2 Research Objectives
- 1.2.1 Market Sizing Objectives (Volume & Revenue)
- 1.2.2 Segmentation Objectives
- 1.2.3 Competitive Intelligence Objectives
- 1.2.4 Forecast & Scenario Objectives
- 1.3 Report Scope
- 1.3.1 Aluminum Honeycomb Scope – Types & Subtypes Covered
- 1.3.2 Geographic Scope – Regions & Countries Covered
- 1.3.3 Historical Period, Base Year & Forecast Period (2024; forecast to 2032)
- 1.3.4 Inclusions & Exclusions
- 1.4 HS Code & Classification Framework
- 1.5 Currency, Units & Pricing Basis
- 1.6 Target Stakeholders
- 1.7 Limitations & Assumptions
Chapter 2. Executive Summary
- 2.1 Global Aluminum Honeycomb Market Snapshot
- 2.1.1 Market Size – Historical (2024) & Forecast (2024-2032) (2024: USD 3,563 million → 2032: USD 5,777.9 million)
- 2.1.2 Volume & Revenue – Global Totals
- 2.1.3 Key Market Highlights – Top Five Facts
- 2.2 Aluminum Honeycomb Market Segmentation Snapshot
- 2.2.1 Market Split by Region – 2024 vs. 2032
- 2.3 Competitive Snapshot
- 2.3.1 Top 10 Players by Revenue Share – 2024
- 2.3.2 Top 10 Players by Volume Share – 2024
- 2.3.3 Recent Strategic Developments (18-Month Summary)
- 2.4 Key Investment Highlights & Strategic Conclusions
Chapter 3. Aluminum Honeycomb Market Dynamics & Industry Analysis
- 3.1 Market Overview & Context
- 3.1.1 Aluminum Honeycomb Market Position in the Broader Automotive Value Chain
- 3.1.2 OEM vs. Replacement Market Dynamics
- 3.1.3 Market Maturity & Development Stage by Region
- 3.2 Aluminum Honeycomb Market Drivers
- 3.3 Aluminum Honeycomb Market Restraints & Challenges
- 3.4 Aluminum Honeycomb Market Opportunities
- 3.5 Porter's Five Forces Analysis
- 3.5.1 Threat of New Entrants
- 3.5.2 Bargaining Power of Suppliers
- 3.5.3 Bargaining Power of Buyers
- 3.5.4 Threat of Substitutes
- 3.5.5 Competitive Rivalry – Intensity Assessment
- 3.6 Aluminum Honeycomb Value Chain Analysis
- 3.6.1 Upstream – Raw Material/Input Suppliers
- 3.6.1.1 Raw Material/Input 1
- 3.6.1.2 Raw Material/Input 2
- 3.6.1.3 Raw Material/Input 3
- 3.6.2 Midstream – Production/Manufacturing/Service Delivery
- 3.6.2.1 Production/Process Overview
- 3.6.2.2 Key Facility Locations & Capacity by Manufacturer
- 3.6.3 Downstream – Distribution & End Consumer
- 3.6.3.1 Primary Channel – B2B/OEM
- 3.6.3.2 Secondary Channels – Dealer, Retail, Online, Direct
- 3.6.4 Value Chain Profitability Analysis
- 3.6.1 Upstream – Raw Material/Input Suppliers
- 3.7 PESTEL Analysis
- 3.7.1 Political Factors
- 3.7.2 Economic Factors
- 3.7.3 Social Factors
- 3.7.4 Technological Factors
- 3.7.5 Environmental Factors
- 3.7.6 Legal Factors
- 3.8 Aluminum Honeycomb Supply Chain Analysis
- 3.8.1 Raw Material/Input Supply Risk Assessment
- 3.8.2 Manufacturing Concentration Risk (Geographic Exposure)
- 3.8.3 Trade Disruption Impact Analysis
- 3.9 Regulatory & Policy Landscape
Note: The regulatory and policy landscape section covers regulations based on their applicability to the market, Aluminum Honeycomb category, geography, and scope of the study. Only regulatory frameworks with a material impact on operations, compliance, trade, sustainability, or market access are analyzed in detail.
Chapter 4. Key Investment Pockets & Opportunity Analysis
- 4.1 Aluminum Honeycomb Market Attractiveness Analysis
- 4.1.1 By Region – Investment Attractiveness Matrix (Volume × CAGR)
- 4.2 Absolute Revenue Growth Opportunity
- 4.2.1 By Region – Absolute USD Growth Through 2032
- 4.3 Incremental Volume Opportunity
- 4.3.1 By Region – Incremental Volume Through 2032
- 4.3.2 Segment – Incremental Volume
- 4.4 Emerging Submarket Opportunity Deep Dive (Subject to Applicability)
- 4.5 Emerging Market Opportunity Scorecards
- 4.5.1 United States
- 4.5.2 Europe
- 4.5.3 Asia
- 4.5.4 Middle East & Africa
Note: Emerging Market Opportunity Scorecards will be included based on relevance and strategic importance. Regions listed are indicative and may vary depending on data availability and market dynamics.
Chapter 5. Aluminum Honeycomb Import-Export Analysis & Trade Flows
- 5.1 Global Trade Overview
- 5.1.1 Global Export Value by Country (2024)
- 5.1.2 Global Export Volume by Country (2024)
- 5.1.3 Global Import Value by Country (2024)
- 5.1.4 Global Import Volume by Country (2024)
- 5.1.5 Net Trade Balance by Country (2024)
- 5.2 Export Analysis – Segment
- 5.2.1 Type 1 (HS Code)
- 5.2.2 Type 2 (HS Code)
- 5.2.3 Type 3 (HS Code)
- 5.2.4 Type 4 (HS Code)
- 5.2.5 Type 5 (HS Code)
- 5.3 Import Analysis – Segment
- 5.3.1 Type 1 (HS Code)
- 5.3.2 Type 2 (HS Code)
- 5.3.3 Type 3 (HS Code)
- 5.3.4 Type 4 (HS Code)
- 5.3.5 Type 5 (HS Code)
- 5.4 Average Unit Trade Prices
- 5.4.1 Average Export Price – Segment & Country
- 5.4.2 Average Import Price – Segment & Source Country
- 5.4.3 Price Trends (2024)
- 5.5 Key Trade Route Analysis
- 5.5.1 Trade Route 1
- 5.5.2 Trade Route 2
- 5.5.3 Trade Route 3
- 5.5.4 Trade Route 4
- 5.5.5 Trade Route 5
- 5.6 Trade Policy Impact Assessment
- 5.6.1 US Anti-Dumping & Section 301 Tariffs
- 5.6.2 EU Customs Union Impact
- 5.6.3 Major Free Trade Agreements
- 5.6.4 USMCA Rules of Origin
Note: Trade policy analysis will be included only where relevant to the Aluminum Honeycomb market.
Chapter 6. Competitive Landscape & Company Benchmarking
- 6.1 Aluminum Honeycomb Market Concentration & Structure
- 6.1.1 Herfindahl-Hirschman Index (HHI) – vs. 2024
- 6.1.2 Tier 1, Tier 2 & Tier 3 Market Structure
- 6.1.3 Global, Regional & Local Player Dynamics
- 6.2 Aluminum Honeycomb Market Share Analysis – 2024
- 6.2.1 Global Revenue Share by Company
- 6.2.2 Global Volume Share by Company
- 6.2.3 Regional Revenue Share
- 6.2.4 Market Share Evolution ( vs. 2024)
- 6.2.5 OEM Segment Share by Company
- 6.2.6 Replacement Segment Share by Company
- 6.3 Production/Delivery Capacity & Facility Analysis
- 6.3.1 Global Installed Capacity
- 6.3.2 Capacity Utilization Rates
- 6.3.3 Production/Output Volume
- 6.3.4 Facility Locations & Capacity Map
- 6.3.5 Planned Capacity Additions
- 6.4 Aluminum Honeycomb Competitive Benchmarking Matrix
- 6.4.1 Revenue, Volume, CAGR & Profitability Comparison
- 6.4.2 Channel Revenue Mix
- 6.4.3 Geographic Revenue Exposure
- 6.4.4 R&D Intensity
- 6.4.5 Sustainability Maturity
- 6.5 Strategic Developments in Aluminum Honeycomb (Last 24 Months)
- 6.5.1 Mergers, Acquisitions & Divestments
- 6.5.2 New Aluminum Honeycomb Launches
- 6.5.3 Facility Expansions
- 6.5.4 Strategic Alliances, Joint Ventures & Partnerships
- 6.5.5 Distribution Expansion & Market Entry
- 6.5.6 Sustainability & ESG Initiatives
- 6.6 Competitive Strategy Mapping
- 6.6.1 Leader, Challenger, Follower & Niche Classification
- 6.6.2 Pricing Strategy Comparison
- 6.6.3 Channel Strategy Matrix
Note: Strategic developments are included based on their materiality and the availability of reliable information.
Chapter 7. Global Aluminum Honeycomb Market – By Distribution Channel
- 7.1 Segment Overview
- 7.1.1 Volume & Revenue Split by Channel (2024 & 2032)
- 7.1.2 Channel Mix Evolution (2024-2032)
Chapter 8. Regional Market Analysis – Global Overview
- 8.1 Global Regional Overview
- 8.1.1 Regional Volume Share
- 8.1.2 Regional Revenue Share
- 8.1.3 Regional Volume by Region
- 8.1.4 Regional Revenue by Region
- 8.1.5 Regional Forecast Through 2032
- 8.2 Cross-Regional Segment Analysis
- 8.2.1 By Distribution Channel
- 8.2.2 By Brand/Price Tier
Chapter 9. North America Aluminum Honeycomb Market
- 9.1 United States
- 9.2 Canada
- 9.3 Mexico
Chapter 10. Europe Aluminum Honeycomb Market
- 10.1 Germany
- 10.2 France
- 10.3 Italy
- 10.4 United Kingdom
- 10.5 Spain
- 10.6 Poland
- 10.7 Russia
- 10.8 Netherlands
- 10.9 Belgium
- 10.10 Sweden
- 10.11 Denmark
- 10.12 Norway
- 10.13 Rest of Europe
Chapter 11. Asia Pacific Aluminum Honeycomb Market
- 11.1 China
- 11.2 India
- 11.3 Japan
- 11.4 South Korea
- 11.5 Thailand
- 11.6 Indonesia
- 11.7 Vietnam
- 11.8 Malaysia
- 11.9 Australia
- 11.10 Rest of Asia Pacific
Chapter 12. Latin America Aluminum Honeycomb Market
- 12.1 Brazil
- 12.2 Argentina
- 12.3 Colombia
- 12.4 Chile
- 12.5 Rest of Latin America
Chapter 13. Middle East Aluminum Honeycomb Market
- 13.1 Saudi Arabia
- 13.2 United Arab Emirates
- 13.3 Turkey
- 13.4 Israel
- 13.5 Iran
- 13.6 Rest of the Middle East
Chapter 14. Africa Aluminum Honeycomb Market
- 14.1 South Africa
- 14.2 Egypt
- 14.3 Nigeria
- 14.4 Morocco
- 14.5 Rest of Africa
Chapter 15. Aluminum Honeycomb Company Profiles
- 15.1 [Company 01]
- 15.1.1 Company Overview
- 15.1.2 Key Management Personnel
- 15.1.3 Products & Services Portfolio
- 15.1.4 Financial Performance
- 15.1.5 Key Market Focus & Geographic Presence
- 15.1.6 Recent Developments & Strategic Initiatives
Note: The company profile list is preliminary and may change based on research findings, market developments, data availability, and client requirements.
Chapter 16. Appendices
- Appendix A – List of Abbreviations & Acronyms
- Appendix B – Industry Classification Code Reference – Full Series
- Appendix C – Production & Capacity Data Tables
- Appendix D – End-Use & Demand Base Tables
- Appendix E – Consumption & Replacement Rate Assumptions
- Appendix F – ASP Reference Tables
- Appendix G – Manufacturing & Facility Database
- Appendix H – Import-Export Data Tables
- Appendix I – Regulatory Summary Tables
- Appendix J – Primary Research Participant List (Anonymized)
- Appendix K – Primary Research Questionnaire Framework
- Appendix L – Data Sources & Bibliography
- Appendix M – Market Size Divergence & Source Comparison
Chapter 17. Research Methodology
- 17.1 Research Framework & Philosophy
- 17.2 Secondary Research – Sources, Hierarchy & Data Extraction
- 17.3 Data Modeling – Bottom-Up & Top-Down Market Sizing
- 17.4 Primary Research – Stakeholder Framework, LOI & Sample Sizes
- 17.5 Forecast Methodology – Regression, Scenario & Sensitivity Analysis
- 17.6 Quality Control – Four-Layer Validation Framework
- 17.7 Limitations & Standard Assumptions
- 17.8 Disclaimer
