
Self-pay injectables and lasers anchor clinic demand
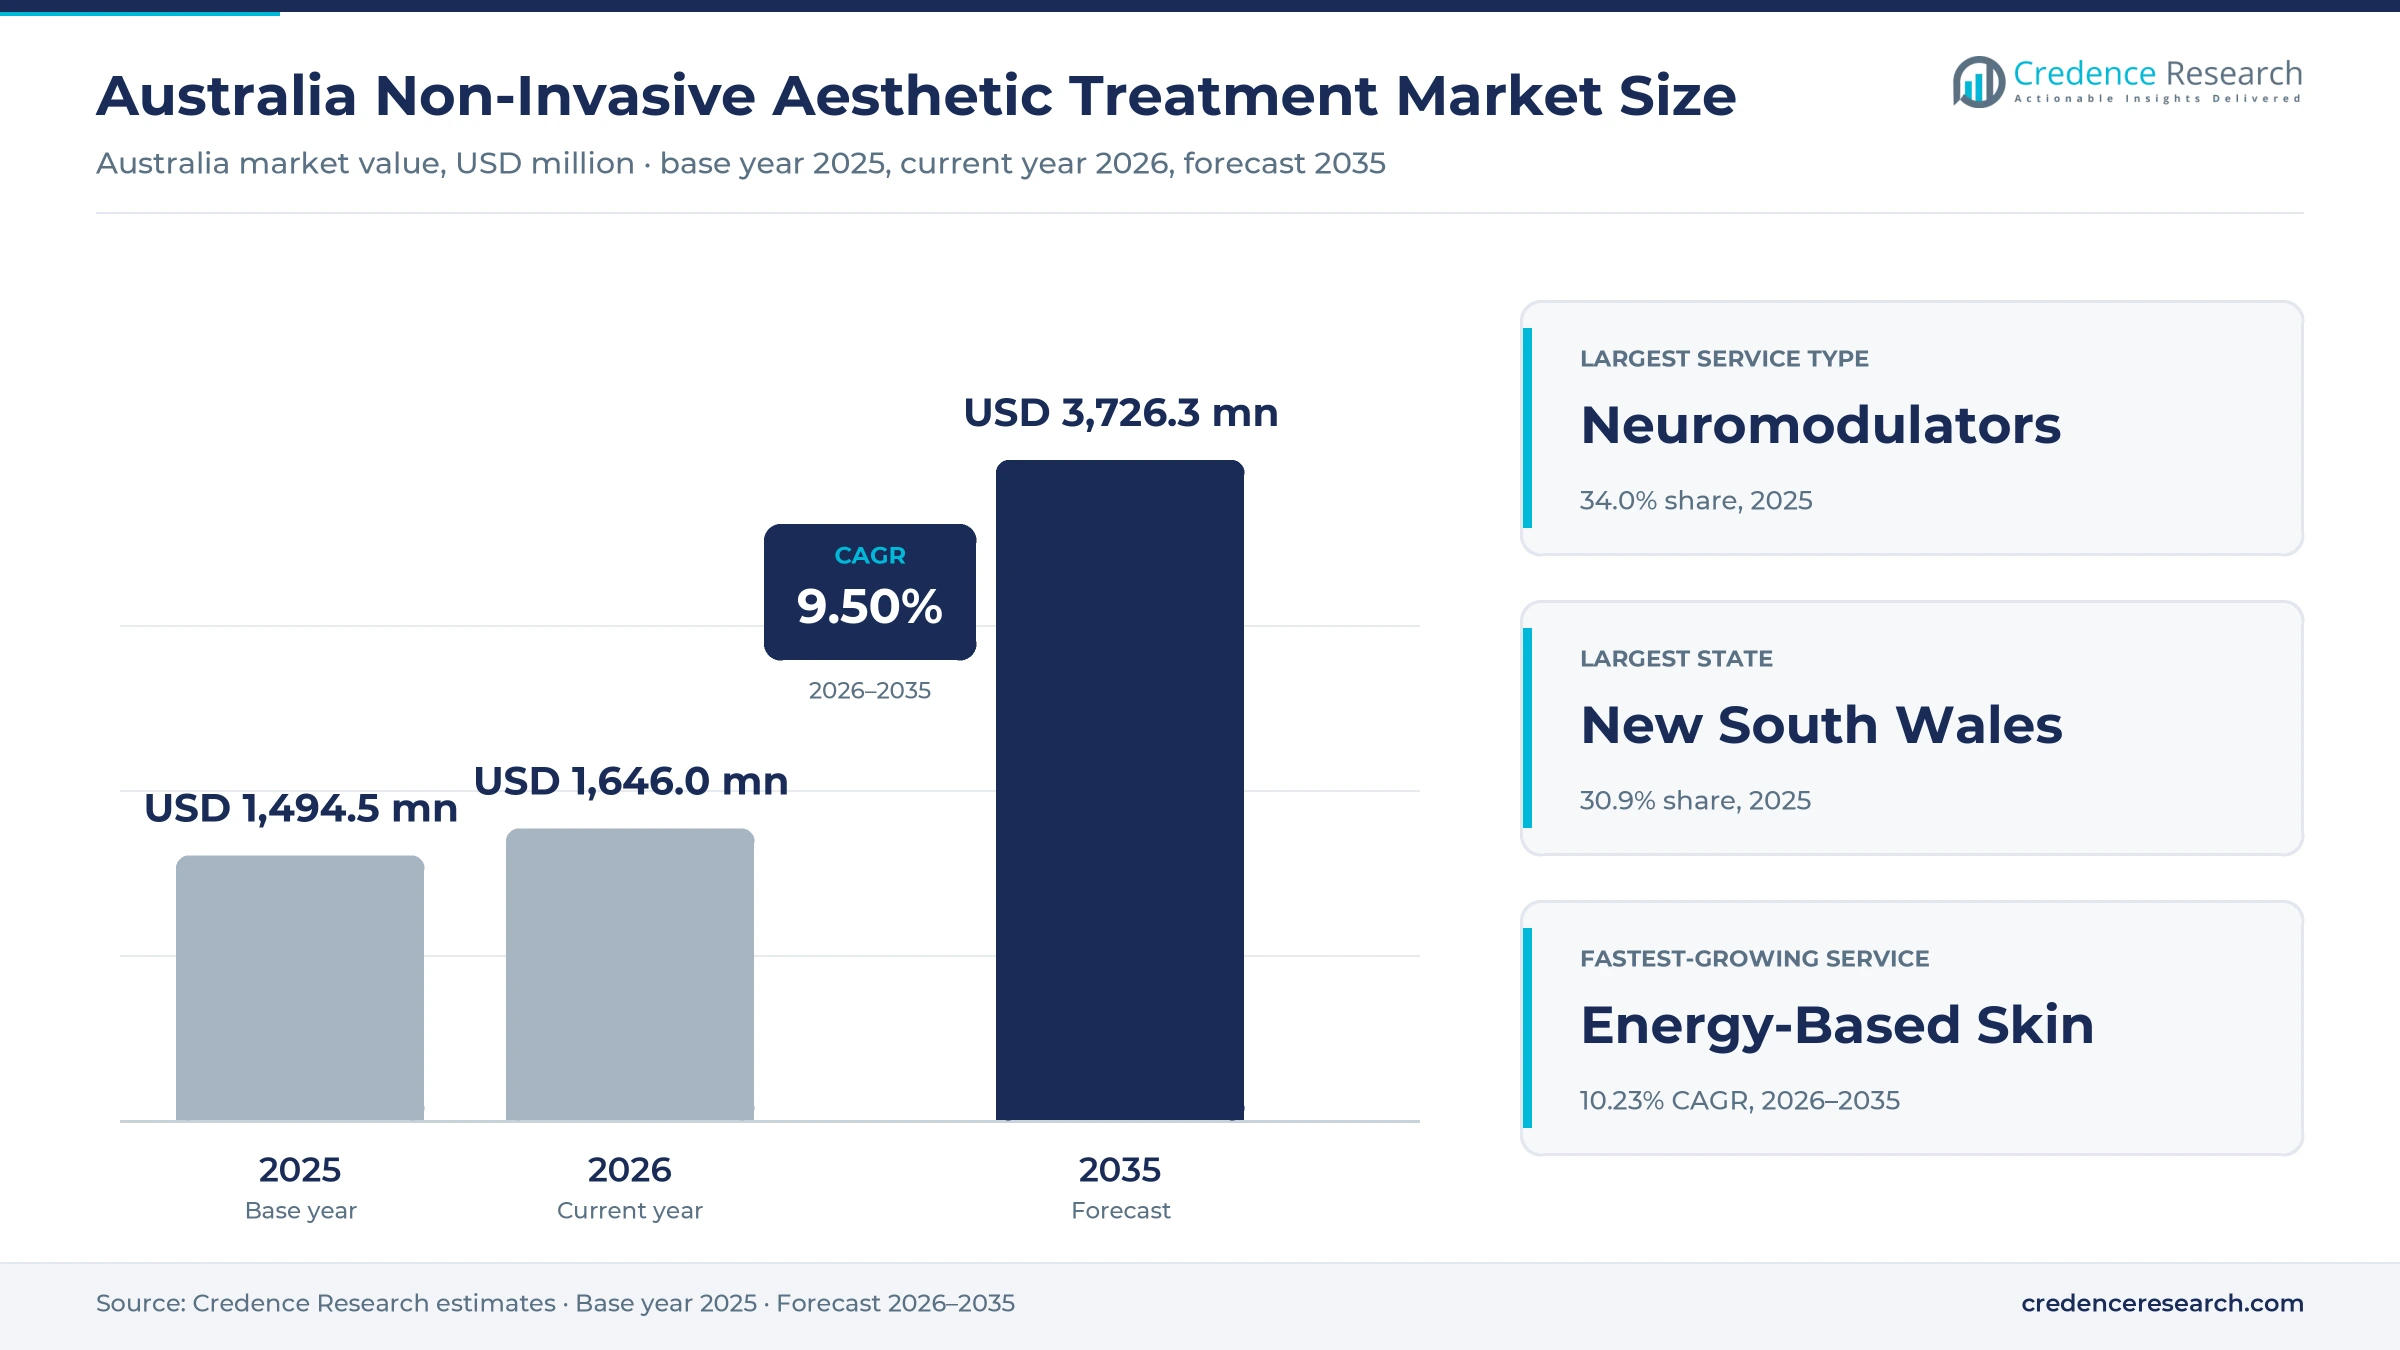
The Australia non-invasive aesthetic treatment market was valued at USD 1.49 billion in 2025 and is projected to increase from USD 1.65 billion in 2026 to USD 3.73 billion by 2035, registering a CAGR of 9.50% during 2026–2035. Demand comes from adults who pay out of pocket for wrinkle relaxers, fillers, laser hair reduction and skin treatments, and who return every few months to maintain results. New South Wales held the largest state share, 30.9% in 2025, because Sydney has the densest network of cosmetic and laser clinics. Western Australia is the fastest-growing state at 10.09% a year, supported by the country's quickest population growth. Meanwhile, national guidelines for non-surgical cosmetic procedures took effect on Sept. 2, 2025, requiring a consultation for every injectable prescription. As a result, demand is shifting toward larger, compliant clinic networks that offer injectables and energy-based care under one roof.
What does the market count in Australian aesthetic care?
The estimate counts consumer spending on non-surgical cosmetic services in Australia, including neuromodulator and dermal filler injections, laser and light treatments, radiofrequency and ultrasound skin tightening, body contouring and skin resurfacing. It covers fees paid at specialist cosmetic clinics, skin and laser chains, dermatology and plastic surgery practices and medical spas. All values in this report are stated in USD million at current prices.
The estimate excludes cosmetic surgery, medically necessary dermatology billed to Medicare, retail skincare and devices sold for home use. It also excludes wholesale sales of injectables and capital equipment, which appear in clinic fees only as costs. The value chain runs from product and device suppliers through prescribers, nurses and laser therapists to clinics and the paying client.
Australia Non-Invasive Aesthetic Treatment Market Insights
- The market was valued at USD 1.49 billion in 2025 and is projected to reach USD 3.73 billion by 2035, registering a CAGR of 9.50% during 2026–2035.
- New South Wales held 30.9% of Australian spending in 2025, because Sydney hosts the largest concentration of cosmetic and laser clinics.
- Neuromodulator treatments led with 34.0% of 2025 value, as wrinkle relaxers need repeat sessions every few months to maintain results.
- Ahpra guidelines for non-surgical cosmetic procedures took effect on Sept. 2, 2025, tightening prescribing, training and advertising rules for all practitioners.
- Wesfarmers reported 180 MediAesthetics clinics at June 30, 2026, including 157 in Australia, after consolidating its SILK and Clear Skincare networks.
Neuromodulators lead while energy-based care grows fastest
Why do neuromodulator treatments hold the largest share?
Based on service type, the market is categorized into neuromodulator treatments, dermal filler treatments, energy-based skin rejuvenation, non-invasive body contouring and skin resurfacing and biostimulation. Neuromodulator Treatments led with 34.0% of 2025 value, because clients return several times a year. Energy-Based Skin Rejuvenation grows fastest at 10.23% a year, as clinics add laser, light and radiofrequency programs for tone and texture.
Which treatment goals generate the most spending?
Based on application, the market is categorized into wrinkle and line reduction, facial volume and contour enhancement, skin quality and pigmentation, body contouring and tightening, and hair reduction and vascular aesthetics. Wrinkle and Line Reduction led with 35.0% of 2025 value, because it is the most common first treatment. Skin Quality and Pigmentation grows fastest at 10.26% a year, as clients seek skin rejuvenation for sun damage and redness.
Where do Australians receive cosmetic treatments?
Based on care setting, the market is categorized into specialist cosmetic clinics, multi-service skin and laser clinics, dermatology practices, plastic surgery practices and medical spa settings. Specialist Cosmetic Clinics led with 32.0% of 2025 value, because injectables are prescribed and given by doctors and nurses on site. Multi-Service Skin and Laser Clinics grow fastest at 9.97% a year, as national chains bundle injectables, lasers and skincare.
How do repeat and preventive clients differ?
Based on customer type, the market is categorized into first-time aesthetic consumers, repeat maintenance consumers, preventive-ageing consumers and corrective-rejuvenation consumers. Repeat Maintenance Consumers led with 44.0% of 2025 value, because memberships and packages keep clients on regular schedules. Preventive-Ageing Consumers grow fastest at 10.18% a year, as younger adults start light treatments earlier and stay on regular aesthetic treatment plans for years.
| Segment Group | Leading Sub-segment | Share, 2025 | Fastest-growing Sub-segment | CAGR, 2026–2035 |
|---|---|---|---|---|
| By Service Type | Neuromodulator Treatments | 34.0% | Energy-Based Skin Rejuvenation | 10.23% |
| By Application | Wrinkle and Line Reduction | 35.0% | Skin Quality and Pigmentation | 10.26% |
| By Care Setting | Specialist Cosmetic Clinics | 32.0% | Multi-Service Skin and Laser Clinics | 9.97% |
| By Customer Type | Repeat Maintenance Consumers | 44.0% | Preventive-Ageing Consumers | 10.18% |
Request a Free Sample
Fill in your details and we'll send you a free sample report.
- Sample data tables & charts
- Research methodology
Repeat visits, new protocols and population lift demand
How does recurring self-pay demand sustain spending?
Recurring self-pay demand is the core driver, because wrinkle relaxers and many skin treatments must be repeated to keep results. Wesfarmers reported 180 MediAesthetics clinics at June 30, 2026, including 39 in New South Wales and the ACT, 34 in Victoria and 42 in Queensland, in its 2026 full-year results. A year earlier, its SILK Laser network had grown to 152 clinics from 144. Because clients pay directly rather than through insurance, clinics can sell memberships and treatment packages that smooth visits across the year. As a result, repeat maintenance consumers held a 44.0% share of 2025 value, the largest customer group in the market.
Why are energy-based and skin-quality protocols expanding?
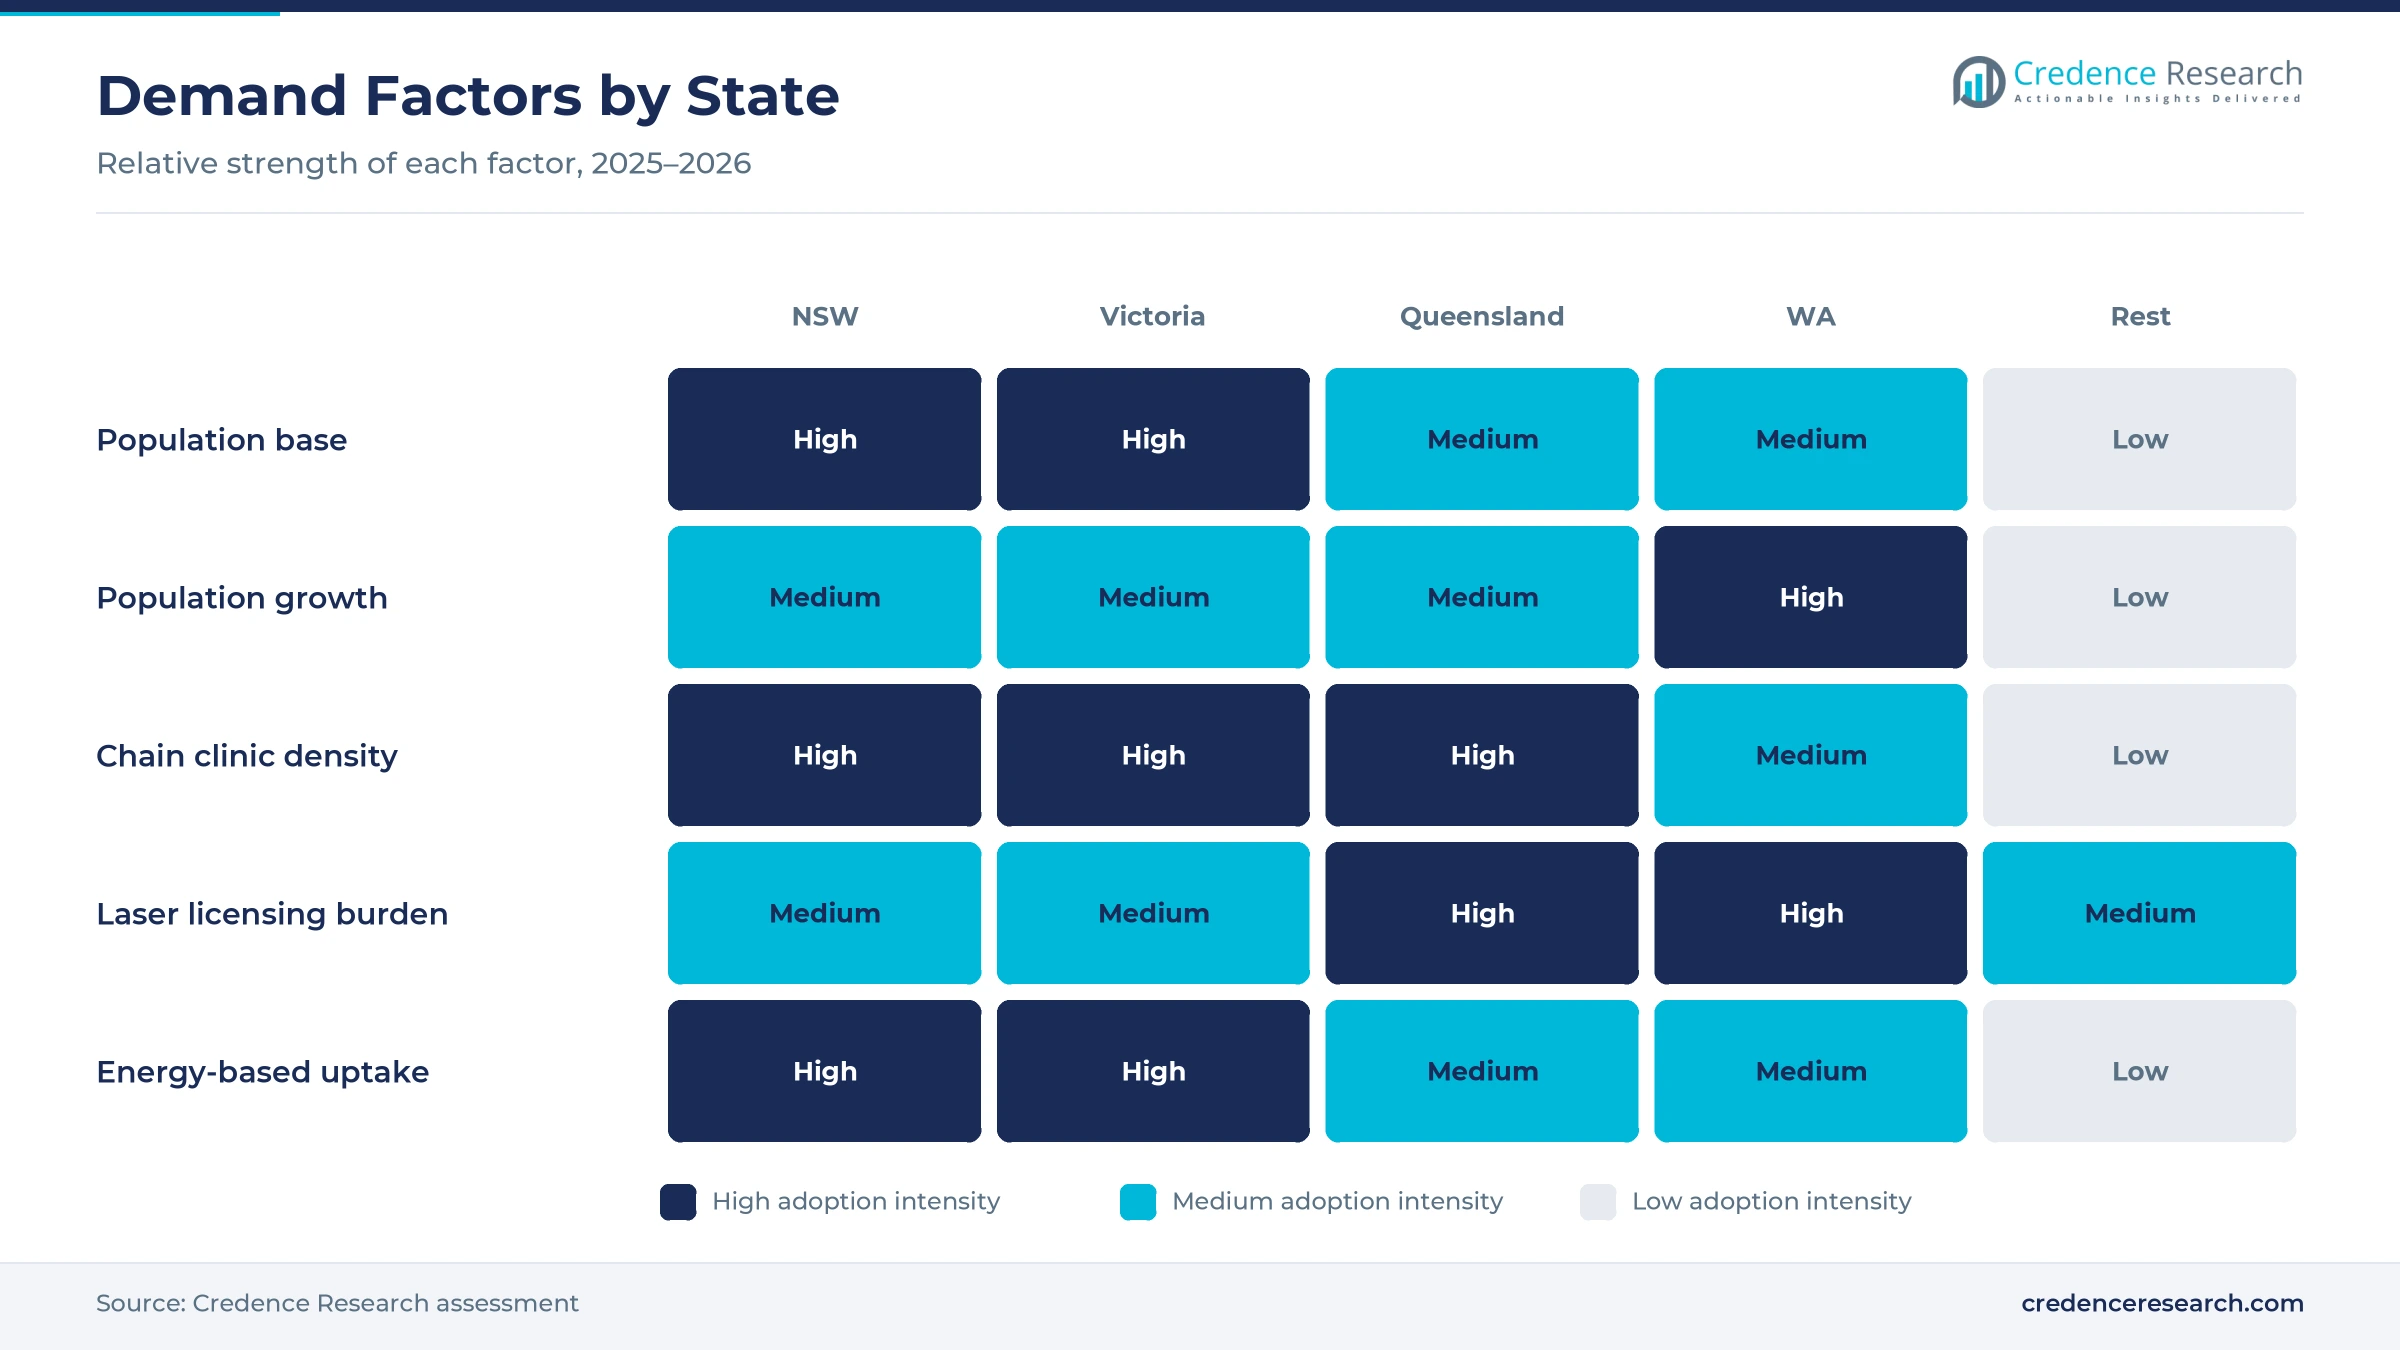
Energy-based and skin-quality protocols are expanding, because clinics want treatments that complement injectables and suit more skin concerns. In Queensland, anyone using Class 4 laser apparatus must hold a use licence and a separate possession licence, according to Queensland Health, covering hair removal, skin rejuvenation, tattoo removal and vascular and pigmented lesions. Cosmetique added beauty and laser treatments in March 2023 and ran 17 clinics by September 2024. Wesfarmers also rebranded 14 Clear Skincare sites as SILK Laser during fiscal 2025. Therefore, energy-based skin rejuvenation grows at 10.23% a year, the fastest service type, as clinics turn single laser sessions into structured treatment courses.
How do population growth and city density lift demand?
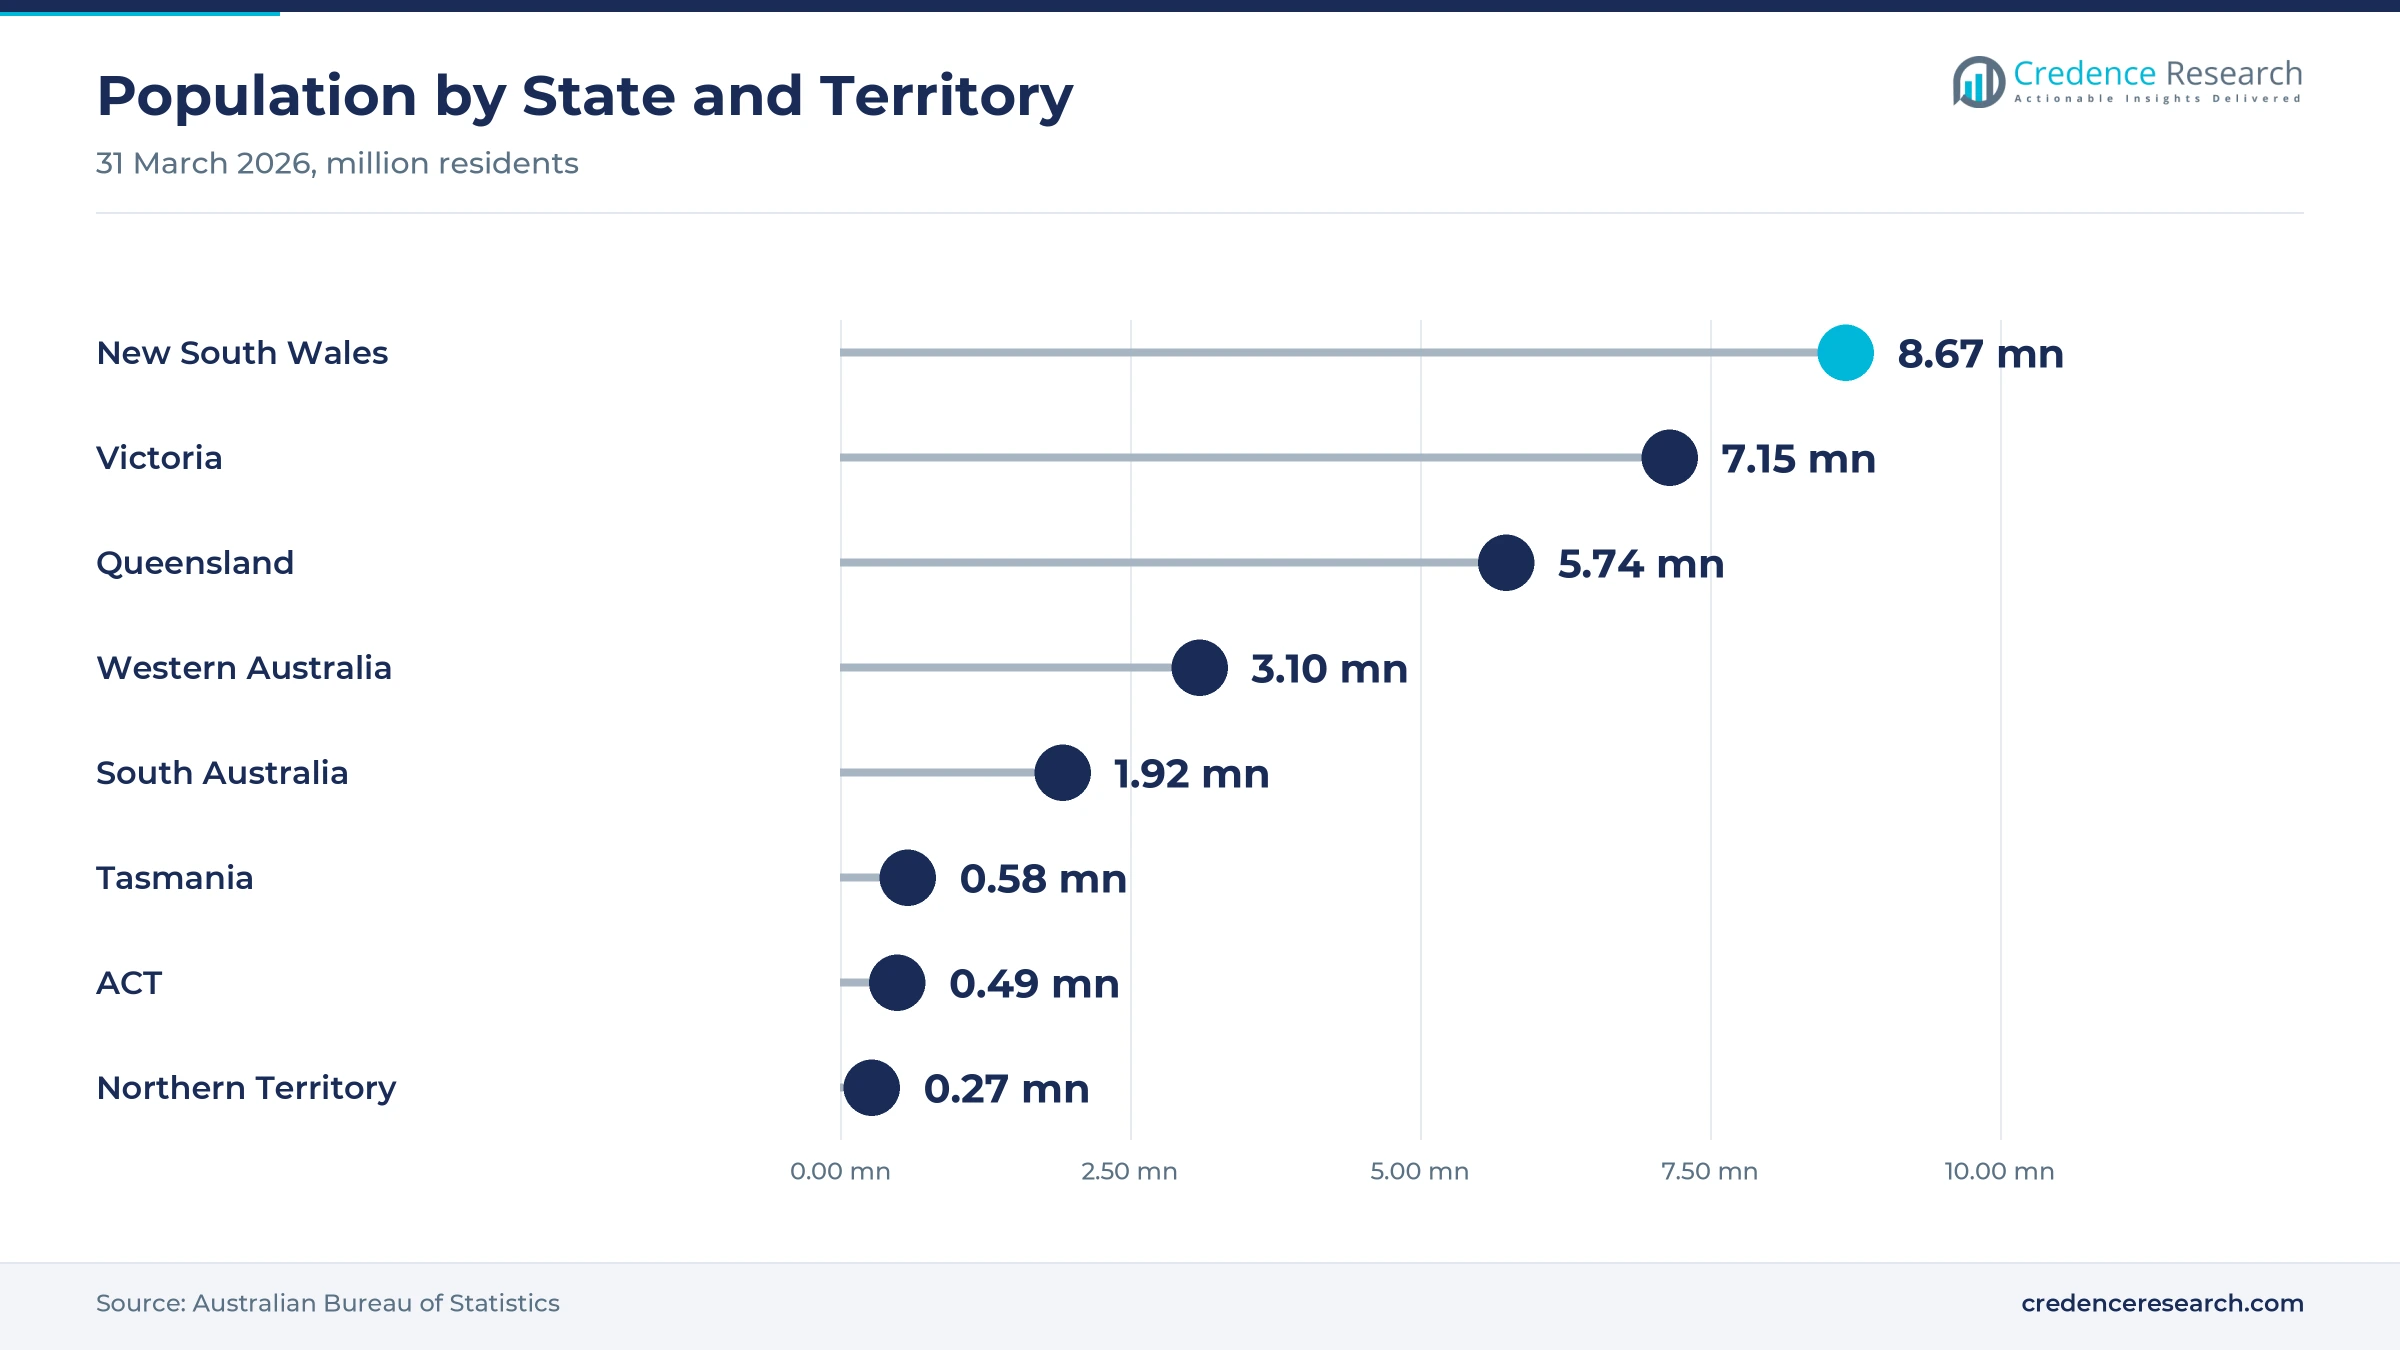
Population growth and dense metropolitan catchments widen the pool of clients within easy reach of a clinic. Australia's population reached about 27.9 million at March 31, 2026, up 392,700 or 1.4% in a year, according to the ABS. Western Australia grew fastest at 2.1%, while Victoria and Queensland each grew 1.6%. New South Wales still has the most residents, at about 8.67 million. In turn, Western Australia is the fastest-growing state for aesthetic treatment demand, while New South Wales keeps the largest base because Sydney supports many clinics within short travel times of dense suburbs and business districts.
Do stricter practice standards help established clinics?
Stricter practice standards help established clinics, because they raise trust and favor operators with trained staff and compliance systems. The Ahpra guidelines that took effect on Sept. 2, 2025 require an in-person or video consultation each time a cosmetic injectable is prescribed. Registered nurses need at least one year of full-time general practice before performing cosmetic procedures, and clients under 18 face a seven-day cooling-off period. These rules followed cosmetic surgery reforms that began on July 1, 2023. As a result, specialist cosmetic clinics held a 32.0% share of 2025 value, because they already run doctor-led prescribing, structured consent and regular staff training across every location.
Clinic consolidation and stricter advertising reshape care
How is consolidation into national chains shaping supply?
Consolidation into national chains is a defining shift, because scale helps clinics absorb compliance, training and marketing costs. Wesfarmers agreed in 2023 to buy SILK Laser Australia, which then had 142 clinics, and by June 2025 its Clear Skincare network had fallen to 40 sites from 75 as locations were merged or rebranded. SILK had earlier added 55 clinics by buying Australian Skin Clinics in September 2021. Meanwhile, Cosmetique's parent sought an ASX listing in October 2024 to fund four new clinics. Therefore, multi-service skin and laser clinics grow at 9.97% a year, the fastest care setting, because chains can offer injectables, lasers and skincare under one brand.
Why is advertising shifting toward stricter, specific claims?
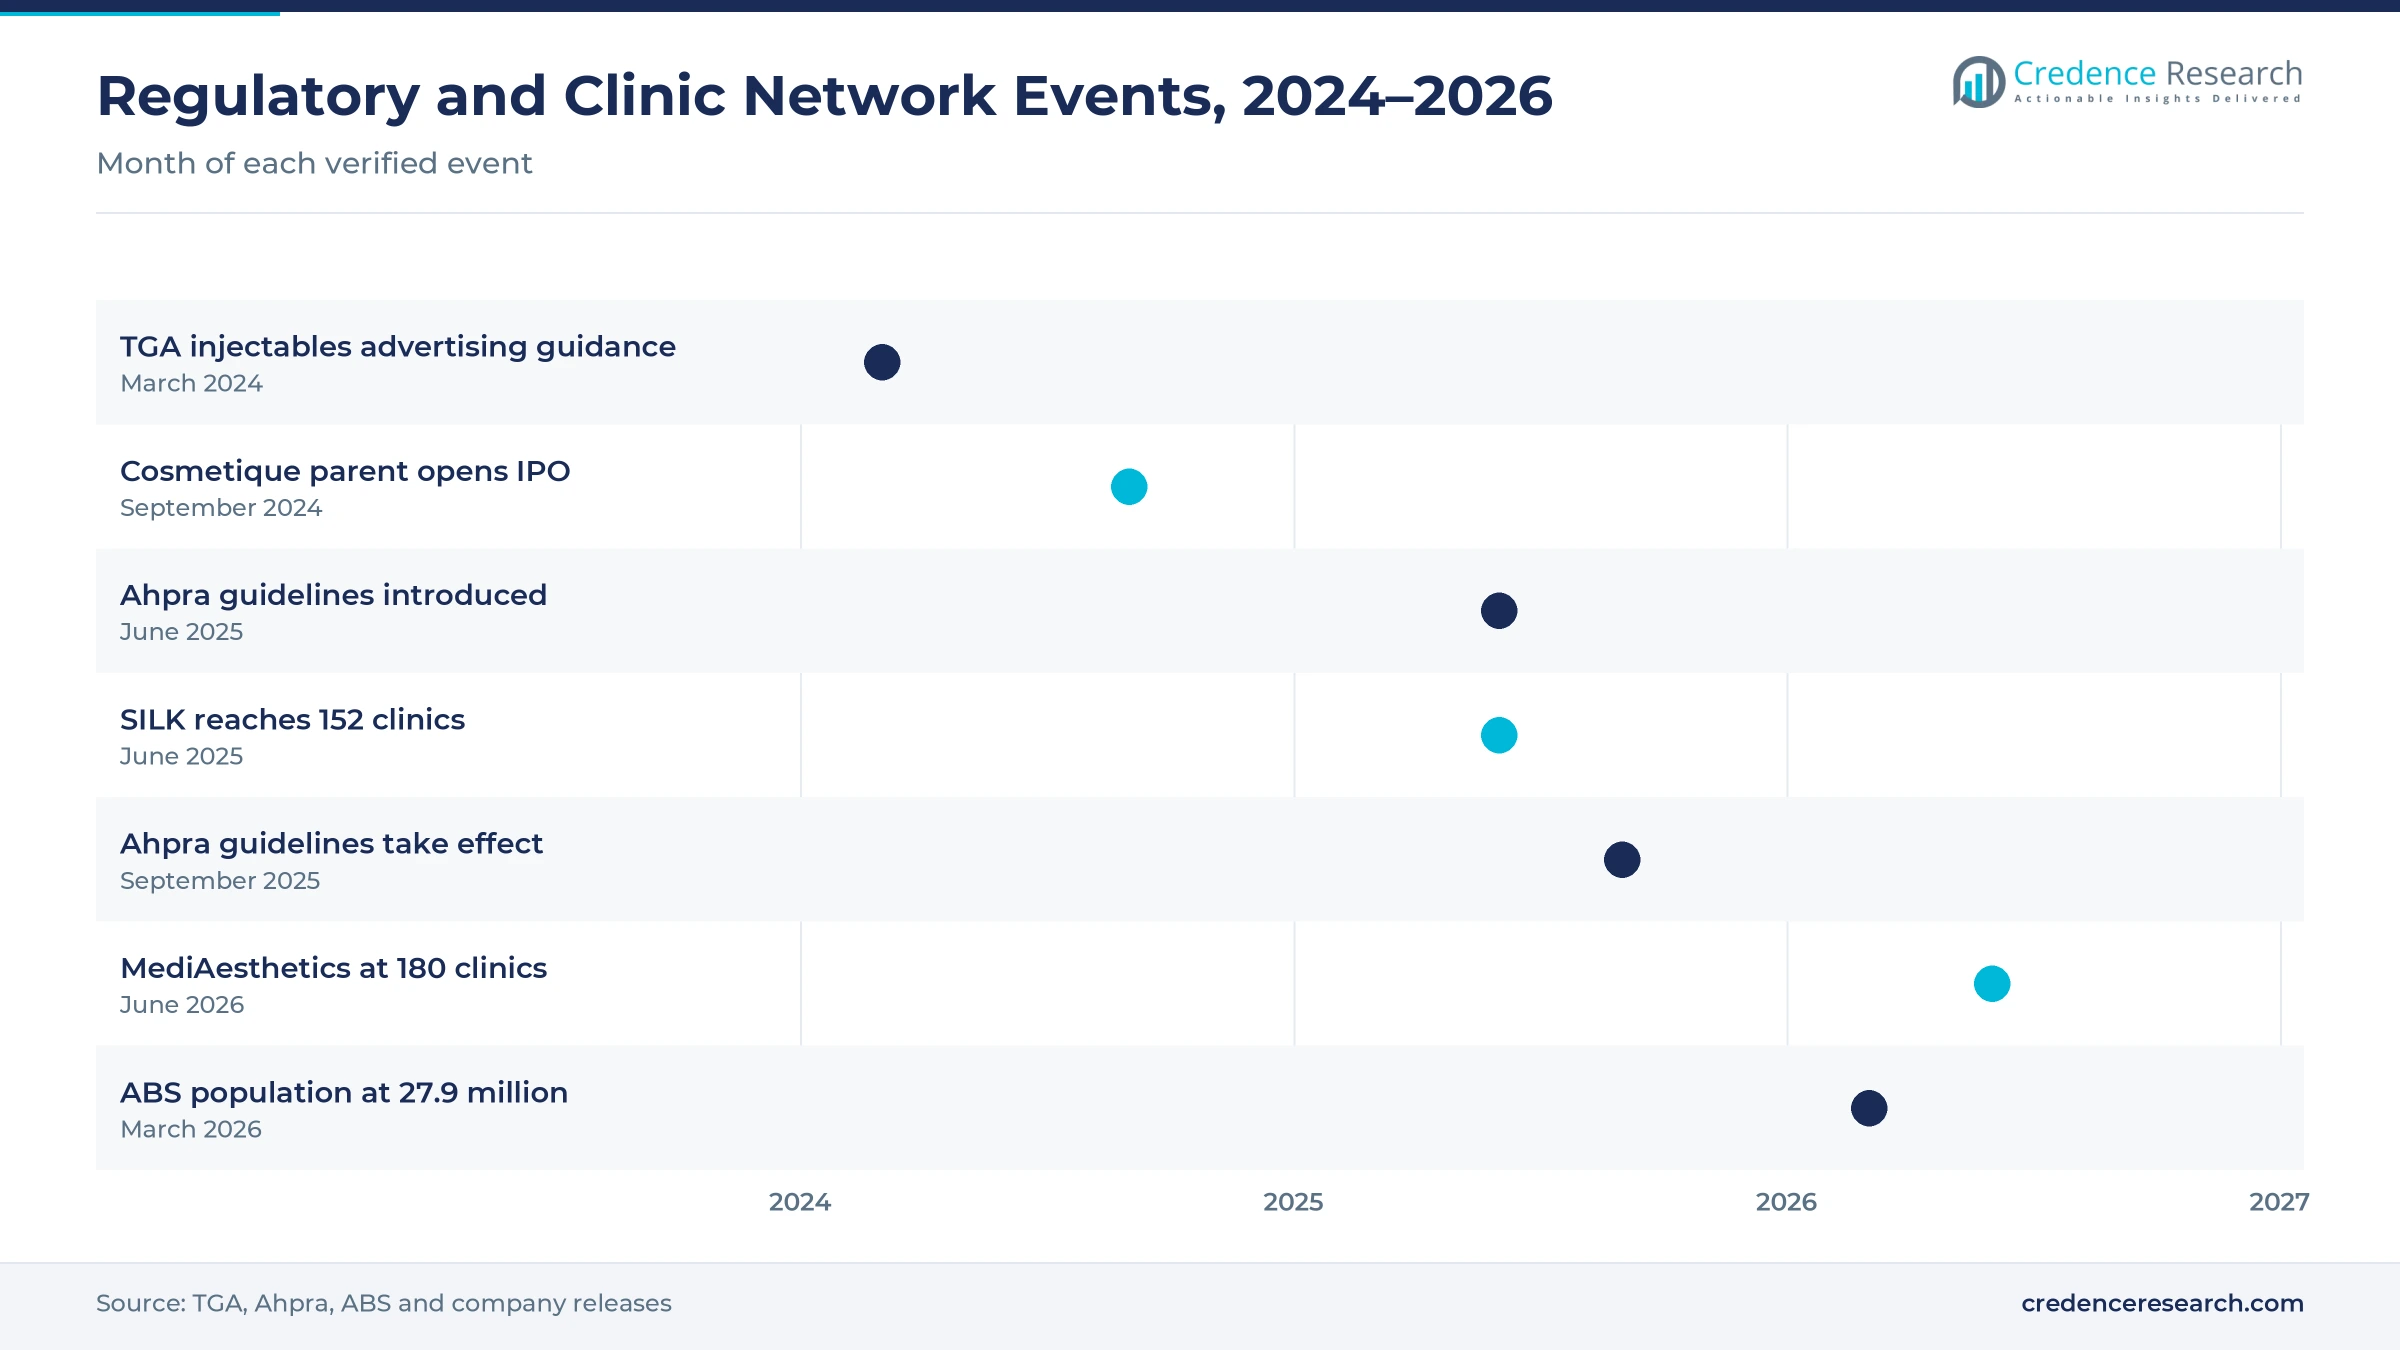
Advertising is shifting toward specific, compliant claims, because regulators have tightened rules on promoting prescription-only injectables. The TGA updated its cosmetic injectables advertising guidance in March 2024, stating that vague terms such as wrinkle reducing injections are no longer permitted. Ahpra then banned influencer testimonials and required real images for higher-risk procedures from Sept. 2, 2025. The TGA also issued 2 infringement notices totaling $7,716 to a Queensland individual over counterfeit botulinum toxin imports. In turn, clinics rely more on direct booking, education content and referral programs than on promotional posts about botulinum toxin and other prescription products.
Can skin-quality programs open a new revenue stream?
Skin-quality programs are an opening, because they attract clients who want healthier skin without changing facial features. Skin quality and pigmentation posts the fastest application CAGR, 10.26% a year. Clinics combine lasers, peels, microneedling and biostimulators in these programs. Wesfarmers expanded its AestheticsRX own-brand cosmeceuticals range during fiscal 2026, which links in-clinic care with home routines. Queensland Health lists skin rejuvenation and pigmented lesion treatment among licensed laser uses, so trained operators can grow these services. As a result, clinics with 2 or 3 device types can build multi-step courses that raise visit frequency and make non-invasive aesthetic treatment spending more predictable.
Will preventive-ageing clients and memberships widen demand?
Preventive-ageing clients and memberships offer a second opening for clinics that want steady bookings, because younger adults are starting light treatments earlier and staying on regular plans. Preventive-ageing consumers grow at 10.18% a year, the fastest customer group. Australia's population reached about 27.6 million in 2025, according to World Bank data, and keeps adding residents in every state each year. Ahpra rules now bar advertising to under-18s, so clinics focus on adults aged 18 and over with membership plans. Therefore, package programs that bundle laser hair removal, peels and wrinkle relaxers can lift lifetime value and steady clinic bookings through quieter months of the year.
Compliance costs and illegal imports test operators
How do compliance costs affect smaller clinics?
Compliance costs weigh on smaller clinics in a market where chains already run 157 MediAesthetics sites, because the 2025 guidelines require detailed consultations, written consent, ongoing training and a prescriber consultation for every injectable script. Sole-practitioner clinics must fund these steps without the scale of national chains. As a result, some smaller operators may close, merge or shift toward lower-risk skin services. Shared telehealth prescribing and group training programs help offset part of the burden, although they add their own fees and administration for each clinic.
Why do illegal imports and unqualified providers remain a risk?
Illegal imports and unqualified providers remain a risk, because counterfeit products undercut prices and can harm clients. The TGA issued 5 infringement notices totaling $19,800 to a New South Wales individual over unapproved prescription-only imports. Such cases damage public confidence in cosmetic injectables and draw clients away from registered clinics. Therefore, legitimate clinics stress product traceability, registered practitioners and clear pricing to reassure clients, while regulators continue to pursue sellers who advertise on social media.
Do workforce shortages limit clinic expansion?
Workforce shortages limit expansion, because clinics need registered nurses, doctors and licensed laser operators in each location. Nurses now need a year of general practice before moving into cosmetic work, and Queensland laser operators train under supervision with a log book. In turn, new clinics can take months to staff fully. Chains respond with in-house academies, mentoring programs and structured career paths that help retain nurses and laser therapists over several years.
How does household budget pressure affect visits?
Household budget pressure can reduce visit frequency, because non-invasive cosmetic care is fully self-paid and easy to delay. Clients may stretch the time between wrinkle relaxer sessions or choose cheaper skin treatments during tight periods. As a result, clinic revenue can soften even when client numbers hold. Memberships, payment plans and entry-level services help clinics keep clients engaged until budgets recover, which protects aesthetic treatment demand over the full economic cycle.
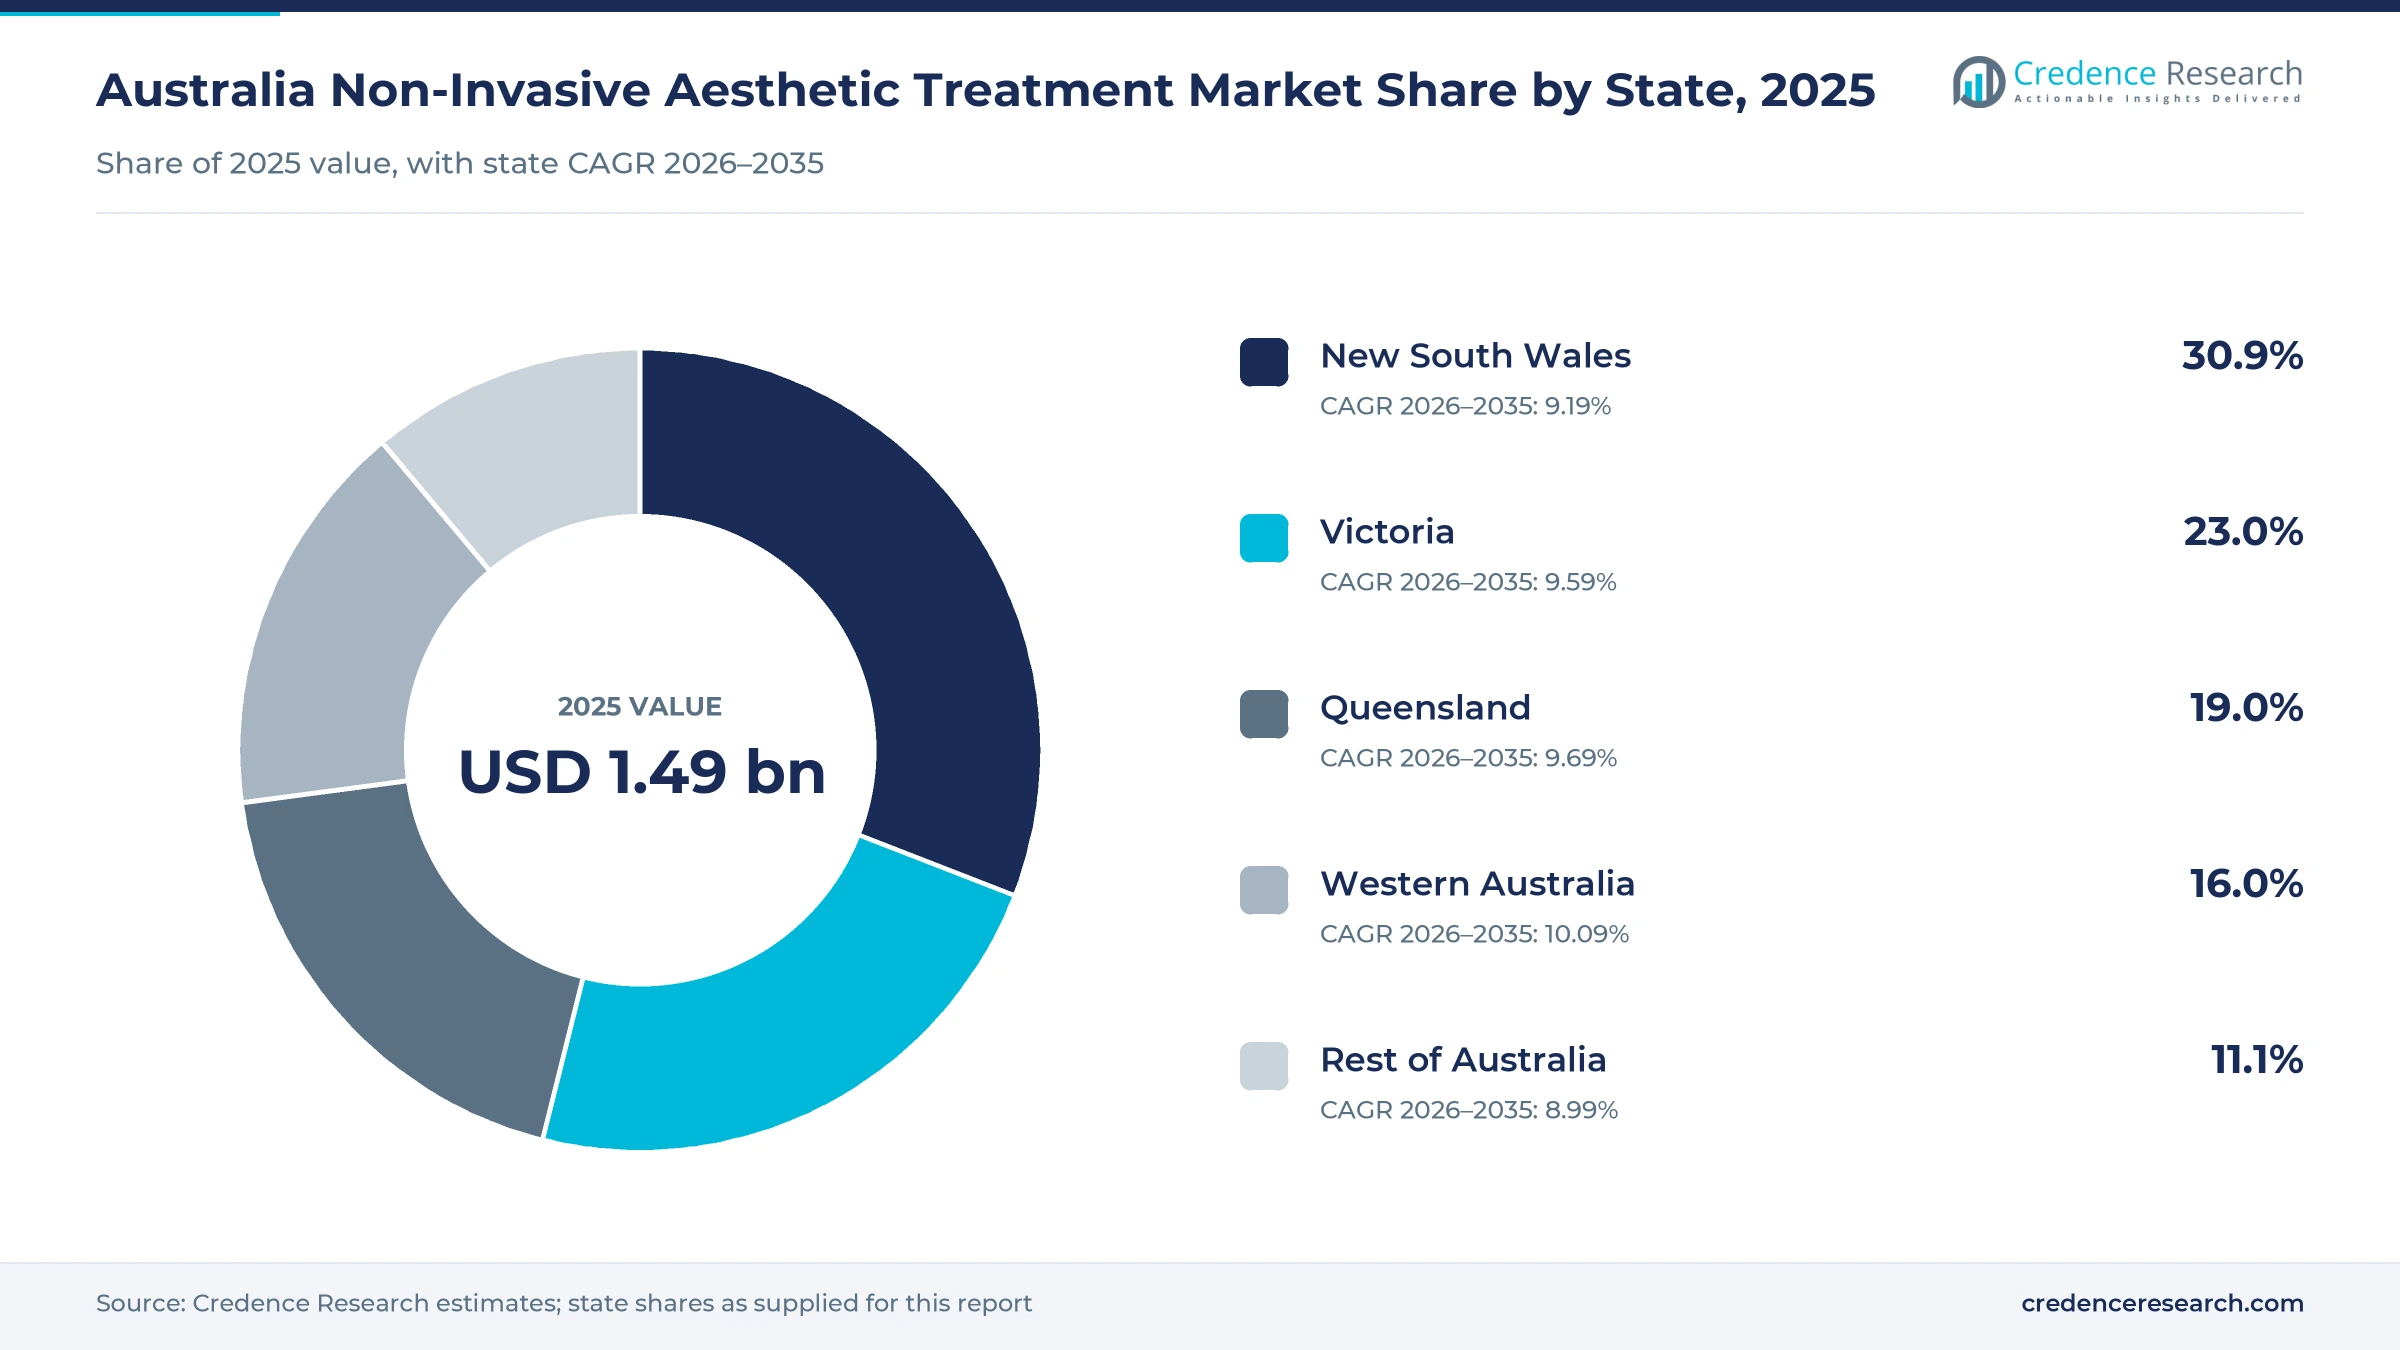
New South Wales leads while Western Australia grows fastest
| State | Value, 2025 (USD billion) | Share, 2025 | CAGR, 2026–2035 |
|---|---|---|---|
| New South Wales | 0.46 | 30.9% | 9.19% |
| Victoria | 0.34 | 23.0% | 9.59% |
| Queensland | 0.28 | 19.0% | 9.69% |
| Western Australia | 0.24 | 16.0% | 10.09% |
| Rest of Australia | 0.17 | 11.1% | 8.99% |
Why does New South Wales lead spending?
New South Wales held a 30.9% share of 2025 state value and grows at 9.19% a year. This lead reflects Sydney's large, affluent population and the highest number of residents of any state, about 8.67 million at March 2026. National chains operate dozens of clinics across Sydney and regional centers, while dermatology and plastic surgery practices serve higher-value clients. As a result, New South Wales attracts the widest range of devices and the highest share of premium aesthetic treatment demand in the country.
How does Victoria compare with New South Wales?
Victoria held a 23.0% share of 2025 state value and grows at 9.59% a year. Melbourne supports a dense clinic market, and the state population grew 1.6% to about 7.15 million in the year to March 2026. Wesfarmers counted 34 MediAesthetics clinics in Victoria at June 2026, showing the importance of the state for national networks. Demand is strongest in inner and eastern Melbourne, where skin and laser chains cluster near shopping centers.
What drives demand in Queensland?
Queensland held a 19.0% share of 2025 state value and grows at 9.69% a year. The state had about 5.74 million residents in March 2026, with growth concentrated in Brisbane and the Gold Coast. Wesfarmers counted 42 MediAesthetics clinics in Queensland at June 2026, more than in any other state, and strict laser licensing supports trained operators in skin and hair treatments. Therefore, Queensland combines a large clinic network with steady demand from a growing coastal population.
Why is Western Australia growing fastest?
Western Australia held a 16.0% share of 2025 state value and grows at 10.09% a year, the fastest state. Its population rose 2.1% to about 3.10 million in the year to March 2026, the quickest rate in the country. Perth also hosts clinic chains that began in the state, including Cosmetique, which opened its first clinic in Joondalup in 2017.
How does the rest of Australia contribute?
Rest of Australia, covering South Australia, Tasmania, the ACT and the Northern Territory, held 11.1% of 2025 state value and grows at 8.99% a year. South Australia had about 1.92 million residents in March 2026. Adelaide supports several national chains, while smaller markets rely on fewer clinics and visiting practitioners.
Regulatory reforms and network moves from 2024 to 2026
| Development | Status and market relevance |
|---|---|
| In March 2024, the TGA updated its advertising guidance for cosmetic injectables, ruling out vague terms such as wrinkle reducing injections. | Applies to every clinic that promotes prescription-only neuromodulators and fillers |
| In September 2024, Stormeur, parent of the Cosmetique injectables chain, opened an IPO seeking an ASX listing with 17 clinics. | Funds were planned for four new clinics, initially in New South Wales and Victoria |
| In June 2025, Ahpra and the National Boards introduced two guidelines on non-surgical cosmetic procedures and their advertising. | Gave practitioners until Sept. 2, 2025 to comply |
| In September 2025, the Ahpra guidelines took effect, requiring a consultation for every injectable prescription and banning influencer testimonials. | Raises compliance standards for nurses, doctors and clinic owners |
| In August 2026, Wesfarmers reported 180 MediAesthetics clinics at June 30, 2026 after completing the consolidation of its clinic network. | Covers SILK Laser Clinics and Clear Skincare Clinics in Australia and New Zealand |
Lasers, energy devices and digital consults ahead
- Laser and IPL systems remain the base of hair, vascular and pigment treatments, and Class 4 lasers need licensed operators in states such as Queensland.
- Radiofrequency and ultrasound devices tighten skin without incisions, which lets clinics offer lifting treatments to clients who avoid surgery.
- Cryolipolysis and electromagnetic systems reduce fat and tone muscle, which supports body contouring devices in larger clinics.
- Video consultations now meet the rule that each injectable prescription needs a real-time consult, which helps clinics without an on-site doctor.
Need a Custom Version of This Report?
Tailor the scope, geography, or segments to your exact requirements.
- Custom geography or segment scope
- Direct access to our analyst team
National clinic chains compete with doctor-led practices
Competition combines national clinic chains with doctor-led practices and independent clinics. Wesfarmers operates SILK Laser Clinics and Clear Skincare Clinics through its MediAesthetics business, with 180 clinics at June 30, 2026 including 23 in New Zealand. Laser Clinics Australia, owned by KKR since 2017, offers laser hair reduction, injectables, skin treatments and body contouring and had opened its 200th clinic globally by 2022. Australian Skin Clinics became part of SILK in September 2021, adding 55 clinics. Cosmetique, which began in Western Australia in 2017, focuses on injectables and added laser treatments in 2023. Other operators include Results Laser Clinic, Evolution Laser Clinic, Contour Clinics, The Manse Clinic and Renaissance Cosmetic Clinics. Clinics compete on price, practitioner skill, device range, membership offers and compliance with the new Ahpra rules.
Companies profiled and their roles in this market
| Company | Type | Role in the market |
|---|---|---|
| SILK Laser Clinics | National chain (Wesfarmers) | Laser hair removal, injectables and skin treatments; 152 clinics at June 2025 |
| Clear Skincare Clinics | National chain (Wesfarmers) | Skin, laser and injectables clinics; 40 sites at June 2025 after rebranding |
| Laser Clinics Australia | National chain (KKR-owned) | Laser hair reduction, injectables, skin and body contouring treatments |
| Australian Skin Clinics | Franchise brand (SILK) | Skin and cosmetic clinics added to SILK in September 2021 |
| Cosmetique | Injectables chain | Wrinkle relaxers, fillers and laser hair removal across 17 clinics in 2024 |
Credence Research view on growth and regulation
Credence Research's view is that Australian demand will keep growing faster than incomes, because injectables and skin treatments have become routine self-care for many adults. The 2025 guidelines will slow some small operators but strengthen trust in the sector as a whole. Larger chains with doctor-led prescribing, video consults and broad device ranges are best placed to gain share. However, illegal imports and budget pressure remain risks, so growth will favor clinics that combine compliance with flexible membership pricing.
How the Australian estimate was built
The report uses 2025 as the base year on a calendar basis, with values in USD million at current prices. Market values come from the Credence Research model, which links adult population, treatment frequency and average fees by service type. State shares were supplied for this report, and segment splits and growth rates are Credence Research estimates. Sources used are ABS population statistics, World Bank data, Ahpra and TGA publications, state health department guidance and company filings, and no interviews or surveys were used.
Skin-quality care and growing cities shape 2035 demand
Spending is expected to reach USD 3.73 billion by 2035, a 9.50% CAGR during 2026–2035, as non-invasive care becomes a regular part of adult grooming. Growth should be steady through the late 2020s as clinics adapt to the 2025 guidelines and expand energy-based menus. After that, skin-quality programs, memberships and population growth in Western Australia and Queensland should keep demand rising. Tighter enforcement against illegal products would support legitimate clinics, while weaker household budgets could slow visit frequency in some years.
Frequently Asked Questions
How big is the Australia non-invasive aesthetic treatment market?
Which state leads spending in Australia?
Which service type holds the largest share?
What changed in Australian cosmetic regulation in 2025?
Which state grows fastest through 2035?
How large are the leading clinic networks?
Which companies compete in this market?
What are the main risks for clinics?
Table of Content
Chapter 1 Market Segmentation
- 1.1 Segmentation Framework
- 1.1.1 Product and Service Classification
- 1.1.2 Application and End-Use Classification
- 1.1.3 Technology and Solution Classification
- 1.1.4 Customer and Distribution Channel Classification
- 1.1.5 Geographic Segmentation
- 1.1.6 Market Segment Definitions and Boundaries
- 1.2 By Service Type
- 1.2.1 Neuromodulator Treatments
- 1.2.2 Dermal Filler Treatments
- 1.2.3 Energy-Based Skin Rejuvenation
- 1.2.4 Skin Resurfacing and Biostimulation
- 1.2.5 Non-Invasive Body Contouring
- 1.3 By Application
- 1.3.1 Wrinkle and Line Reduction
- 1.3.2 Facial Volume and Contour Enhancement
- 1.3.3 Skin Quality and Pigmentation
- 1.3.4 Hair Reduction and Vascular Aesthetics
- 1.3.5 Body Contouring and Tightening
- 1.4 By Care Setting
- 1.4.1 Specialist Cosmetic Clinics
- 1.4.2 Multi-Service Skin and Laser Clinics
- 1.4.3 Dermatology Practices
- 1.4.4 Plastic Surgery Practices
- 1.4.5 Medical Spa Settings
- 1.5 By Customer Type
- 1.5.1 Repeat Maintenance Consumers
- 1.5.2 Preventive-Ageing Consumers
- 1.5.3 First-Time Aesthetic Consumers
- 1.5.4 Corrective-Rejuvenation Consumers
- 1.6 By State
- 1.6.1 New South Wales
- 1.6.2 Victoria
- 1.6.3 Queensland
- 1.6.4 Western Australia
- 1.6.5 Rest of Australia
Chapter 2 Introduction
- 2.1 Report Objectives and Scope
- 2.2 Product Definition and Industry Terminology
- 2.3 Market Inclusions and Exclusions
- 2.4 Research Process
- 2.4.1 Primary Research and Expert Interviews
- 2.4.2 Secondary Research and Source Review
- 2.4.3 Top-Down and Bottom-Up Estimation
- 2.4.4 Data Triangulation and Verification
- 2.5 Market Size Measurement Basis
- 2.5.1 2025: USD 1.49 billion → 2035: USD 3.73 billion
- 2.6 Historical and Forecast Reference Periods
- 2.6.1 Historical Period: 2018-2025
- 2.6.2 Base Year: 2025
- 2.6.3 Forecast Period: 2025-2035
- 2.7 Research Assumptions and Limitations
Chapter 3 Executive Summary
- 3.1 Market Snapshot and Key Findings
- 3.2 Base-Year Market Size, 2025
- 3.3 Forecast Market Size, 2035
- 3.4 Revenue and Volume Growth Outlook
- 3.5 Key Demand and Supply Indicators
- 3.6 Leading Market Segments
- 3.7 Fastest-Growing Market Opportunities
- 3.8 Regional Performance Highlights
- 3.9 Technology and Industry Transformation
- 3.10 Competitive Landscape Summary
- 3.11 Analyst View and Strategic Implications
Chapter 4 Australia Non-Invasive Aesthetic Treatment Market Trends and Developments
- 4.1 Historical Industry Development, 2018-2025
- 4.2 Recent Market Trends and Developments
- 4.3 Demand and Customer Behavior Trends
- 4.4 Technology and Product Innovation
- 4.5 Artificial Intelligence, Automation and Digitalization
- 4.6 Local Manufacturing and Supply Chain Realignment
- 4.7 Industry Partnerships, Mergers and Acquisitions
- 4.8 Sustainability and Circular Economy Developments
- 4.9 Government and Private Sector Investment Trends
- 4.10 Emerging Business Models and Commercialization
- 4.11 Industry Developments and Announcements
Chapter 5 Australia Non-Invasive Aesthetic Treatment Market Production, Supply and Demand Analysis
- 5.1 Demand Trend and Consumption Analysis, 2018-2025
- 5.2 Demand Forecast, 2025-2035
- 5.3 Production and Output Trend, 2018-2025
- 5.4 Production and Output Forecast, 2025-2035
- 5.5 Installed Capacity and Capacity Utilization
- 5.6 Company-Wise Production Plants and Statistics
- 5.6.1 Installed Production Capacity
- 5.6.2 Actual Production
- 5.6.3 Planned Capacity and Expansion Targets
- 5.7 Supply Chain Structure and Procurement Trends
- 5.8 Supply-Demand Gap and Bottlenecks
- 5.9 Import Dependence and Sourcing Structure
- 5.10 Contract Manufacturing and Outsourcing
- 5.11 Regional Supply and Demand Concentration
Chapter 6 Australia Non-Invasive Aesthetic Treatment Market Pricing Analysis
- 6.1 Pricing Structure and Measurement
- 6.2 Historical Pricing Trends, 2018-2025
- 6.3 Pricing Outlook, 2025-2035
- 6.4 Average Selling Price and Unit Economics
- 6.5 Pricing by Product and Market Segment
- 6.6 Geographic Pricing Differences
- 6.7 Key Input, Energy, Labor and Logistics Costs
- 6.8 Contract Pricing and Purchasing Models
- 6.9 Pricing Sensitivity and Competitive Positioning
- 6.10 Price, Margin and Profitability Implications
Chapter 7 Australia Non-Invasive Aesthetic Treatment Market Dynamics
- 7.1 Market Growth Drivers
- 7.1.1 Demand-Side Drivers
- 7.1.2 Technology and Innovation Drivers
- 7.1.3 Infrastructure and Investment Drivers
- 7.1.4 Regulatory and Policy Drivers
- 7.2 Market Restraints
- 7.2.1 Cost and Affordability Constraints
- 7.2.2 Technology and Adoption Barriers
- 7.2.3 Supply Chain and Operational Constraints
- 7.3 Market Challenges
- 7.3.1 Competitive Pressure and Margin Erosion
- 7.3.2 Skills, Infrastructure and Implementation Gaps
- 7.4 Emerging Market Opportunities
- 7.5 Market Dynamics Impact and Time-Horizon Assessment
Chapter 8 Australia Non-Invasive Aesthetic Treatment Value Chain Analysis
- 8.1 Industry Value Chain Overview
- 8.2 Upstream Suppliers and Critical Inputs
- 8.3 Technology and Component Providers
- 8.4 Manufacturing or Service Delivery
- 8.5 Distribution, Channel Partners and Integrators
- 8.6 Downstream Applications and End Users
- 8.7 Value Addition and Profit Pools
- 8.8 Vertical Integration and Outsourcing
- 8.9 Supplier Concentration and Risk
- 8.10 Supply Chain Localization and Resilience
Chapter 9 Australia Non-Invasive Aesthetic Treatment Market Regulations and Policies
- 9.1 Relevant Laws, Standards and Compliance Frameworks
- 9.2 Product, Service, Safety and Quality Requirements
- 9.3 Government Policies, Incentives and Subsidies
- 9.4 Imports, Exports and Trade Barriers
- 9.5 Public Procurement and Local Content Requirements
- 9.6 Environmental and Sustainability Compliance
- 9.7 Upcoming Policy Changes and Market Implications
Chapter 10 Australia Non-Invasive Aesthetic Treatment Market Hotspots and Opportunities
- 10.1 Market Opportunity Mapping and Growth Hotspots
- 10.2 High-Growth Applications and Customer Groups
- 10.3 Underserved Markets and White-Space Opportunities
- 10.4 Emerging Technology and Product Opportunities
- 10.5 New Capacity and Investment Hotspots
- 10.6 Market Entry and Expansion Opportunities
- 10.7 Distribution and Partnership Opportunities
- 10.8 Near-Term and Long-Term Commercial Potential
- 10.9 Opportunity Attractiveness and Execution Risks
Chapter 11 Australia Non-Invasive Aesthetic Treatment Market Outlook, 2025-2035
- 11.1 Market Size and Analysis
- 11.1.1 Revenue (Market Measurement: 2025: USD 1.49 billion → 2035: USD 3.73 billion)
- 11.1.2 Market Volume and Quantity Sold
- 11.1.3 Historical Market Size, 2018-2025
- 11.1.4 Base-Year Market Size, 2025
- 11.2 Market Forecast, 2025-2035
- 11.2.1 Revenue Forecast to 2035
- 11.2.2 Volume Forecast to 2035
- 11.2.3 CAGR and Year-on-Year Growth
- 11.2.4 Incremental Revenue Opportunity
- 11.3 Forecast Assumptions and Scenario Analysis
- 11.3.1 Base-Case Forecast
- 11.3.2 Optimistic and Conservative Scenarios
- 11.3.3 Technology, Pricing and Policy Sensitivities
- 11.4 Market Attractiveness and Growth Outlook
Chapter 12 Australia Non-Invasive Aesthetic Treatment Market Segmentation and Outlook
- 12.1 Segmentation Summary and Market Shares, 2025
- 12.2 Largest and Fastest-Growing Segments
- 12.3 By Service Type - Market Size and Forecast, 2025-2035
- 12.3.1 Segment Definition and Scope
- 12.3.2 Historical Market Size, 2018-2025
- 12.3.3 Revenue Forecast, 2025-2035
- 12.3.4 Volume Forecast, 2025-2035
- 12.3.5 Base-Year Market Share, 2025
- 12.3.6 Segment CAGR and Growth Drivers
- 12.3.7 Subsegment Market Size and Forecast
- 12.3.7.1 Neuromodulator Treatments
- 12.3.7.2 Dermal Filler Treatments
- 12.3.7.3 Energy-Based Skin Rejuvenation
- 12.3.7.4 Skin Resurfacing and Biostimulation
- 12.3.7.5 Non-Invasive Body Contouring
- 12.3.8 Subsegment Pricing and Adoption Trends
- 12.3.9 Leading Suppliers and Competition
- 12.3.10 Regional Demand and Opportunities
- 12.4 By Application - Market Size and Forecast, 2025-2035
- 12.4.1 Segment Definition and Scope
- 12.4.2 Historical Market Size, 2018-2025
- 12.4.3 Revenue Forecast, 2025-2035
- 12.4.4 Volume Forecast, 2025-2035
- 12.4.5 Base-Year Market Share, 2025
- 12.4.6 Segment CAGR and Growth Drivers
- 12.4.7 Subsegment Market Size and Forecast
- 12.4.7.1 Wrinkle and Line Reduction
- 12.4.7.2 Facial Volume and Contour Enhancement
- 12.4.7.3 Skin Quality and Pigmentation
- 12.4.7.4 Hair Reduction and Vascular Aesthetics
- 12.4.7.5 Body Contouring and Tightening
- 12.4.8 Subsegment Pricing and Adoption Trends
- 12.4.9 Leading Suppliers and Competition
- 12.4.10 Regional Demand and Opportunities
- 12.5 By Care Setting - Market Size and Forecast, 2025-2035
- 12.5.1 Segment Definition and Scope
- 12.5.2 Historical Market Size, 2018-2025
- 12.5.3 Revenue Forecast, 2025-2035
- 12.5.4 Volume Forecast, 2025-2035
- 12.5.5 Base-Year Market Share, 2025
- 12.5.6 Segment CAGR and Growth Drivers
- 12.5.7 Subsegment Market Size and Forecast
- 12.5.7.1 Specialist Cosmetic Clinics
- 12.5.7.2 Multi-Service Skin and Laser Clinics
- 12.5.7.3 Dermatology Practices
- 12.5.7.4 Plastic Surgery Practices
- 12.5.7.5 Medical Spa Settings
- 12.5.8 Subsegment Pricing and Adoption Trends
- 12.5.9 Leading Suppliers and Competition
- 12.5.10 Regional Demand and Opportunities
- 12.6 By Customer Type - Market Size and Forecast, 2025-2035
- 12.6.1 Segment Definition and Scope
- 12.6.2 Historical Market Size, 2018-2025
- 12.6.3 Revenue Forecast, 2025-2035
- 12.6.4 Volume Forecast, 2025-2035
- 12.6.5 Base-Year Market Share, 2025
- 12.6.6 Segment CAGR and Growth Drivers
- 12.6.7 Subsegment Market Size and Forecast
- 12.6.7.1 Repeat Maintenance Consumers
- 12.6.7.2 Preventive-Ageing Consumers
- 12.6.7.3 First-Time Aesthetic Consumers
- 12.6.7.4 Corrective-Rejuvenation Consumers
- 12.6.8 Subsegment Pricing and Adoption Trends
- 12.6.9 Leading Suppliers and Competition
- 12.6.10 Regional Demand and Opportunities
- 12.7 By State - Market Size and Forecast, 2025-2035
- 12.7.1 Segment Definition and Scope
- 12.7.2 Historical Market Size, 2018-2025
- 12.7.3 Revenue Forecast, 2025-2035
- 12.7.4 Volume Forecast, 2025-2035
- 12.7.5 Base-Year Market Share, 2025
- 12.7.6 Segment CAGR and Growth Drivers
- 12.7.7 Subsegment Market Size and Forecast
- 12.7.7.1 New South Wales
- 12.7.7.2 Victoria
- 12.7.7.3 Queensland
- 12.7.7.4 Western Australia
- 12.7.7.5 Rest of Australia
- 12.7.8 Subsegment Pricing and Adoption Trends
- 12.7.9 Leading Suppliers and Competition
- 12.7.10 Regional Demand and Opportunities
- 12.8 Segment Growth Comparison
- 12.9 Segment Attractiveness and Priority Matrix
Chapter 13 Australia Non-Invasive Aesthetic Treatment End-Use and Application Market Outlook
- 13.1 End-Use Industry and Customer Demand Structure
- 13.2 Leading Applications and Customer Groups
- 13.3 End-Use Market Size, Share and Forecast
- 13.4 Major End-Use Industry Deep Dives
- 13.4.1 Customer Requirements and Use Cases
- 13.4.2 Demand and Replacement Cycles
- 13.4.3 Technical and Regulatory Considerations
- 13.4.4 Purchasing and Procurement Models
- 13.4.5 Leading Vendors and Distribution Channels
- 13.4.6 Forecast and Commercial Opportunities
- 13.5 Emerging Applications and Cross-Segment Demand
- 13.6 End-Use Industry Investment Priorities
Chapter 14 Australia Non-Invasive Aesthetic Treatment Geographic Market Outlook, 2025-2035
- 14.1 Regional Market Size and Country-Level Shares, 2025
- 14.2 Country Market Size Comparison, 2025
- 14.3 Country Market Forecasts, 2025-2035
- 14.4 Subregional Industrial and Demand Clusters
- 14.5 Intra-Regional Pricing and Cost Differences
- 14.6 Cross-Border Trade and Supply Networks
- 14.7 Regional Supply and Demand Balances
- 14.8 Country Opportunity Comparison and Prioritization
Note: Every listed country is covered on the structure shown under the first country.
Chapter 15 Australia Non-Invasive Aesthetic Treatment Technology, Innovation and Sustainability Outlook
- 15.1 Technology Landscape and Maturity
- 15.2 Product, Process and Service Innovation
- 15.3 AI, Automation and Digital Tools in the Industry
- 15.4 Technology Adoption and Performance Benchmarking
- 15.5 Innovation Pipeline and R&D Investment
- 15.6 Patent and Intellectual Property Trends
- 15.7 Energy Efficiency and Resource Management
- 15.8 Sustainability, Recycling and Circularity
- 15.9 Technology Roadmap, 2025-2035
- 15.10 Risks of Obsolescence and Technology Substitution
Chapter 16 Australia Non-Invasive Aesthetic Treatment Market Key Strategic Imperatives
- 16.1 Growth and Market Entry Priorities
- 16.2 High-Return Products and Segments
- 16.3 Pricing, Profitability and Cost Optimization
- 16.4 Technology Investment and Product Differentiation
- 16.5 Supply Chain Localization and Resilience
- 16.6 Distribution and Customer Acquisition
- 16.7 Partnership, Acquisition and Capacity Strategy
- 16.8 Regional Expansion Priorities
- 16.9 Short-, Medium- and Long-Term Actions
Chapter 17 Competition Outlook
- 17.1 Industry Competition Characteristics
- 17.2 Market Structure and Concentration
- 17.3 Market Share and Competitive Positioning, 2025
- 17.4 Company-Wise Revenue and Product Benchmarking
- 17.5 Production and Service Capacity Benchmarking
- 17.6 Technology, Pricing and Differentiation
- 17.7 Regional Footprint and Distribution Strength
- 17.8 Mergers, Acquisitions and Strategic Alliances
- 17.9 New Entrants and Competitive Threats
- 17.10 Porter's Five Forces and Industry Attractiveness
- 17.11 Competitive Outlook, 2025-2035
Chapter 18 Company Profiles
- 18.1 Company Coverage and Selection Criteria
- 18.2 Laser Clinics Australia
- 18.2.1 Business Description
- 18.2.2 Company Ownership and Geographic Presence
- 18.2.3 Product and Service Portfolio
- 18.2.4 Manufacturing and Operating Footprint
- 18.2.5 Production Capacity and Expansion Plans
- 18.2.6 Financial Performance and Investment
- 18.2.7 Market Share and Competitive Position
- 18.2.8 Technology and Innovation Capabilities
- 18.2.9 Strategic Alliances or Partnerships
- 18.2.10 Recent Developments
- 18.2.11 Growth Strategy and Outlook
- 18.3 SILK Laser Clinics
- 18.4 Australian Skin Clinics
- 18.5 Clear Skincare Clinics
- 18.6 Results Laser Clinic
- 18.7 Evolution Laser Clinic
- 18.8 Cosmetique
- 18.9 Contour Clinics
- 18.10 The Manse Clinic
- 18.11 Renaissance Cosmetic Clinics
- 18.12 Other Relevant Market Participants
Note: Every listed company is profiled on the structure shown under the first company. The company list is preliminary and may change based on research findings, market developments, data availability and client requirements.
Chapter 19 Disclaimer
- 19.1 Research and Forecast Disclaimer
- 19.2 Data Source and Estimation Limitations
Note: The depth of individual sections depends on data availability for this market. Volume, capacity, trade and other unit-based metrics are included where applicable.

