
Biologics and peptides drive parenteral medicine spending
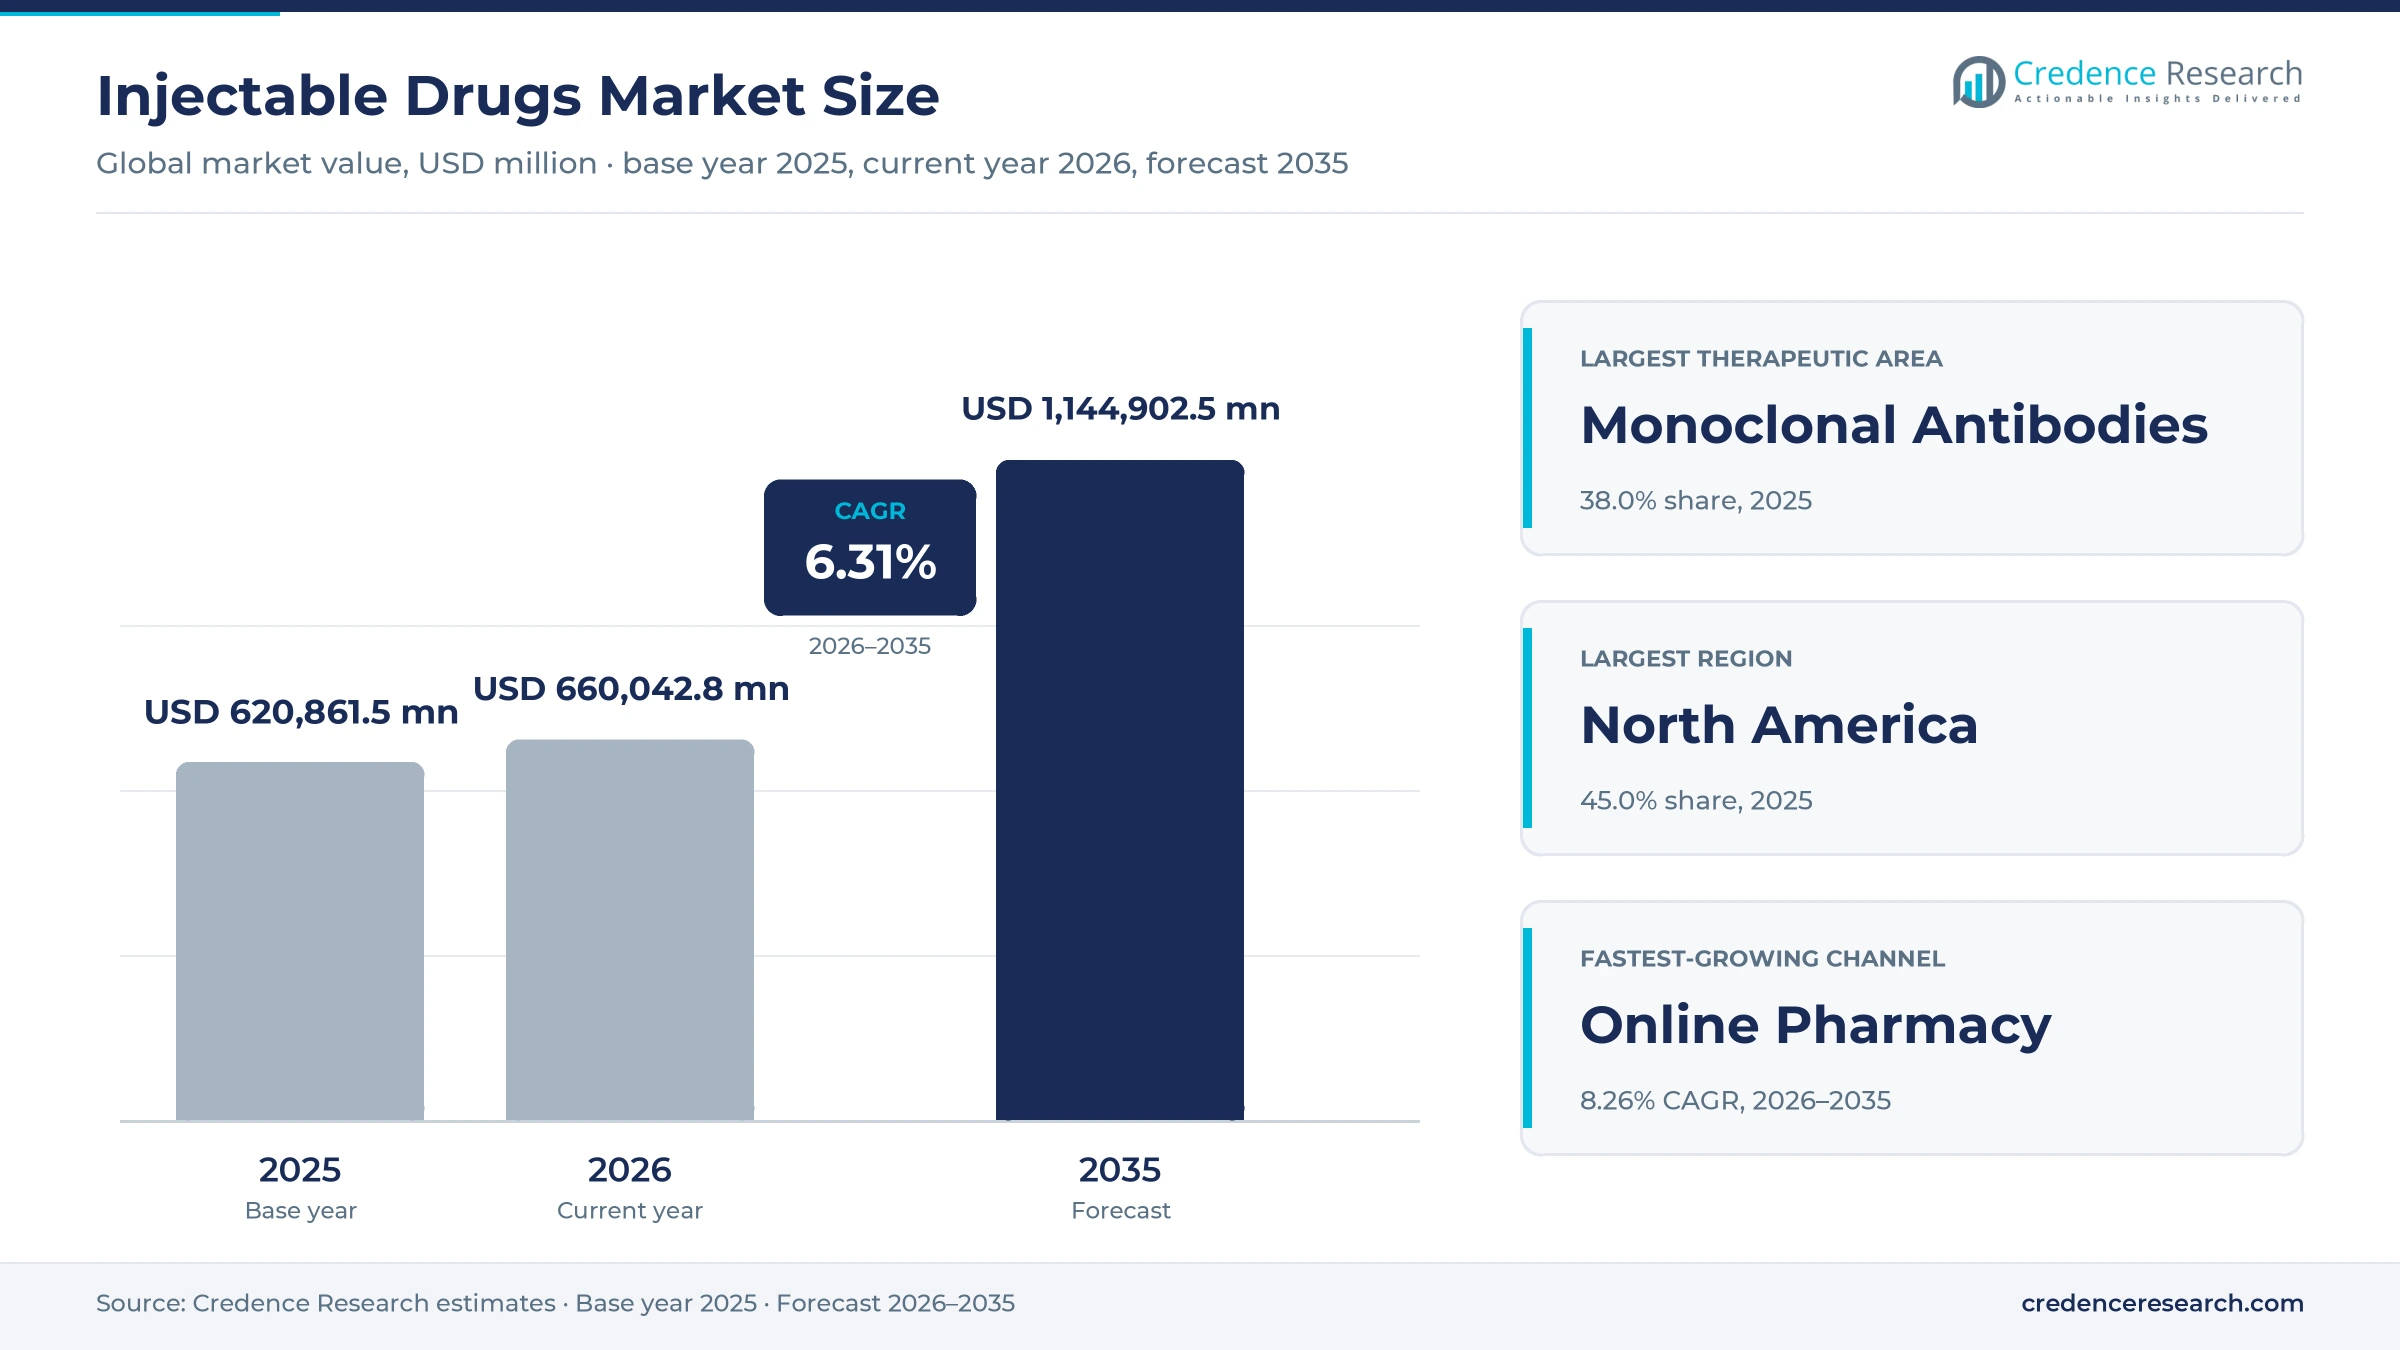
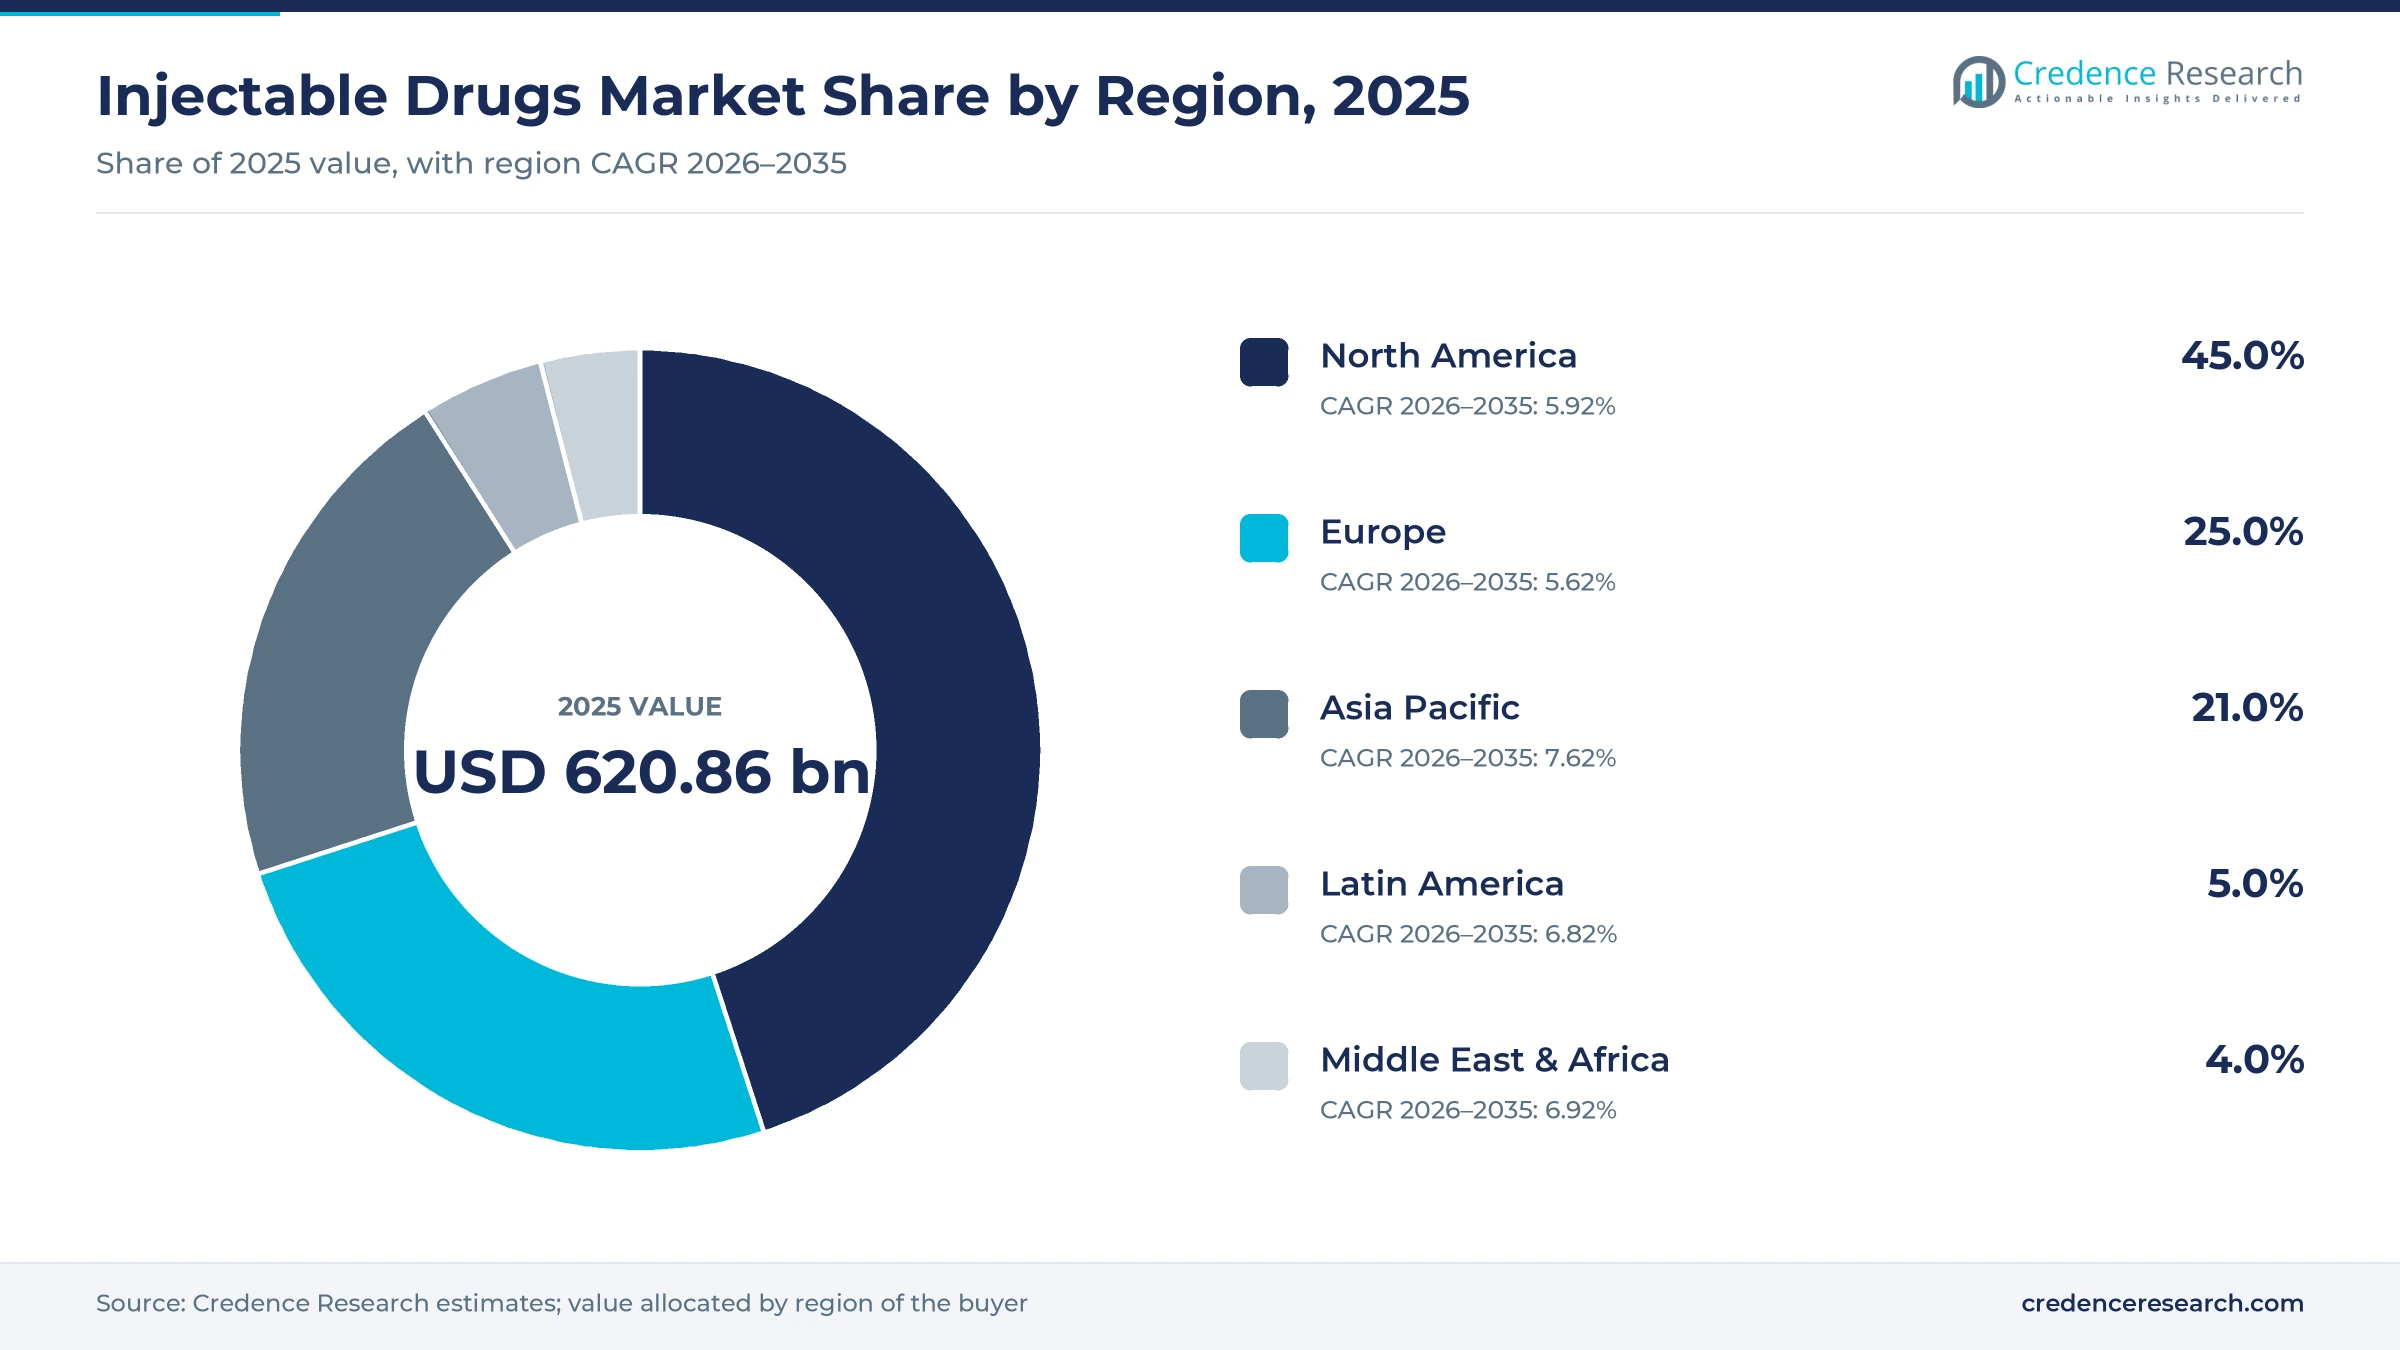
The global injectable drugs market was valued at USD 620.86 billion in 2025 and is projected to increase from USD 660.04 billion in 2026 to USD 1,144.90 billion by 2035, registering a CAGR of 6.31% during 2026–2035. Demand comes from monoclonal antibodies in cancer and immunology, fast growth in peptide hormones for diabetes and obesity, and steady hospital use of anti-infective and anesthetic products. North America held the largest regional share, 45.0% in 2025, because branded biologics carry high prices and broad insurance coverage. Asia Pacific is the fastest-growing region at 7.62% a year, as China, India and Southeast Asia widen access to biologic therapy and local manufacturing. The delivery picture changed in September 2025, when the FDA approved a subcutaneous form of a leading cancer immunotherapy that previously required intravenous infusion. As a result, originators are moving more infused medicines to shorter injections.
Which parenteral medicines and channels does this analysis cover?
The analysis counts prescription medicines given by intravenous, subcutaneous, intramuscular and other parenteral routes, including monoclonal antibodies, peptide hormones, insulin, anti-infectives, cytokines, immunoglobulins, blood factors and anesthetics, valued at manufacturer selling prices. Hospitals buy most infused and acute-care products, while patients fill self-administered pens and syringes through retail and online pharmacies.
Empty delivery devices, contract manufacturing fees, vaccines given as public health programs and medical devices without a medicine sit outside the scope of this analysis. The value chain runs from active ingredient and biologic producers through sterile fill-finish sites to wholesalers, specialty distributors, pharmacies and payers, which set formulary access and patient costs.
Injectable Drugs Market Insights
- The injectable drugs market grows from USD 620.86 billion in 2025 to USD 1,144.90 billion by 2035, a 6.31% CAGR as biologics and peptide therapies widen worldwide.
- North America held 45.0% of global parenteral medicine value in 2025, supported by high prices for branded biologics.
- Monoclonal antibodies led therapeutic areas with 38.0% of 2025 value, because cancer and immunology care depend on them.
- In September 2025, the FDA approved Keytruda Qlex, a subcutaneous pembrolizumab, across most solid tumor indications of the intravenous form.
- In December 2024, Novo Holdings completed its Catalent acquisition, with three fill-finish sites moving to Novo Nordisk to expand sterile capacity.
Monoclonal antibodies lead as peptide hormones gain fastest
Why do monoclonal antibodies lead parenteral spending?
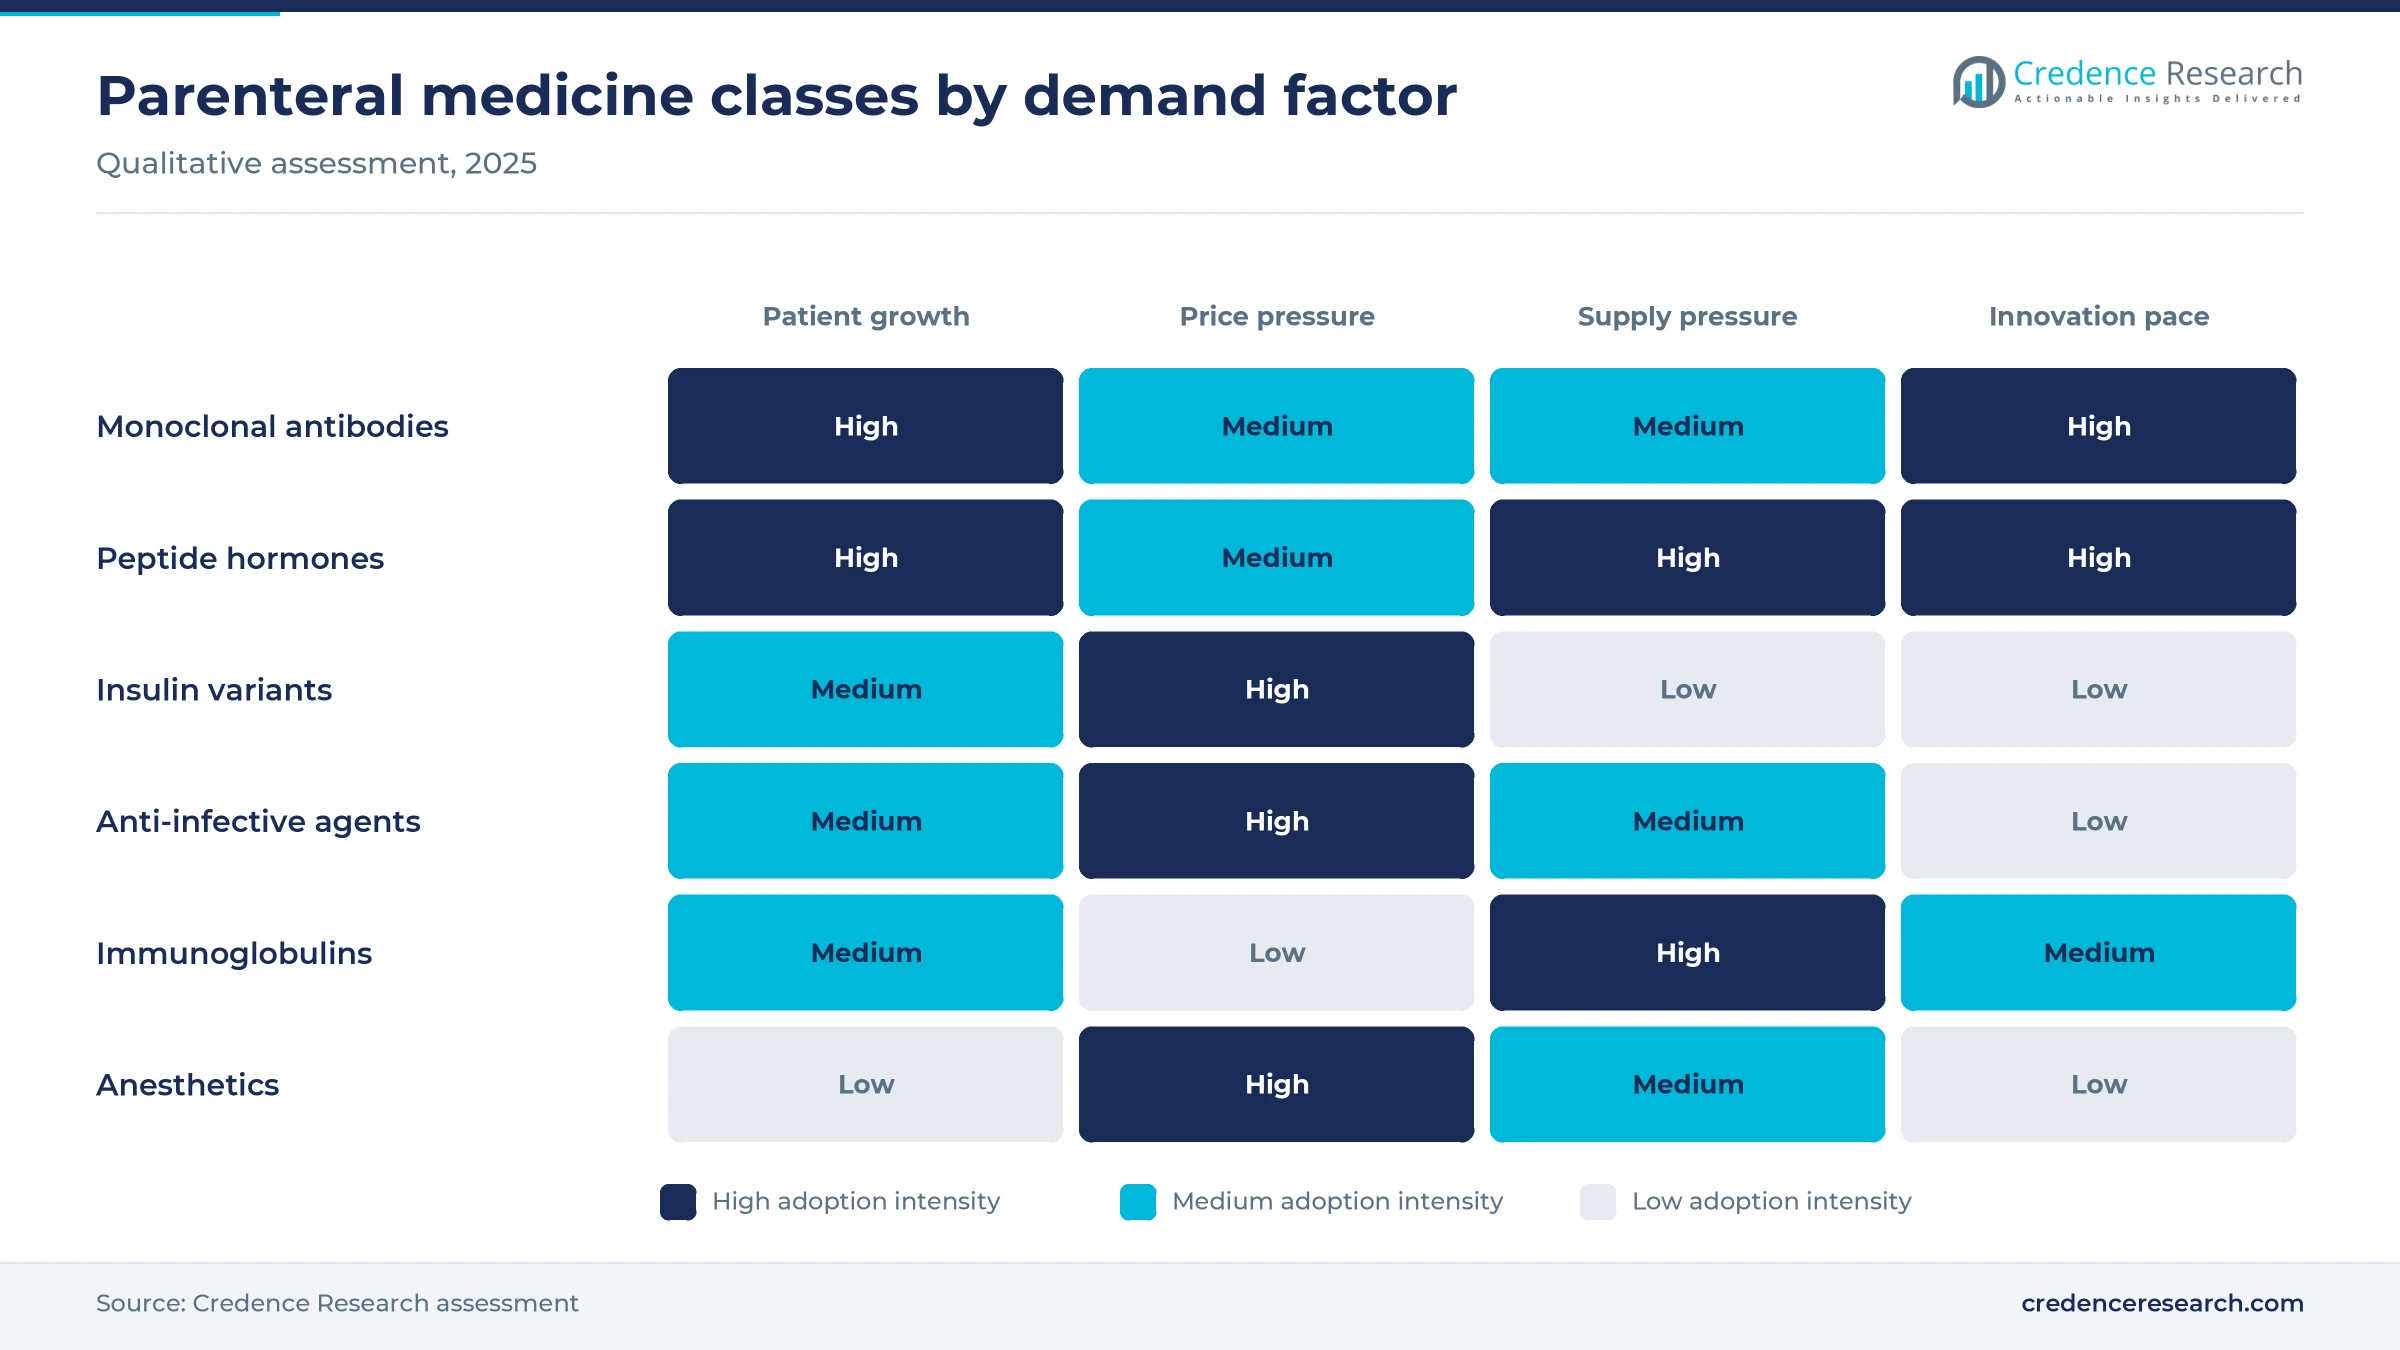
Based on therapeutic area, the market is categorized into anesthetics, anti-infective agents, blood factors, cytokines, immunoglobulins, insulin variants, monoclonal antibodies, peptide hormones and others. Monoclonal Antibodies led with a 38.0% share of 2025 value, because immunotherapy and autoimmune treatment rely on high-value antibody products. Peptide Hormones grow fastest at 7.83% a year, as weekly incretin therapies for diabetes and obesity reach millions of new patients each year.
How do large molecule biologics outpace small molecules?
Based on molecule type, the market is categorized into large molecule biologics and small molecule injectables. Large Molecule Biologics led with a 68.0% share of 2025 value and also grow fastest at 6.68% a year, because antibodies, peptides and enzymes cannot be taken orally. Small molecule products remain essential in hospitals for anesthesia, infection and emergency care. However, many of these products are generic and face steady price erosion.
Where do patients and hospitals obtain parenteral medicines?
Based on distribution channel, the market is categorized into hospital pharmacy, retail pharmacy, online pharmacy and others. Hospital Pharmacy led with a 52.0% share of 2025 value, because infusions, anesthetics and acute anti-infectives are given inside hospitals. Online Pharmacy grows fastest at 8.26% a year, as online pharmacy platforms deliver chilled pens and syringes to patients on chronic therapy.
| Segment Group | Leading Sub-segment | Share, 2025 | Fastest-growing Sub-segment | CAGR, 2026–2035 |
|---|---|---|---|---|
| By Therapeutic Area | Monoclonal Antibodies | 38.0% | Peptide Hormones | 7.83% |
| By Molecule Type | Large Molecule Biologics | 68.0% | Large Molecule Biologics | 6.68% |
| By Distribution Channel | Hospital Pharmacy | 52.0% | Online Pharmacy | 8.26% |
Request a Free Sample
Fill in your details and we'll send you a free sample report.
- Sample data tables & charts
- Research methodology
Chronic disease and biologic pipelines lift demand
How do antibody pipelines sustain demand in cancer care?
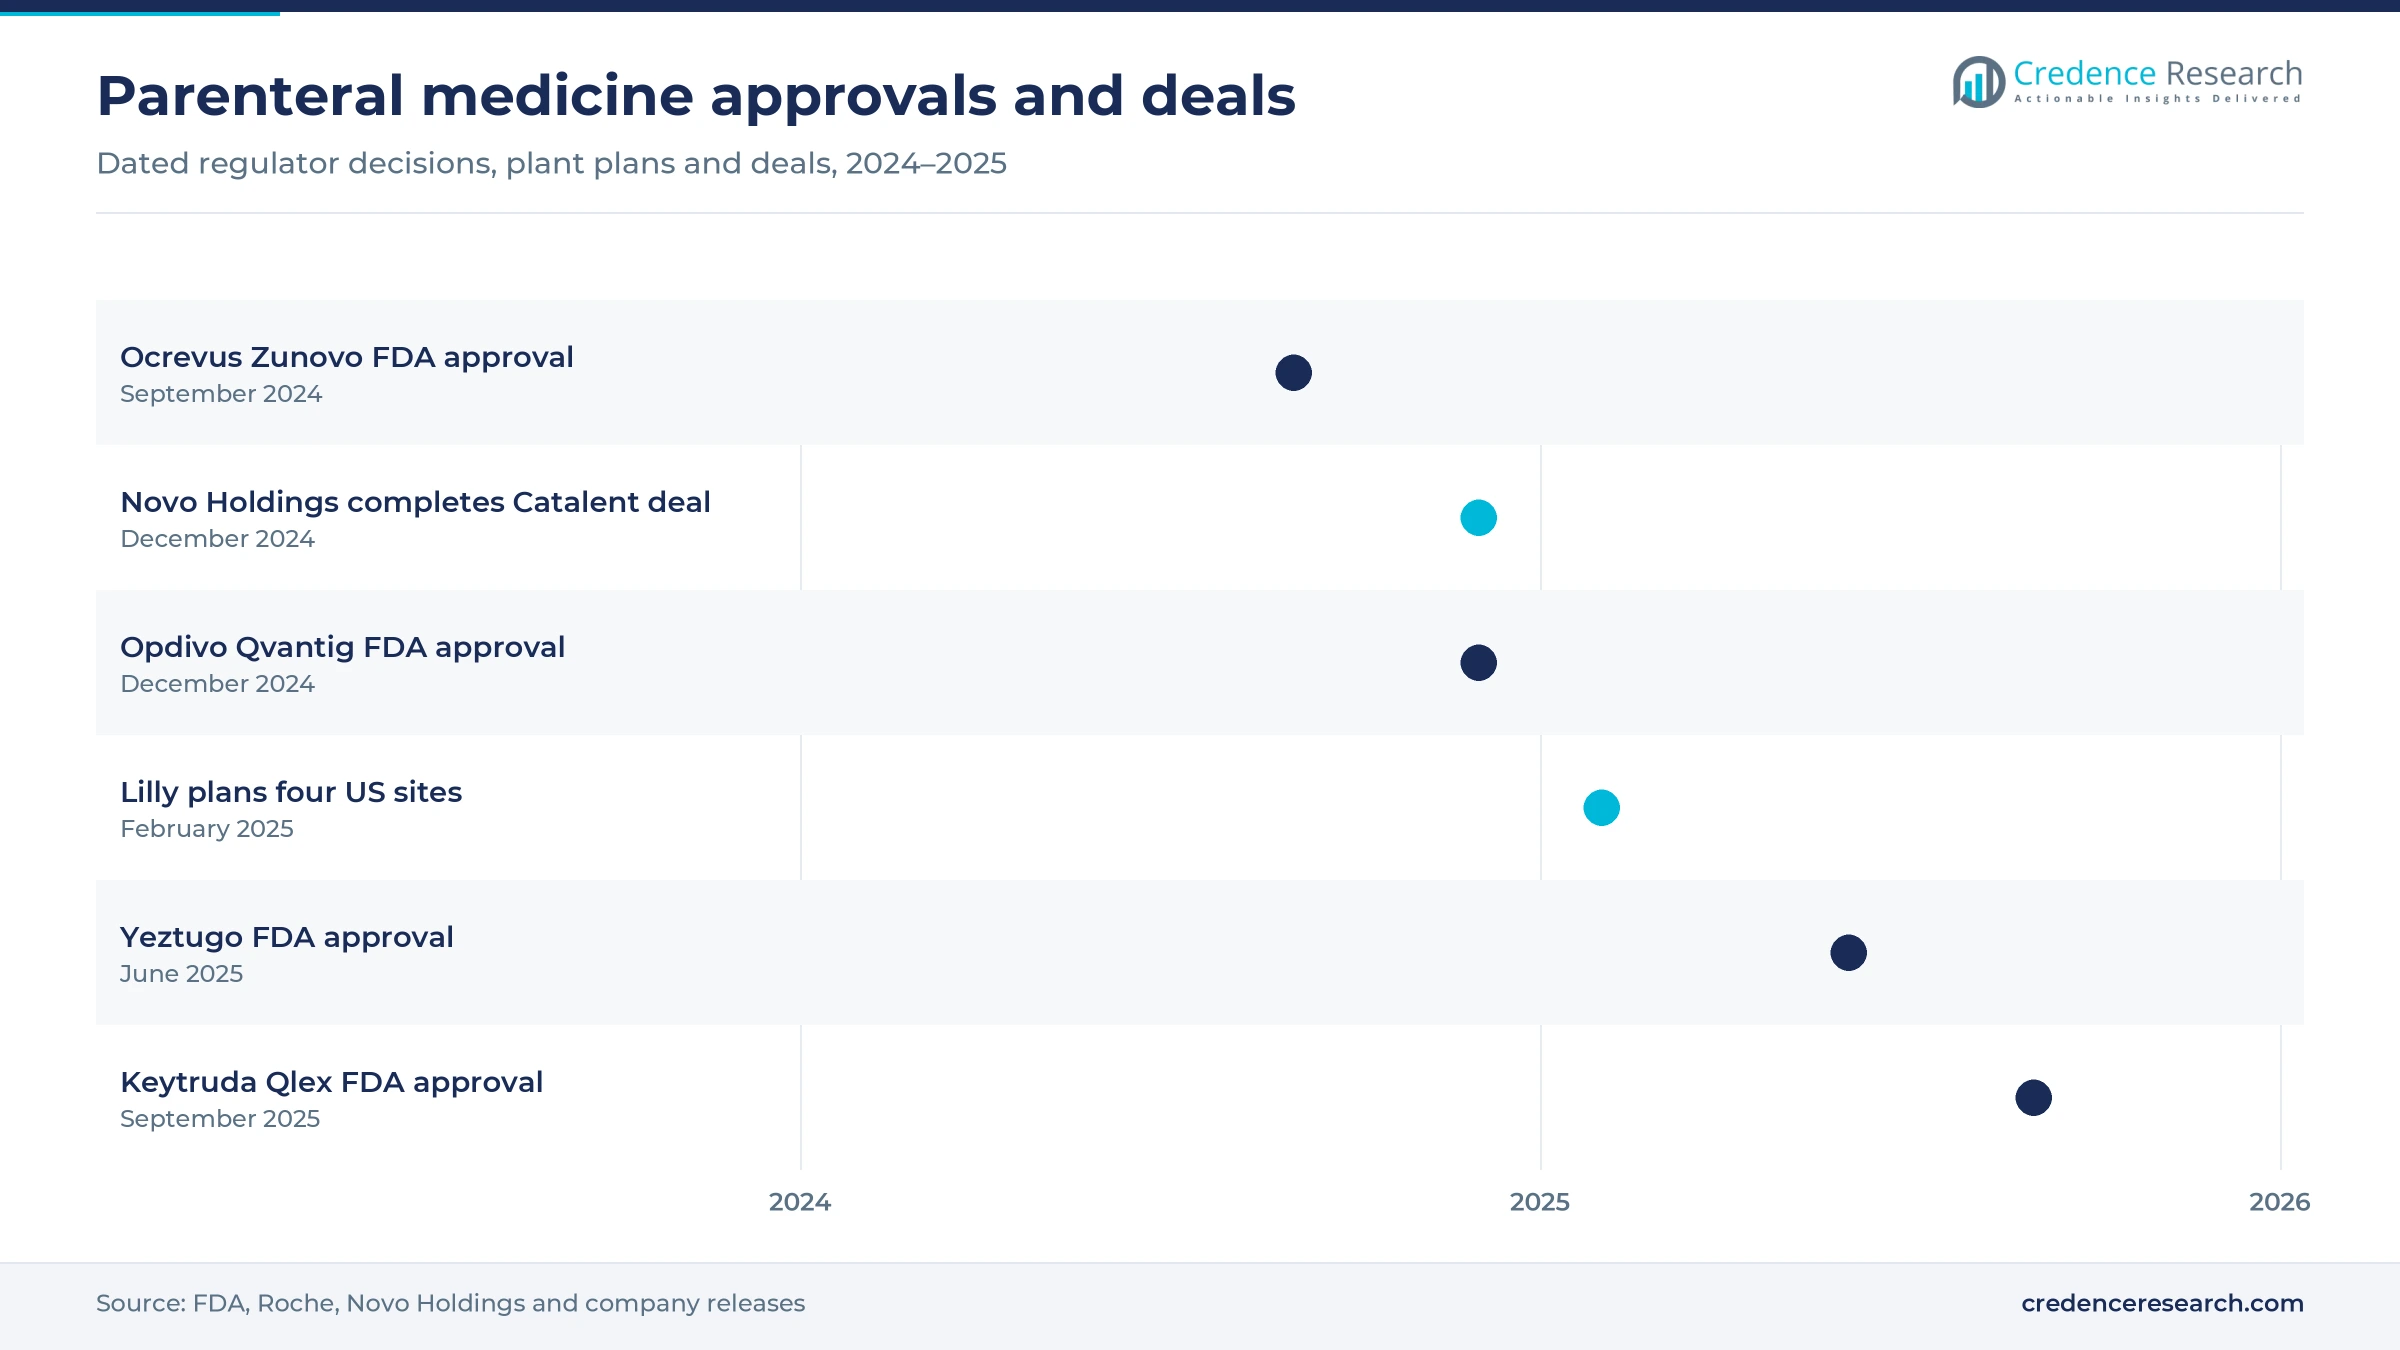
Antibody pipelines sustain demand in cancer care, because checkpoint inhibitors and targeted antibodies are now standard in many tumor types. These medicines are given by infusion or injection, which keeps parenteral routes central to oncology spending. In September 2025, the FDA approved Keytruda Qlex for adults and pediatric patients aged 12 and older across the solid tumor indications of intravenous pembrolizumab. The label allows dosing every three weeks or every six weeks, which suits both community clinics and large cancer centers. As a result, cancer centers can treat more patients in shorter chair times through 2035.
Why do peptide hormones add the largest new patient groups?
Peptide hormones add the largest new patient groups, because incretin therapies for type 2 diabetes and obesity are given as weekly self-injections. Demand for these medicines has repeatedly outpaced supply since 2023, which pushed makers to expand sterile capacity. In February 2025, Eli Lilly and Co. announced four new U.S. manufacturing sites, with one site extending its capacity for injectable therapies. The plan adds about 3,000 permanent jobs and 10,000 construction jobs within five years. In turn, larger supply will let more patients start and stay on treatment.
How does a growing biologic approval stream widen choice?
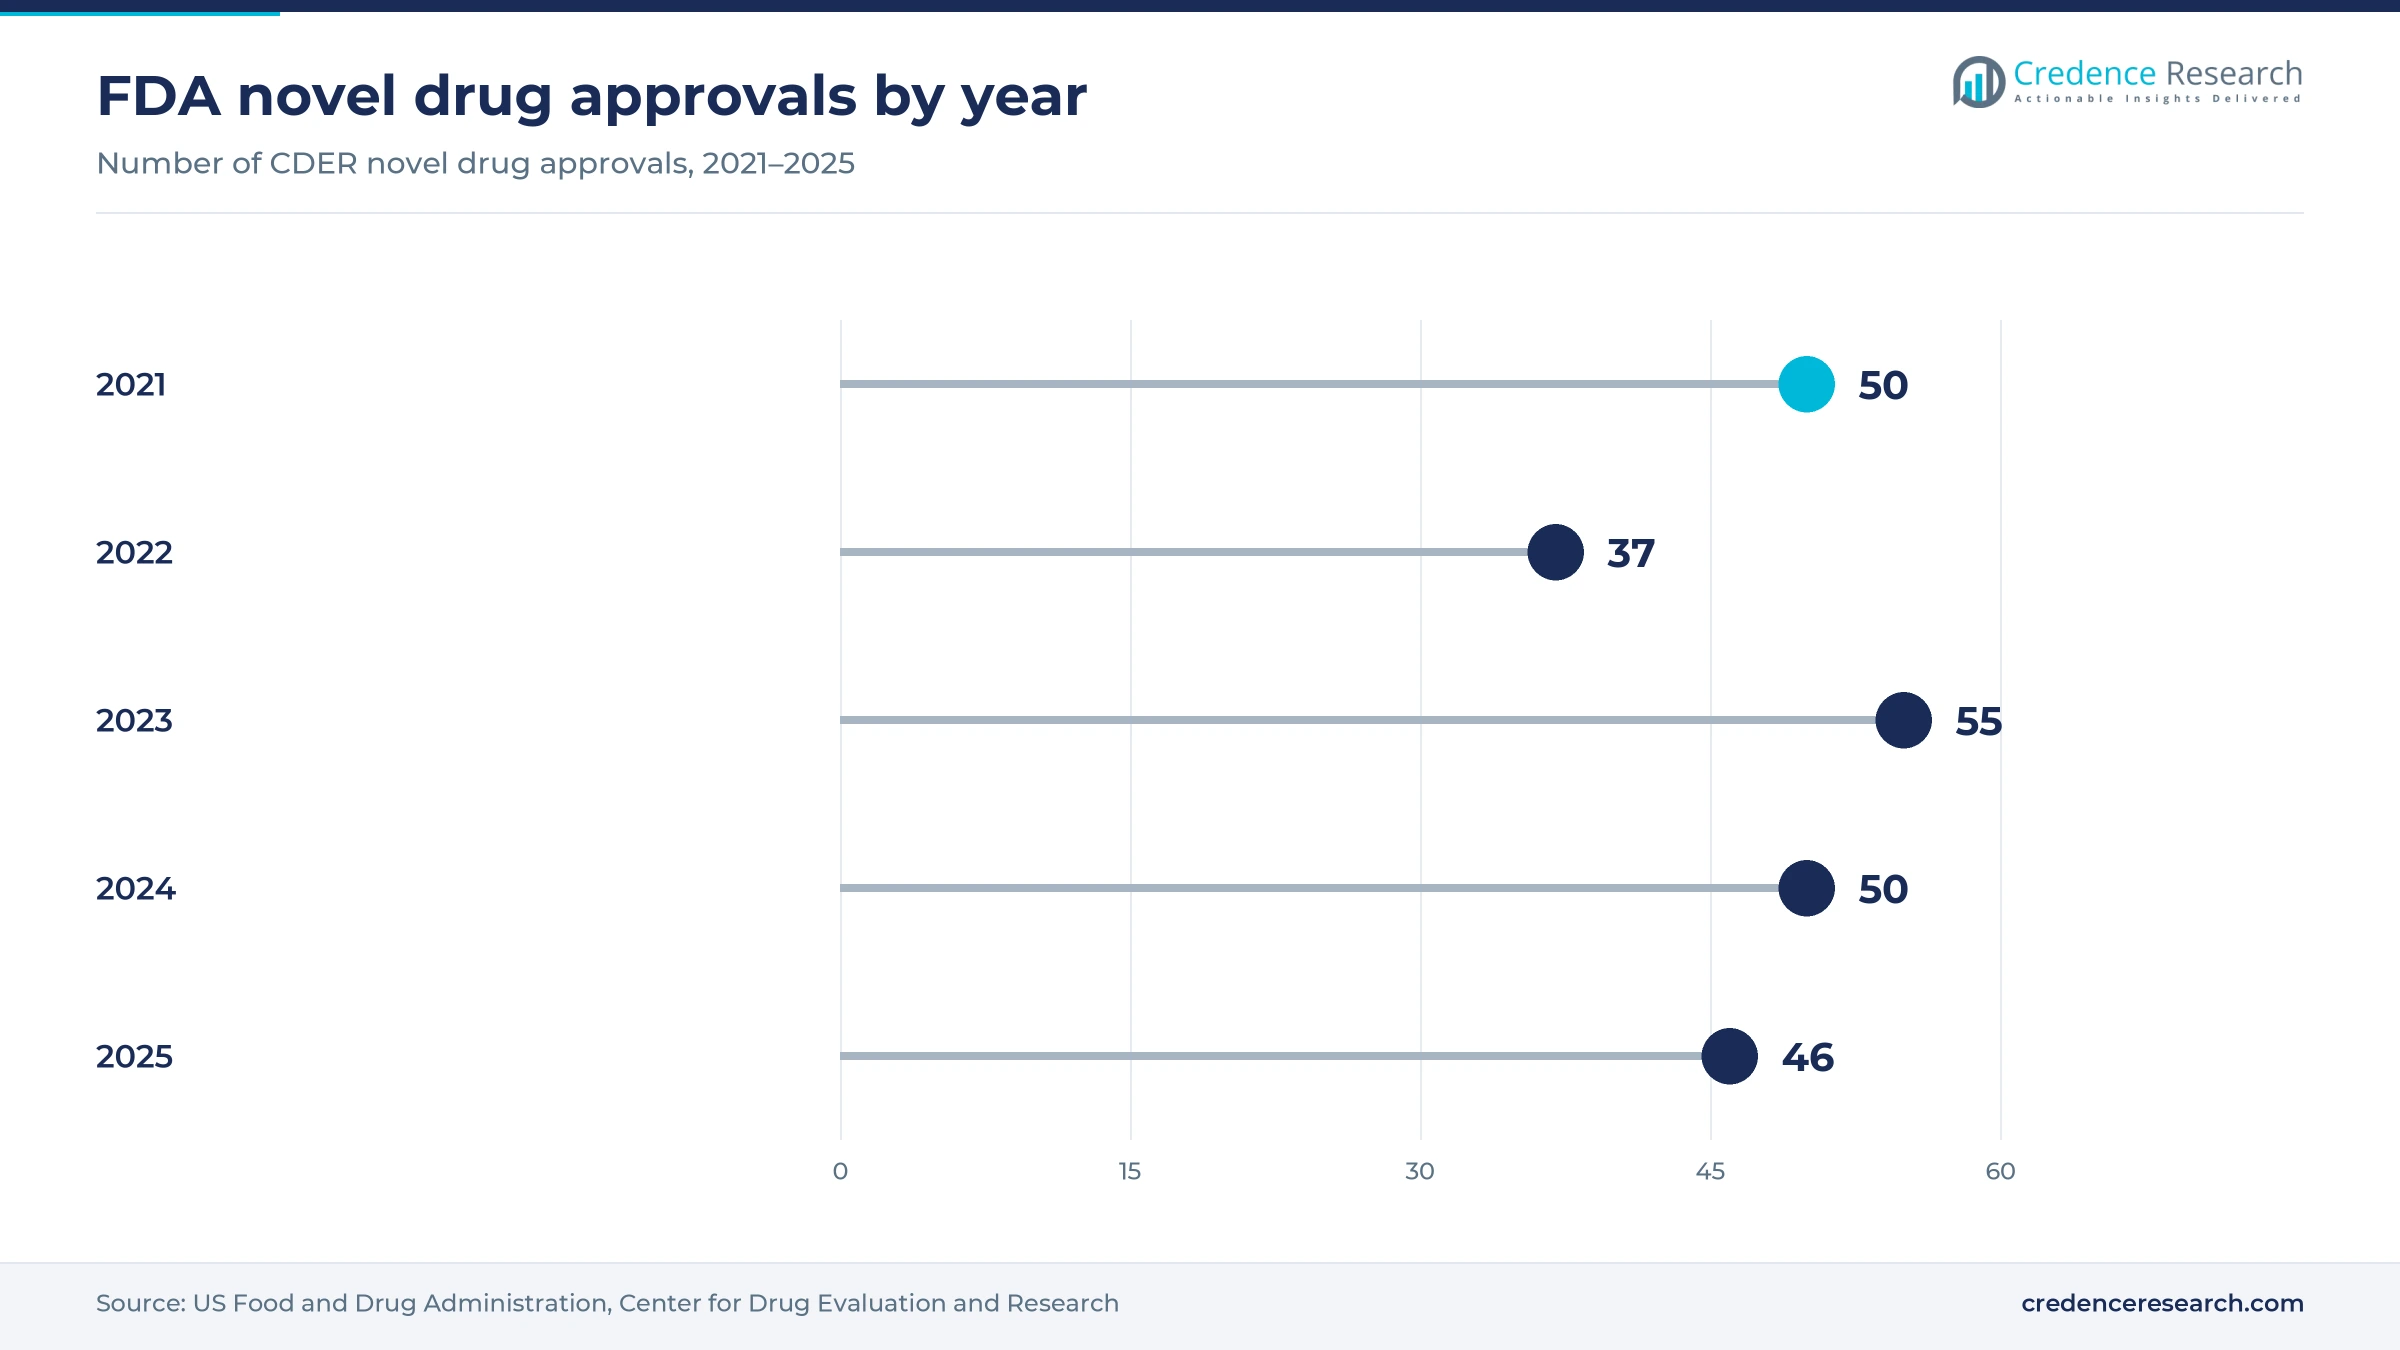
A growing biologic approval stream widens treatment choice, because many new medicines are proteins that require parenteral delivery. The FDA Center for Drug Evaluation and Research approved 50 novel drugs in 2024, including many antibodies and peptides. The agency also approved a record 18 biosimilars for eight reference products in 2024, which brings lower-cost options into hospital and specialty channels. As a result, both innovation and competition expand the number of patients who receive injected therapy.
Why does long-acting prevention open new injected uses?
Long-acting prevention opens new injected uses, because twice-yearly or monthly doses remove the burden of daily pills. In June 2025, the FDA approved Gilead Sciences Inc. Yeztugo, a twice-yearly lenacapavir injection for HIV pre-exposure prophylaxis in adults and adolescents weighing at least 35 kilograms. This approval shows how long-acting formulations can reach healthy people at risk, not only patients with disease. In turn, prevention programs create recurring demand for clinic-given injections.
Subcutaneous forms and long-acting doses reshape care
How is the shift from infusion to subcutaneous injection reshaping care?
The shift from infusion to subcutaneous injection is reshaping care, because shorter administration frees infusion chairs and staff time. In September 2024, Roche announced FDA approval of Ocrevus Zunovo, a twice-yearly injection for relapsing and primary progressive multiple sclerosis that takes about 10 minutes. In the 236-patient OCARINA II trial, more than 92% of participants were satisfied or very satisfied with subcutaneous dosing. In December 2024, the FDA approved Opdivo Qvantig, a subcutaneous nivolumab from Bristol Myers Squibb Co. As a result, more antibody brands now launch with both intravenous and subcutaneous versions.
Why is self-administration rising for chronic therapy?
Self-administration is rising for chronic therapy, because patients with diabetes, obesity and autoimmune disease prefer treatment at home. Prefilled syringes reduce dosing errors and contamination risk compared with vial and syringe preparation by patients. This change moves more volume from hospital pharmacies to retail and online pharmacies over the forecast period. In turn, makers invest in patient training and support programs that keep people adherent between clinic visits.
Can biosimilar competition open wider access to biologics?
Biosimilar competition gives payers a clear opening to widen access, because lower prices allow more patients to start biologic therapy. The FDA approved 18 biosimilars in 2024, including nine interchangeable products that pharmacists may substitute under state rules. Those approvals brought the U.S. total to 60 biosimilars since the first approval in 2015. Biosimilar versions of antibodies for immunology and cancer are already reshaping hospital tenders. As a result, companies with efficient sterile manufacturing can win volume in price-sensitive markets.
Where can connected delivery devices add value?
Connected delivery devices give manufacturers room to add value, because missed or incorrect doses reduce the benefit of chronic therapy. Reusable autoinjectors and smart pens can record dose timing and share it with care teams through phone apps. This information helps clinicians adjust treatment before a patient loses disease control. In turn, companies that pair medicines with adherence data can support payer contracts based on outcomes.
Sterile capacity, cold chain and price pressure limit gains
Why does sterile manufacturing capacity limit supply?
Sterile manufacturing capacity limits supply, because fill-finish lines need aseptic controls, long validation and specialized staff. Shortages of incretin pens since 2023 showed how quickly demand can exceed available capacity for a new class. In December 2024, Novo Holdings completed its acquisition of Catalent, and three fill-finish sites in Italy, the United States and Belgium moved to Novo Nordisk. As a result, capacity is consolidating around large originators, which can squeeze smaller sponsors.
How do cold chain demands raise distribution costs?
Cold chain demands raise distribution costs, because most biologics must stay refrigerated from the plant to the patient. Temperature excursions can ruin a full shipment, which forces distributors to use monitored packaging and faster delivery routes. This problem is most serious in rural areas and in low-income countries with weak power supply. In turn, access to biologics in these settings remains limited, even when prices fall.
Why does price pressure weigh on value growth?
Price pressure weighs on value growth, because payers and governments target high-cost biologics for negotiation and tenders. Biosimilar entry lowers prices for major antibodies once patents expire in Europe and the United States. Generic sterile products, such as older anesthetics and anti-infectives, also face thin margins that discourage new suppliers. As a result, value growth depends heavily on new brands rather than older volume products.
How do injection-site reactions and administration burden slow uptake?
Injection-site reactions and administration burden slow uptake, because some patients avoid needles or stop treatment after side effects. Roche reported that about 49% of trial participants had an injection reaction after the first subcutaneous Ocrevus dose, although all were mild or moderate. Clinic-given products also require nurse time, observation periods and premedication in many cases. For subcutaneous Ocrevus, patients are monitored for at least 60 minutes after the first dose and 15 minutes after later doses. In turn, makers must invest in patient support, which raises the cost of each launch.
North America leads as Asia Pacific gains pace
| Region | Value, 2025 (USD billion) | Share, 2025 | CAGR, 2026–2035 |
|---|---|---|---|
| North America | 279.39 | 45.0% | 5.92% |
| Europe | 155.22 | 25.0% | 5.62% |
| Asia Pacific | 130.38 | 21.0% | 7.62% |
| Latin America | 31.04 | 5.0% | 6.82% |
| Middle East & Africa | 24.83 | 4.0% | 6.92% |
Why does North America hold the largest regional share?
North America held a 45.0% share of 2025 value and grows at 5.92% a year through 2035. The United States drives this position, because branded antibodies, incretin therapies and specialty biologics carry high list prices. Most new subcutaneous forms, including Keytruda Qlex and Opdivo Qvantig, launched first in this market. However, price negotiation and biosimilar entry are lowering net prices for several large brands.
How fast is Asia Pacific adding treated patients?
Asia Pacific held a 21.0% share of 2025 value and is the fastest-growing region at 7.62% a year. China, India and Southeast Asia are expanding public insurance coverage for cancer and diabetes medicines. Local producers of biosimilars and insulin supply affordable options, which expands access in price-sensitive markets. As a result, the region adds the largest number of new patients on injected therapy through 2035.
What shapes demand across Europe?
Europe held a 25.0% share of 2025 value and grows at 5.62% a year, the slowest pace of the five regions. Germany, France, the United Kingdom, Italy and Spain account for most spending through national formularies and hospital tenders. Biosimilar uptake is high across the region, which lowers the cost of antibody treatment for health systems. However, these price controls keep value growth below the global average.
Where is Latin America adding demand?
Latin America held a 5.0% share of 2025 value and grows at 6.82% a year through 2035. Brazil and Mexico lead regional spending, while public programs buy insulin, anti-infectives and selected biologics through national tenders.
What limits growth in the Middle East and Africa?
The Middle East and Africa held a 4.0% share of 2025 value and grows at 6.92% a year through 2035. Gulf states fund branded biologics, while much of Africa relies on donor programs and limited cold chain capacity.
Approvals, plant plans and deals since 2024
| Development | Status and market relevance |
|---|---|
| In September 2024, the FDA approved Roche Ocrevus Zunovo, a twice-yearly subcutaneous ocrelizumab for multiple sclerosis. | Approved; about 10-minute injection that can be given outside infusion centers |
| In December 2024, Novo Holdings completed its acquisition of Catalent, with three fill-finish sites moving to Novo Nordisk. | Completed; adds sterile fill-finish capacity in Italy, the United States and Belgium |
| In February 2025, Eli Lilly and Co. announced plans for four new U.S. manufacturing sites. | Planned; one site extends capacity for injectable therapies |
| In June 2025, the FDA approved Gilead Sciences Yeztugo, a twice-yearly lenacapavir injection for HIV prevention. | Approved; first twice-yearly option for HIV pre-exposure prophylaxis |
| In September 2025, the FDA approved Merck Keytruda Qlex, a subcutaneous pembrolizumab. | Approved; covers most solid tumor indications of intravenous Keytruda |
Delivery platforms and formulation science lead innovation
- Hyaluronidase co-formulation allows large antibody doses to be given under the skin in minutes, which frees infusion capacity.
- Long-acting depot formulations release medicine over months, which supports twice-yearly prevention and maintenance schedules.
- High-concentration biologic formulation reduces injection volume, which makes home self-injection practical for more antibodies.
- Prefilled pen and autoinjector platforms simplify dosing for patients, which supports the move from hospital to home care.
- Continuous aseptic manufacturing shortens production cycles and lowers contamination risk, which helps ease sterile supply limits.
Need a Custom Version of This Report?
Tailor the scope, geography, or segments to your exact requirements.
- Custom geography or segment scope
- Direct access to our analyst team
Biologic originators compete on delivery and capacity
Competition is led by large biologic originators with deep antibody, peptide and specialty portfolios. This report profiles 13 companies, and at least four of them announced FDA approvals or new manufacturing plans in 2024 and 2025. Eli Lilly and Co., Amgen Inc., AbbVie Inc. and Johnson and Johnson Services Inc. compete in immunology, metabolic and specialty medicines, where delivery convenience shapes prescriber choice. Roche, Bristol Myers Squibb Co. and AstraZeneca Plc lead in oncology antibodies and have introduced subcutaneous options since 2024. Gilead Sciences Inc. and GlaxoSmithKline Plc compete in long-acting infectious disease products, while Biogen Inc. and Takeda Pharmaceutical Co. Ltd. serve neurology, rare disease and plasma-derived segments. Baxter International Inc. supplies sterile hospital injectables, and Medtronic Plc participates through drug delivery systems. As a result, competition increasingly centers on delivery format, sterile capacity and access programs.
Companies profiled and their roles in this market
| Company | Type | Role in the market |
|---|---|---|
| Eli Lilly and Co. | Originator | Incretin peptide therapies and new U.S. injectable capacity |
| F. Hoffmann La Roche Ltd. | Originator | Oncology and neurology antibodies including Ocrevus Zunovo |
| Bristol Myers Squibb Co. | Originator | Oncology antibodies including Opdivo Qvantig |
| Gilead Sciences Inc. | Originator | Long-acting lenacapavir for HIV prevention |
| Amgen Inc. | Originator and biosimilars | Biologics and biosimilars across specialty care |
| AbbVie Inc. | Originator | Immunology and specialty biologics |
| Johnson and Johnson Services Inc. | Originator | Immunology and oncology biologics |
| AstraZeneca Plc | Originator | Oncology and respiratory biologics |
| GlaxoSmithKline Plc | Originator | Long-acting infectious disease and respiratory biologics |
| Takeda Pharmaceutical Co. Ltd. | Originator | Plasma-derived therapies and rare disease biologics |
| Biogen Inc. | Originator | Neurology biologics |
| Baxter International Inc. | Sterile products | Hospital injectables and premixed products |
| Medtronic Plc | Device and delivery | Drug delivery systems for parenteral therapy |
Delivery convenience sets the pace of change to 2035
Credence Research's view is that delivery convenience and sterile capacity will set the pace of change through 2035, while chronic disease keeps volumes rising. The overall market grows at 6.31% a year, supported by antibodies in cancer and immunology and by peptide hormones in diabetes and obesity. Biosimilar entry and price negotiation restrain value growth for older brands in the United States and Europe. Companies that pair subcutaneous or long-acting formats with reliable fill-finish capacity will win the most patients.
How Credence Research sized parenteral medicine spending
The report uses 2025 as the base year and 2026 to 2035 as the forecast period. Market values come from the Credence Research model, which builds spending by therapeutic area, molecule type, distribution channel and region. Regional and segment splits are Credence Research estimates informed by FDA approval records, regulator decisions and company press releases. No primary interviews or surveys were used in preparing this edition of the report.
Parenteral medicine spending outlook to 2035
By 2035, the injectable drugs market is projected to reach USD 1,144.90 billion, with growth led by antibodies, peptide hormones and long-acting formulations. Monoclonal antibodies will remain the largest therapeutic area, while subcutaneous versions take share from infused forms. North America keeps the highest spending per patient, although biosimilars and price negotiation limit price growth. Online pharmacies will handle a larger share of chronic self-injected therapy over the decade. As a result, advantage will depend on delivery platforms, sterile capacity and access programs.
Frequently Asked Questions
How big is the global injectable drugs market?
Which therapeutic area leads the injectable drugs market?
Which region leads parenteral medicine spending?
Which distribution channel grows fastest?
How many novel drugs did the FDA approve in 2024?
Why are infused medicines moving to subcutaneous injection?
Who are the leading injectable drug companies?
What restrains growth in injectable drugs?
Table of Content
Chapter 1 Market Segmentation
- 1.1 Segmentation Framework
- 1.1.1 Product and Service Classification
- 1.1.2 Application and End-Use Classification
- 1.1.3 Technology and Solution Classification
- 1.1.4 Customer and Distribution Channel Classification
- 1.1.5 Geographic Segmentation
- 1.1.6 Market Segment Definitions and Boundaries
- 1.2 By Therapeutic Area
- 1.2.1 Monoclonal Antibodies
- 1.2.2 Peptide Hormones
- 1.2.3 Anti-infective Agents
- 1.2.4 Insulin Variants
- 1.2.5 Cytokines
- 1.2.6 Immunoglobulins
- 1.2.7 Blood Factors
- 1.2.8 Anesthetics
- 1.2.9 Others
- 1.3 By Molecule Type
- 1.3.1 Large Molecule Biologics
- 1.3.2 Small Molecule Injectables
Chapter 2 Introduction
- 2.1 Report Objectives and Scope
- 2.2 Product Definition and Industry Terminology
- 2.3 Market Inclusions and Exclusions
- 2.4 Research Process
- 2.4.1 Primary Research and Expert Interviews
- 2.4.2 Secondary Research and Source Review
- 2.4.3 Top-Down and Bottom-Up Estimation
- 2.4.4 Data Triangulation and Verification
- 2.5 Market Size Measurement Basis
- 2.5.1 2025: USD 620.86 billion → 2035: USD 1,144.90 billion
- 2.6 Historical and Forecast Reference Periods
- 2.6.1 Historical Period: 2018-2025
- 2.6.2 Base Year: 2025
- 2.6.3 Forecast Period: 2025-2035
- 2.7 Research Assumptions and Limitations
Chapter 3 Executive Summary
- 3.1 Market Snapshot and Key Findings
- 3.2 Base-Year Market Size, 2025
- 3.3 Forecast Market Size, 2035
- 3.4 Revenue and Volume Growth Outlook
- 3.5 Key Demand and Supply Indicators
- 3.6 Leading Market Segments
- 3.7 Fastest-Growing Market Opportunities
- 3.8 Regional Performance Highlights
- 3.9 Technology and Industry Transformation
- 3.10 Competitive Landscape Summary
- 3.11 Analyst View and Strategic Implications
Chapter 4 Global Injectable Drugs Market Trends and Developments
- 4.1 Historical Industry Development, 2018-2025
- 4.2 Recent Market Trends and Developments
- 4.3 Demand and Customer Behavior Trends
- 4.4 Technology and Product Innovation
- 4.5 Artificial Intelligence, Automation and Digitalization
- 4.6 Local Manufacturing and Supply Chain Realignment
- 4.7 Industry Partnerships, Mergers and Acquisitions
- 4.8 Sustainability and Circular Economy Developments
- 4.9 Government and Private Sector Investment Trends
- 4.10 Emerging Business Models and Commercialization
- 4.11 Industry Developments and Announcements
Chapter 5 Global Injectable Drugs Market Production, Supply and Demand Analysis
- 5.1 Demand Trend and Consumption Analysis, 2018-2025
- 5.2 Demand Forecast, 2025-2035
- 5.3 Production and Output Trend, 2018-2025
- 5.4 Production and Output Forecast, 2025-2035
- 5.5 Installed Capacity and Capacity Utilization
- 5.6 Company-Wise Production Plants and Statistics
- 5.6.1 Installed Production Capacity
- 5.6.2 Actual Production
- 5.6.3 Planned Capacity and Expansion Targets
- 5.7 Supply Chain Structure and Procurement Trends
- 5.8 Supply-Demand Gap and Bottlenecks
- 5.9 Import Dependence and Sourcing Structure
- 5.10 Contract Manufacturing and Outsourcing
- 5.11 Regional Supply and Demand Concentration
Chapter 6 Global Injectable Drugs Market Pricing Analysis
- 6.1 Pricing Structure and Measurement
- 6.2 Historical Pricing Trends, 2018-2025
- 6.3 Pricing Outlook, 2025-2035
- 6.4 Average Selling Price and Unit Economics
- 6.5 Pricing by Product and Market Segment
- 6.6 Geographic Pricing Differences
- 6.7 Key Input, Energy, Labor and Logistics Costs
- 6.8 Contract Pricing and Purchasing Models
- 6.9 Pricing Sensitivity and Competitive Positioning
- 6.10 Price, Margin and Profitability Implications
Chapter 7 Global Injectable Drugs Market Dynamics
- 7.1 Market Growth Drivers
- 7.1.1 Demand-Side Drivers
- 7.1.2 Technology and Innovation Drivers
- 7.1.3 Infrastructure and Investment Drivers
- 7.1.4 Regulatory and Policy Drivers
- 7.2 Market Restraints
- 7.2.1 Cost and Affordability Constraints
- 7.2.2 Technology and Adoption Barriers
- 7.2.3 Supply Chain and Operational Constraints
- 7.3 Market Challenges
- 7.3.1 Competitive Pressure and Margin Erosion
- 7.3.2 Skills, Infrastructure and Implementation Gaps
- 7.4 Emerging Market Opportunities
- 7.5 Market Dynamics Impact and Time-Horizon Assessment
Chapter 8 Global Injectable Drugs Value Chain Analysis
- 8.1 Industry Value Chain Overview
- 8.2 Upstream Suppliers and Critical Inputs
- 8.3 Technology and Component Providers
- 8.4 Manufacturing or Service Delivery
- 8.5 Distribution, Channel Partners and Integrators
- 8.6 Downstream Applications and End Users
- 8.7 Value Addition and Profit Pools
- 8.8 Vertical Integration and Outsourcing
- 8.9 Supplier Concentration and Risk
- 8.10 Supply Chain Localization and Resilience
Chapter 9 Global Injectable Drugs Market Regulations and Policies
- 9.1 Relevant Laws, Standards and Compliance Frameworks
- 9.2 Product, Service, Safety and Quality Requirements
- 9.3 Government Policies, Incentives and Subsidies
- 9.4 Imports, Exports and Trade Barriers
- 9.5 Public Procurement and Local Content Requirements
- 9.6 Environmental and Sustainability Compliance
- 9.7 Upcoming Policy Changes and Market Implications
Chapter 10 Global Injectable Drugs Market Hotspots and Opportunities
- 10.1 Market Opportunity Mapping and Growth Hotspots
- 10.2 High-Growth Applications and Customer Groups
- 10.3 Underserved Markets and White-Space Opportunities
- 10.4 Emerging Technology and Product Opportunities
- 10.5 New Capacity and Investment Hotspots
- 10.6 Market Entry and Expansion Opportunities
- 10.7 Distribution and Partnership Opportunities
- 10.8 Near-Term and Long-Term Commercial Potential
- 10.9 Opportunity Attractiveness and Execution Risks
Chapter 11 Global Injectable Drugs Market Outlook, 2025-2035
- 11.1 Market Size and Analysis
- 11.1.1 Revenue (Market Measurement: 2025: USD 620.86 billion → 2035: USD 1,144.90 billion)
- 11.1.2 Market Volume and Quantity Sold
- 11.1.3 Historical Market Size, 2018-2025
- 11.1.4 Base-Year Market Size, 2025
- 11.2 Market Forecast, 2025-2035
- 11.2.1 Revenue Forecast to 2035
- 11.2.2 Volume Forecast to 2035
- 11.2.3 CAGR and Year-on-Year Growth
- 11.2.4 Incremental Revenue Opportunity
- 11.3 Forecast Assumptions and Scenario Analysis
- 11.3.1 Base-Case Forecast
- 11.3.2 Optimistic and Conservative Scenarios
- 11.3.3 Technology, Pricing and Policy Sensitivities
- 11.4 Market Attractiveness and Growth Outlook
Chapter 12 Global Injectable Drugs Market Segmentation and Outlook
- 12.1 Segmentation Summary and Market Shares, 2025
- 12.2 Largest and Fastest-Growing Segments
- 12.3 By Therapeutic Area - Market Size and Forecast, 2025-2035
- 12.3.1 Segment Definition and Scope
- 12.3.2 Historical Market Size, 2018-2025
- 12.3.3 Revenue Forecast, 2025-2035
- 12.3.4 Volume Forecast, 2025-2035
- 12.3.5 Base-Year Market Share, 2025
- 12.3.6 Segment CAGR and Growth Drivers
- 12.3.7 Subsegment Market Size and Forecast
- 12.3.7.1 Monoclonal Antibodies
- 12.3.7.2 Peptide Hormones
- 12.3.7.3 Anti-infective Agents
- 12.3.7.4 Insulin Variants
- 12.3.7.5 Cytokines
- 12.3.7.6 Immunoglobulins
- 12.3.7.7 Blood Factors
- 12.3.7.8 Anesthetics
- 12.3.7.9 Others
- 12.3.8 Subsegment Pricing and Adoption Trends
- 12.3.9 Leading Suppliers and Competition
- 12.3.10 Regional Demand and Opportunities
- 12.4 By Molecule Type - Market Size and Forecast, 2025-2035
- 12.4.1 Segment Definition and Scope
- 12.4.2 Historical Market Size, 2018-2025
- 12.4.3 Revenue Forecast, 2025-2035
- 12.4.4 Volume Forecast, 2025-2035
- 12.4.5 Base-Year Market Share, 2025
- 12.4.6 Segment CAGR and Growth Drivers
- 12.4.7 Subsegment Market Size and Forecast
- 12.4.7.1 Large Molecule Biologics
- 12.4.7.2 Small Molecule Injectables
- 12.4.8 Subsegment Pricing and Adoption Trends
- 12.4.9 Leading Suppliers and Competition
- 12.4.10 Regional Demand and Opportunities
- 12.5 Segment Growth Comparison
- 12.6 Segment Attractiveness and Priority Matrix
Chapter 13 Global Injectable Drugs Geographic Market Outlook, 2025-2035
- 13.1 Regional Market Size and Share, 2025
- 13.2 Regional Market Forecast, 2025-2035
- 13.3 Regional Pricing, Production and Demand Differences
- 13.4 North America
- 13.4.1 United States
- 13.4.2 Canada
- 13.4.3 Mexico
- 13.5 Europe
- 13.5.1 Germany
- 13.5.2 France
- 13.5.3 Italy
- 13.5.4 United Kingdom
- 13.5.5 Spain
- 13.5.6 Poland
- 13.5.7 Russia
- 13.5.8 Netherlands
- 13.5.9 Belgium
- 13.5.10 Sweden
- 13.5.11 Denmark
- 13.5.12 Norway
- 13.5.13 Rest of Europe
- 13.6 Asia Pacific
- 13.6.1 China
- 13.6.2 India
- 13.6.3 Japan
- 13.6.4 South Korea
- 13.6.5 Thailand
- 13.6.6 Indonesia
- 13.6.7 Vietnam
- 13.6.8 Malaysia
- 13.6.9 Australia
- 13.6.10 Rest of Asia Pacific
- 13.7 Latin America
- 13.7.1 Brazil
- 13.7.2 Argentina
- 13.7.3 Colombia
- 13.7.4 Chile
- 13.7.5 Rest of Latin America
- 13.8 Middle East
- 13.8.1 Saudi Arabia
- 13.8.2 United Arab Emirates
- 13.8.3 Turkey
- 13.8.4 Israel
- 13.8.5 Iran
- 13.8.6 Rest of the Middle East
- 13.9 Africa
- 13.9.1 South Africa
- 13.9.2 Egypt
- 13.9.3 Nigeria
- 13.9.4 Morocco
- 13.9.5 Rest of Africa
- 13.10 Regional Investment, Policy and Supply Chain Differences
- 13.11 Regional Competitive Landscape
- 13.12 Geographic Growth Hotspots
Chapter 14 Global Injectable Drugs Technology, Innovation and Sustainability Outlook
- 14.1 Technology Landscape and Maturity
- 14.2 Product, Process and Service Innovation
- 14.3 AI, Automation and Digital Tools in the Industry
- 14.4 Technology Adoption and Performance Benchmarking
- 14.5 Innovation Pipeline and R&D Investment
- 14.6 Patent and Intellectual Property Trends
- 14.7 Energy Efficiency and Resource Management
- 14.8 Sustainability, Recycling and Circularity
- 14.9 Technology Roadmap, 2025-2035
- 14.10 Risks of Obsolescence and Technology Substitution
Chapter 15 Global Injectable Drugs Market Key Strategic Imperatives
- 15.1 Growth and Market Entry Priorities
- 15.2 High-Return Products and Segments
- 15.3 Pricing, Profitability and Cost Optimization
- 15.4 Technology Investment and Product Differentiation
- 15.5 Supply Chain Localization and Resilience
- 15.6 Distribution and Customer Acquisition
- 15.7 Partnership, Acquisition and Capacity Strategy
- 15.8 Regional Expansion Priorities
- 15.9 Short-, Medium- and Long-Term Actions
Chapter 16 Competition Outlook
- 16.1 Industry Competition Characteristics
- 16.2 Market Structure and Concentration
- 16.3 Market Share and Competitive Positioning, 2025
- 16.4 Company-Wise Revenue and Product Benchmarking
- 16.5 Production and Service Capacity Benchmarking
- 16.6 Technology, Pricing and Differentiation
- 16.7 Regional Footprint and Distribution Strength
- 16.8 Mergers, Acquisitions and Strategic Alliances
- 16.9 New Entrants and Competitive Threats
- 16.10 Porter's Five Forces and Industry Attractiveness
- 16.11 Competitive Outlook, 2025-2035
Chapter 17 Company Profiles
- 17.1 Company Coverage and Selection Criteria
- 17.2 Takeda Pharmaceutical Co. Ltd.
- 17.2.1 Business Description
- 17.2.2 Company Ownership and Geographic Presence
- 17.2.3 Product and Service Portfolio
- 17.2.4 Manufacturing and Operating Footprint
- 17.2.5 Production Capacity and Expansion Plans
- 17.2.6 Financial Performance and Investment
- 17.2.7 Market Share and Competitive Position
- 17.2.8 Technology and Innovation Capabilities
- 17.2.9 Strategic Alliances or Partnerships
- 17.2.10 Recent Developments
- 17.2.11 Growth Strategy and Outlook
- 17.3 AbbVie Inc.
- 17.4 Amgen Inc.
- 17.5 AstraZeneca Plc
- 17.6 Baxter International Inc.
- 17.7 Biogen Inc.
- 17.8 Bristol Myers Squibb Co.
- 17.9 Eli Lilly and Co.
- 17.10 F. Hoffmann La Roche Ltd.
- 17.11 Gilead Sciences Inc.
- 17.12 GlaxoSmithKline Plc
- 17.13 Johnson and Johnson Services Inc.
- 17.14 Medtronic Plc
- 17.15 Other Relevant Market Participants
Note: Every listed company is profiled on the structure shown under the first company. The company list is preliminary and may change based on research findings, market developments, data availability and client requirements.
Chapter 18 Disclaimer
- 18.1 Research and Forecast Disclaimer
- 18.2 Data Source and Estimation Limitations
Note: The depth of individual sections depends on data availability for this market. Volume, capacity, trade and other unit-based metrics are included where applicable.

