
Aging populations and safer labels lift hormone replacement
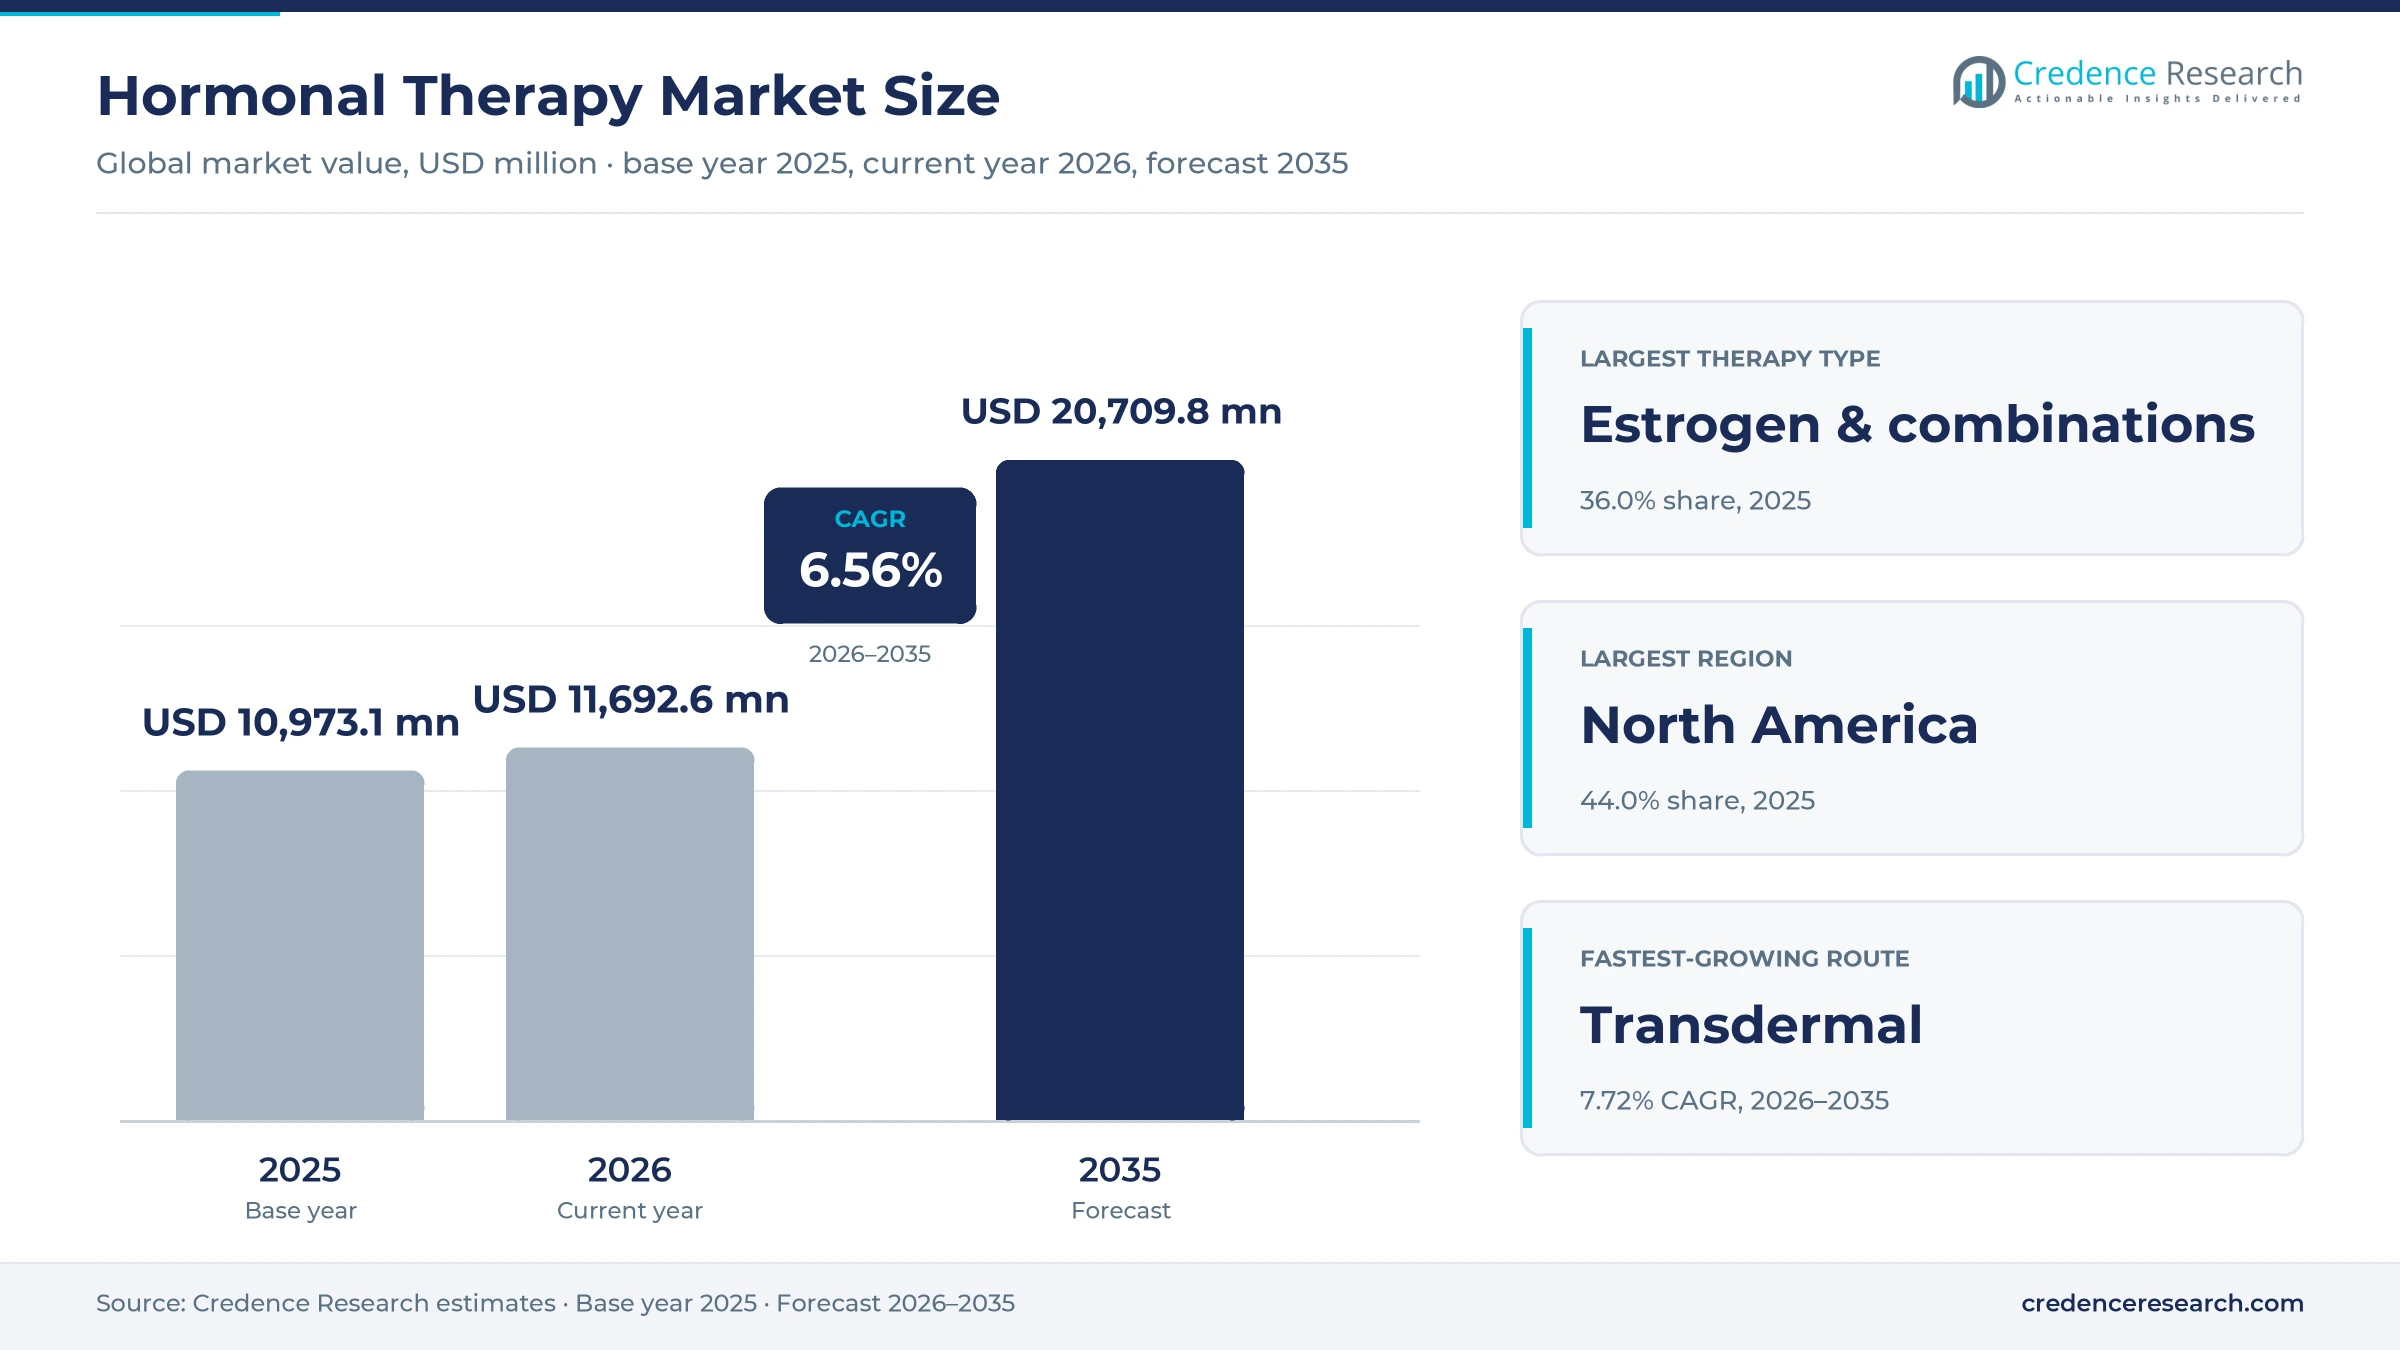
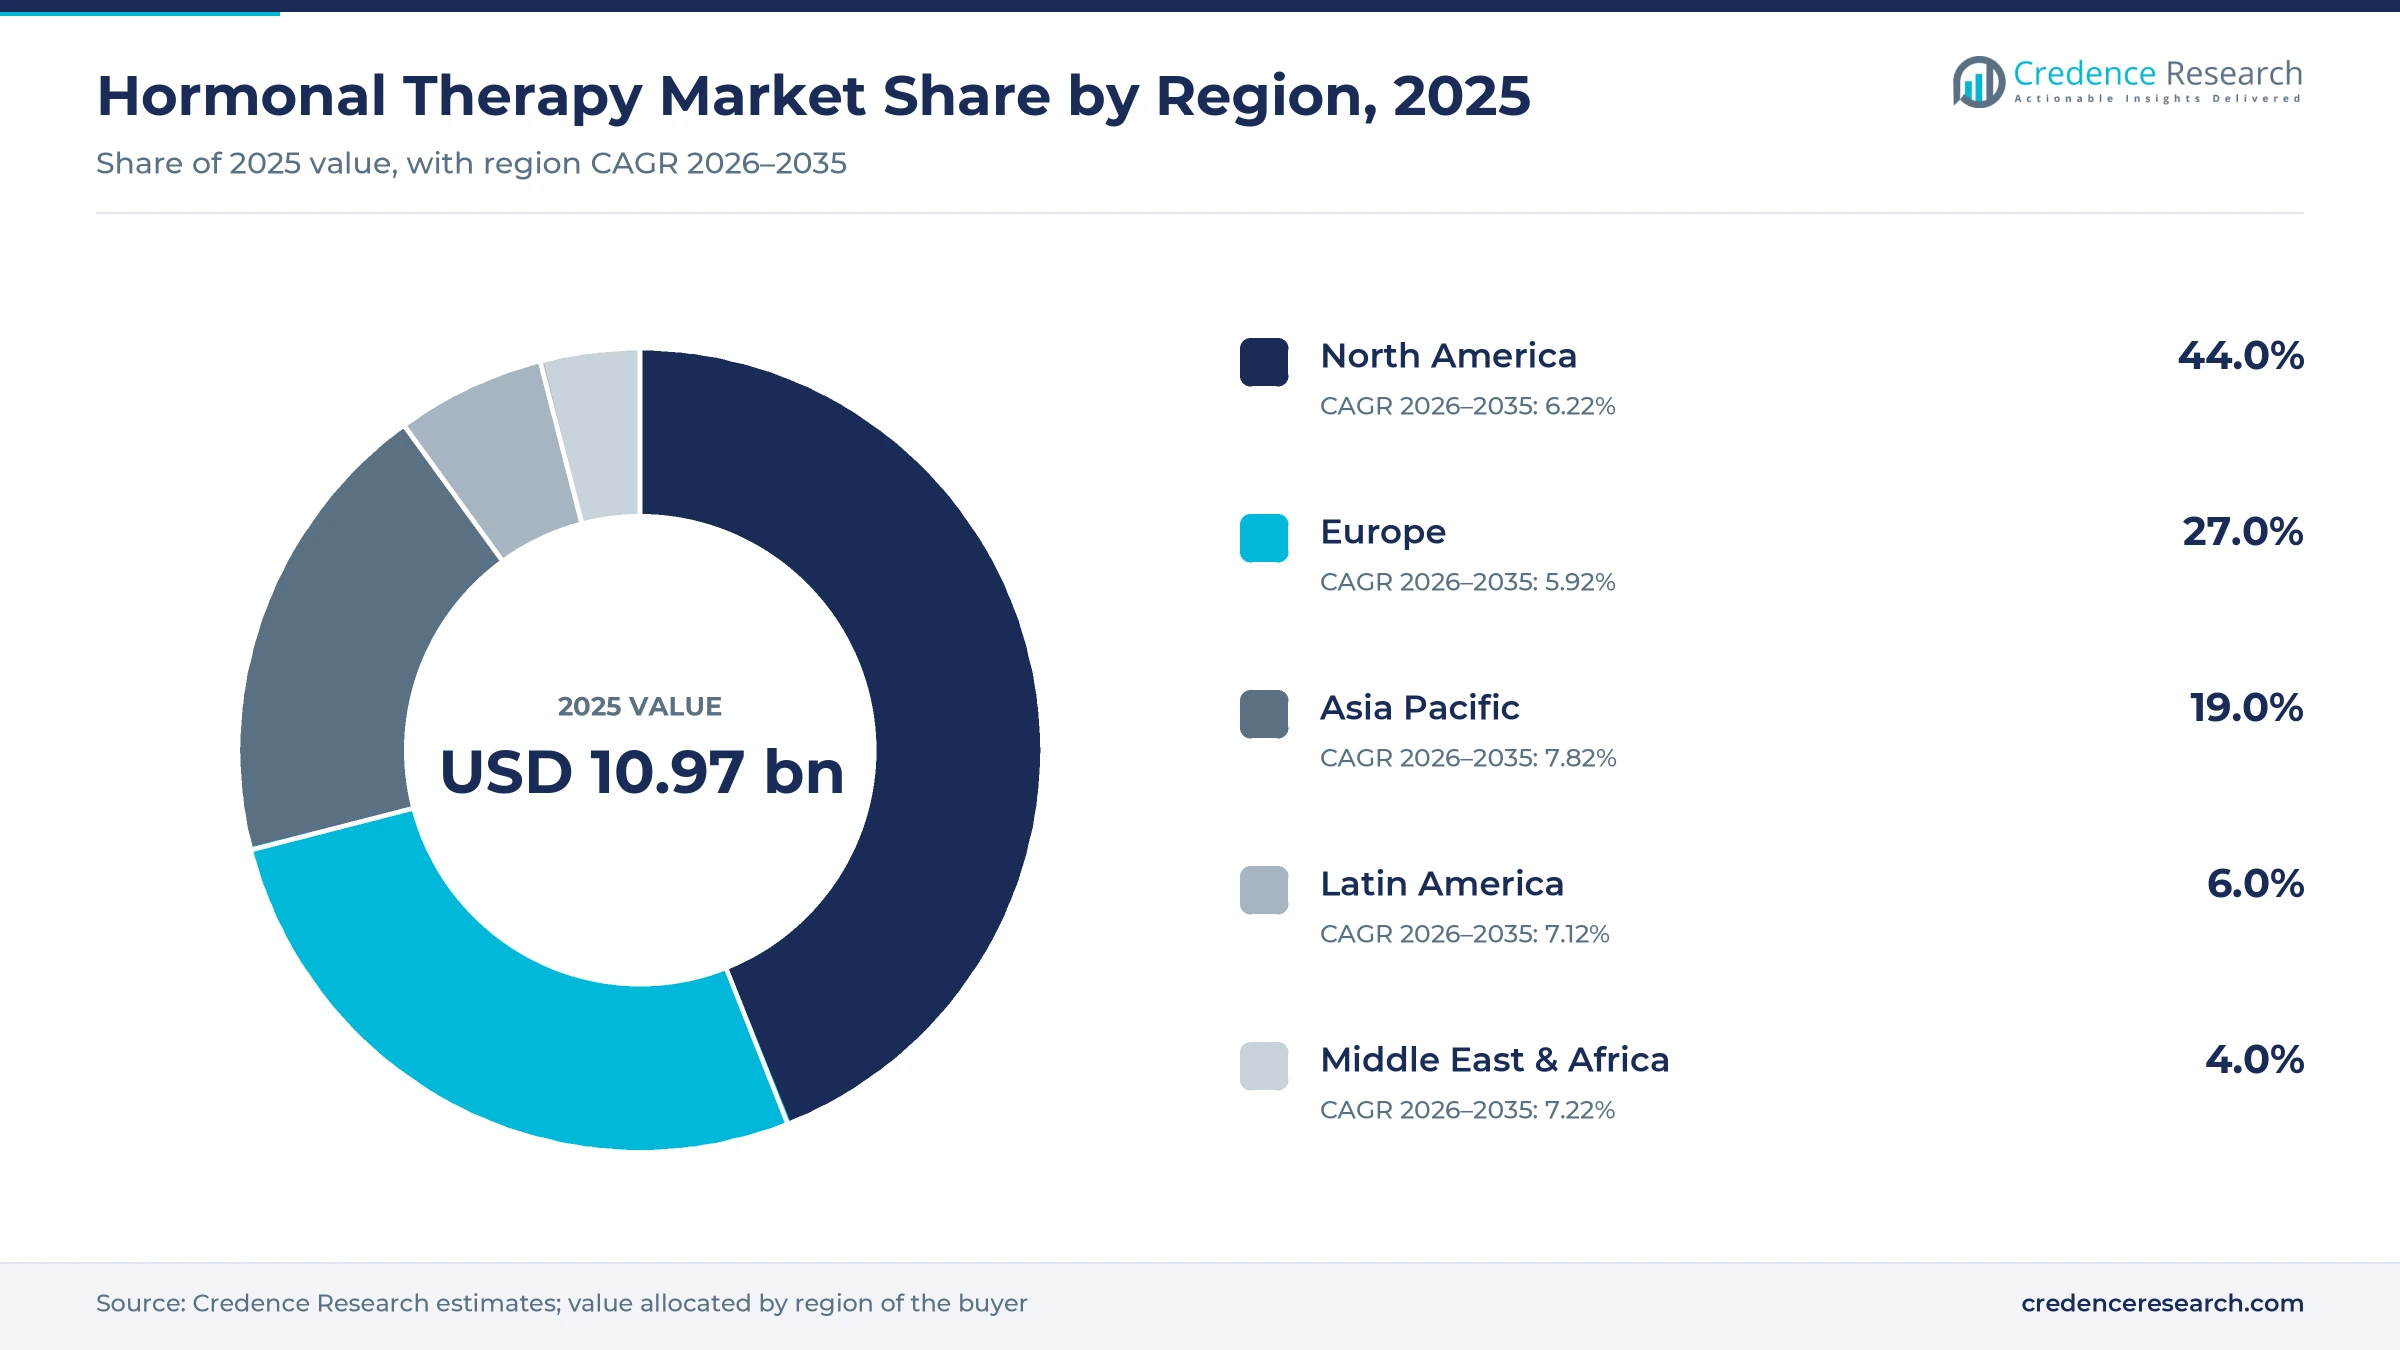
The global hormonal therapy market was valued at USD 10.97 billion in 2025 and is projected to increase from USD 11.69 billion in 2026 to USD 20.71 billion by 2035, registering a CAGR of 6.56% during 2026–2035. Demand comes from women treated for menopause symptoms, adults and children with growth hormone deficiency, people with an underactive thyroid and men with low testosterone. North America held the largest regional share, 44.0% in 2025, because the U.S. combines high branded prices with wide insurance cover for endocrine care. Asia Pacific is the fastest-growing region at 7.82% a year, as aging populations in China, Japan and South Korea raise diagnosis and treatment rates. The main regulatory change came in November 2025, when the U.S. Food and Drug Administration began removing broad boxed warnings from menopausal hormone products.
Which hormone replacement medicines are counted?
The market counts manufacturer revenue from prescription medicines that replace or supplement hormones the body no longer makes in sufficient amounts. It covers estrogen and estrogen-progestogen products for menopause, recombinant growth hormone, thyroid hormone tablets and testosterone gels, patches, injections and pellets. Buyers include hospital pharmacies, retail pharmacies and drug stores, online pharmacies, insurers and patients paying out of pocket.
The scope excludes hormonal contraceptives, fertility hormones and hormone-blocking cancer medicines such as those used for breast and prostate tumors. Compounded bioidentical products, dietary supplements and diagnostic hormone tests are also left out, because they are not approved replacement medicines.
Hormonal Therapy Market Insights
- The hormonal therapy market grows from USD 10.97 billion in 2025 to USD 20.71 billion by 2035, a 6.56% CAGR over 2026–2035, as label warnings ease and more aging adults seek treatment.
- North America held 44.0% of global hormone replacement value in 2025, reflecting high branded prices and broad insurance cover in the U.S.
- Estrogen and combination products led therapy types with 36.0% of 2025 value, because menopause affects every woman who reaches midlife.
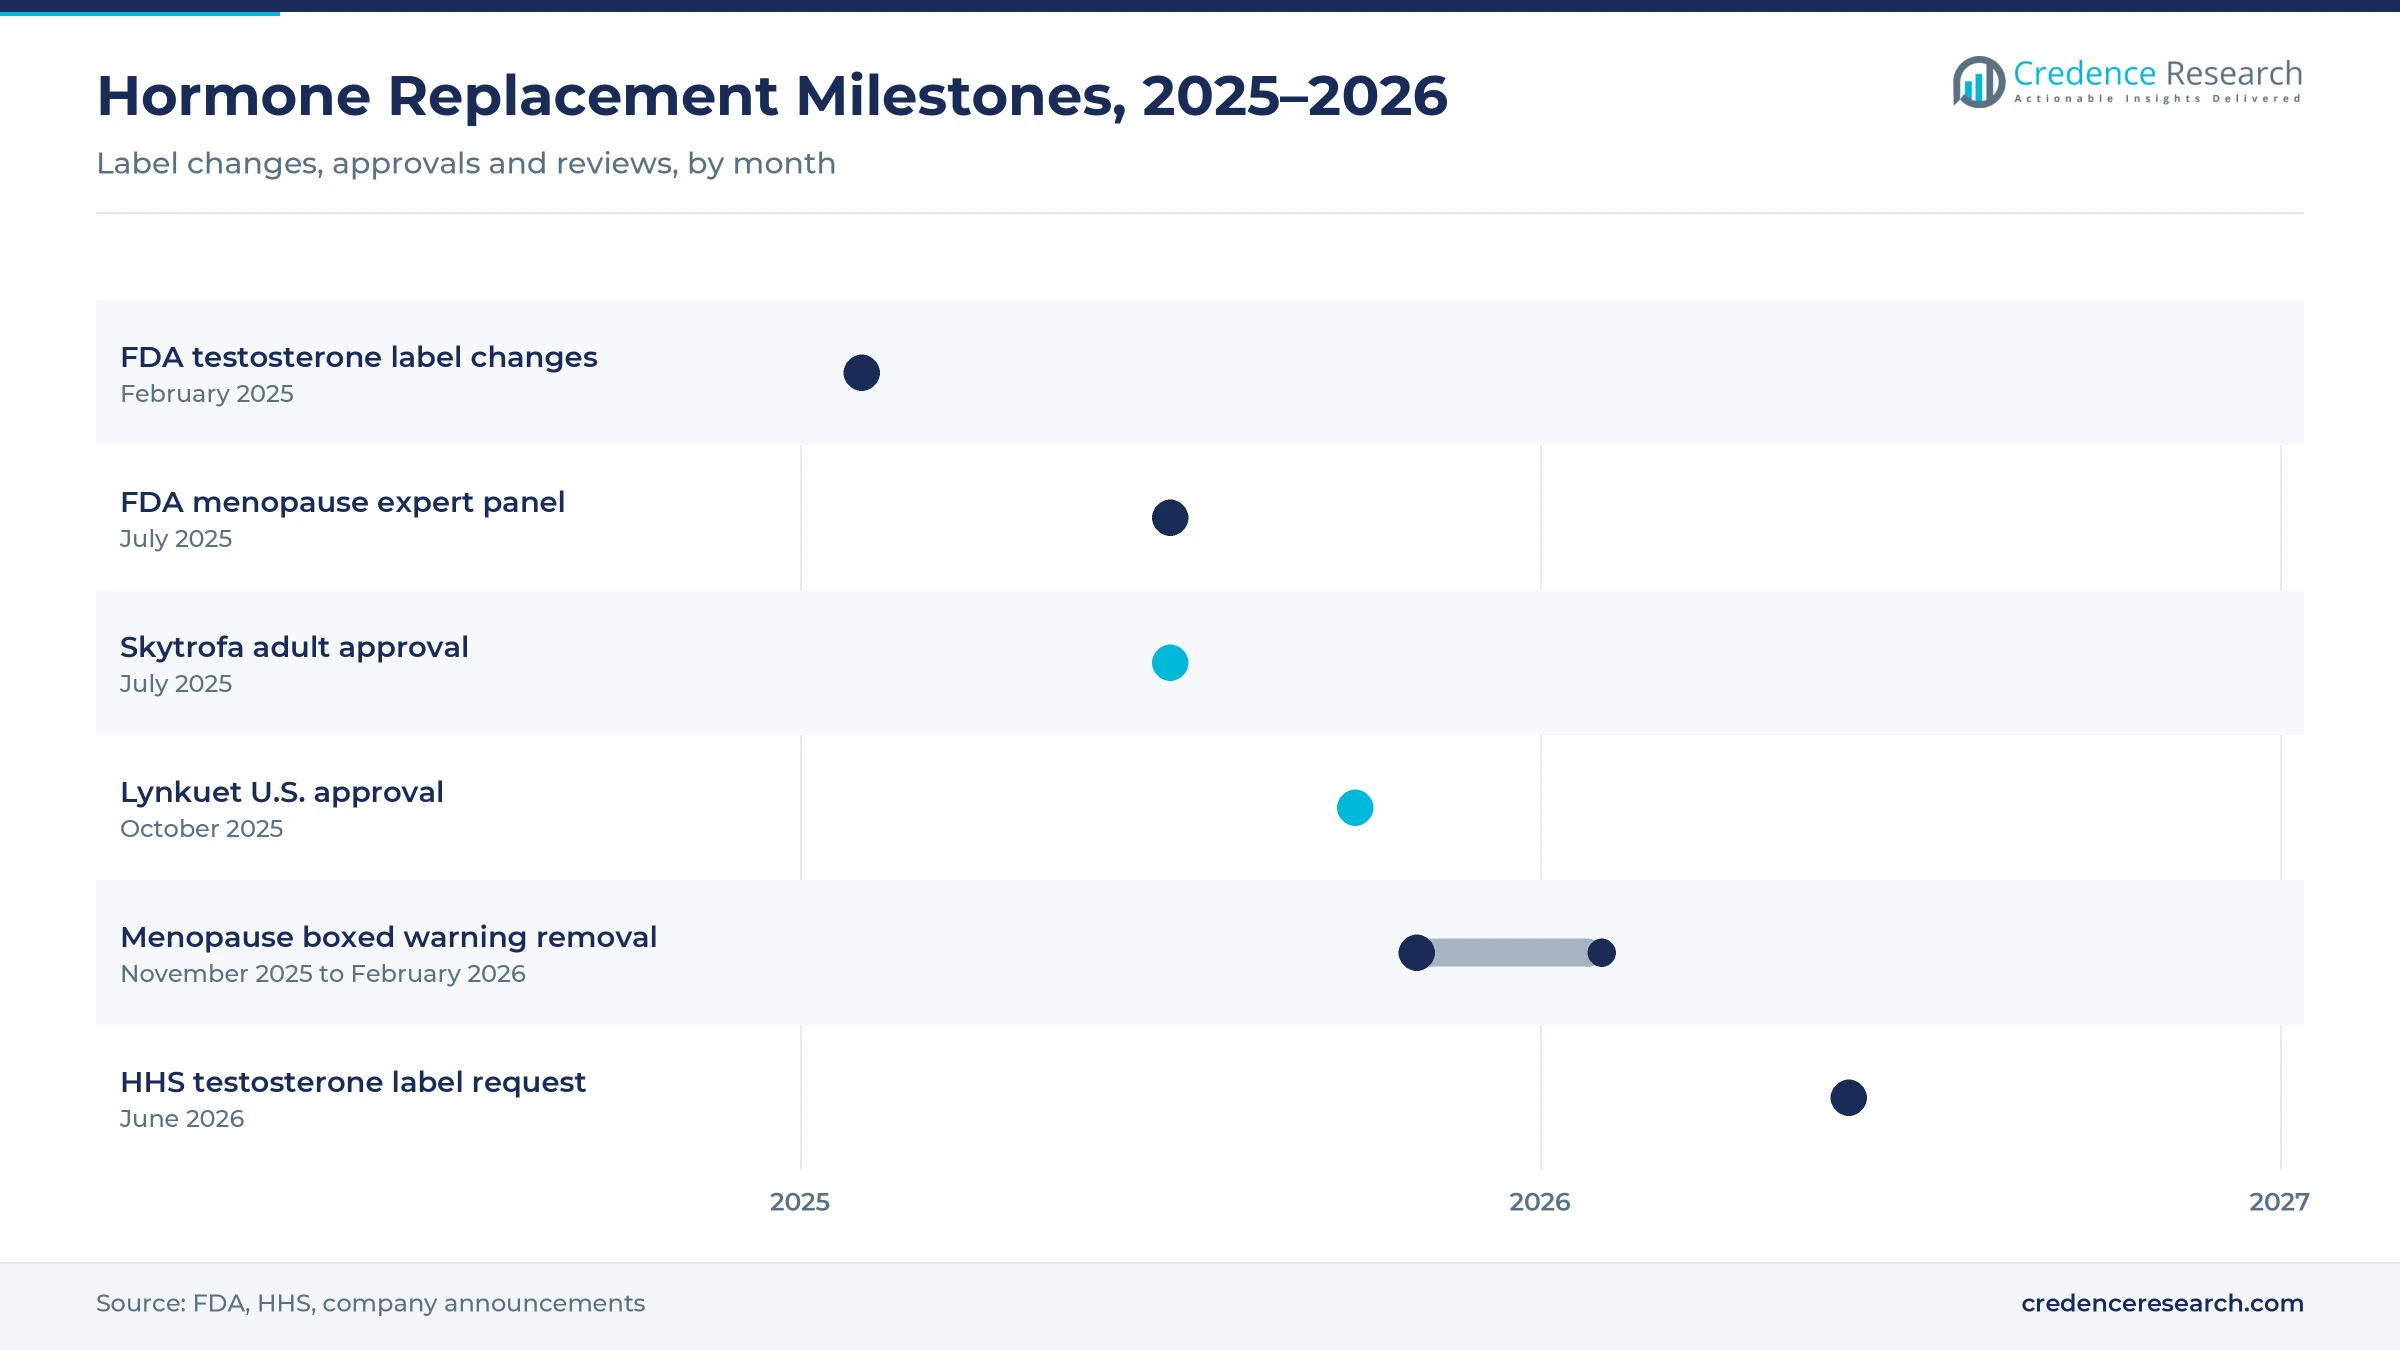
- In February 2026, the FDA approved revised labels for six menopausal hormone products, removing boxed warning statements on heart disease, breast cancer and dementia.
- Ascendis Pharma announced U.S. approval in July 2025 of once-weekly Skytrofa for adults with growth hormone deficiency, extending long-acting options beyond children.
Estrogen products and oral tablets hold the most value
Why do estrogen products hold the largest share?
Based on therapy type, the market is categorized into estrogen and combinations replacement therapy, growth hormone replacement therapy, thyroid hormone replacement therapy and testosterone hormone replacement therapy. Estrogen & Combinations Replacement Therapy led with a 36.0% share of 2025 value, because menopause symptoms affect a very large group of women. Estrogen products also grow fastest at 7.06% a year, as easing U.S. label warnings bring women back to treatment.
How do menopause and deficiency states divide demand?
Based on indication, the market is categorized into menopause, hypothyroidism, male hypogonadism and growth hormone deficiency. Menopause led with a 37.0% share of 2025 value, because hot flashes, sleep problems and bone loss drive long courses of treatment. Menopause grows fastest at 7.06% a year, as clinicians revisit treatment for women within 10 years of menopause onset.
Why do oral tablets still lead hormone delivery?
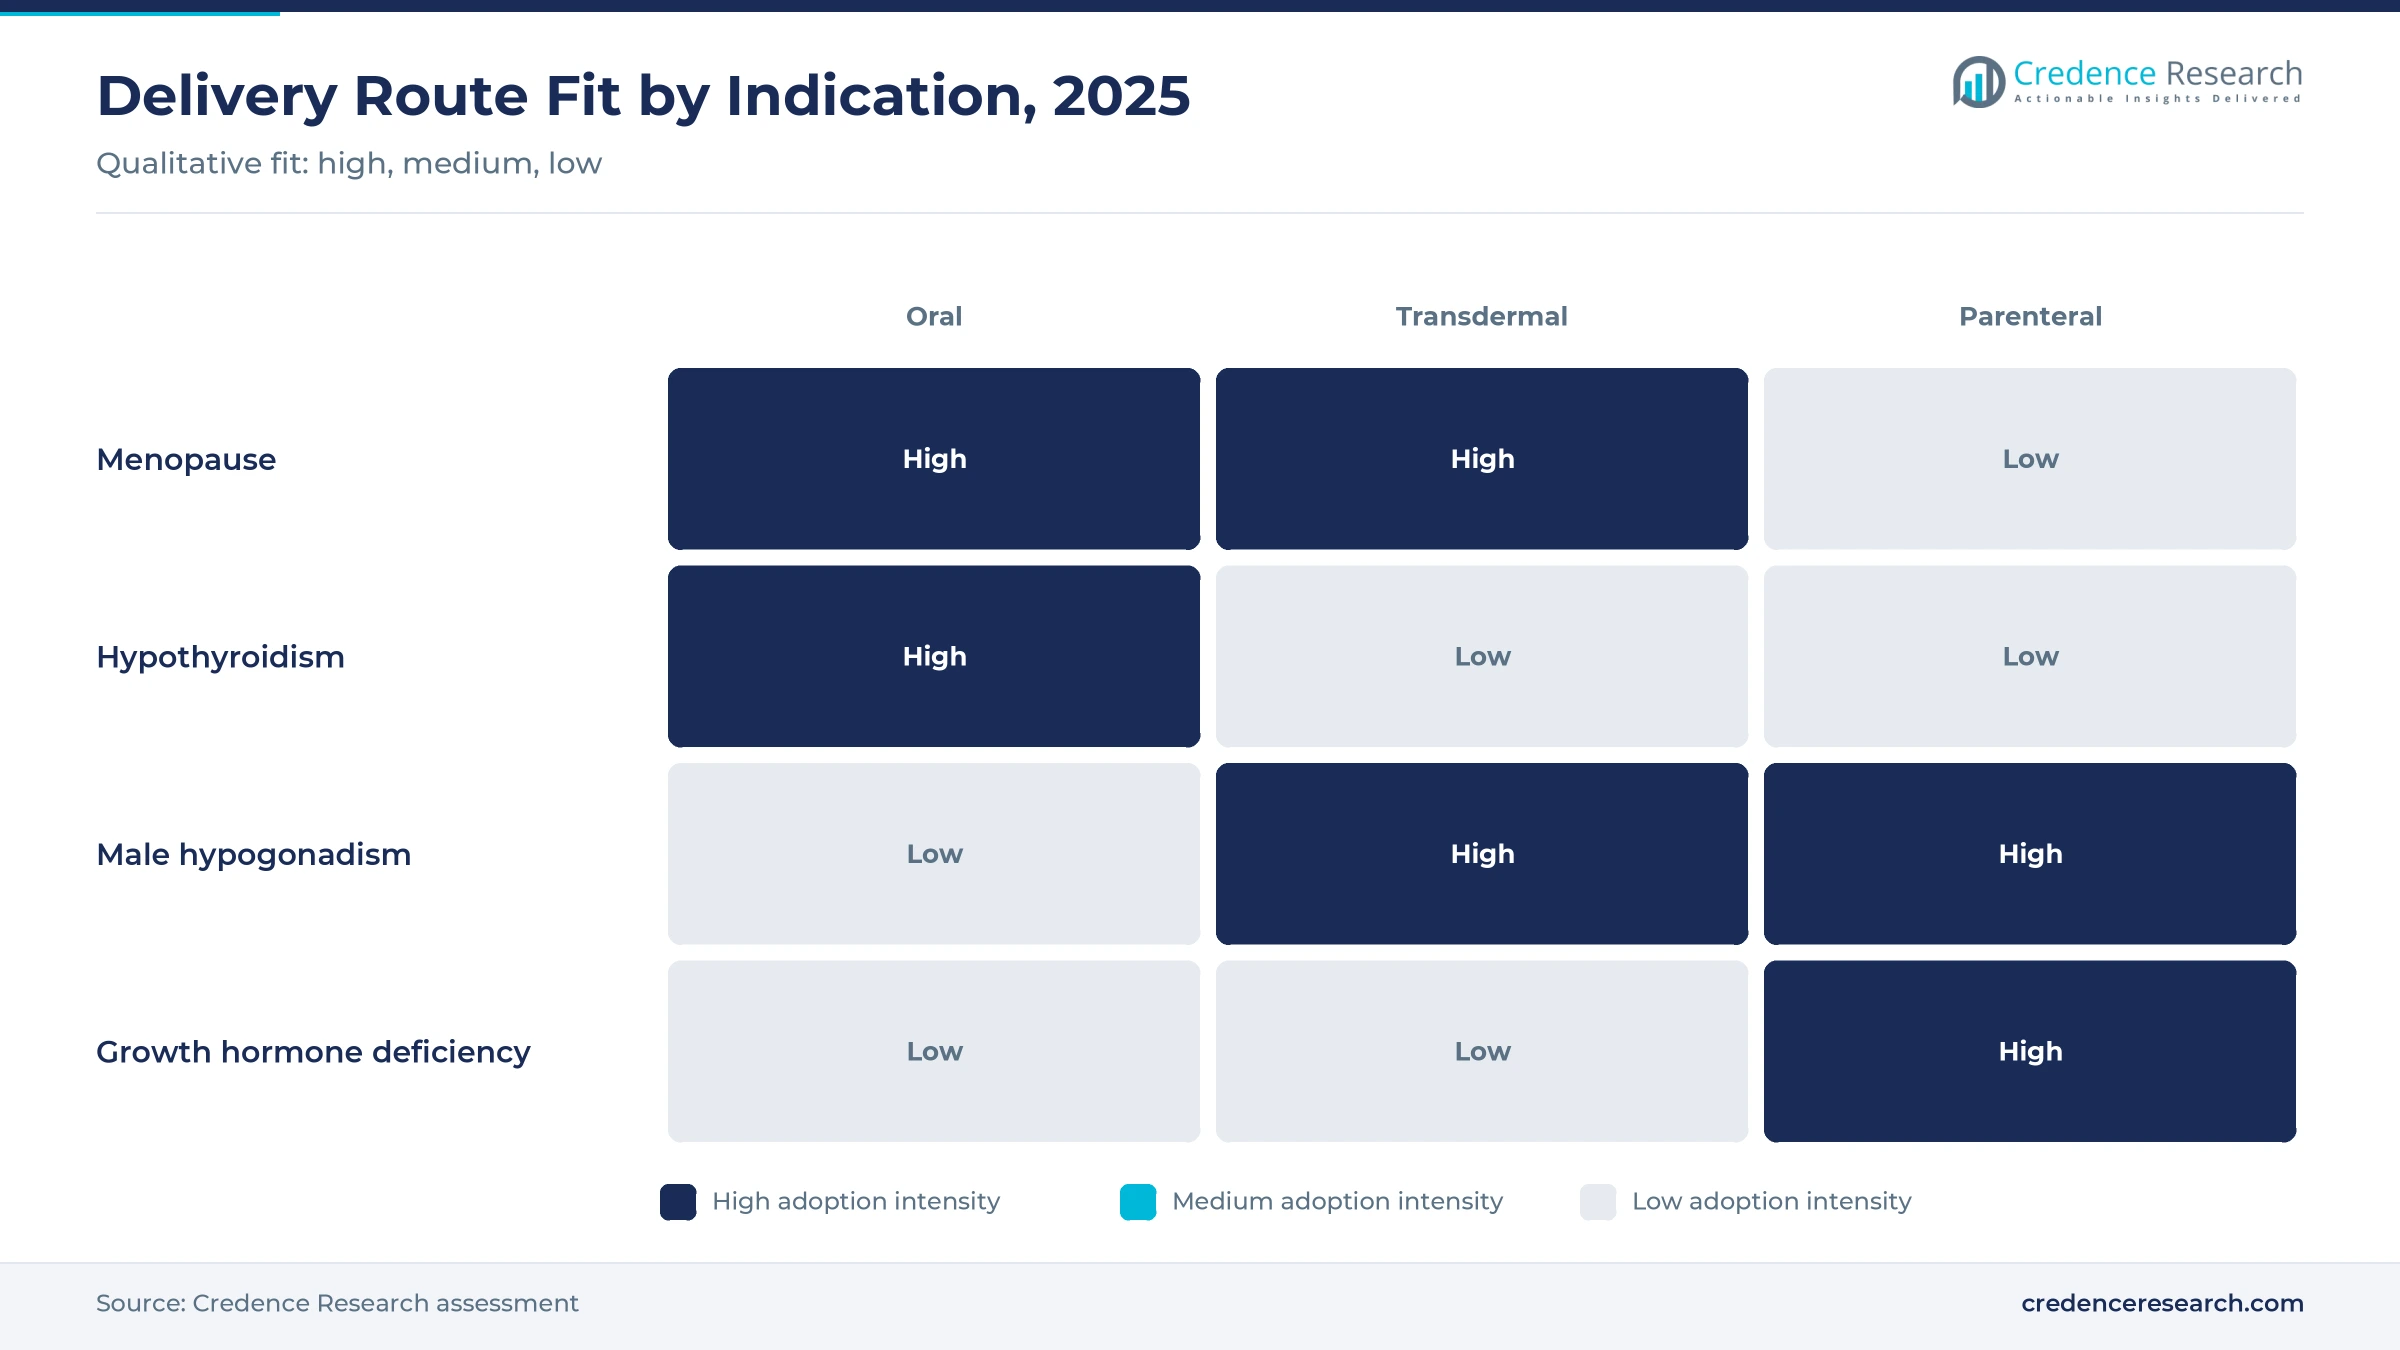
Based on route of administration, the market is categorized into oral, transdermal and parenteral products. Oral products led with a 42.0% share of 2025 value, because thyroid tablets and many estrogen products are taken by mouth. Transdermal products grow fastest at 7.72% a year, as patches and gels avoid first-pass liver metabolism. This benefit matters most for women with clotting concerns and for men who prefer daily gels over injections.
Where do patients fill hormone prescriptions?
Based on distribution channel, the market is categorized into hospital pharmacies, retail pharmacies and drug stores, and online pharmacies. Retail Pharmacies & Drug Stores led with a 50.0% share of 2025 value, because most patients refill long-term prescriptions close to home. Online Pharmacies grow fastest at 8.33% a year, as telehealth menopause and testosterone clinics ship refills.
| Segment Group | Leading Sub-segment | Share, 2025 | Fastest-growing Sub-segment | CAGR, 2026–2035 |
|---|---|---|---|---|
| By Therapy Type | Estrogen & Combinations Replacement Therapy | 36.0% | Estrogen & Combinations Replacement Therapy | 7.06% |
| By Indication | Menopause | 37.0% | Menopause | 7.06% |
| By Route of Administration | Oral | 42.0% | Transdermal | 7.72% |
| By Distribution Channel | Retail Pharmacies & Drug Stores | 50.0% | Online Pharmacies | 8.33% |
Request a Free Sample
Fill in your details and we'll send you a free sample report.
- Sample data tables & charts
- Research methodology
Menopause care, testosterone relabeling and longer lives
How do easing menopause warnings revive demand?
Broad boxed warnings had discouraged many women and doctors from using menopausal hormone products for more than two decades. On Feb. 12, 2026, the FDA approved labeling changes for six menopausal hormone products that remove boxed warning statements on cardiovascular disease, breast cancer and probable dementia. The agency asked 29 companies to propose such changes after starting the process in November 2025. As a result, more women within 10 years of menopause are likely to start treatment, and some former users may return.
Why does a large untreated group matter?
The pool of women who could benefit from treatment is far larger than the number now receiving it. The FDA noted that about 41 million U.S. women were ages 45 to 64 in 2020, while only about 2 million women in a similar age range received a hormone prescription. This gap shows how much room remains for wider use among women in midlife. In turn, even small gains in treatment rates add large volumes for estrogen, progestogen and vaginal estrogen products.
How do testosterone label changes support use?
Clearer safety evidence is reshaping how doctors view testosterone treatment for men with low hormone levels. On Feb. 28, 2025, the FDA required class-wide labeling changes that added TRAVERSE trial results and removed cardiovascular risk language from the boxed warning on testosterone products. A new blood pressure warning was added where one was missing. Because the trial eased heart risk concerns, more urologists and endocrinologists are willing to prescribe testosterone injections and gels.
Why does population aging widen the patient pool?
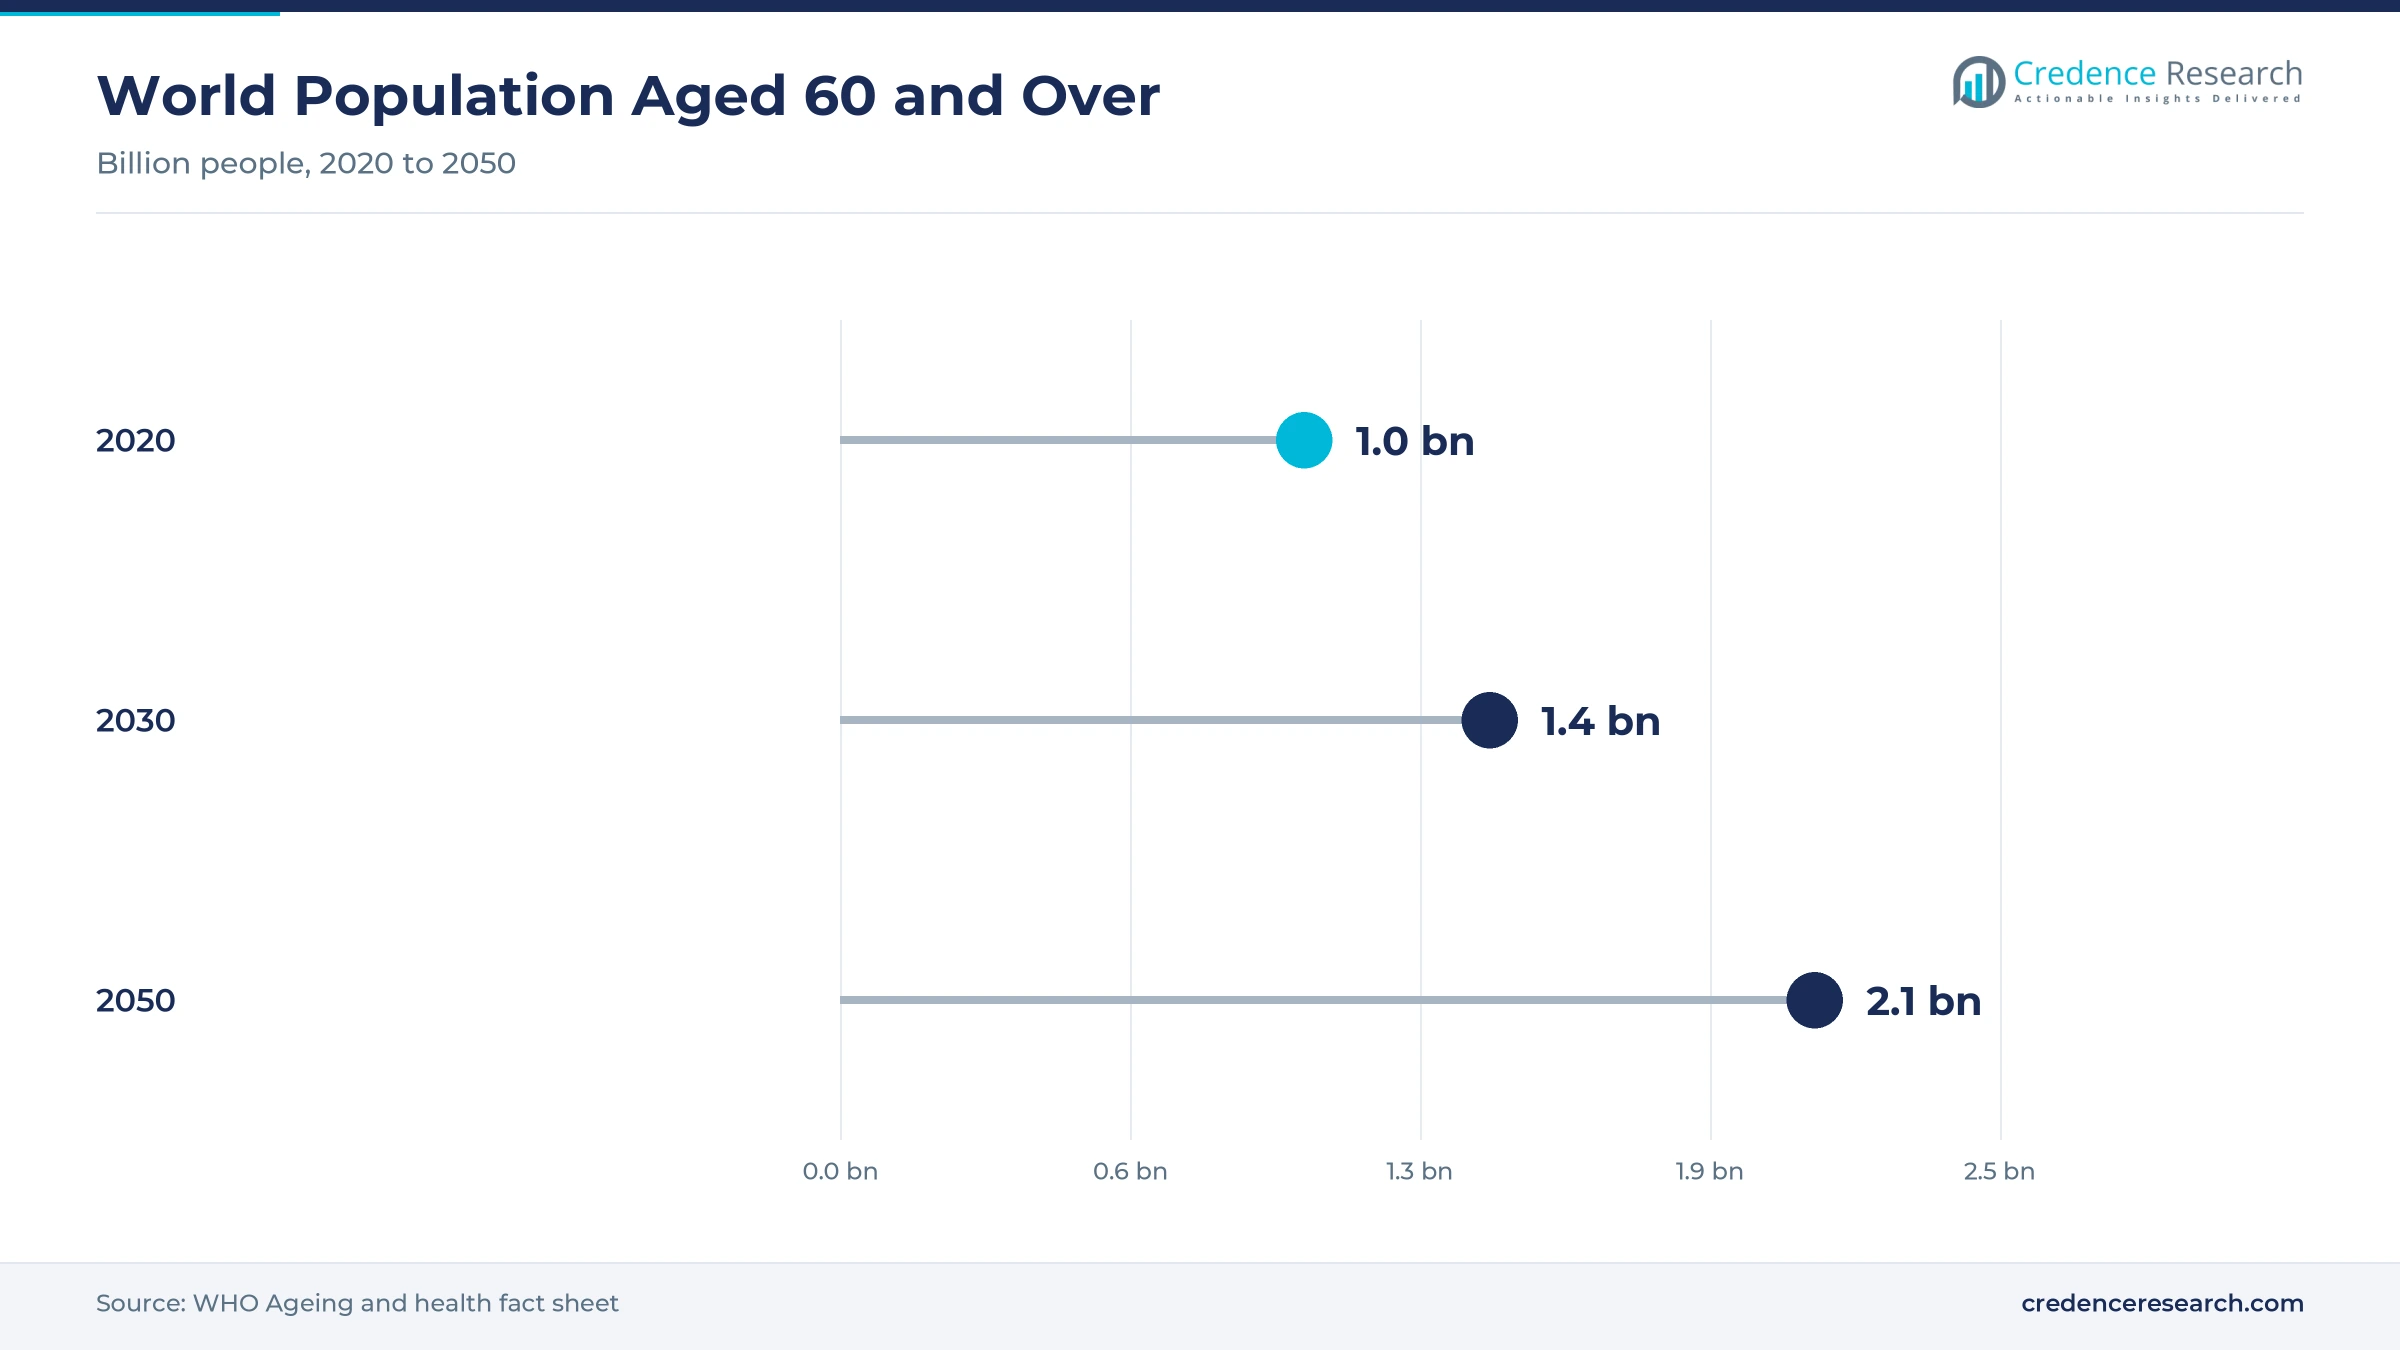
Hormone deficiency becomes more common with age, so aging populations steadily raise the number of people who need replacement. The WHO expects people aged 60 and over to rise from 1 billion in 2020 to 1.4 billion by 2030, and to reach 2.1 billion by 2050. Older adults also face higher rates of thyroid disease and bone loss, which often require years of daily treatment. As a result, demand for thyroid, estrogen and testosterone products grows across both rich and middle-income countries.
Weekly growth hormone, patches and online prescribing
Why is weekly growth hormone on the rise?
Growth hormone treatment is shifting from daily injections toward once-weekly long-acting products. On July 28, 2025, Ascendis Pharma announced U.S. approval of once-weekly Skytrofa for adults with growth hormone deficiency, adding to its use in children aged 1 year and older. Fewer injections improve adherence among children and adults on lifelong treatment. This shift raises value per patient and pressures makers of daily products. In turn, payers weigh the higher price of weekly products against better adherence.
How are skin patches and gels gaining ground?
Transdermal patches and gels are gaining share because they deliver hormones through the skin rather than through the liver. Many menopause specialists prefer skin delivery for women with higher clotting or migraine risks. Wider use of transdermal delivery systems also supports testosterone gels for men. As a result, transdermal products grow faster than oral tablets through 2035. Because patches need steady adhesion and dose control, makers invest in thinner and smaller designs that patients tolerate for years.
Where is the opening in men's health?
Men with low testosterone offer a clear opening, because many have never been tested or treated. On June 18, 2026, HHS requested further class-wide updates to testosterone labels, including removal of the limitation of use for age-related low testosterone. The request would also narrow the prostate cancer contraindication to metastatic disease. If adopted, these changes could widen the group of men eligible for treatment. As a result, makers of gels, patches and injections could reach older men who were previously advised against therapy.
Can telehealth clinics open new prescribing channels?
Telehealth clinics for menopause and men's health create an opening, because they reach patients who avoid in-person visits. Online consultations followed by home delivery through online pharmacies shorten the path from symptoms to treatment. These services also handle repeat refills for thyroid and estrogen products. In turn, suppliers gain steady volume from patients who stay on treatment for years. However, regulators watch online prescribing closely, so clinics must follow labeling and monitoring rules.
Safety fears, non-hormone rivals and generic price pressure
How do lingering safety fears limit treatment?
Many women and doctors still remember the breast cancer and heart risk warnings that followed the Women's Health Initiative study two decades ago. These fears persist even after the FDA began removing boxed warnings in November 2025. Some primary care doctors lack training in menopause care and avoid prescribing. As a result, uptake depends on education campaigns and clear guidance from specialist societies. Because the first relabeled products only reached pharmacies in 2026, a full recovery in prescribing may take several years.
Why do non-hormone rivals threaten estrogen demand?
New non-hormone medicines give women an alternative for hot flashes, which may draw some patients away from estrogen. On Oct. 24, 2025, Bayer announced U.S. approval of Lynkuet, a hormone-free treatment for moderate to severe hot flashes. The medicine blocks two neurokinin receptors involved in temperature control. However, non-hormone options do not protect bone, so estrogen keeps a role for women at risk of postmenopausal osteoporosis. In turn, doctors may use both options for different patients.
How does generic pricing weigh on value?
Thyroid tablets and many estrogen and testosterone products are available as low-cost generics, which caps value growth. Generic levothyroxine and estradiol tablets sell for a small fraction of branded prices in most countries. As a result, rising patient numbers add less value than they would for branded medicines. Makers respond by focusing on new delivery forms and long-acting products that justify higher prices. This pattern is strongest in thyroid care, where most patients already take low-cost generic levothyroxine tablets.
What monitoring needs slow testosterone and growth hormone use?
Testosterone and growth hormone treatments require regular blood tests and dose checks, which adds cost and burden for patients. Testosterone products now carry blood pressure warnings, so doctors must monitor patients more closely. Growth hormone treatment for children involves years of specialist visits and growth tracking. These requirements slow uptake in regions where few endocrinologists practice. As a result, makers fund nurse programs and home testing to help patients stay on treatment.
North America leads while Asia Pacific grows fastest
| Region | Value, 2025 (USD billion) | Share, 2025 | CAGR, 2026–2035 |
|---|---|---|---|
| North America | 4.83 | 44.0% | 6.22% |
| Europe | 2.96 | 27.0% | 5.92% |
| Asia Pacific | 2.08 | 19.0% | 7.82% |
| Latin America | 0.66 | 6.0% | 7.12% |
| Middle East & Africa | 0.44 | 4.0% | 7.22% |
North America leads on branded products and relabeling
North America held a 44.0% share of 2025 value and grows at 6.22% a year through 2035. The U.S. dominates spending, because branded estrogen, growth hormone and testosterone products carry high list prices and insurance covers most endocrine care. The removal of broad menopause warnings since November 2025 and testosterone label changes since February 2025 support more prescribing. However, generic thyroid and estradiol tablets hold value growth below the global rate.
Europe balances specialist care and price controls
Europe held a 27.0% share of 2025 value and grows at 5.92% a year, the slowest pace among the five regions. Germany, the U.K., France, Italy and Spain account for most demand, with strong use of transdermal estrogen patches and gels. National price controls and generic substitution keep value growth modest. However, wider menopause awareness campaigns in several countries lift the number of women on treatment. Specialist menopause clinics also help women choose between tablets, patches and gels.
Asia Pacific grows on aging and diagnosis
Asia Pacific held a 19.0% share of 2025 value and is the fastest-growing region at 7.82% a year. Japan, China and South Korea have some of the fastest-aging populations in the world, which raises thyroid, menopause and growth hormone demand. India adds large volumes through low-cost generic thyroid tablets sold in retail pharmacies. As incomes rise, more patients pay for branded long-acting growth hormone and transdermal products. In turn, local generic makers expand supply of estradiol and thyroid tablets.
Latin America relies on generics and private care
Latin America held a 6.0% share of 2025 value and grows at 7.12% a year through 2035. Brazil and Mexico account for most demand, with private clinics serving women seeking menopause treatment.
Gulf states lead a small regional base
The Middle East & Africa held a 4.0% share of 2025 value and grows at 7.22% a year. Gulf states lead spending on branded growth hormone and testosterone products, while most of Africa relies on generics.
Label changes, approvals and reviews since 2025
| Development | Status and market relevance |
|---|---|
| In February 2025, the FDA required class-wide labeling changes for testosterone products, adding TRAVERSE trial results and a blood pressure warning. | Implemented. Cardiovascular risk language removed from the boxed warning. |
| In July 2025, Ascendis Pharma announced U.S. approval of once-weekly Skytrofa for adults with growth hormone deficiency. | Approved. Extends a weekly option to adult patients. |
| In October 2025, Bayer AG announced U.S. approval of Lynkuet, a hormone-free treatment for menopausal hot flashes. | Approved. Adds a non-hormone alternative for vasomotor symptoms. |
| In February 2026, the FDA approved labeling changes for six menopausal hormone products that remove broad boxed warning statements. | Approved. First batch after requests to 29 companies. |
| In June 2026, HHS requested class-wide updates to testosterone labels, including removal of the age-related limitation of use. | Requested. Label revisions not yet final. |
Long-acting injections and skin delivery reshape dosing
- Long-acting growth hormone products such as lonapegsomatropin are given once a week, which replaces daily injections for children and adults.
- Transdermal estradiol patches and gels deliver estrogen through the skin, which avoids first-pass liver metabolism.
- Low-dose vaginal estrogen treats local genitourinary symptoms with minimal absorption into the bloodstream.
- Testosterone gels and pellets offer steady hormone levels without frequent injections, which suits men on long-term treatment.
- Narrow-dose thyroid tablets such as levothyroxine sodium in fine dose steps let doctors adjust treatment precisely for each patient.
Need a Custom Version of This Report?
Tailor the scope, geography, or segments to your exact requirements.
- Custom geography or segment scope
- Direct access to our analyst team
Diversified drugmakers and generic suppliers share the field
Competition in hormone replacement is shared between large diversified drugmakers with branded endocrine portfolios and generic suppliers of tablets, patches and gels. Pfizer Inc and Eli Lilly and Company hold established positions in estrogen and growth hormone products, while AbbVie Inc supplies widely used thyroid and testosterone brands. Bayer AG competes in women's health and added a hormone-free hot flash treatment in October 2025, which broadens its menopause offer. Novartis AG, Merck and Co Inc, Roche Holding AG and Amgen Inc hold endocrine and specialty portfolios that touch hormone care. Teva Pharmaceutical Industries Ltd and Viatris Inc supply low-cost generic estradiol, levothyroxine and testosterone products. Because generics dominate older molecules, branded makers compete on long-acting forms, skin delivery and support programs that help patients stay on treatment.
Companies profiled and their roles in this market
| Company | Type | Role in the market |
|---|---|---|
| Pfizer Inc | Diversified pharma | Estrogen and growth hormone products |
| AbbVie Inc | Diversified pharma | Thyroid and testosterone brands |
| Eli Lilly and Company | Diversified pharma | Growth hormone and endocrine products |
| Bayer AG | Diversified pharma | Women's health and menopause portfolio |
| Novartis AG | Diversified pharma | Endocrine portfolio |
| Merck and Co Inc | Diversified pharma | Women's health and endocrine products |
| Roche Holding AG | Diversified pharma | Specialty medicines and hormone testing |
| Amgen Inc | Biotechnology | Endocrine and specialty biologics |
| Teva Pharmaceutical Industries Ltd | Generics | Generic estradiol and testosterone products |
| Viatris Inc | Generics | Generic thyroid and hormone products |
Regulatory relabeling, not new molecules, sets the pace
Credence Research's view is that regulatory relabeling, rather than new molecules, will set the growth pace in hormone replacement through 2035. The removal of broad menopause warnings and clearer testosterone safety data bring back patients who avoided treatment for years. Estrogen products keep the largest share, while weekly growth hormone and skin delivery raise value per patient. Generic pricing limits gains in thyroid care, and non-hormone rivals compete for hot flash patients. Companies with long-acting forms and telehealth partnerships are best placed.
How the 2025 baseline and forecast were built
The report uses 2025 as the base year and forecasts market value to 2035, with growth rates stated for 2026–2035. Market values come from the Credence Research market model, which combines treated patient numbers by indication, typical dosing, branded and generic price levels and channel mix by region. Splits by therapy type, indication, route of administration, distribution channel and region are Credence Research estimates. Sources used include FDA and HHS announcements, WHO population data and company announcements. No primary interviews or surveys were used to build the estimates in this report.
More treated women and men and simpler dosing by 2035
By 2035, the hormonal therapy market reaches USD 20.71 billion, with more women and men treated earlier and for longer. Estrogen and combination products remain the largest therapy type as menopause care returns to mainstream practice. Weekly growth hormone replaces most daily injections in high-income countries. Transdermal products and online pharmacies gain share as patients seek convenient options. Generic thyroid tablets keep volume high in Asia and Latin America, while branded makers focus on long-acting and skin-delivered products.
Frequently Asked Questions
How big is the hormonal therapy market?
Which therapy type leads the market?
Which route of administration grows fastest?
Which region holds the largest share?
What did the FDA change for menopause products?
How did testosterone labels change?
Who are the leading companies?
What are the main challenges?
Table of Content
Chapter 1 Market Segmentation
- 1.1 Segmentation Framework
- 1.1.1 Product and Service Classification
- 1.1.2 Application and End-Use Classification
- 1.1.3 Technology and Solution Classification
- 1.1.4 Customer and Distribution Channel Classification
- 1.1.5 Geographic Segmentation
- 1.1.6 Market Segment Definitions and Boundaries
- 1.2 By Therapy Type
- 1.2.1 Estrogen & Combinations Replacement Therapy
- 1.2.2 Growth Hormone Replacement Therapy
- 1.2.3 Thyroid Hormone Replacement Therapy
- 1.2.4 Testosterone Hormone Replacement Therapy
- 1.3 By Indication
- 1.3.1 Menopause
- 1.3.2 Hypothyroidism
- 1.3.3 Male Hypogonadism
- 1.3.4 Growth Hormone Deficiency
- 1.4 By Route of Administration
- 1.4.1 Oral
- 1.4.2 Transdermal
- 1.4.3 Parenteral
Chapter 2 Introduction
- 2.1 Report Objectives and Scope
- 2.2 Product Definition and Industry Terminology
- 2.3 Market Inclusions and Exclusions
- 2.4 Research Process
- 2.4.1 Primary Research and Expert Interviews
- 2.4.2 Secondary Research and Source Review
- 2.4.3 Top-Down and Bottom-Up Estimation
- 2.4.4 Data Triangulation and Verification
- 2.5 Market Size Measurement Basis
- 2.5.1 2025: USD 10.97 billion → 2035: USD 20.71 billion
- 2.6 Historical and Forecast Reference Periods
- 2.6.1 Historical Period: 2018-2025
- 2.6.2 Base Year: 2025
- 2.6.3 Forecast Period: 2025-2035
- 2.7 Research Assumptions and Limitations
Chapter 3 Executive Summary
- 3.1 Market Snapshot and Key Findings
- 3.2 Base-Year Market Size, 2025
- 3.3 Forecast Market Size, 2035
- 3.4 Revenue and Volume Growth Outlook
- 3.5 Key Demand and Supply Indicators
- 3.6 Leading Market Segments
- 3.7 Fastest-Growing Market Opportunities
- 3.8 Regional Performance Highlights
- 3.9 Technology and Industry Transformation
- 3.10 Competitive Landscape Summary
- 3.11 Analyst View and Strategic Implications
Chapter 4 Global Hormonal Therapy Market Trends and Developments
- 4.1 Historical Industry Development, 2018-2025
- 4.2 Recent Market Trends and Developments
- 4.3 Demand and Customer Behavior Trends
- 4.4 Technology and Product Innovation
- 4.5 Artificial Intelligence, Automation and Digitalization
- 4.6 Local Manufacturing and Supply Chain Realignment
- 4.7 Industry Partnerships, Mergers and Acquisitions
- 4.8 Sustainability and Circular Economy Developments
- 4.9 Government and Private Sector Investment Trends
- 4.10 Emerging Business Models and Commercialization
- 4.11 Industry Developments and Announcements
Chapter 5 Global Hormonal Therapy Market Production, Supply and Demand Analysis
- 5.1 Demand Trend and Consumption Analysis, 2018-2025
- 5.2 Demand Forecast, 2025-2035
- 5.3 Production and Output Trend, 2018-2025
- 5.4 Production and Output Forecast, 2025-2035
- 5.5 Installed Capacity and Capacity Utilization
- 5.6 Company-Wise Production Plants and Statistics
- 5.6.1 Installed Production Capacity
- 5.6.2 Actual Production
- 5.6.3 Planned Capacity and Expansion Targets
- 5.7 Supply Chain Structure and Procurement Trends
- 5.8 Supply-Demand Gap and Bottlenecks
- 5.9 Import Dependence and Sourcing Structure
- 5.10 Contract Manufacturing and Outsourcing
- 5.11 Regional Supply and Demand Concentration
Chapter 6 Global Hormonal Therapy Market Pricing Analysis
- 6.1 Pricing Structure and Measurement
- 6.2 Historical Pricing Trends, 2018-2025
- 6.3 Pricing Outlook, 2025-2035
- 6.4 Average Selling Price and Unit Economics
- 6.5 Pricing by Product and Market Segment
- 6.6 Geographic Pricing Differences
- 6.7 Key Input, Energy, Labor and Logistics Costs
- 6.8 Contract Pricing and Purchasing Models
- 6.9 Pricing Sensitivity and Competitive Positioning
- 6.10 Price, Margin and Profitability Implications
Chapter 7 Global Hormonal Therapy Market Dynamics
- 7.1 Market Growth Drivers
- 7.1.1 Demand-Side Drivers
- 7.1.2 Technology and Innovation Drivers
- 7.1.3 Infrastructure and Investment Drivers
- 7.1.4 Regulatory and Policy Drivers
- 7.2 Market Restraints
- 7.2.1 Cost and Affordability Constraints
- 7.2.2 Technology and Adoption Barriers
- 7.2.3 Supply Chain and Operational Constraints
- 7.3 Market Challenges
- 7.3.1 Competitive Pressure and Margin Erosion
- 7.3.2 Skills, Infrastructure and Implementation Gaps
- 7.4 Emerging Market Opportunities
- 7.5 Market Dynamics Impact and Time-Horizon Assessment
Chapter 8 Global Hormonal Therapy Value Chain Analysis
- 8.1 Industry Value Chain Overview
- 8.2 Upstream Suppliers and Critical Inputs
- 8.3 Technology and Component Providers
- 8.4 Manufacturing or Service Delivery
- 8.5 Distribution, Channel Partners and Integrators
- 8.6 Downstream Applications and End Users
- 8.7 Value Addition and Profit Pools
- 8.8 Vertical Integration and Outsourcing
- 8.9 Supplier Concentration and Risk
- 8.10 Supply Chain Localization and Resilience
Chapter 9 Global Hormonal Therapy Market Regulations and Policies
- 9.1 Relevant Laws, Standards and Compliance Frameworks
- 9.2 Product, Service, Safety and Quality Requirements
- 9.3 Government Policies, Incentives and Subsidies
- 9.4 Imports, Exports and Trade Barriers
- 9.5 Public Procurement and Local Content Requirements
- 9.6 Environmental and Sustainability Compliance
- 9.7 Upcoming Policy Changes and Market Implications
Chapter 10 Global Hormonal Therapy Market Hotspots and Opportunities
- 10.1 Market Opportunity Mapping and Growth Hotspots
- 10.2 High-Growth Applications and Customer Groups
- 10.3 Underserved Markets and White-Space Opportunities
- 10.4 Emerging Technology and Product Opportunities
- 10.5 New Capacity and Investment Hotspots
- 10.6 Market Entry and Expansion Opportunities
- 10.7 Distribution and Partnership Opportunities
- 10.8 Near-Term and Long-Term Commercial Potential
- 10.9 Opportunity Attractiveness and Execution Risks
Chapter 11 Global Hormonal Therapy Market Outlook, 2025-2035
- 11.1 Market Size and Analysis
- 11.1.1 Revenue (Market Measurement: 2025: USD 10.97 billion → 2035: USD 20.71 billion)
- 11.1.2 Market Volume and Quantity Sold
- 11.1.3 Historical Market Size, 2018-2025
- 11.1.4 Base-Year Market Size, 2025
- 11.2 Market Forecast, 2025-2035
- 11.2.1 Revenue Forecast to 2035
- 11.2.2 Volume Forecast to 2035
- 11.2.3 CAGR and Year-on-Year Growth
- 11.2.4 Incremental Revenue Opportunity
- 11.3 Forecast Assumptions and Scenario Analysis
- 11.3.1 Base-Case Forecast
- 11.3.2 Optimistic and Conservative Scenarios
- 11.3.3 Technology, Pricing and Policy Sensitivities
- 11.4 Market Attractiveness and Growth Outlook
Chapter 12 Global Hormonal Therapy Market Segmentation and Outlook
- 12.1 Segmentation Summary and Market Shares, 2025
- 12.2 Largest and Fastest-Growing Segments
- 12.3 By Therapy Type - Market Size and Forecast, 2025-2035
- 12.3.1 Segment Definition and Scope
- 12.3.2 Historical Market Size, 2018-2025
- 12.3.3 Revenue Forecast, 2025-2035
- 12.3.4 Volume Forecast, 2025-2035
- 12.3.5 Base-Year Market Share, 2025
- 12.3.6 Segment CAGR and Growth Drivers
- 12.3.7 Subsegment Market Size and Forecast
- 12.3.7.1 Estrogen & Combinations Replacement Therapy
- 12.3.7.2 Growth Hormone Replacement Therapy
- 12.3.7.3 Thyroid Hormone Replacement Therapy
- 12.3.7.4 Testosterone Hormone Replacement Therapy
- 12.3.8 Subsegment Pricing and Adoption Trends
- 12.3.9 Leading Suppliers and Competition
- 12.3.10 Regional Demand and Opportunities
- 12.4 By Indication - Market Size and Forecast, 2025-2035
- 12.4.1 Segment Definition and Scope
- 12.4.2 Historical Market Size, 2018-2025
- 12.4.3 Revenue Forecast, 2025-2035
- 12.4.4 Volume Forecast, 2025-2035
- 12.4.5 Base-Year Market Share, 2025
- 12.4.6 Segment CAGR and Growth Drivers
- 12.4.7 Subsegment Market Size and Forecast
- 12.4.7.1 Menopause
- 12.4.7.2 Hypothyroidism
- 12.4.7.3 Male Hypogonadism
- 12.4.7.4 Growth Hormone Deficiency
- 12.4.8 Subsegment Pricing and Adoption Trends
- 12.4.9 Leading Suppliers and Competition
- 12.4.10 Regional Demand and Opportunities
- 12.5 By Route of Administration - Market Size and Forecast, 2025-2035
- 12.5.1 Segment Definition and Scope
- 12.5.2 Historical Market Size, 2018-2025
- 12.5.3 Revenue Forecast, 2025-2035
- 12.5.4 Volume Forecast, 2025-2035
- 12.5.5 Base-Year Market Share, 2025
- 12.5.6 Segment CAGR and Growth Drivers
- 12.5.7 Subsegment Market Size and Forecast
- 12.5.7.1 Oral
- 12.5.7.2 Transdermal
- 12.5.7.3 Parenteral
- 12.5.8 Subsegment Pricing and Adoption Trends
- 12.5.9 Leading Suppliers and Competition
- 12.5.10 Regional Demand and Opportunities
- 12.6 Segment Growth Comparison
- 12.7 Segment Attractiveness and Priority Matrix
Chapter 13 Global Hormonal Therapy Geographic Market Outlook, 2025-2035
- 13.1 Regional Market Size and Share, 2025
- 13.2 Regional Market Forecast, 2025-2035
- 13.3 Regional Pricing, Production and Demand Differences
- 13.4 North America
- 13.4.1 United States
- 13.4.2 Canada
- 13.4.3 Mexico
- 13.5 Europe
- 13.5.1 Germany
- 13.5.2 France
- 13.5.3 Italy
- 13.5.4 United Kingdom
- 13.5.5 Spain
- 13.5.6 Poland
- 13.5.7 Russia
- 13.5.8 Netherlands
- 13.5.9 Belgium
- 13.5.10 Sweden
- 13.5.11 Denmark
- 13.5.12 Norway
- 13.5.13 Rest of Europe
- 13.6 Asia Pacific
- 13.6.1 China
- 13.6.2 India
- 13.6.3 Japan
- 13.6.4 South Korea
- 13.6.5 Thailand
- 13.6.6 Indonesia
- 13.6.7 Vietnam
- 13.6.8 Malaysia
- 13.6.9 Australia
- 13.6.10 Rest of Asia Pacific
- 13.7 Latin America
- 13.7.1 Brazil
- 13.7.2 Argentina
- 13.7.3 Colombia
- 13.7.4 Chile
- 13.7.5 Rest of Latin America
- 13.8 Middle East
- 13.8.1 Saudi Arabia
- 13.8.2 United Arab Emirates
- 13.8.3 Turkey
- 13.8.4 Israel
- 13.8.5 Iran
- 13.8.6 Rest of the Middle East
- 13.9 Africa
- 13.9.1 South Africa
- 13.9.2 Egypt
- 13.9.3 Nigeria
- 13.9.4 Morocco
- 13.9.5 Rest of Africa
- 13.10 Regional Investment, Policy and Supply Chain Differences
- 13.11 Regional Competitive Landscape
- 13.12 Geographic Growth Hotspots
Chapter 14 Global Hormonal Therapy Technology, Innovation and Sustainability Outlook
- 14.1 Technology Landscape and Maturity
- 14.2 Product, Process and Service Innovation
- 14.3 AI, Automation and Digital Tools in the Industry
- 14.4 Technology Adoption and Performance Benchmarking
- 14.5 Innovation Pipeline and R&D Investment
- 14.6 Patent and Intellectual Property Trends
- 14.7 Energy Efficiency and Resource Management
- 14.8 Sustainability, Recycling and Circularity
- 14.9 Technology Roadmap, 2025-2035
- 14.10 Risks of Obsolescence and Technology Substitution
Chapter 15 Global Hormonal Therapy Market Key Strategic Imperatives
- 15.1 Growth and Market Entry Priorities
- 15.2 High-Return Products and Segments
- 15.3 Pricing, Profitability and Cost Optimization
- 15.4 Technology Investment and Product Differentiation
- 15.5 Supply Chain Localization and Resilience
- 15.6 Distribution and Customer Acquisition
- 15.7 Partnership, Acquisition and Capacity Strategy
- 15.8 Regional Expansion Priorities
- 15.9 Short-, Medium- and Long-Term Actions
Chapter 16 Competition Outlook
- 16.1 Industry Competition Characteristics
- 16.2 Market Structure and Concentration
- 16.3 Market Share and Competitive Positioning, 2025
- 16.4 Company-Wise Revenue and Product Benchmarking
- 16.5 Production and Service Capacity Benchmarking
- 16.6 Technology, Pricing and Differentiation
- 16.7 Regional Footprint and Distribution Strength
- 16.8 Mergers, Acquisitions and Strategic Alliances
- 16.9 New Entrants and Competitive Threats
- 16.10 Porter's Five Forces and Industry Attractiveness
- 16.11 Competitive Outlook, 2025-2035
Chapter 17 Company Profiles
- 17.1 Company Coverage and Selection Criteria
- 17.2 Pfizer Inc
- 17.2.1 Business Description
- 17.2.2 Company Ownership and Geographic Presence
- 17.2.3 Product and Service Portfolio
- 17.2.4 Manufacturing and Operating Footprint
- 17.2.5 Production Capacity and Expansion Plans
- 17.2.6 Financial Performance and Investment
- 17.2.7 Market Share and Competitive Position
- 17.2.8 Technology and Innovation Capabilities
- 17.2.9 Strategic Alliances or Partnerships
- 17.2.10 Recent Developments
- 17.2.11 Growth Strategy and Outlook
- 17.3 AbbVie Inc
- 17.4 Novartis AG
- 17.5 Bayer AG
- 17.6 Eli Lilly and Company
- 17.7 Merck and Co Inc
- 17.8 Roche Holding AG
- 17.9 Teva Pharmaceutical Industries Ltd
- 17.10 Viatris Inc
- 17.11 Amgen Inc
- 17.12 Other Relevant Market Participants
Note: Every listed company is profiled on the structure shown under the first company. The company list is preliminary and may change based on research findings, market developments, data availability and client requirements.
Chapter 18 Disclaimer
- 18.1 Research and Forecast Disclaimer
- 18.2 Data Source and Estimation Limitations
Note: The depth of individual sections depends on data availability for this market. Volume, capacity, trade and other unit-based metrics are included where applicable.

