
Market Overview:
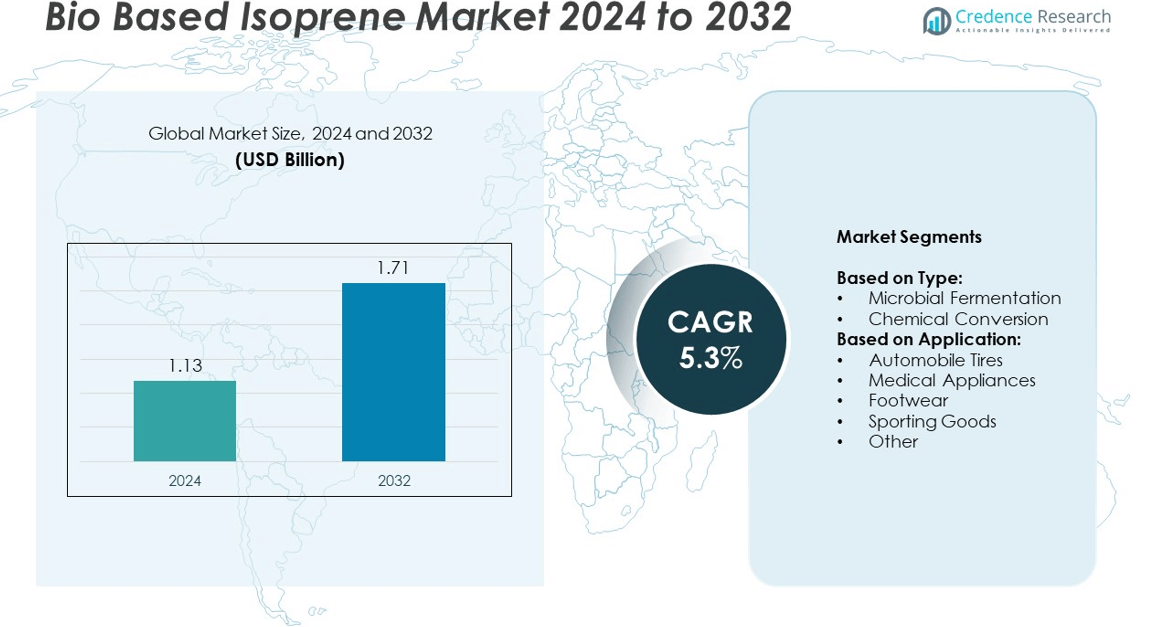
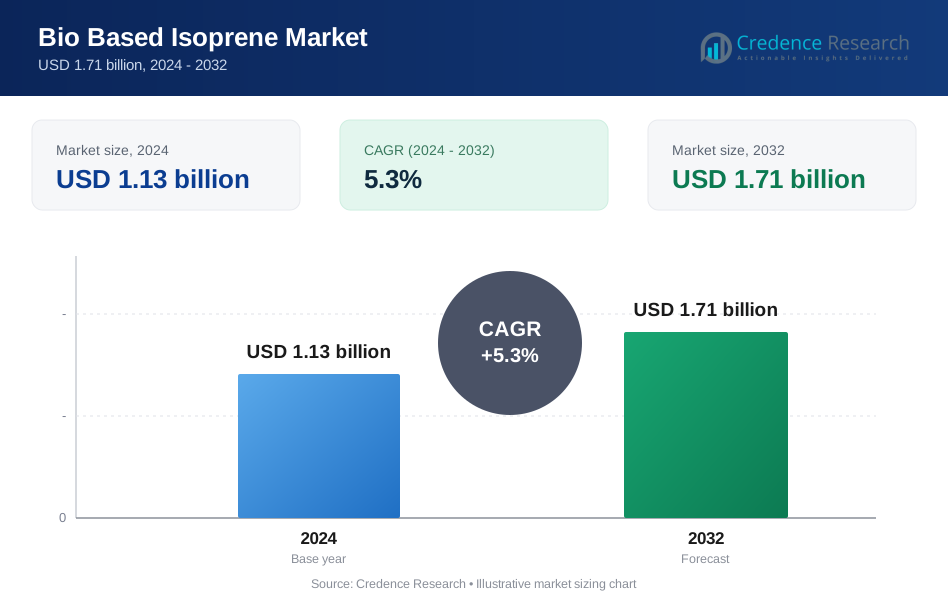
The bio-based isoprene market size was valued at USD 1.13 billion in 2024 and is anticipated to reach USD 1.71 billion by 2032, at a CAGR of 5.3% during the forecast period.
| REPORT ATTRIBUTE | DETAILS |
|---|---|
| Historical Period | 2020-2023 |
| Base Year | 2024 |
| Forecast Period | 2025-2032 |
| Bio Based Isoprene Market Size 2024 | USD 1.13 billion |
| Bio Based Isoprene Market, CAGR | 5.3% |
| Bio Based Isoprene Market Size 2032 | USD 1.71 billion |
The bio-based isoprene market is shaped by key players including Yokohama Rubber Company, Genencor (DuPont), Mitsubishi Chemical Group Corporation, Amyris Inc. (USA), Genomatica, Gevo Inc, Braskem, Ginkgo Bioworks, GlycosBio, and Ajinomoto. These companies focus on advancing microbial fermentation technologies, scaling bio-refinery operations, and forming partnerships with automotive and medical device manufacturers to meet rising demand for sustainable rubber materials. North America leads the market with over 35% share in 2024, supported by strong adoption in tire manufacturing and favorable government incentives. Europe follows closely with nearly 30% share, driven by strict sustainability regulations and active R&D investments.
Market Insights
- The bio-based isoprene market was valued at USD 1.13 billion in 2024 and is projected to reach USD 1.71 billion by 2032, growing at a CAGR of 5.3%.
- Rising demand for sustainable rubber alternatives and regulatory support for renewable chemicals are driving market growth, with microbial fermentation holding over 65% share in 2024.
- Strategic partnerships between tire manufacturers and biotech firms are boosting commercialization, while expanding applications in medical devices and footwear are creating new opportunities.
- The market is competitive, with key players focusing on bio-refinery expansions, technology advancements, and supply chain security to maintain price competitiveness.
- North America leads with over 35% share, followed by Europe at nearly 30% and Asia Pacific with more than 25%, driven by strong automotive and healthcare demand, while Latin America and Middle East & Africa together account for around 10% of the global market.
Market Segmentation Analysis:
By Type
Microbial fermentation dominates the bio-based isoprene market, accounting for over 65% share in 2024. Its leadership is driven by its cost-effectiveness, scalability, and ability to use renewable feedstocks such as sugarcane and corn. Companies leverage advanced metabolic engineering and optimized fermentation processes to increase yield and purity. Rising demand from tire manufacturers and consumer goods industries strengthens the adoption of microbial fermentation technology. Chemical conversion holds the remaining share and finds niche use in regions with abundant biomass availability but remains limited by higher energy requirements and production costs compared to fermentation routes.
- For instance, the engineered Escherichia coli strain YJM25 with a hybrid mevalonate (MVA) pathway produced 6.3 g/L of isoprene after 40 hours in fed-batch fermentation.
By Application
Automobile tires lead the bio-based isoprene market, holding more than 45% share in 2024. Growth is fueled by major tire producers adopting bio-based materials to meet sustainability targets and reduce carbon emissions. Bio-isoprene improves tire elasticity, durability, and rolling resistance, supporting fuel efficiency standards. Medical appliances follow as the second-largest application due to demand for biocompatible materials in gloves, catheters, and tubing. Footwear and sporting goods also contribute steadily, as brands focus on eco-friendly product lines to meet consumer preferences for sustainable materials, further expanding market penetration across these sectors.
- For instance, Partnership with Zeon Corporation, Visolis, a biotechnology company, achieved a 50-fold increase in its bio-isoprene monomer production capacity. The two companies are investigating the feasibility of commercializing bio-isoprene monomers and sustainable aviation fuel (SAF) using Visolis' proprietary technology. In this collaboration, Visolis is the one that scaled up its production capacity.
Market Overview
Rising Demand for Sustainable Rubber Alternatives
Growing pressure to reduce carbon emissions drives demand for bio-based isoprene as a greener substitute for petroleum-derived isoprene. Major tire manufacturers are investing in renewable feedstock solutions to meet corporate sustainability goals. This shift is encouraged by regulatory frameworks supporting bio-based materials and circular economy initiatives. Increased adoption in automotive and consumer goods sectors ensures long-term demand growth, making this factor one of the most significant drivers shaping the market.
- For instance, the strain YJM25 achieved a ~7% conversion of glucose into isoprene in the high-yield 6.3 g/L fed-batch run.
Advancements in Fermentation Technology
Breakthroughs in metabolic engineering and strain optimization enhance microbial fermentation efficiency, reducing production costs and improving yield. Companies are scaling up pilot projects to commercial production levels, strengthening supply security. Strategic collaborations between chemical producers and biotech firms accelerate technology deployment. These advancements make bio-based isoprene competitive with petrochemical counterparts, driving wider adoption across tire and medical device industries.
- For instance, in lab-scale studies, engineered E. coli using lignocellulosic pretreated biomass produced ~294 mg/L isoprene via SSF (simultaneous saccharification and fermentation), nearly matching yields from pure glucose.
Government Incentives and Green Policies
Supportive regulations and subsidies promote the shift toward bio-based chemicals globally. Programs in North America, Europe, and Asia encourage manufacturers to invest in renewable monomer production facilities. Tax credits and funding for bio-refineries lower entry barriers and reduce capital risk. Such policy-driven initiatives significantly boost market penetration, positioning bio-based isoprene as a preferred material for sustainable product development.
Key Trends & Opportunities
Partnerships Between Tire Manufacturers and Biotech Firms
Collaborations between major tire companies and biotechnology firms are increasing to secure consistent bio-isoprene supply. These partnerships accelerate commercialization through joint R&D efforts and shared infrastructure investments. Such alliances enable early adoption of bio-based tires, giving companies a competitive advantage. This trend also creates opportunities for emerging players to enter niche markets, particularly in specialty tire segments for electric and hybrid vehicles.
- For instance, Goodyear unveiled a demonstration tire in 2023 made with 90 % sustainable materials.
Expansion Beyond Automotive Applications
The market is witnessing rising use of bio-based isoprene in medical devices, footwear, and sporting goods. Brands seek to differentiate products with sustainable materials to meet consumer demand for eco-friendly alternatives. Growth in healthcare applications, particularly biocompatible gloves and tubing, provides a strong opportunity. This diversification reduces reliance on the automotive industry and broadens revenue streams for producers.
- For instance, KAUST (King Abdullah University of Science & Technology) engineered Chlamydomonas reinhardtii to express the Ipomoea batatas isoprene synthase. The best transformants achieved between 50 and 58 mg/L isoprene in sealed vial cultivation over 6 days.
Key Challenges
High Production Costs and Price Competitiveness
Bio-based isoprene production remains costlier than petroleum-based alternatives due to feedstock and processing expenses. Price fluctuations of biomass raw materials and higher capital investment in fermentation infrastructure add to challenges. Without economies of scale, cost parity is difficult to achieve, limiting adoption among price-sensitive manufacturers.
Supply Chain and Feedstock Availability
Availability of sustainable biomass feedstocks is critical for consistent bio-isoprene production. Competition with food crops for raw materials like sugarcane and corn raises sustainability concerns. Disruptions in feedstock supply can lead to production delays and hinder long-term market growth, especially in regions dependent on imports.
Regional Analysis
North America
North America holds over 35% share of the bio-based isoprene market in 2024, driven by strong adoption across the automotive and medical sectors. Leading tire manufacturers in the U.S. invest heavily in sustainable raw materials to meet corporate ESG targets. Government incentives and funding for bio-refineries support local production capacity. The region also benefits from advanced biotechnology research and strong collaborations between chemical producers and universities. Growing demand for eco-friendly medical gloves and tubing further supports market expansion, positioning North America as a key hub for innovation and early commercialization of bio-based isoprene technologies.
Europe
Europe accounts for nearly 30% of the bio-based isoprene market share in 2024, supported by stringent regulations promoting sustainable materials. The EU Green Deal and circular economy initiatives push manufacturers toward renewable feedstocks, creating steady demand. Germany and France lead adoption due to their strong automotive and chemical industries. European tire companies actively collaborate with biotech firms to scale up bio-isoprene production. Consumer preference for eco-friendly products in footwear and sporting goods also strengthens market presence. Investments in research programs and pilot-scale facilities ensure Europe maintains its competitive edge in sustainable chemical innovation and adoption.
Asia Pacific
Asia Pacific captures more than 25% share of the bio-based isoprene market in 2024, driven by rapid industrialization and expanding automotive production in China, Japan, and India. The region benefits from large-scale sugarcane and corn availability, ensuring stable feedstock supply for microbial fermentation processes. Tire manufacturers in Japan and South Korea are actively integrating bio-isoprene into premium product lines. Rising healthcare spending boosts demand for medical devices made from biocompatible materials. Supportive government policies and increasing foreign investments in bio-refineries accelerate production capacity, positioning Asia Pacific as the fastest-growing regional market through the forecast period.
Latin America
Latin America represents around 6% of the global bio-based isoprene market in 2024, with Brazil serving as the primary growth engine. Abundant sugarcane production provides a cost-effective feedstock source for microbial fermentation, attracting investments from global chemical producers. Growing automotive assembly activities and footwear manufacturing in Brazil and Mexico increase consumption of bio-based isoprene. Government initiatives to expand bio-economy projects and export capabilities further boost the region’s market potential. However, limited infrastructure for large-scale production and slower regulatory alignment with global sustainability standards somewhat constrain rapid adoption in smaller Latin American markets.
Middle East & Africa
Middle East & Africa hold close to 4% share of the bio-based isoprene market in 2024, with gradual adoption focused on niche applications. The region’s demand is primarily driven by medical device imports and small-scale automotive manufacturing. Investments in sustainable chemical projects are growing, particularly in the Gulf countries as part of economic diversification plans. Limited local production capacity and feedstock availability remain key barriers, resulting in dependence on imports. Nonetheless, increasing focus on green initiatives and partnerships with international chemical companies are expected to open new growth opportunities in the coming years.
Market Segmentations:
By Type:
- Microbial Fermentation
- Chemical Conversion
By Application:
- Automobile Tires
- Medical Appliances
- Footwear
- Sporting Goods
- Other
By Geography:
- North America
- U.S.
- Canada
- Mexico
- Europe
- UK
- France
- Germany
- Italy
- Spain
- Russia
- Rest of Europe
- Asia Pacific
- China
- Japan
- South Korea
- India
- Australia
- Southeast Asia
- Rest of Asia Pacific
- Latin America
- Brazil
- Argentina
- Rest of Latin America
- Middle East
- GCC Countries
- Israel
- Turkey
- Rest of Middle East
- Africa
- South Africa
- Egypt
- Rest of Africa
Competitive Landscape
The bio-based isoprene market features key players such as Yokohama Rubber Company, Genencor (DuPont), Mitsubishi Chemical Group Corporation, Amyris Inc. (USA), Genomatica, Inc. (USA), Gevo Inc, Braskem, Ginkgo Bioworks (USA), GlycosBio, and Ajinomoto. These companies focus on scaling production capacity through microbial fermentation and advanced metabolic engineering to meet rising demand from tire, medical, and consumer goods sectors. Strategic collaborations between biotechnology firms and tire manufacturers are driving faster commercialization of bio-isoprene. Several players are expanding bio-refinery operations and securing long-term supply agreements with automotive OEMs to ensure consistent availability. Continuous investment in R&D enhances production efficiency and lowers costs, improving price competitiveness against petroleum-based isoprene. Regional expansion strategies include partnerships with local producers and the development of feedstock supply chains in Asia and Latin America. The competitive environment is marked by innovation-driven growth, with sustainability commitments playing a major role in shaping long-term market positioning.
Key Player Analysis
- Yokohama Rubber Company
- Genencor (DuPont)
- Mitsubishi Chemical Group Corporation
- Amyris Inc. (USA)
- Genomatica, Inc. (USA)
- Gevo Inc
- Braskem
- Ginkgo Bioworks (USA)
- GlycosBio
- Ajinomoto
Recent Developments
- In 2025, Zeon and Yokohama Rubber announced plans to install a bench-scale facility at Zeon’s Tokuyama Plant. The facility will convert ethanol from plant-based and other sustainable materials into butadiene and isoprene, starting operation in 2026
- In 2024, Honda Motor adopted DURABIO from Mitsubishi Chemical for motorcycle bodywork and windshields, highlighting the role of bio-based materials in durable engineered products.
- In 2024, Gevo extended its joint development agreement with LG Chem to advance bio-propylene.
Report Coverage
The research report offers an in-depth analysis based on Type, Application and Geography. It details leading market players, providing an overview of their business, product offerings, investments, revenue streams, and key applications. Additionally, the report includes insights into the competitive environment, SWOT analysis, current market trends, as well as the primary drivers and constraints. Furthermore, it discusses various factors that have driven market expansion in recent years. The report also explores market dynamics, regulatory scenarios, and technological advancements that are shaping the industry. It assesses the impact of external factors and global economic changes on market growth. Lastly, it provides strategic recommendations for new entrants and established companies to navigate the complexities of the market.
Future Outlook
- Demand for bio-based isoprene will rise with growing focus on sustainable rubber production.
- Microbial fermentation technology will dominate due to higher yield and lower production cost.
- Partnerships between biotech firms and tire manufacturers will expand to secure long-term supply.
- Adoption in medical devices and biocompatible products will see steady growth.
- Asia Pacific will emerge as the fastest-growing market driven by automotive and healthcare demand.
- Companies will invest in bio-refinery capacity expansion to achieve economies of scale.
- Regulatory support and incentives will accelerate commercialization across major regions.
- Product innovations will improve performance and match petrochemical-based isoprene quality.
- Competition will intensify as new entrants and startups join the market.
- Focus on reducing greenhouse gas emissions will keep driving bio-based material adoption.
Request a Free Sample
Fill in your details and we'll send you a free sample report.
- Sample data tables & charts
- Research methodology
Need a Custom Version of This Report?
Tailor the scope, geography, or segments to your exact requirements.
- Custom geography or segment scope
- Direct access to our analyst team
Frequently Asked Questions
What is the current market size for Bio Based Isoprene market, and what is its projected size in 2032?
At what Compound Annual Growth Rate is the Bio Based Isoprene market projected to grow between 2025 and 2032?
Which Bio Based Isoprene market segment held the largest share in 2024?
What are the primary factors fueling the growth of the Bio Based Isoprene market?
Who are the leading companies in the Bio Based Isoprene market?
Table of Content
Chapter 1. Report Introduction
- 1.1 Report Description & Purpose
- 1.1.1 Report Title & Market Definition
- 1.1.2 Unique Selling Propositions (USP) & Key Differentiators
- 1.1.3 Value Proposition for Stakeholders
- 1.2 Research Objectives
- 1.2.1 Market Sizing Objectives (Volume & Revenue)
- 1.2.2 Segmentation Objectives
- 1.2.3 Competitive Intelligence Objectives
- 1.2.4 Forecast & Scenario Objectives
- 1.3 Report Scope
- 1.3.1 Bio Based Isoprene Scope – Types & Subtypes Covered
- 1.3.2 Geographic Scope – Regions & Countries Covered
- 1.3.3 Historical Period, Base Year & Forecast Period (2024; forecast to 2032)
- 1.3.4 Inclusions & Exclusions
- 1.4 HS Code & Classification Framework
- 1.5 Currency, Units & Pricing Basis
- 1.6 Target Stakeholders
- 1.7 Limitations & Assumptions
Chapter 2. Executive Summary
- 2.1 Global Bio Based Isoprene Market Snapshot
- 2.1.1 Market Size – Historical (2024) & Forecast (2024-2032) (2024: USD 1.13 billion → 2032: USD 1.71 billion)
- 2.1.2 Volume & Revenue – Global Totals
- 2.1.3 Key Market Highlights – Top Five Facts
- 2.2 Bio Based Isoprene Market Segmentation Snapshot
- 2.2.1 Market Split by Region – 2024 vs. 2032
- 2.3 Competitive Snapshot
- 2.3.1 Top 10 Players by Revenue Share – 2024
- 2.3.2 Top 10 Players by Volume Share – 2024
- 2.3.3 Recent Strategic Developments (18-Month Summary)
- 2.4 Key Investment Highlights & Strategic Conclusions
Chapter 3. Bio Based Isoprene Market Dynamics & Industry Analysis
- 3.1 Market Overview & Context
- 3.1.1 Bio Based Isoprene Market Position in the Broader Automotive Value Chain
- 3.1.2 OEM vs. Replacement Market Dynamics
- 3.1.3 Market Maturity & Development Stage by Region
- 3.2 Bio Based Isoprene Market Drivers
- 3.3 Bio Based Isoprene Market Restraints & Challenges
- 3.4 Bio Based Isoprene Market Opportunities
- 3.5 Porter's Five Forces Analysis
- 3.5.1 Threat of New Entrants
- 3.5.2 Bargaining Power of Suppliers
- 3.5.3 Bargaining Power of Buyers
- 3.5.4 Threat of Substitutes
- 3.5.5 Competitive Rivalry – Intensity Assessment
- 3.6 Bio Based Isoprene Value Chain Analysis
- 3.6.1 Upstream – Raw Material/Input Suppliers
- 3.6.1.1 Raw Material/Input 1
- 3.6.1.2 Raw Material/Input 2
- 3.6.1.3 Raw Material/Input 3
- 3.6.2 Midstream – Production/Manufacturing/Service Delivery
- 3.6.2.1 Production/Process Overview
- 3.6.2.2 Key Facility Locations & Capacity by Manufacturer
- 3.6.3 Downstream – Distribution & End Consumer
- 3.6.3.1 Primary Channel – B2B/OEM
- 3.6.3.2 Secondary Channels – Dealer, Retail, Online, Direct
- 3.6.4 Value Chain Profitability Analysis
- 3.6.1 Upstream – Raw Material/Input Suppliers
- 3.7 PESTEL Analysis
- 3.7.1 Political Factors
- 3.7.2 Economic Factors
- 3.7.3 Social Factors
- 3.7.4 Technological Factors
- 3.7.5 Environmental Factors
- 3.7.6 Legal Factors
- 3.8 Bio Based Isoprene Supply Chain Analysis
- 3.8.1 Raw Material/Input Supply Risk Assessment
- 3.8.2 Manufacturing Concentration Risk (Geographic Exposure)
- 3.8.3 Trade Disruption Impact Analysis
- 3.9 Regulatory & Policy Landscape
Note: The regulatory and policy landscape section covers regulations based on their applicability to the market, Bio Based Isoprene category, geography, and scope of the study. Only regulatory frameworks with a material impact on operations, compliance, trade, sustainability, or market access are analyzed in detail.
Chapter 4. Key Investment Pockets & Opportunity Analysis
- 4.1 Bio Based Isoprene Market Attractiveness Analysis
- 4.1.1 By Region – Investment Attractiveness Matrix (Volume × CAGR)
- 4.2 Absolute Revenue Growth Opportunity
- 4.2.1 By Region – Absolute USD Growth Through 2032
- 4.3 Incremental Volume Opportunity
- 4.3.1 By Region – Incremental Volume Through 2032
- 4.3.2 Segment – Incremental Volume
- 4.4 Emerging Submarket Opportunity Deep Dive (Subject to Applicability)
- 4.5 Emerging Market Opportunity Scorecards
- 4.5.1 United States
- 4.5.2 Europe
- 4.5.3 Asia
- 4.5.4 Middle East & Africa
Note: Emerging Market Opportunity Scorecards will be included based on relevance and strategic importance. Regions listed are indicative and may vary depending on data availability and market dynamics.
Chapter 5. Bio Based Isoprene Import-Export Analysis & Trade Flows
- 5.1 Global Trade Overview
- 5.1.1 Global Export Value by Country (2024)
- 5.1.2 Global Export Volume by Country (2024)
- 5.1.3 Global Import Value by Country (2024)
- 5.1.4 Global Import Volume by Country (2024)
- 5.1.5 Net Trade Balance by Country (2024)
- 5.2 Export Analysis – Segment
- 5.2.1 Type 1 (HS Code)
- 5.2.2 Type 2 (HS Code)
- 5.2.3 Type 3 (HS Code)
- 5.2.4 Type 4 (HS Code)
- 5.2.5 Type 5 (HS Code)
- 5.3 Import Analysis – Segment
- 5.3.1 Type 1 (HS Code)
- 5.3.2 Type 2 (HS Code)
- 5.3.3 Type 3 (HS Code)
- 5.3.4 Type 4 (HS Code)
- 5.3.5 Type 5 (HS Code)
- 5.4 Average Unit Trade Prices
- 5.4.1 Average Export Price – Segment & Country
- 5.4.2 Average Import Price – Segment & Source Country
- 5.4.3 Price Trends (2024)
- 5.5 Key Trade Route Analysis
- 5.5.1 Trade Route 1
- 5.5.2 Trade Route 2
- 5.5.3 Trade Route 3
- 5.5.4 Trade Route 4
- 5.5.5 Trade Route 5
- 5.6 Trade Policy Impact Assessment
- 5.6.1 US Anti-Dumping & Section 301 Tariffs
- 5.6.2 EU Customs Union Impact
- 5.6.3 Major Free Trade Agreements
- 5.6.4 USMCA Rules of Origin
Note: Trade policy analysis will be included only where relevant to the Bio Based Isoprene market.
Chapter 6. Competitive Landscape & Company Benchmarking
- 6.1 Bio Based Isoprene Market Concentration & Structure
- 6.1.1 Herfindahl-Hirschman Index (HHI) – vs. 2024
- 6.1.2 Tier 1, Tier 2 & Tier 3 Market Structure
- 6.1.3 Global, Regional & Local Player Dynamics
- 6.2 Bio Based Isoprene Market Share Analysis – 2024
- 6.2.1 Global Revenue Share by Company
- 6.2.2 Global Volume Share by Company
- 6.2.3 Regional Revenue Share
- 6.2.4 Market Share Evolution ( vs. 2024)
- 6.2.5 OEM Segment Share by Company
- 6.2.6 Replacement Segment Share by Company
- 6.3 Production/Delivery Capacity & Facility Analysis
- 6.3.1 Global Installed Capacity
- 6.3.2 Capacity Utilization Rates
- 6.3.3 Production/Output Volume
- 6.3.4 Facility Locations & Capacity Map
- 6.3.5 Planned Capacity Additions
- 6.4 Bio Based Isoprene Competitive Benchmarking Matrix
- 6.4.1 Revenue, Volume, CAGR & Profitability Comparison
- 6.4.2 Channel Revenue Mix
- 6.4.3 Geographic Revenue Exposure
- 6.4.4 R&D Intensity
- 6.4.5 Sustainability Maturity
- 6.5 Strategic Developments in Bio Based Isoprene (Last 24 Months)
- 6.5.1 Mergers, Acquisitions & Divestments
- 6.5.2 New Bio Based Isoprene Launches
- 6.5.3 Facility Expansions
- 6.5.4 Strategic Alliances, Joint Ventures & Partnerships
- 6.5.5 Distribution Expansion & Market Entry
- 6.5.6 Sustainability & ESG Initiatives
- 6.6 Competitive Strategy Mapping
- 6.6.1 Leader, Challenger, Follower & Niche Classification
- 6.6.2 Pricing Strategy Comparison
- 6.6.3 Channel Strategy Matrix
Note: Strategic developments are included based on their materiality and the availability of reliable information.
Chapter 7. Global Bio Based Isoprene Market – By Distribution Channel
- 7.1 Segment Overview
- 7.1.1 Volume & Revenue Split by Channel (2024 & 2032)
- 7.1.2 Channel Mix Evolution (2024-2032)
Chapter 8. Regional Market Analysis – Global Overview
- 8.1 Global Regional Overview
- 8.1.1 Regional Volume Share
- 8.1.2 Regional Revenue Share
- 8.1.3 Regional Volume by Region
- 8.1.4 Regional Revenue by Region
- 8.1.5 Regional Forecast Through 2032
- 8.2 Cross-Regional Segment Analysis
- 8.2.1 By Distribution Channel
- 8.2.2 By Brand/Price Tier
Chapter 9. North America Bio Based Isoprene Market
- 9.1 United States
- 9.2 Canada
- 9.3 Mexico
Chapter 10. Europe Bio Based Isoprene Market
- 10.1 Germany
- 10.2 France
- 10.3 Italy
- 10.4 United Kingdom
- 10.5 Spain
- 10.6 Poland
- 10.7 Russia
- 10.8 Netherlands
- 10.9 Belgium
- 10.10 Sweden
- 10.11 Denmark
- 10.12 Norway
- 10.13 Rest of Europe
Chapter 11. Asia Pacific Bio Based Isoprene Market
- 11.1 China
- 11.2 India
- 11.3 Japan
- 11.4 South Korea
- 11.5 Thailand
- 11.6 Indonesia
- 11.7 Vietnam
- 11.8 Malaysia
- 11.9 Australia
- 11.10 Rest of Asia Pacific
Chapter 12. Latin America Bio Based Isoprene Market
- 12.1 Brazil
- 12.2 Argentina
- 12.3 Colombia
- 12.4 Chile
- 12.5 Rest of Latin America
Chapter 13. Middle East Bio Based Isoprene Market
- 13.1 Saudi Arabia
- 13.2 United Arab Emirates
- 13.3 Turkey
- 13.4 Israel
- 13.5 Iran
- 13.6 Rest of the Middle East
Chapter 14. Africa Bio Based Isoprene Market
- 14.1 South Africa
- 14.2 Egypt
- 14.3 Nigeria
- 14.4 Morocco
- 14.5 Rest of Africa
Chapter 15. Bio Based Isoprene Company Profiles
- 15.1 [Company 01]
- 15.1.1 Company Overview
- 15.1.2 Key Management Personnel
- 15.1.3 Products & Services Portfolio
- 15.1.4 Financial Performance
- 15.1.5 Key Market Focus & Geographic Presence
- 15.1.6 Recent Developments & Strategic Initiatives
Note: The company profile list is preliminary and may change based on research findings, market developments, data availability, and client requirements.
Chapter 16. Appendices
- Appendix A – List of Abbreviations & Acronyms
- Appendix B – Industry Classification Code Reference – Full Series
- Appendix C – Production & Capacity Data Tables
- Appendix D – End-Use & Demand Base Tables
- Appendix E – Consumption & Replacement Rate Assumptions
- Appendix F – ASP Reference Tables
- Appendix G – Manufacturing & Facility Database
- Appendix H – Import-Export Data Tables
- Appendix I – Regulatory Summary Tables
- Appendix J – Primary Research Participant List (Anonymized)
- Appendix K – Primary Research Questionnaire Framework
- Appendix L – Data Sources & Bibliography
- Appendix M – Market Size Divergence & Source Comparison
Chapter 17. Research Methodology
- 17.1 Research Framework & Philosophy
- 17.2 Secondary Research – Sources, Hierarchy & Data Extraction
- 17.3 Data Modeling – Bottom-Up & Top-Down Market Sizing
- 17.4 Primary Research – Stakeholder Framework, LOI & Sample Sizes
- 17.5 Forecast Methodology – Regression, Scenario & Sensitivity Analysis
- 17.6 Quality Control – Four-Layer Validation Framework
- 17.7 Limitations & Standard Assumptions
- 17.8 Disclaimer
