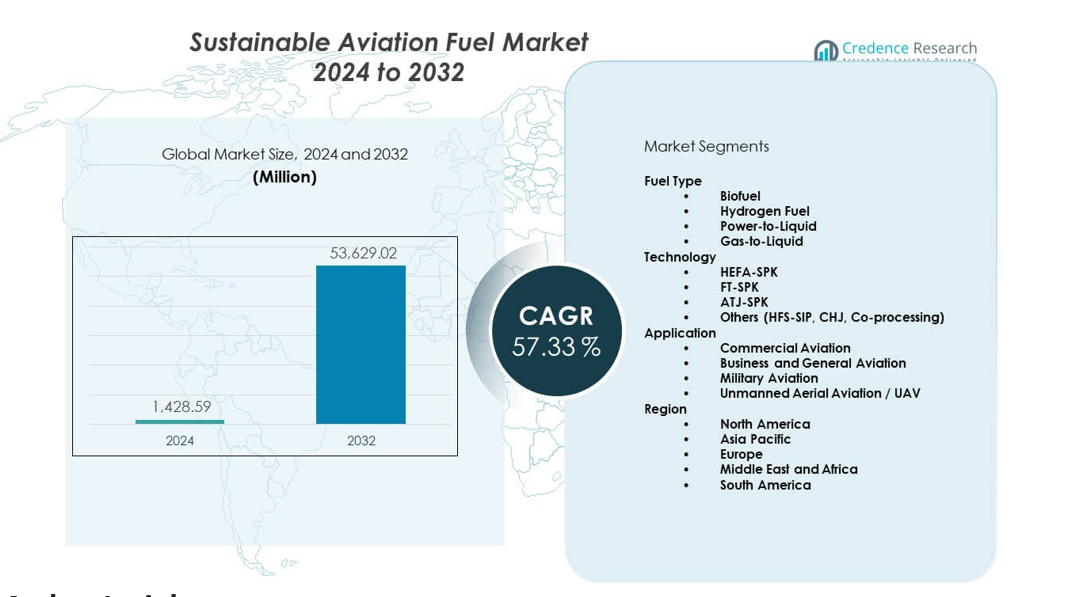
Home » Energy » Oil & Gas » Sustainable Aviation Fuel Market

Sustainable Aviation Fuel Market By Fuel Type (Biofuel, Hydrogen Fuel, Power to Liquid Fuel and Gas-to-Liquid), By Biofuel Manufacturing Technology (Hydroprocessed Fatty Acid Esters and Fatty Acids- Synthetic Paraffinic, Kerosene (HEFA-SPK) Growth, Future Prospects & Competitive Analysis, 2016 – 2030

Price: $4999

Published: | Report ID: 15619 | Report Format : PDF

Key Highlights of the report

How are the major segments performing in the Sustainable Aviation Fuel market?

  • As an alternative to jet fuel, biofuel is employed in commercial and technological channels, making it the largest section of the global sustainable aviation fuel market in 2022.
  • The 30% to 50% sector will outperform all other biofuel blinding capacity segments in 2022.

What is the Market Size of Sustainable Aviation Fuel regarding value?

The global sustainable aviation fuel market is anticipated to grow at a substantial CAGR of 60.2% in the upcoming years. The global Potassium Derivatives industry was estimated to be worth USD 204.9 million in 2022 and was expected to be worth USD 5548.6 million by 2028.

Which region dominated the sustainable aviation fuel market?

In 2022, Europe held a significant 56.2% of the worldwide market. During the projection period, the market in the area will likely expand significantly. The increased use of strict energy rules is encouraging the European aviation industry to use sustainable fuels. In Europe, scaling up the use of green aviation fuel in the coming years is likely to face a number of challenges that will need to be overcome. This will likely be made possible by strong government support for the aviation industry rather than other transport sectors (where there are already sustainable alternative energy sources available).

Design Element 2

Access crucial information at unmatched prices!

Request your free sample report today & start making informed decisions powered by Credence Research!

Download Free Sample
CTA Design Element 3

How is US Market Performing in the sustainable aviation fuel market?

In 2022, US aviation industry businesses will be working with the federal government and other stakeholders to increase the production and use of sustainable aviation fuel. For instance, The US government issued a challenge in September 2021 to produce at least 3 billion gallons of SAF annually by 2030.

How is the economy impacting global sustainable aviation fuel growth?

In many nations, rising inflation rates have considerably impacted consumers’ purchasing or spending power. A recession may affect citizens’ purchasing decisions because they prioritize their needs, and it may also lessen market liquidity. The Russia-Ukraine War also significantly negatively impacted countries that imported goods from Russia and Ukraine. In order to provide patients with Covid-19 infections with the proper medical care, the Covid-19 pandemic may also compel physicians to avoid doing unnecessary therapies. Therefore, all of these elements can prevent the market from growing.

What is the competitive environment of the sustainable aviation fuel market?

To increase their market share, the majority of businesses are implementing new technology and tactics. Sustainable aviation fuel (SAF) Manufacturers are investing heavily in thorough R&D initiatives to launch unique goods and provide reliable services. Key players frequently use mergers, acquisitions, and product portfolio expansion as major tactics.

Executive Summary

What are the key trends in the Sustainable Aviation Fuel market?

  • To cut CO2 emissions, governments worldwide use carbon capture technologies and sustainable fuels more frequently.
  • Aviation businesses have committed to cutting their net CO2 emissions by 2050.

What is the market scenario of the Sustainable Aviation Fuel Market?

Sustainable Aviation Fuel (SAF) is a renewable resource or waste fuel that satisfies sustainability standards. The fuel can be made from various renewable resources, including cooking oil, carbon dioxide extracted from the air, and forestry and agricultural waste. To cut pollution, it can be blended with any fossil jet fuel. Sustainable aviation fuel can be installed with no modifications to the aircraft or infrastructure, making it a drop-in fuel. Using sustainable, high-quality aviation fuel can significantly cut carbon dioxide emissions. Emission levels from the production, distribution, transportation and combustion of sustainable jet fuels are roughly 75% lower than those from fossil jet fuels. Oil and gas refineries have many opportunities to implement SAF technologies. The use of renewable aviation fuel contributes to a 90% and 100% reduction in the emission of hazardous particles and sulfur, respectively.

Which are the key investments by the sustainable aviation fuel market players?

Key investments include major players focusing on research and development of aviation fuels. For instance, using feedstock, including recycled cooking oil, fats, greases, and soybean oils, Phillips 66 Company announced intentions to completely convert its San Francisco Refinery in Rodeo, California, from processing crude oil to renewable fuels in September 2020. Up to 680 million gallons of renewable diesel, renewable gasoline, and SAF might be produced annually by the refinery. Atmosfair opened the world’s first jet fuel production facility in October 2021. In 2022, the factory in Landkreis Emsland, Germany, is anticipated to start churning eight barrels of synthetic kerosene daily.

Some major sustainable aviation fuel market players are Aemetis, Inc., Avfuel Corporation, Fulcrum Bioenergy, Gevo, Lanzatech, Neste, Preem AB, Sasol, SkyNRG, and World Energy.

What are the Major Driving Factors for the Sustainable Aviation Fuel Market?

The global need for sustainable aviation fuel is growing in response to the aviation industry. The use of sustainable aviation fuel (SAF) aids in the reduction of CO2 emissions. The adoption of sustainable fuels is anticipated to increase over the next few years as a result of numerous governments throughout the world pushing sustainable development in various industrial verticals. During the forecast period, a rise in investments in renewable energy and the application of stricter energy regulations are anticipated to boost the global market. Major producers of sustainable aviation fuel are switching from processing crude oil to producing renewable fuels to increase their profitability. They are also investing in carbon-free jet fuel to increase their market share.

What are the Major Risks for the Sustainable Aviation Fuel Market?

Sustainable aviation fuel is made from waste and inexpensive feedstocks, yet it still requires complex and expensive technological processes. Sustainable aviation fuel costs are higher than petro-jet because more manufacturing capacity needs to be developed.

Since manufacturing capability will be developed on a contract basis rather than as a commodity for the first few decades, sustainable aviation fuel won’t be easily accessible. In addition, the cost of developing new biofuel factories increases after they are operational, making it more challenging for them to reach the critical mass of profitability.

Which is the key fuel type in the sustainable aviation fuel market?

The environmentally friendly aviation fuel market has been divided into biofuel, power-to-liquid, and gas-to-liquid segments. In 2021, the biofuel market had the largest 95.7% market share. It is anticipated that the market will continue to rule during the projection period. Biomass, including plant and animal waste, is used to make biofuels directly and indirectly. Most raw materials used to make biofuels come from traditional natural biomass, like fuelwood, charcoal, and animal manure. They may come from crops, such as common food plants or unique energy crops. Additionally, forestry, agricultural, fisheries, and municipal waste materials can be used to make biofuels. These fuels can match the performance of jet fuels made from petroleum while producing only a small portion of carbon dioxide.

How is the sustainable aviation fuel market performing in regions?

Europe controlled a sizeable 56.2% of the global market in 2022. The market in the region is likely to grow significantly throughout the projected period. The European aviation industry is encouraged to adopt sustainable fuels through the rising usage of stringent energy regulations. In the upcoming years, expanding the use of green aviation fuel in Europe is anticipated to meet several obstacles that must be addressed. Strong government backing for the aviation industry, as opposed to other transportation sectors, is likely to make this practicable (where there are already sustainable alternative energy sources available).

The sustainable aviation fuel market is prominent in North America and Asia-Pacific. In 2022, these regions had respective market shares of 41.3% and 1.9%. American aviation industry businesses are working with the federal government and other stakeholders to increase the production and use of sustainable aviation fuel. The US government issued a challenge in September 2021 to produce at least 3 billion gallons of SAF annually by 2030.

Compared to the market in other regions, the Middle East, Africa, and Latin America are relatively small markets for sustainable aviation fuel.

Sustainable Aviation Fuel Market

What is the regulatory landscape for the sustainable aviation fuel market?

To cut CO2 emissions, governments worldwide use carbon capture technologies and sustainable fuels more frequently. The increase in SAF use is projected to reduce carbon emissions in the aviation sector. SAF might help the sector achieve net zero emissions by 2050 by reducing emissions by about 65%. The use of sustainable jet fuel is anticipated to rise in the 2030s as worldwide legislative backing and SAF’s competitiveness with fossil kerosene increase.

What is the Market Size of Sustainable Aviation Fuel regarding value?

The global sustainable aviation fuel market is anticipated to grow at a substantial CAGR of 60.2% in the upcoming years. The global Potassium Derivatives industry was estimated to be worth USD 204.9 million in 2022 and was expected to be worth USD 5548.6 million by 2028.

Shape Your Report to Specific Countries or Regions & Enjoy 30% Off!

What are the major players planning for the future of the sustainable aviation fuel market?

Aviation businesses have committed to cutting their net CO2 emissions by 2050. IATA member airlines committed to achieving net-zero carbon emissions by 2050 in October 2021. The resolution adopted at the 77th IATA Annual General Meeting in Boston, Massachusetts, aligns air travel with the Paris Agreement’s goal of keeping global warming to 1.5°C.

REPORT ATTRIBUTE DETAILS
Sustainable Aviation Fuel Market by Volume Yes
Sustainable Aviation Fuel Market by Value Yes
Sustainable Aviation Fuel Market, Tornado Analysis Yes
Sustainable Aviation Fuel Market, STAR Analysis Yes
Sustainable Aviation Fuel Market, SRC Analysis Yes
Sustainable Aviation Fuel Market, Import-Export Data Yes (On Demand)
Sustainable Aviation Fuel Market Pricing Analysis Yes (On Demand)
Sustainable Aviation Fuel Market Segment Analysis By Fuel Type (Biofuel, Hydrogen Fuel, Power to Liquid Fuel and Gas-to-Liquid)

By Biofuel Manufacturing Technology (Hydroprocessed Fatty Acid Esters and Fatty Acids- Synthetic Paraffinic, Kerosene (HEFA-SPK), Fischer Tropsch Synthetic Paraffinic Kerosene (FT-SPK), Synthetic Iso-paraffin from Fermented Hydroprocessed Sugar (HFS-SIP), Alcohol to jet SPK (AT J-SPK) and Catalytic Hydrothermolysis Jet (CHJ)

By Biofuel Blending Capacity (Below 30%, 30 to 50% and Above 50%)

By Platforms (Commercial Aviation, Military Aviation, Business & General Aviation and Unmanned Aerial Vehicle)

Sustainable Aviation Fuel Market, Regional Analysis North America (US and Canada)

Europe (Germany, UK, France, Italy, Spain, and Rest of Europe)

Asia Pacific (China, India, Japan, South Korea, South East Asia, and Rest of Asia Pacific)

Latin America (Brazil, Mexico, and Rest of Latin America)

Middle East and Africa (GCC Countries, South Africa, and Rest of Middle East and Africa)

Sustainable Aviation Fuel Market Key Companies Aemetis, Inc., Avfuel Corporation, Fulcrum Bioenergy, Gevo, Lanzatech, Neste, Preem AB, Sasol, SkyNRG, and World Energy
Sustainable Aviation Fuel Market Competitive Landscape Market Share Analysis

Competitive Benchmarking

Key Players Market Positioning

Geographical Presence Analysis

Major Strategies Adopted

Segmentation of Global Sustainable Aviation Fuel Market-

Global Sustainable Aviation Fuel Market – By Fuel Type

  • Biofuel
  • Hydrogen Fuel
  • Power to Liquid Fuel
  • Gas-to-Liquid

Global Sustainable Aviation Fuel Market – By Biofuel Manufacturing Technology

  • Hydro processed Fatty Acid Esters and Fatty Acids- Synthetic Paraffinic Kerosene (HEFA-SPK)\
  • Fischer Tropsch Synthetic Paraffinic Kerosene (FT-SPK)
  • Synthetic Iso-paraffin from Fermented Hydroprocessed Sugar (HFS-SIP)
  • Alcohol to jet SPK (AT J-SPK)
  • Catalytic Hydrothermolysis Jet (CHJ)

Global Sustainable Aviation Fuel Market – By Biofuel Blending Capacity

  • Below 30%
  • 30 to 50%
  • Above 50%

Global Sustainable Aviation Fuel Market – By Platforms

  • Commercial Aviation
  • Military Aviation
  • Business & General Aviation
  • Unmanned Aerial Vehicle

Global Sustainable Aviation Fuel Market – By Region

  • North America
    • U.S.
    • Canada
  • Europe
    • Germany
    • France
    • U.K.
    • Italy
    • Spain
    • Rest of Europe
  • Asia Pacific
    • China
    • Japan
    • India
    • South Korea
    • South-east Asia
    • Rest of Asia Pacific
  • Latin America
    • Brazil
    • Mexico
    • Rest of Latin America
  • Middle East & Africa
    • GCC Countries
    • South Africa
    • Rest of Middle East and Africa

1. Preface
1.1. Report Description
1.1.1. Purpose of the Report
1.1.2. Target Audience
1.1.3. USP and Key Offerings
1.2. Research Scope
1.3. Research Methodology
1.3.1. Phase I – Secondary Research
1.3.2. Phase II – Primary Research
1.3.3. Phase III – Expert Panel Review
1.3.4. Approach Adopted
1.3.4.1. Top-Down Approach
1.3.4.2. Bottom-Up Approach
1.3.5. Assumptions
1.4. Market Introduction
1.5. Market Research Scope

2. Executive Summary
2.1. Market Snapshot: Global Sustainable Aviation Fuel Market
2.2. Global Sustainable Aviation Fuel Market, By Fuel Type
2.3. Global Sustainable Aviation Fuel Market, By Biofuel Manufacturing Technology
2.4. Global Sustainable Aviation Fuel Market, By Biofuel Blending Capacity
2.5. Global Sustainable Aviation Fuel Market, By Platform
2.6. Global Sustainable Aviation Fuel Market, By Region

3. Market Dynamics & Factors Analysis
3.1. Introduction
3.1.1. Global Sustainable Aviation Fuel Market Value, 2017-2030, (US$ Bn)
3.1.2. Y-o-Y Growth Trend Analysis
3.2. Market Dynamics
3.2.1. Market Drivers
3.2.2. Market Restraints
3.2.3. Market Opportunities
3.2.4. Major Industry Challenges
3.3. Growth and Development Patterns
3.4. Investment Feasibility Analysis
3.5. Market Opportunity Analysis
3.5.1. Fuel Type
3.5.2. Biofuel Manufacturing Technology
3.5.3. Biofuel Blending Capacity
3.5.4. Platform
3.5.5. Geography

4. Premium Insights
4.1. STAR (Situation, Task, Action, Results) Analysis
4.2. Porter’s Five Forces Analysis
4.2.1. Threat of New Entrants
4.2.2. Bargaining Power of Buyers/Consumers
4.2.3. Bargaining Power of Suppliers
4.2.4. Threat of Substitute Types
4.2.5. Intensity of Competitive Rivalry
4.3. Key Market Trends
4.3.1. Demand Side Trends
4.3.2. Supply Side Trends
4.4. Value Chain Analysis
4.5. Technology Analysis
4.6. Analysis and Recommendations
4.7. Marketing Strategy Analysis
4.7.1. Direct Marketing
4.7.2. Indirect Marketing
4.7.3. Marketing Channel Development Trend

5. Market Positioning of Key Players, 2022
5.1. Company market share of key players, 2022
5.2. Competitive Benchmarking
5.3. Market Positioning of Key Vendors
5.4. Geographical Presence Analysis
5.5. Major Strategies Adopted by Key Players
5.5.1. Key Strategies Analysis
5.5.2. Mergers and Acquisitions
5.5.3. Partnerships
5.5.4. Product Launch
5.5.5. Geographical Expansion
5.5.6. Others

6. Economic Impact Analysis
6.1. Recession Impact
6.1.1. North America
6.1.2. Europe
6.1.3. Asia Pacific
6.1.4. Latin America
6.1.5. Middle East and Africa
6.2. Ukraine-Russia War Impact
6.2.1. North America
6.2.2. Europe
6.2.3. Asia Pacific
6.2.4. Latin America
6.2.5. Middle East and Africa
6.3. COVID-19 Impact Analysis
6.3.1. North America
6.3.2. Europe
6.3.3. Asia Pacific
6.3.4. Latin America
6.3.5. Middle East and Africa

7. Global Sustainable Aviation Fuel Market
7.1. Global Sustainable Aviation Fuel Market, by Fuel Type, 2017-2030(US$ Bn)
7.1.1. Overview
7.1.2. Global Sustainable Aviation Fuel Market, By Fuel Type, 2022 vs 2030 (in%)
7.1.3. Global Sustainable Aviation Fuel Market, By Biofuel, 2017-2030 (US$ Bn)
7.1.4. Global Sustainable Aviation Fuel Market, By Hydrogen Fuel, 2017-2030 (US$ Bn)
7.1.5. Global Sustainable Aviation Fuel Market, By Power to Liquid Fuel, 2017-2030 (US$ Bn)
7.1.6. Global Sustainable Aviation Fuel Market, By Gas-to-Liquid, 2017-2030 (US$ Bn)
7.2. Global Sustainable Aviation Fuel Market, by Biofuel Manufacturing Technology, 2017-2030(US$ Bn)
7.2.1. Overview
7.2.2. Global Sustainable Aviation Fuel Market, By Biofuel Manufacturing Technology, 2022 vs 2030 (in%)
7.2.3. Global Sustainable Aviation Fuel Market, By Hydroprocessed Fatty Acid Esters and Fatty Acids- Synthetic Paraffinic Kerosene (HEFA-SPK)\Fischer Tropsch Synthetic Paraffinic Kerosene (FT-SPK), 2017-2030 (US$ Bn)
7.2.4. Global Sustainable Aviation Fuel Market, By Synthetic Iso-paraffin from Fermented Hydroprocessed Sugar (HFS-SIP), 2017-2030 (US$ Bn)
7.2.5. Global Sustainable Aviation Fuel Market, By Alcohol to jet SPK (AT J-SPK), 2017-2030 (US$ Bn)
7.2.6. Global Sustainable Aviation Fuel Market, By Catalytic Hydrothermolysis Jet (CHJ), 2017-2030 (US$ Bn)
7.3. Global Sustainable Aviation Fuel Market, by Biofuel Blending Capacity, 2017-2030(US$ Bn)
7.3.1. Overview
7.3.2. Global Sustainable Aviation Fuel Market, By Biofuel Blending Capacity, 2022 vs 2030 (in%)
7.3.3. Global Sustainable Aviation Fuel Market, By Below 30%, 2017-2030 (US$ Bn)
7.3.4. Global Sustainable Aviation Fuel Market, By 30 to 50%, 2017-2030 (US$ Bn)
7.3.5. Global Sustainable Aviation Fuel Market, Above 50%, 2017-2030 (US$ Bn)
7.4. Global Sustainable Aviation Fuel Market, by Platform, 2017-2030(US$ Bn)
7.4.1. Overview
7.4.2. Global Sustainable Aviation Fuel Market, By Platform, 2022 vs 2030 (in%)
7.4.3. Global Sustainable Aviation Fuel Market, By Commercial Aviation, 2017-2030 (US$ Bn)
7.4.4. Global Sustainable Aviation Fuel Market, By Military Aviation, 2017-2030 (US$ Bn)
7.4.5. Global Sustainable Aviation Fuel Market, By Business & General Aviation, 2017-2030 (US$ Bn)
7.4.6. Global Sustainable Aviation Fuel Market, By Unmanned Aerial Vehicle, 2017-2030 (US$ Bn)

8. North America Sustainable Aviation Fuel Market Analysis
8.1. North America Sustainable Aviation Fuel Market, by Fuel Type, 2017-2030(US$ Bn)
8.1.1. Overview
8.1.2. SRC Analysis
8.2. North America Sustainable Aviation Fuel Market, by Biofuel Manufacturing Technology, 2017-2030(US$ Bn)
8.2.1. Overview
8.2.2. SRC Analysis
8.3. North America Sustainable Aviation Fuel Market, by Biofuel Blending Capacity, 2017-2030(US$ Bn)
8.3.1. Overview
8.3.2. SRC Analysis
8.4. North America Sustainable Aviation Fuel Market, by Platform, 2017-2030(US$ Bn)
8.4.1. Overview
8.4.2. SRC Analysis
8.5. North America Sustainable Aviation Fuel Market, by Country, 2017-2030 (US$ Bn)
8.5.1. U.S.
8.5.1.1. U.S. Sustainable Aviation Fuel Market Estimates and Forecast, 2017-2030 (US$ Bn)
8.5.1.2. U.S. Internet of Things (IoT), By Fuel Type, 2017-2030 (US$ Bn)
8.5.1.3. U.S. Internet of Things (IoT), By Biofuel Manufacturing Technology, 2017-2030 (US$ Bn)
8.5.1.4. U.S. Internet of Things (IoT), By Biofuel Blending Capacity, 2017-2030 (US$ Bn)
8.5.1.5. U.S. Internet of Things (IoT), By Platform, 2017-2030 (US$ Bn)
8.5.2. Canada
8.5.2.1. Canada Sustainable Aviation Fuel Market Estimates and Forecast, 2017-2030 (US$ Bn)
8.5.2.2. Canada Internet of Things (IoT), By Fuel Type, 2017-2030 (US$ Bn)
8.5.2.3. Canada Internet of Things (IoT), By Biofuel Manufacturing Technology, 2017-2030 (US$ Bn)
8.5.2.4. Canada Internet of Things (IoT), By Biofuel Blending Capacity, 2017-2030 (US$ Bn)
8.5.2.5. Canada Internet of Things (IoT), By Platform, 2017-2030 (US$ Bn)

9. Europe Sustainable Aviation Fuel Market Analysis
9.1. Europe Sustainable Aviation Fuel Market, by Fuel Type, 2017-2030(US$ Bn)
9.1.1. Overview
9.1.2. SRC Analysis
9.2. Europe Sustainable Aviation Fuel Market, by Biofuel Manufacturing Technology, 2017-2030(US$ Bn)
9.2.1. Overview
9.2.2. SRC Analysis
9.3. Europe Sustainable Aviation Fuel Market, by Biofuel Blending Capacity, 2017-2030(US$ Bn)
9.3.1. Overview
9.3.2. SRC Analysis
9.4. Europe Sustainable Aviation Fuel Market, by Platform, 2017-2030(US$ Bn)
9.4.1. Overview
9.4.2. SRC Analysis
9.5. Europe Sustainable Aviation Fuel Market, by Country, 2017-2030 (US$ Bn)
9.5.1. Germany
9.5.1.1. Germany Sustainable Aviation Fuel Market Estimates and Forecast, 2017-2030 (US$ Bn)
9.5.1.2. Germany Internet of Things (IoT), By Fuel Type, 2017-2030 (US$ Bn)
9.5.1.3. Germany Internet of Things (IoT), By Biofuel Manufacturing Technology, 2017-2030 (US$ Bn)
9.5.1.4. Germany Internet of Things (IoT), By Biofuel Blending Capacity, 2017-2030 (US$ Bn)
9.5.1.5. Germany Internet of Things (IoT), By Platform, 2017-2030 (US$ Bn)
9.5.2. France
9.5.2.1. France Sustainable Aviation Fuel Market Estimates and Forecast, 2017-2030 (US$ Bn)
9.5.2.2. France Internet of Things (IoT), By Fuel Type, 2017-2030 (US$ Bn)
9.5.2.3. France Internet of Things (IoT), By Biofuel Manufacturing Technology, 2017-2030 (US$ Bn)
9.5.2.4. France Internet of Things (IoT), By Biofuel Blending Capacity, 2017-2030 (US$ Bn)
9.5.2.5. France Internet of Things (IoT), By Platform, 2017-2030 (US$ Bn)
9.5.3. UK
9.5.3.1. UK Sustainable Aviation Fuel Market Estimates and Forecast, 2017-2030 (US$ Bn)
9.5.3.2. UK Internet of Things (IoT), By Fuel Type, 2017-2030 (US$ Bn)
9.5.3.3. UK Internet of Things (IoT), By Biofuel Manufacturing Technology, 2017-2030 (US$ Bn)
9.5.3.4. UK Internet of Things (IoT), By Biofuel Blending Capacity, 2017-2030 (US$ Bn)
9.5.3.5. UK Internet of Things (IoT), By Platform, 2017-2030 (US$ Bn)
9.5.4. Italy
9.5.4.1. Italy Sustainable Aviation Fuel Market Estimates and Forecast, 2017-2030 (US$ Bn)
9.5.4.2. Italy Internet of Things (IoT), By Fuel Type, 2017-2030 (US$ Bn)
9.5.4.3. Italy Internet of Things (IoT), By Biofuel Manufacturing Technology, 2017-2030 (US$ Bn)
9.5.4.4. Italy Internet of Things (IoT), By Biofuel Blending Capacity, 2017-2030 (US$ Bn)
9.5.4.5. Italy Internet of Things (IoT), By Platform, 2017-2030 (US$ Bn)
9.5.5. Spain
9.5.5.1. Spain Sustainable Aviation Fuel Market Estimates and Forecast, 2017-2030 (US$ Bn)
9.5.5.2. Spain Internet of Things (IoT), By Fuel Type, 2017-2030 (US$ Bn)
9.5.5.3. Spain Internet of Things (IoT), By Biofuel Manufacturing Technology, 2017-2030 (US$ Bn)
9.5.5.4. Spain Internet of Things (IoT), By Biofuel Blending Capacity, 2017-2030 (US$ Bn)
9.5.5.5. Spain Internet of Things (IoT), By Platform, 2017-2030 (US$ Bn)
9.5.6. Rest of Europe
9.5.6.1. Rest of Europe Sustainable Aviation Fuel Market Estimates and Forecast, 2017-2030 (US$ Bn)
9.5.6.2. Rest of Europe Internet of Things (IoT), By Fuel Type, 2017-2030 (US$ Bn)
9.5.6.3. Rest of Europe Internet of Things (IoT), By Biofuel Manufacturing Technology, 2017-2030 (US$ Bn)
9.5.6.4. Rest of Europe Internet of Things (IoT), By Biofuel Blending Capacity, 2017-2030 (US$ Bn)
9.5.6.5. Rest of Europe Internet of Things (IoT), By Platform, 2017-2030 (US$ Bn)

10. Asia Pacific Sustainable Aviation Fuel Market Analysis
10.1. Asia Pacific Sustainable Aviation Fuel Market, by Fuel Type, 2017-2030(US$ Bn)
10.1.1. Overview
10.1.2. SRC Analysis
10.2. Asia Pacific Sustainable Aviation Fuel Market, by Biofuel Manufacturing Technology, 2017-2030(US$ Bn)
10.2.1. Overview
10.2.2. SRC Analysis
10.3. Asia Pacific Sustainable Aviation Fuel Market, by Biofuel Blending Capacity, 2017-2030(US$ Bn)
10.3.1. Overview
10.3.2. SRC Analysis
10.4. Asia Pacific Sustainable Aviation Fuel Market, by Platform, 2017-2030(US$ Bn)
10.4.1. Overview
10.4.2. SRC Analysis
10.5. Asia Pacific Sustainable Aviation Fuel Market, by Country, 2017-2030 (US$ Bn)
10.5.1. China
10.5.1.1. China Sustainable Aviation Fuel Market Estimates and Forecast, 2017-2030 (US$ Bn)
10.5.1.2. China Internet of Things (IoT), By Fuel Type, 2017-2030 (US$ Bn)
10.5.1.3. China Internet of Things (IoT), By Biofuel Manufacturing Technology, 2017-2030 (US$ Bn)
10.5.1.4. China Internet of Things (IoT), By Biofuel Blending Capacity, 2017-2030 (US$ Bn)
10.5.1.5. China Internet of Things (IoT), By Platform, 2017-2030 (US$ Bn)
10.5.2. Japan
10.5.2.1. Japan Sustainable Aviation Fuel Market Estimates and Forecast, 2017-2030 (US$ Bn)
10.5.2.2. Japan Internet of Things (IoT), By Fuel Type, 2017-2030 (US$ Bn)
10.5.2.3. Japan Internet of Things (IoT), By Biofuel Manufacturing Technology, 2017-2030 (US$ Bn)
10.5.2.4. Japan Internet of Things (IoT), By Biofuel Blending Capacity, 2017-2030 (US$ Bn)
10.5.2.5. Japan Internet of Things (IoT), By Platform, 2017-2030 (US$ Bn)
10.5.3. India
10.5.3.1. India Sustainable Aviation Fuel Market Estimates and Forecast, 2017-2030 (US$ Bn)
10.5.3.2. India Internet of Things (IoT), By Fuel Type, 2017-2030 (US$ Bn)
10.5.3.3. India Internet of Things (IoT), By Biofuel Manufacturing Technology, 2017-2030 (US$ Bn)
10.5.3.4. India Internet of Things (IoT), By Biofuel Blending Capacity, 2017-2030 (US$ Bn)
10.5.3.5. India Internet of Things (IoT), By Platform, 2017-2030 (US$ Bn)
10.5.4. South Korea
10.5.4.1. South Korea Sustainable Aviation Fuel Market Estimates and Forecast, 2017-2030 (US$ Bn)
10.5.4.2. South Korea Internet of Things (IoT), By Fuel Type, 2017-2030 (US$ Bn)
10.5.4.3. South Korea Internet of Things (IoT), By Biofuel Manufacturing Technology, 2017-2030 (US$ Bn)
10.5.4.4. South Korea Internet of Things (IoT), By Biofuel Blending Capacity, 2017-2030 (US$ Bn)
10.5.4.5. South Korea Internet of Things (IoT), By Platform, 2017-2030 (US$ Bn)
10.5.5. South-East Asia
10.5.5.1. South-East Asia Sustainable Aviation Fuel Market Estimates and Forecast, 2017-2030 (US$ Bn)
10.5.5.2. South-East Asia Internet of Things (IoT), By Fuel Type, 2017-2030 (US$ Bn)
10.5.5.3. South-East Asia Internet of Things (IoT), By Biofuel Manufacturing Technology, 2017-2030 (US$ Bn)
10.5.5.4. South-East Asia Internet of Things (IoT), By Biofuel Blending Capacity, 2017-2030 (US$ Bn)
10.5.5.5. South-East Asia Internet of Things (IoT), By Platform, 2017-2030 (US$ Bn)
10.5.6. Rest of Asia Pacific
10.5.6.1. Rest of Asia Pacific Sustainable Aviation Fuel Market Estimates and Forecast, 2017-2030 (US$ Bn)
10.5.6.2. Rest of Asia Pacific Internet of Things (IoT), By Fuel Type, 2017-2030 (US$ Bn)
10.5.6.3. Rest of Asia Pacific Internet of Things (IoT), By Biofuel Manufacturing Technology, 2017-2030 (US$ Bn)
10.5.6.4. Rest of Asia Pacific Internet of Things (IoT), By Biofuel Blending Capacity, 2017-2030 (US$ Bn)
10.5.6.5. Rest of Asia Pacific Internet of Things (IoT), By Platform, 2017-2030 (US$ Bn)

11. Latin America Sustainable Aviation Fuel Market Analysis
11.1. Latin America Sustainable Aviation Fuel Market, by Fuel Type, 2017-2030(US$ Bn)
11.1.1. Overview
11.1.2. SRC Analysis
11.2. Latin America Sustainable Aviation Fuel Market, by Biofuel Manufacturing Technology, 2017-2030(US$ Bn)
11.2.1. Overview
11.2.2. SRC Analysis
11.3. Latin America Sustainable Aviation Fuel Market, by Biofuel Blending Capacity, 2017-2030(US$ Bn)
11.3.1. Overview
11.3.2. SRC Analysis
11.4. Latin America Sustainable Aviation Fuel Market, by Platform, 2017-2030(US$ Bn)
11.4.1. Overview
11.4.2. SRC Analysis
11.5. Latin America Sustainable Aviation Fuel Market, by Country, 2017-2030 (US$ Bn)
11.5.1. Brazil
11.5.1.1. Brazil Sustainable Aviation Fuel Market Estimates and Forecast, 2017-2030 (US$ Bn)
11.5.1.2. Brazil Internet of Things (IoT), By Fuel Type, 2017-2030 (US$ Bn)
11.5.1.3. Brazil Internet of Things (IoT), By Biofuel Manufacturing Technology, 2017-2030 (US$ Bn)
11.5.1.4. Brazil Internet of Things (IoT), By Biofuel Blending Capacity, 2017-2030 (US$ Bn)
11.5.1.5. Brazil Internet of Things (IoT), By Platform, 2017-2030 (US$ Bn)
11.5.2. Mexico
11.5.2.1. Mexico Sustainable Aviation Fuel Market Estimates and Forecast, 2017-2030 (US$ Bn)
11.5.2.2. Mexico Internet of Things (IoT), By Fuel Type, 2017-2030 (US$ Bn)
11.5.2.3. Mexico Internet of Things (IoT), By Biofuel Manufacturing Technology, 2017-2030 (US$ Bn)
11.5.2.4. Mexico Internet of Things (IoT), By Biofuel Blending Capacity, 2017-2030 (US$ Bn)
11.5.2.5. Mexico Internet of Things (IoT), By Platform, 2017-2030 (US$ Bn)
11.5.3. Rest of Latin America
11.5.3.1. Rest of Latin America Sustainable Aviation Fuel Market Estimates and Forecast, 2017-2030 (US$ Bn)
11.5.3.2. Rest of Latin America Internet of Things (IoT), By Fuel Type, 2017-2030 (US$ Bn)
11.5.3.3. Rest of Latin America Internet of Things (IoT), By Biofuel Manufacturing Technology, 2017-2030 (US$ Bn)
11.5.3.4. Rest of Latin America Internet of Things (IoT), By Biofuel Blending Capacity, 2017-2030 (US$ Bn)
11.5.3.5. Rest of Latin America Internet of Things (IoT), By Platform, 2017-2030 (US$ Bn)

12. Middle East and Africa Sustainable Aviation Fuel Market Analysis
12.1. Middle East and Africa Sustainable Aviation Fuel Market, by Fuel Type, 2017-2030(US$ Bn)
12.1.1. Overview
12.1.2. SRC Analysis
12.2. Middle East and Africa Sustainable Aviation Fuel Market, by Biofuel Manufacturing Technology, 2017-2030(US$ Bn)
12.2.1. Overview
12.2.2. SRC Analysis
12.3. Middle East and Africa Sustainable Aviation Fuel Market, by Biofuel Blending Capacity, 2017-2030(US$ Bn)
12.3.1. Overview
12.3.2. SRC Analysis
12.4. Middle East and Africa Sustainable Aviation Fuel Market, by Platform, 2017-2030(US$ Bn)
12.4.1. Overview
12.4.2. SRC Analysis
12.5. Middle East and Africa Sustainable Aviation Fuel Market, by Country, 2017-2030 (US$ Bn)
12.5.1. GCC Countries
12.5.1.1. GCC Countries il Sustainable Aviation Fuel Market Estimates and Forecast, 2017-2030 (US$ Bn)
12.5.1.2. GCC Countries Internet of Things (IoT), By Fuel Type, 2017-2030 (US$ Bn)
12.5.1.3. GCC Countries Internet of Things (IoT), By Biofuel Manufacturing Technology, 2017-2030 (US$ Bn)
12.5.1.4. GCC Countries Internet of Things (IoT), By Biofuel Blending Capacity, 2017-2030 (US$ Bn)
12.5.1.5. GCC Countries Internet of Things (IoT), By Platform, 2017-2030 (US$ Bn)
12.5.2. South Africa
12.5.2.1. South Africa Sustainable Aviation Fuel Market Estimates and Forecast, 2017-2030 (US$ Bn)
12.5.2.2. South Africa Internet of Things (IoT), By Fuel Type, 2017-2030 (US$ Bn)
12.5.2.3. South Africa Internet of Things (IoT), By Biofuel Manufacturing Technology, 2017-2030 (US$ Bn)
12.5.2.4. South Africa Internet of Things (IoT), By Biofuel Blending Capacity, 2017-2030 (US$ Bn)
12.5.2.5. South Africa Internet of Things (IoT), By Platform, 2017-2030 (US$ Bn)
12.5.3. Rest of Middle East and Africa
12.5.3.1. Rest of Middle East and Africa Sustainable Aviation Fuel Market Estimates and Forecast, 2017-2030 (US$ Bn)
12.5.3.2. Rest of Middle East and Africa Internet of Things (IoT), By Fuel Type, 2017-2030 (US$ Bn)
12.5.3.3. Rest of Middle East and Africa Internet of Things (IoT), By Biofuel Manufacturing Technology, 2017-2030 (US$ Bn)
12.5.3.4. Rest of Middle East and Africa Internet of Things (IoT), By Biofuel Blending Capacity, 2017-2030 (US$ Bn)
12.5.3.5. Rest of Middle East and Africa Internet of Things (IoT), By Platform, 2017-2030 (US$ Bn)

13. Company Profiles
13.1. Aemetis, Inc
13.1.1. Company Overview
13.1.2. Products/Power to Liquid Fuel Portfolio
13.1.3. Geographical Presence
13.1.4. Financial Summary
13.1.4.1. Market Revenue and Net Profit (2019-2022)
13.1.4.2. Business Segment Revenue Analysis
13.1.4.3. Geographical Revenue Analysis
13.2. Avfuel Corporation
13.3. Fulcrum Bioenergy
13.4. Gevo
13.5. Lanzatech
13.6. Neste
13.7. Preem AB
13.8. Sasol
13.9. SkyNRG
13.10. World Energy
13.11. Others

List of Figures
FIG. 1 Global Sustainable Aviation Fuel Market: Research Methodology
FIG. 2 Market Size Estimation – Top Down & Bottom up Approach
FIG. 3 Global Sustainable Aviation Fuel Market Segmentation
FIG. 4 Global Sustainable Aviation Fuel Market, by Fuel Type, 2022 (US$ Bn)
FIG. 5 Global Sustainable Aviation Fuel Market, by Biofuel Manufacturing Technology, 2022 (US$ Bn)
FIG. 6 Global Sustainable Aviation Fuel Market, by Biofuel Blending Capacity Type, 2022 (US$ Bn)
FIG. 7 Global Sustainable Aviation Fuel Market, by Platform, 2022 (US$ Bn)
FIG. 8 Global Sustainable Aviation Fuel Market, by Geography, 2022 (US$ Bn)
FIG. 9 Attractive Investment Proposition, by Fuel Type, 2022
FIG. 10 Attractive Investment Proposition, by Biofuel Manufacturing Technology, 2022
FIG. 11 Attractive Investment Proposition, by Biofuel Blending Capacity Type, 2022
FIG. 12 Attractive Investment Proposition, by Platform, 2022
FIG. 13 Attractive Investment Proposition, by Geography, 2022
FIG. 14 Global Market Share Analysis of Key Sustainable Aviation Fuel Market Manufacturers, 2022
FIG. 15 Global Market Positioning of Key Sustainable Aviation Fuel Market Manufacturers, 2022
FIG. 16 Global Sustainable Aviation Fuel Market Value Contribution, By Fuel Type, 2022 & 2030 (Value %)
FIG. 17 Global Sustainable Aviation Fuel Market, by Biofuel, Value, 2017-2030 (US$ Bn)
FIG. 18 Global Sustainable Aviation Fuel Market, by Hydrogen Fuel, Value, 2017-2030 (US$ Bn)
FIG. 19 Global Sustainable Aviation Fuel Market, by Power to Liquid Fuel, Value, 2017-2030 (US$ Bn)
FIG. 20 Global Sustainable Aviation Fuel Market, by Gas to Liquid, Value, 2017-2030 (US$ Bn)
FIG. 21 Global Sustainable Aviation Fuel Market Value Contribution, By Biofuel Manufacturing Technology, 2022 & 2030 (Value %)
FIG. 22 Global Sustainable Aviation Fuel Market, by Hydroprocessed Fatty Acid Esters and Fatty Acids- Synthetic Paraffinic Kerosene (HEFA-SPK)\Fischer Tropsch Synthetic Paraffinic Kerosene (FT-SPK), Value, 2017-2030 (US$ Bn)
FIG. 23 Global Sustainable Aviation Fuel Market, by Synthetic Iso-paraffin from Fermented Hydroprocessed Sugar (HFS-SIP), Value, 2017-2030 (US$ Bn)
FIG. 24 Global Sustainable Aviation Fuel Market, by Alcohol to jet SPK (AT J-SPK), Value, 2017-2030 (US$ Bn)
FIG. 25 Global Sustainable Aviation Fuel Market, by Catalytic Hydrothermolysis Jet (CHJ), Value, 2017-2030 (US$ Bn)
FIG. 26 Global Sustainable Aviation Fuel Market Value Contribution, By Biofuel Blending Capacity, 2022 & 2030 (Value %)
FIG. 27 Global Sustainable Aviation Fuel Market, by Below 30%, Value, 2017-2030 (US$ Bn)
FIG. 28 Global Sustainable Aviation Fuel Market, by 30 to 50%, Value, 2017-2030 (US$ Bn)
FIG. 29 Global Sustainable Aviation Fuel Market, by Above 50%, Value, 2017-2030 (US$ Bn)
FIG. 30 Global Sustainable Aviation Fuel Market Value Contribution, By Platform, 2022 & 2030 (Value %)
FIG. 31 Global Sustainable Aviation Fuel Market, by Commercial Aviation, Value, 2017-2030 (US$ Bn)
FIG. 32 Global Sustainable Aviation Fuel Market, by Military Aviation, Value, 2017-2030 (US$ Bn)
FIG. 33 Global Sustainable Aviation Fuel Market, by Business & General Aviation, Value, 2017-2030 (US$ Bn)
FIG. 34 Global Sustainable Aviation Fuel Market, by Unmanned Aerial Vehicle, Value, 2017-2030 (US$ Bn)
FIG. 35 U.S. Sustainable Aviation Fuel Market, 2017-2030 (US$ Bn)
FIG. 36 Canada Sustainable Aviation Fuel Market, 2017-2030 (US$ Bn)
FIG. 37 Germany Sustainable Aviation Fuel Market, 2017-2030 (US$ Bn)
FIG. 38 France Sustainable Aviation Fuel Market, 2017-2030 (US$ Bn)
FIG. 39 U.K. Sustainable Aviation Fuel Market, 2017-2030 (US$ Bn)
FIG. 40 Italy Sustainable Aviation Fuel Market, 2017-2030 (US$ Bn)
FIG. 41 Spain Sustainable Aviation Fuel Market, 2017-2030 (US$ Bn)
FIG. 42 Rest of Europe Sustainable Aviation Fuel Market, 2017-2030 (US$ Bn)
FIG. 43 China Sustainable Aviation Fuel Market, 2017-2030 (US$ Bn)
FIG. 44 Japan Sustainable Aviation Fuel Market, 2017-2030 (US$ Bn)
FIG. 45 India Sustainable Aviation Fuel Market, 2017-2030 (US$ Bn)
FIG. 46 South Korea Sustainable Aviation Fuel Market, 2017-2030 (US$ Bn)
FIG. 47 Southeast Asia Sustainable Aviation Fuel Market, 2017-2030 (US$ Bn)
FIG. 48 Rest of Asia Pacific Sustainable Aviation Fuel Market, 2017-2030 (US$ Bn)
FIG. 49 Latin America Sustainable Aviation Fuel Market, 2017-2030 (US$ Bn)
FIG. 50 Brazil Sustainable Aviation Fuel Market, 2017-2030 (US$ Bn)
FIG. 51 Mexico Sustainable Aviation Fuel Market, 2017-2030 (US$ Bn)
FIG. 52 Rest of Latin America Sustainable Aviation Fuel Market, 2017-2030 (US$ Bn)
FIG. 53 Middle East & Africa Sustainable Aviation Fuel Market, 2017-2030 (US$ Bn)
FIG. 54 GCC Countries Sustainable Aviation Fuel Market, 2017-2030 (US$ Bn)
FIG. 55 South Africa Sustainable Aviation Fuel Market, 2017-2030 (US$ Bn)
FIG. 56 Rest of Middle East and Africa Sustainable Aviation Fuel Market, 2017-2030 (US$ Bn)

List of Tables
TABLE 1 Market Snapshot: Global Sustainable Aviation Fuel Market
TABLE 2 Global Sustainable Aviation Fuel Market, by Competitive Benchmarking, 2022
TABLE 3 Global Sustainable Aviation Fuel Market, by Geographical Presence Analysis, 2022
TABLE 4 Global Sustainable Aviation Fuel Market, by Key Strategies Analysis, 2022
TABLE 5 Global Sustainable Aviation Fuel Market, by Fuel Type, 2017-2030 (US$ Bn)
TABLE 6 Global Sustainable Aviation Fuel Market, by Biofuel Manufacturing Technology, 2017-2030 (US$ Bn)
TABLE 7 Global Sustainable Aviation Fuel Market, by Biofuel Blending Capacity, 2017-2030 (US$ Bn)
TABLE 8 Global Sustainable Aviation Fuel Market, by Platform, 2017-2030 (US$ Bn)
TABLE 9 Global Sustainable Aviation Fuel Market, by Geography, 2017-2030 (US$ Bn)
TABLE 10 North America Sustainable Aviation Fuel Market, by Fuel Type, 2017-2030 (US$ Bn)
TABLE 11 North America Sustainable Aviation Fuel Market, by Biofuel Manufacturing Technology, 2017-2030 (US$ Bn)
TABLE 12 North America Sustainable Aviation Fuel Market, by Biofuel Blending Capacity, 2017-2030 (US$ Bn)
TABLE 13 North America Sustainable Aviation Fuel Market, by Platform, 2017-2030 (US$ Bn)
TABLE 14 North America Sustainable Aviation Fuel Market, by Country, 2017-2030 (US$ Bn)
TABLE 15 US Sustainable Aviation Fuel Market, by Fuel Type, 2017-2030 (US$ Bn)
TABLE 16 US Sustainable Aviation Fuel Market, by Biofuel Manufacturing Technology, 2017-2030 (US$ Bn)
TABLE 17 US Sustainable Aviation Fuel Market, by Biofuel Blending Capacity, 2017-2030 (US$ Bn)
TABLE 18 US Sustainable Aviation Fuel Market, by Platform, 2017-2030 (US$ Bn)
TABLE 19 Canada Sustainable Aviation Fuel Market, by Fuel Type, 2017-2030 (US$ Bn)
TABLE 20 Canada Sustainable Aviation Fuel Market, by Biofuel Manufacturing Technology, 2017-2030 (US$ Bn)
TABLE 21 Canada Sustainable Aviation Fuel Market, by Biofuel Blending Capacity, 2017-2030 (US$ Bn)
TABLE 22 Canada Sustainable Aviation Fuel Market, by Platform, 2017-2030 (US$ Bn)
TABLE 23 Europe Sustainable Aviation Fuel Market, by Fuel Type, 2017-2030 (US$ Bn)
TABLE 24 Europe Sustainable Aviation Fuel Market, by Biofuel Manufacturing Technology, 2017-2030 (US$ Bn)
TABLE 25 Europe Sustainable Aviation Fuel Market, by Biofuel Blending Capacity, 2017-2030 (US$ Bn)
TABLE 26 Europe Sustainable Aviation Fuel Market, by Platform, 2017-2030 (US$ Bn)
TABLE 27 Europe Sustainable Aviation Fuel Market, by Country, 2017-2030 (US$ Bn)
TABLE 28 Germany Sustainable Aviation Fuel Market, by Fuel Type, 2017-2030 (US$ Bn)
TABLE 29 Germany Sustainable Aviation Fuel Market, by Biofuel Manufacturing Technology, 2017-2030 (US$ Bn)
TABLE 30 Germany Sustainable Aviation Fuel Market, by Biofuel Blending Capacity, 2017-2030 (US$ Bn)
TABLE 31 Germany Sustainable Aviation Fuel Market, by Platform, 2017-2030 (US$ Bn)
TABLE 32 France Sustainable Aviation Fuel Market, by Fuel Type, 2017-2030 (US$ Bn)
TABLE 33 France Sustainable Aviation Fuel Market, by Biofuel Manufacturing Technology, 2017-2030 (US$ Bn)
TABLE 34 France Sustainable Aviation Fuel Market, by Biofuel Blending Capacity, 2017-2030 (US$ Bn)
TABLE 35 France Sustainable Aviation Fuel Market, by Platform, 2017-2030 (US$ Bn)
TABLE 36 UK Sustainable Aviation Fuel Market, by Fuel Type, 2017-2030 (US$ Bn)
TABLE 37 UK Sustainable Aviation Fuel Market, by Biofuel Manufacturing Technology, 2017-2030 (US$ Bn)
TABLE 38 UK Sustainable Aviation Fuel Market, by Biofuel Blending Capacity, 2017-2030 (US$ Bn)
TABLE 39 UK Sustainable Aviation Fuel Market, by Platform, 2017-2030 (US$ Bn)
TABLE 40 Italy Sustainable Aviation Fuel Market, by Fuel Type, 2017-2030 (US$ Bn)
TABLE 41 Italy Sustainable Aviation Fuel Market, by Biofuel Manufacturing Technology, 2017-2030 (US$ Bn)
TABLE 42 Italy Sustainable Aviation Fuel Market, by Biofuel Blending Capacity, 2017-2030 (US$ Bn)
TABLE 43 Italy Sustainable Aviation Fuel Market, by Platform, 2017-2030 (US$ Bn)
TABLE 44 Spain Sustainable Aviation Fuel Market, by Fuel Type, 2017-2030 (US$ Bn)
TABLE 45 Spain Sustainable Aviation Fuel Market, by Biofuel Manufacturing Technology, 2017-2030 (US$ Bn)
TABLE 46 Spain Sustainable Aviation Fuel Market, by Biofuel Blending Capacity, 2017-2030 (US$ Bn)
TABLE 47 Spain Sustainable Aviation Fuel Market, by Platform, 2017-2030 (US$ Bn)
TABLE 48 Rest of Europe Sustainable Aviation Fuel Market, by Fuel Type, 2017-2030 (US$ Bn)
TABLE 49 Rest of Europe Sustainable Aviation Fuel Market, by Biofuel Manufacturing Technology, 2017-2030 (US$ Bn)
TABLE 50 Rest of Europe Sustainable Aviation Fuel Market, by Biofuel Blending Capacity, 2017-2030 (US$ Bn)
TABLE 51 Rest of Europe Sustainable Aviation Fuel Market, by Platform, 2017-2030 (US$ Bn)
TABLE 52 Asia Pacific Sustainable Aviation Fuel Market, by Fuel Type, 2017-2030 (US$ Bn)
TABLE 53 Asia Pacific Sustainable Aviation Fuel Market, by Biofuel Manufacturing Technology, 2017-2030 (US$ Bn)
TABLE 54 Asia Pacific Sustainable Aviation Fuel Market, by Biofuel Blending Capacity, 2017-2030 (US$ Bn)
TABLE 55 Asia Pacific Sustainable Aviation Fuel Market, by Platform, 2017-2030 (US$ Bn)
TABLE 56 Asia Pacific Sustainable Aviation Fuel Market, by Country, 2017-2030 (US$ Bn)
TABLE 57 China Sustainable Aviation Fuel Market, by Fuel Type, 2017-2030 (US$ Bn)
TABLE 58 China Sustainable Aviation Fuel Market, by Biofuel Manufacturing Technology, 2017-2030 (US$ Bn)
TABLE 59 China Sustainable Aviation Fuel Market, by Biofuel Blending Capacity, 2017-2030 (US$ Bn)
TABLE 60 China Sustainable Aviation Fuel Market, by Platform, 2017-2030 (US$ Bn)
TABLE 61 Japan Sustainable Aviation Fuel Market, by Fuel Type, 2017-2030 (US$ Bn)
TABLE 62 Japan Sustainable Aviation Fuel Market, by Biofuel Manufacturing Technology, 2017-2030 (US$ Bn)
TABLE 63 Japan Sustainable Aviation Fuel Market, by Biofuel Blending Capacity, 2017-2030 (US$ Bn)
TABLE 64 Japan Sustainable Aviation Fuel Market, by Platform, 2017-2030 (US$ Bn)
TABLE 65 India Sustainable Aviation Fuel Market, by Fuel Type, 2017-2030 (US$ Bn)
TABLE 66 India Sustainable Aviation Fuel Market, by Biofuel Manufacturing Technology, 2017-2030 (US$ Bn)
TABLE 67 India Sustainable Aviation Fuel Market, by Biofuel Blending Capacity, 2017-2030 (US$ Bn)
TABLE 68 India Sustainable Aviation Fuel Market, by Platform, 2017-2030 (US$ Bn)
TABLE 69 South Korea Sustainable Aviation Fuel Market, by Fuel Type, 2017-2030 (US$ Bn)
TABLE 70 South Korea Sustainable Aviation Fuel Market, by Biofuel Manufacturing Technology, 2017-2030 (US$ Bn)
TABLE 71 South Korea Sustainable Aviation Fuel Market, by Biofuel Blending Capacity, 2017-2030 (US$ Bn)
TABLE 72 South Korea Sustainable Aviation Fuel Market, by Platform, 2017-2030 (US$ Bn)
TABLE 73 South East Asia Sustainable Aviation Fuel Market, by Fuel Type, 2017-2030 (US$ Bn)
TABLE 74 South East Asia Sustainable Aviation Fuel Market, by Biofuel Manufacturing Technology, 2017-2030 (US$ Bn)
TABLE 75 South East Asia Sustainable Aviation Fuel Market, by Biofuel Blending Capacity, 2017-2030 (US$ Bn)
TABLE 76 South East Asia Sustainable Aviation Fuel Market, by Platform, 2017-2030 (US$ Bn)
TABLE 77 Rest of Asia Pacific Sustainable Aviation Fuel Market, by Fuel Type, 2017-2030 (US$ Bn)
TABLE 78 Rest of Asia Pacific Sustainable Aviation Fuel Market, by Biofuel Manufacturing Technology, 2017-2030 (US$ Bn)
TABLE 79 Rest of Asia Pacific Sustainable Aviation Fuel Market, by Biofuel Blending Capacity, 2017-2030 (US$ Bn)
TABLE 80 Rest of Asia Pacific Sustainable Aviation Fuel Market, by Platform, 2017-2030 (US$ Bn)
TABLE 81 Latin America Sustainable Aviation Fuel Market, by Fuel Type, 2017-2030 (US$ Bn)
TABLE 82 Latin America Sustainable Aviation Fuel Market, by Biofuel Manufacturing Technology, 2017-2030 (US$ Bn)
TABLE 83 Latin America Sustainable Aviation Fuel Market, by Biofuel Blending Capacity, 2017-2030 (US$ Bn)
TABLE 84 Latin America Sustainable Aviation Fuel Market, by Platform, 2017-2030 (US$ Bn)
TABLE 85 Latin America Sustainable Aviation Fuel Market, by Country, 2017-2030 (US$ Bn)
TABLE 86 Brazil Sustainable Aviation Fuel Market, by Fuel Type, 2017-2030 (US$ Bn)
TABLE 87 Brazil Sustainable Aviation Fuel Market, by Biofuel Manufacturing Technology, 2017-2030 (US$ Bn)
TABLE 88 Brazil Sustainable Aviation Fuel Market, by Biofuel Blending Capacity, 2017-2030 (US$ Bn)
TABLE 89 Brazil Sustainable Aviation Fuel Market, by Platform, 2017-2030 (US$ Bn)
TABLE 90 Mexico Sustainable Aviation Fuel Market, by Fuel Type, 2017-2030 (US$ Bn)
TABLE 91 Mexico Sustainable Aviation Fuel Market, by Biofuel Manufacturing Technology, 2017-2030 (US$ Bn)
TABLE 92 Mexico Sustainable Aviation Fuel Market, by Biofuel Blending Capacity, 2017-2030 (US$ Bn)
TABLE 93 Mexico Sustainable Aviation Fuel Market, by Platform, 2017-2030 (US$ Bn)
TABLE 94 Rest of Latin America Sustainable Aviation Fuel Market, by Fuel Type, 2017-2030 (US$ Bn)
TABLE 95 Rest of Latin America Sustainable Aviation Fuel Market, by Biofuel Manufacturing Technology, 2017-2030 (US$ Bn)
TABLE 96 Rest of Latin America Sustainable Aviation Fuel Market, by Biofuel Blending Capacity, 2017-2030 (US$ Bn)
TABLE 97 Rest of Latin America Sustainable Aviation Fuel Market, by Platform, 2017-2030 (US$ Bn)
TABLE 98 Middle East and Africa Sustainable Aviation Fuel Market, by Fuel Type, 2017-2030 (US$ Bn)
TABLE 99 Middle East and Africa Sustainable Aviation Fuel Market, by Biofuel Manufacturing Technology, 2017-2030 (US$ Bn)
TABLE 100 Middle East and Africa Sustainable Aviation Fuel Market, by Biofuel Blending Capacity, 2017-2030 (US$ Bn)
TABLE 101 Middle East and Africa Sustainable Aviation Fuel Market, by Platform, 2017-2030 (US$ Bn)
TABLE 102 Middle East and Africa Sustainable Aviation Fuel Market, by Country, 2017-2030 (US$ Bn)
TABLE 103 GCC Countries Sustainable Aviation Fuel Market, by Fuel Type, 2017-2030 (US$ Bn)
TABLE 104 GCC Countries Sustainable Aviation Fuel Market, by Biofuel Manufacturing Technology, 2017-2030 (US$ Bn)
TABLE 105 GCC Countries Sustainable Aviation Fuel Market, by Biofuel Blending Capacity, 2017-2030 (US$ Bn)
TABLE 106 GCC Countries Sustainable Aviation Fuel Market, by Platform, 2017-2030 (US$ Bn)
TABLE 107 South Africa Sustainable Aviation Fuel Market, by Fuel Type, 2017-2030 (US$ Bn)
TABLE 108 South Africa Sustainable Aviation Fuel Market, by Biofuel Manufacturing Technology, 2017-2030 (US$ Bn)
TABLE 109 South Africa Sustainable Aviation Fuel Market, by Biofuel Blending Capacity, 2017-2030 (US$ Bn)
TABLE 110 South Africa Sustainable Aviation Fuel Market, by Platform, 2017-2030 (US$ Bn)
TABLE 111 Rest of Middle East and Africa Sustainable Aviation Fuel Market, by Fuel Type, 2017-2030 (US$ Bn)
TABLE 112 Rest of Middle East and Africa Sustainable Aviation Fuel Market, by Biofuel Manufacturing Technology, 2017-2030 (US$ Bn)
TABLE 113 Rest of Middle East and Africa Sustainable Aviation Fuel Market, by Biofuel Blending Capacity, 2017-2030 (US$ Bn)
TABLE 114 Rest of Middle East and Africa Sustainable Aviation Fuel Market, by Platform, 2017-2030 (US$ Bn)

Frequently asked questions

How does COVID-19 Impact the global sustainable aviation fuel market?

COVID-19 has had a substantial impact on the market due to the outbreak of the COVID-19 pandemic, which directly suspended transportation activities for a considerable period.

Which is the leading region of the market for sustainable aviation fuel?

Europe accounted for the most heightened share market.

What are the key drivers for sustainable aviation fuel market growth?

Increasing demand for lower carbon emission fuels to drive the sustainable aviation fuel market.

Which is the major fuel type segment in the sustainable aviation fuel market?

The biofuel segment had a major share in the global market in 2022.

Which is the major segment in the sustainable aviation fuel market by platform?

The commercial segment had a major share in the global market.

Drilling Fluids Market

Published:
Report ID: 5398

Intelligent Pigging Services Market

Published:
Report ID: 6909

Drill Bits Market

Published:
Report ID: 5399

Pipeline Leak Detection Market

Published:
Report ID: 9703

Pressure Pumping Market

Published:
Report ID: 6029

Sulphur Recovery Technology Market

Published:
Report ID: 10000

Production Oilfield Services & Equipment Market

Published:
Report ID: 8057

Gas Detection Equipment Market

Published:
Report ID: 6046

Drilling Polymers Market

Published:
Report ID: 23676

Biodiesel Market

Published:
Report ID: 3129

Oil And Gas Actuators Market

Published:
Report ID: 20012

Liner Hanger System Market

Published:
Report ID: 19184

Purchase Options

$2999
Delivery Format: Excel.
$4999
Designed for the individual purchaser.
$6999
Users located at a single corporate site or regional office.
$7999
Allowed for unlimited sharing globally within one company.
Smallform of Sample request

Have a question?

User Profile

Don’t settle for less – trust Mitul to help you find the best solution.

Report delivery within 24 to 48 hours

– Other Info –

What people say?-

User Review

I am very impressed with the information in this report. The author clearly did their research when they came up with this product and it has already given me a lot of ideas.

Jana Schmidt
CEDAR CX Technologies

– Connect with us –

Phone

+91 6232 49 3207


support

24/7 Research Support


sales@credenceresearch.com

– Research Methodology –

Going beyond the basics: advanced techniques in research methodology

– Trusted By –

Pepshi, LG, Nestle
Motorola, Honeywell, Johnson and johnson
LG Chem, SIEMENS, Pfizer
Unilever, Samsonite, QIAGEN