Cell culture sampling devices move toward closed transfers
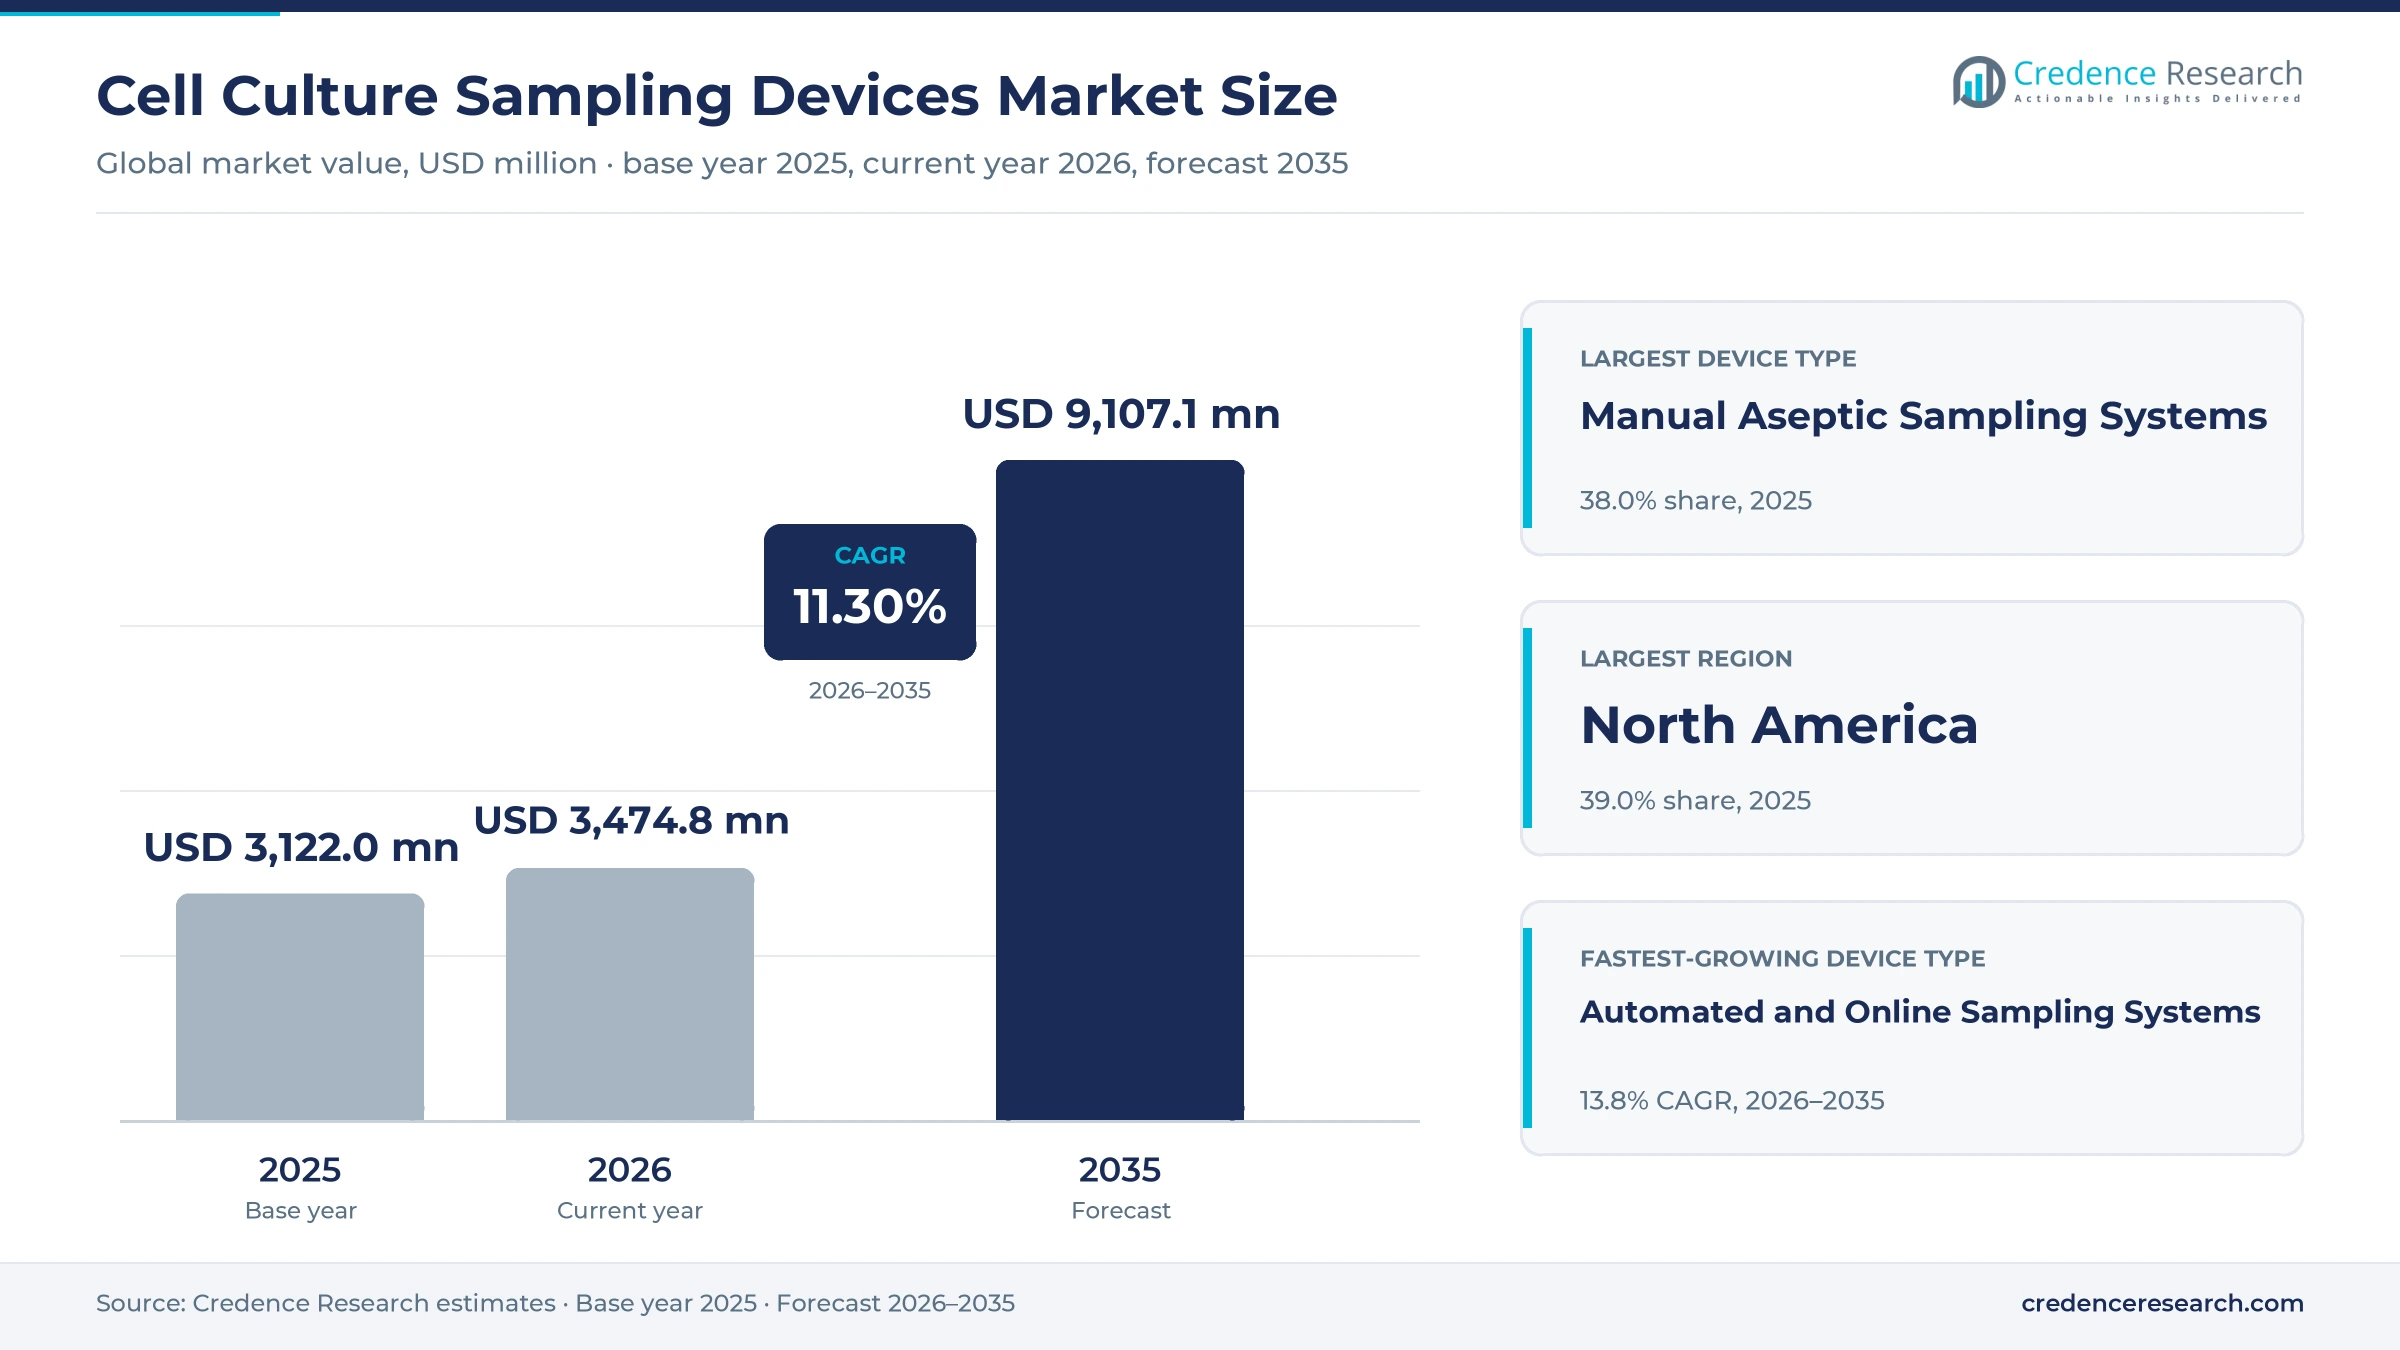
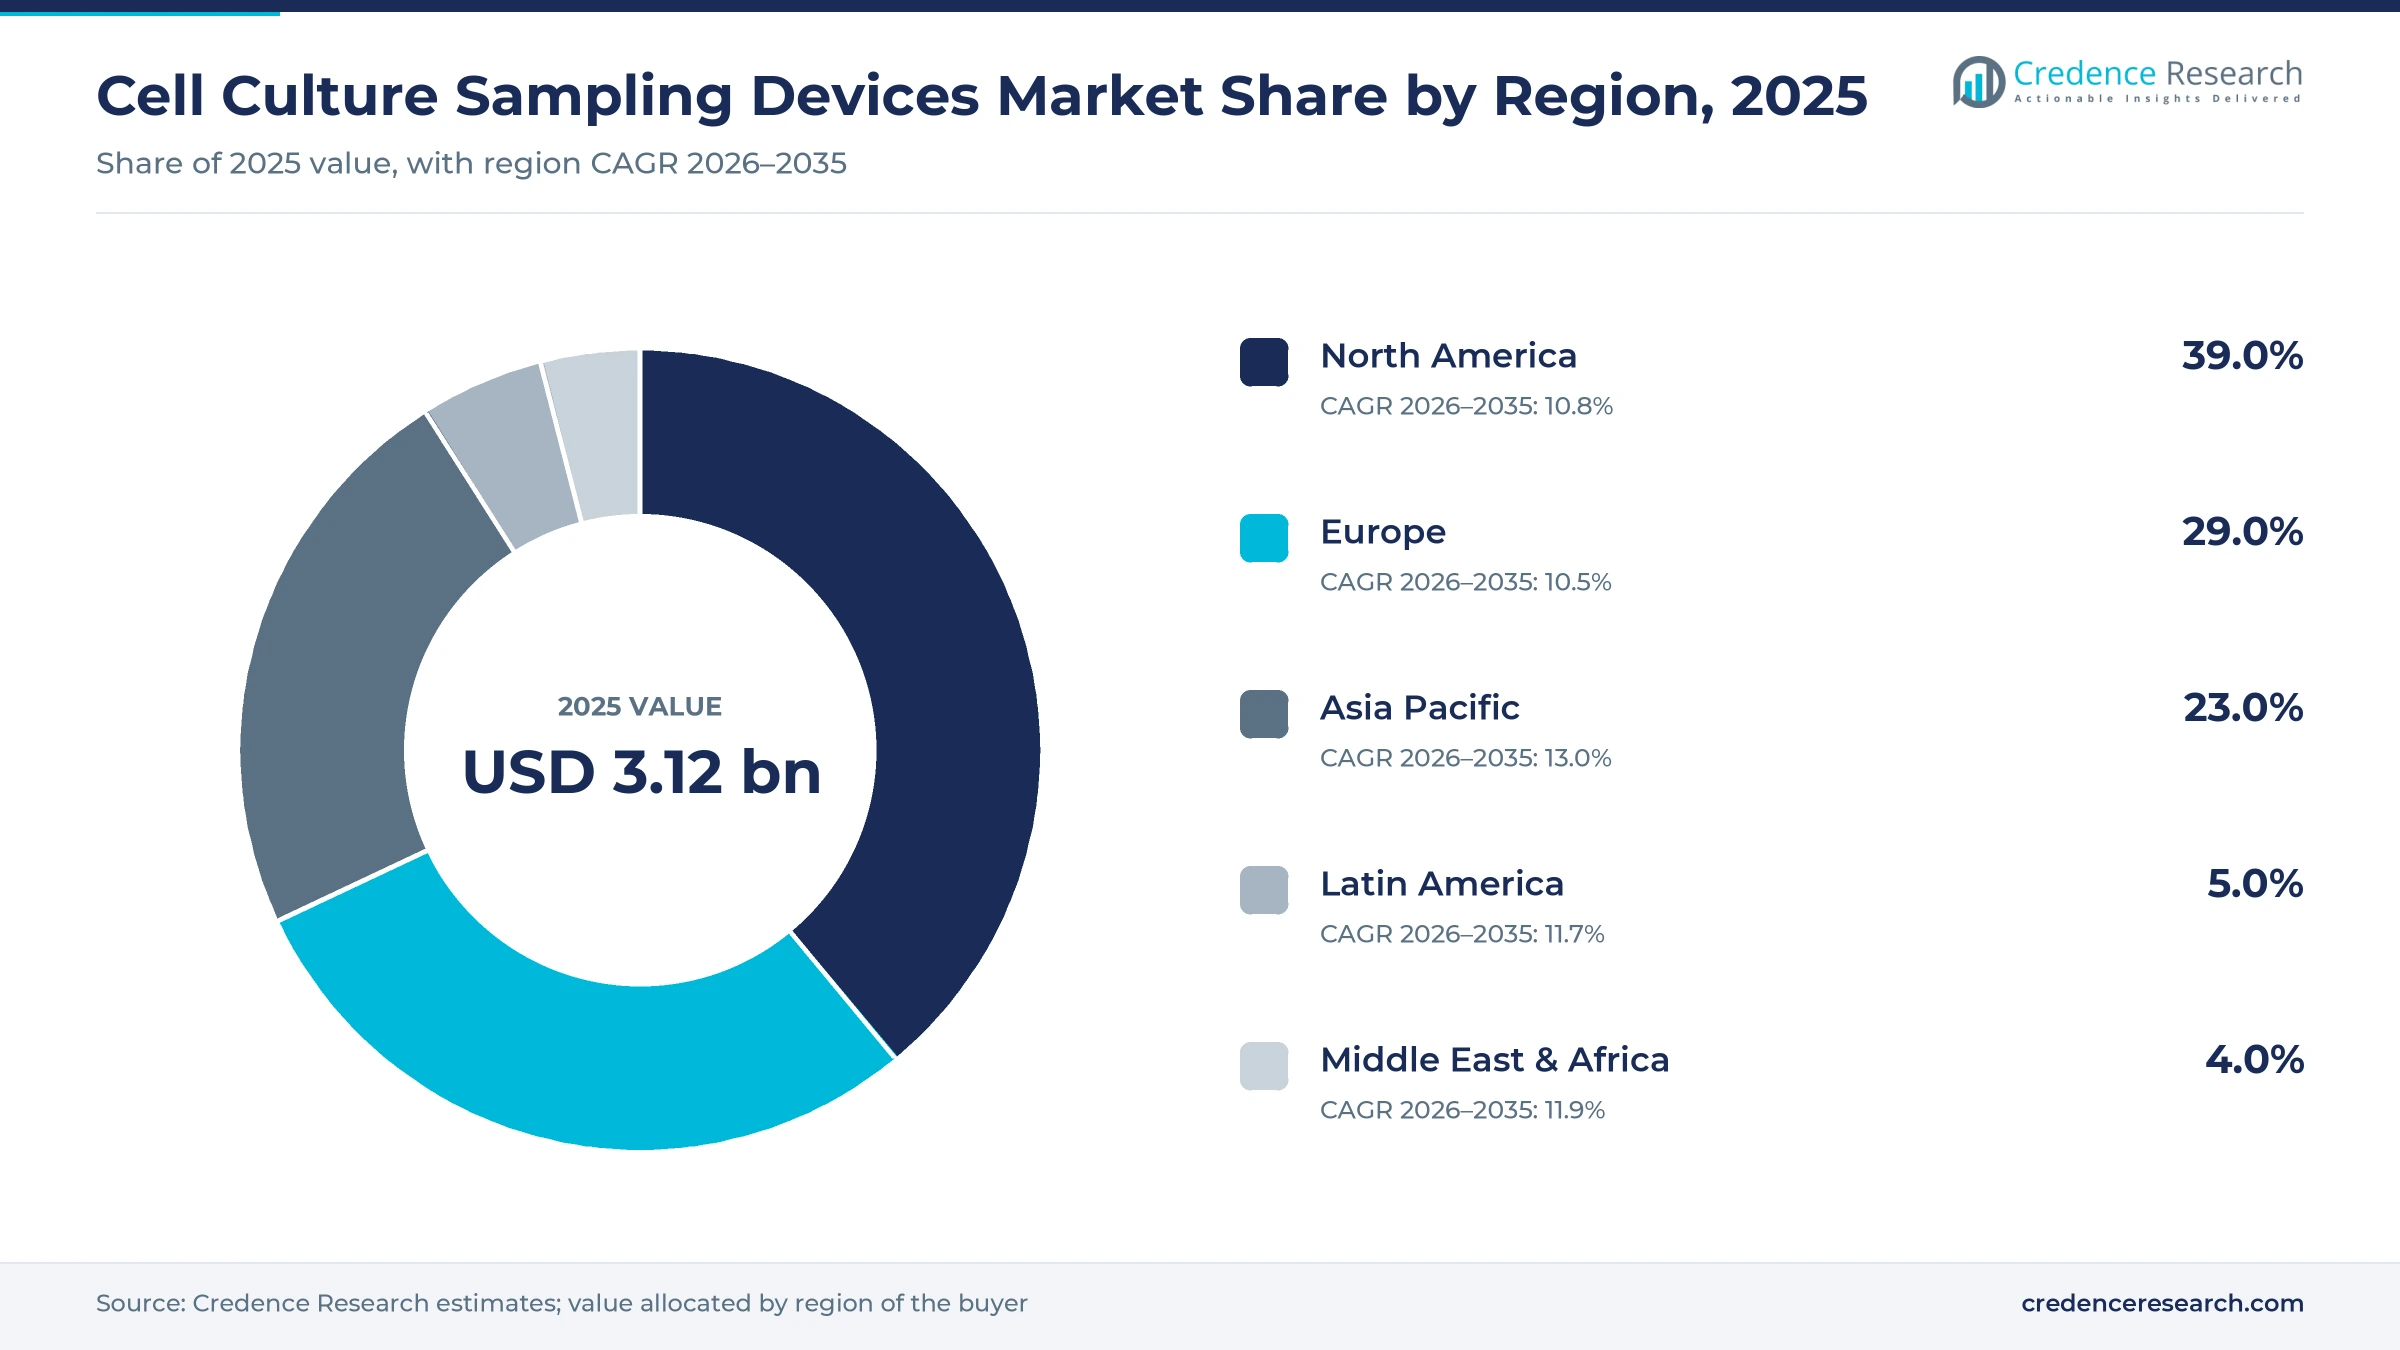
The global cell culture sampling devices market was valued at USD 3.12 billion in 2025 and is projected to increase from USD 3.47 billion in 2026 to USD 9.11 billion by 2035, registering a CAGR of 11.30% during 2026–2035. Demand comes from biologics plants that draw samples from every bioreactor for cell count, viability, metabolite and bioburden tests, from process development groups running dozens of small vessels in parallel, and from cell and gene therapy programs that handle patient-sized volumes in closed systems. North America held the largest regional share, 39.0% in 2025, because licensed biologics, contract plants and cell therapy sponsors concentrate there. Asia Pacific is the fastest-growing region at 13.0% a year, as Korean, Chinese and Indian manufacturers add mammalian capacity. The commercial shift behind demand is the move from open manual draws toward closed single-use assemblies and robotic samplers that feed analyzers directly.
Which tools draw, move and hold culture samples?
The estimate counts manual aseptic sampling systems and pre-assembled single-use sampling assemblies, automated and online samplers that draw from bioreactors and route material to analyzers, pipetting and liquid handling instruments used to take and transfer culture samples, and storage and cryostorage equipment used to retain them. Buyers range from commercial biologics plants placing annual supply contracts for validated assemblies to academic laboratories buying single pipettes through distributors.
Incubators, centrifuges, sterilizers and biosafety cabinets, which the earlier edition of this report grouped with sampling hardware, now sit outside the estimate because they are general culture equipment rather than sampling tools. Analyzers, media and the bioreactors themselves are also excluded, although the value chain links them closely, since a sampling assembly is often specified at the same time as the single-use bag or vessel it connects to.
Cell Culture Sampling Devices Market Insights
- The market is valued at USD 3.12 billion in 2025 and is projected to reach USD 9.11 billion by 2035, growing at an 11.30% CAGR as new biologics capacity adds sampling points.
- North America led with 39.0% of 2025 value, because licensed biologics, contract plants and cell therapy sponsors concentrate there.
- Manual Aseptic Sampling Systems held 38.0% of 2025 value, while automated and online sampling systems grow fastest at 13.8% a year.
- The revised EU GMP Annex 1, in force since Aug. 25, 2023, makes closed, low-intervention sample transfers the expected design in sterile manufacturing.
- Avantor launched needle-free and exact-volume closed sampling systems on Oct. 30, 2025, aimed partly at cell and gene therapy production.
Manual assemblies lead as automated samplers grow fastest
Why do closed manual assemblies still lead device spending?
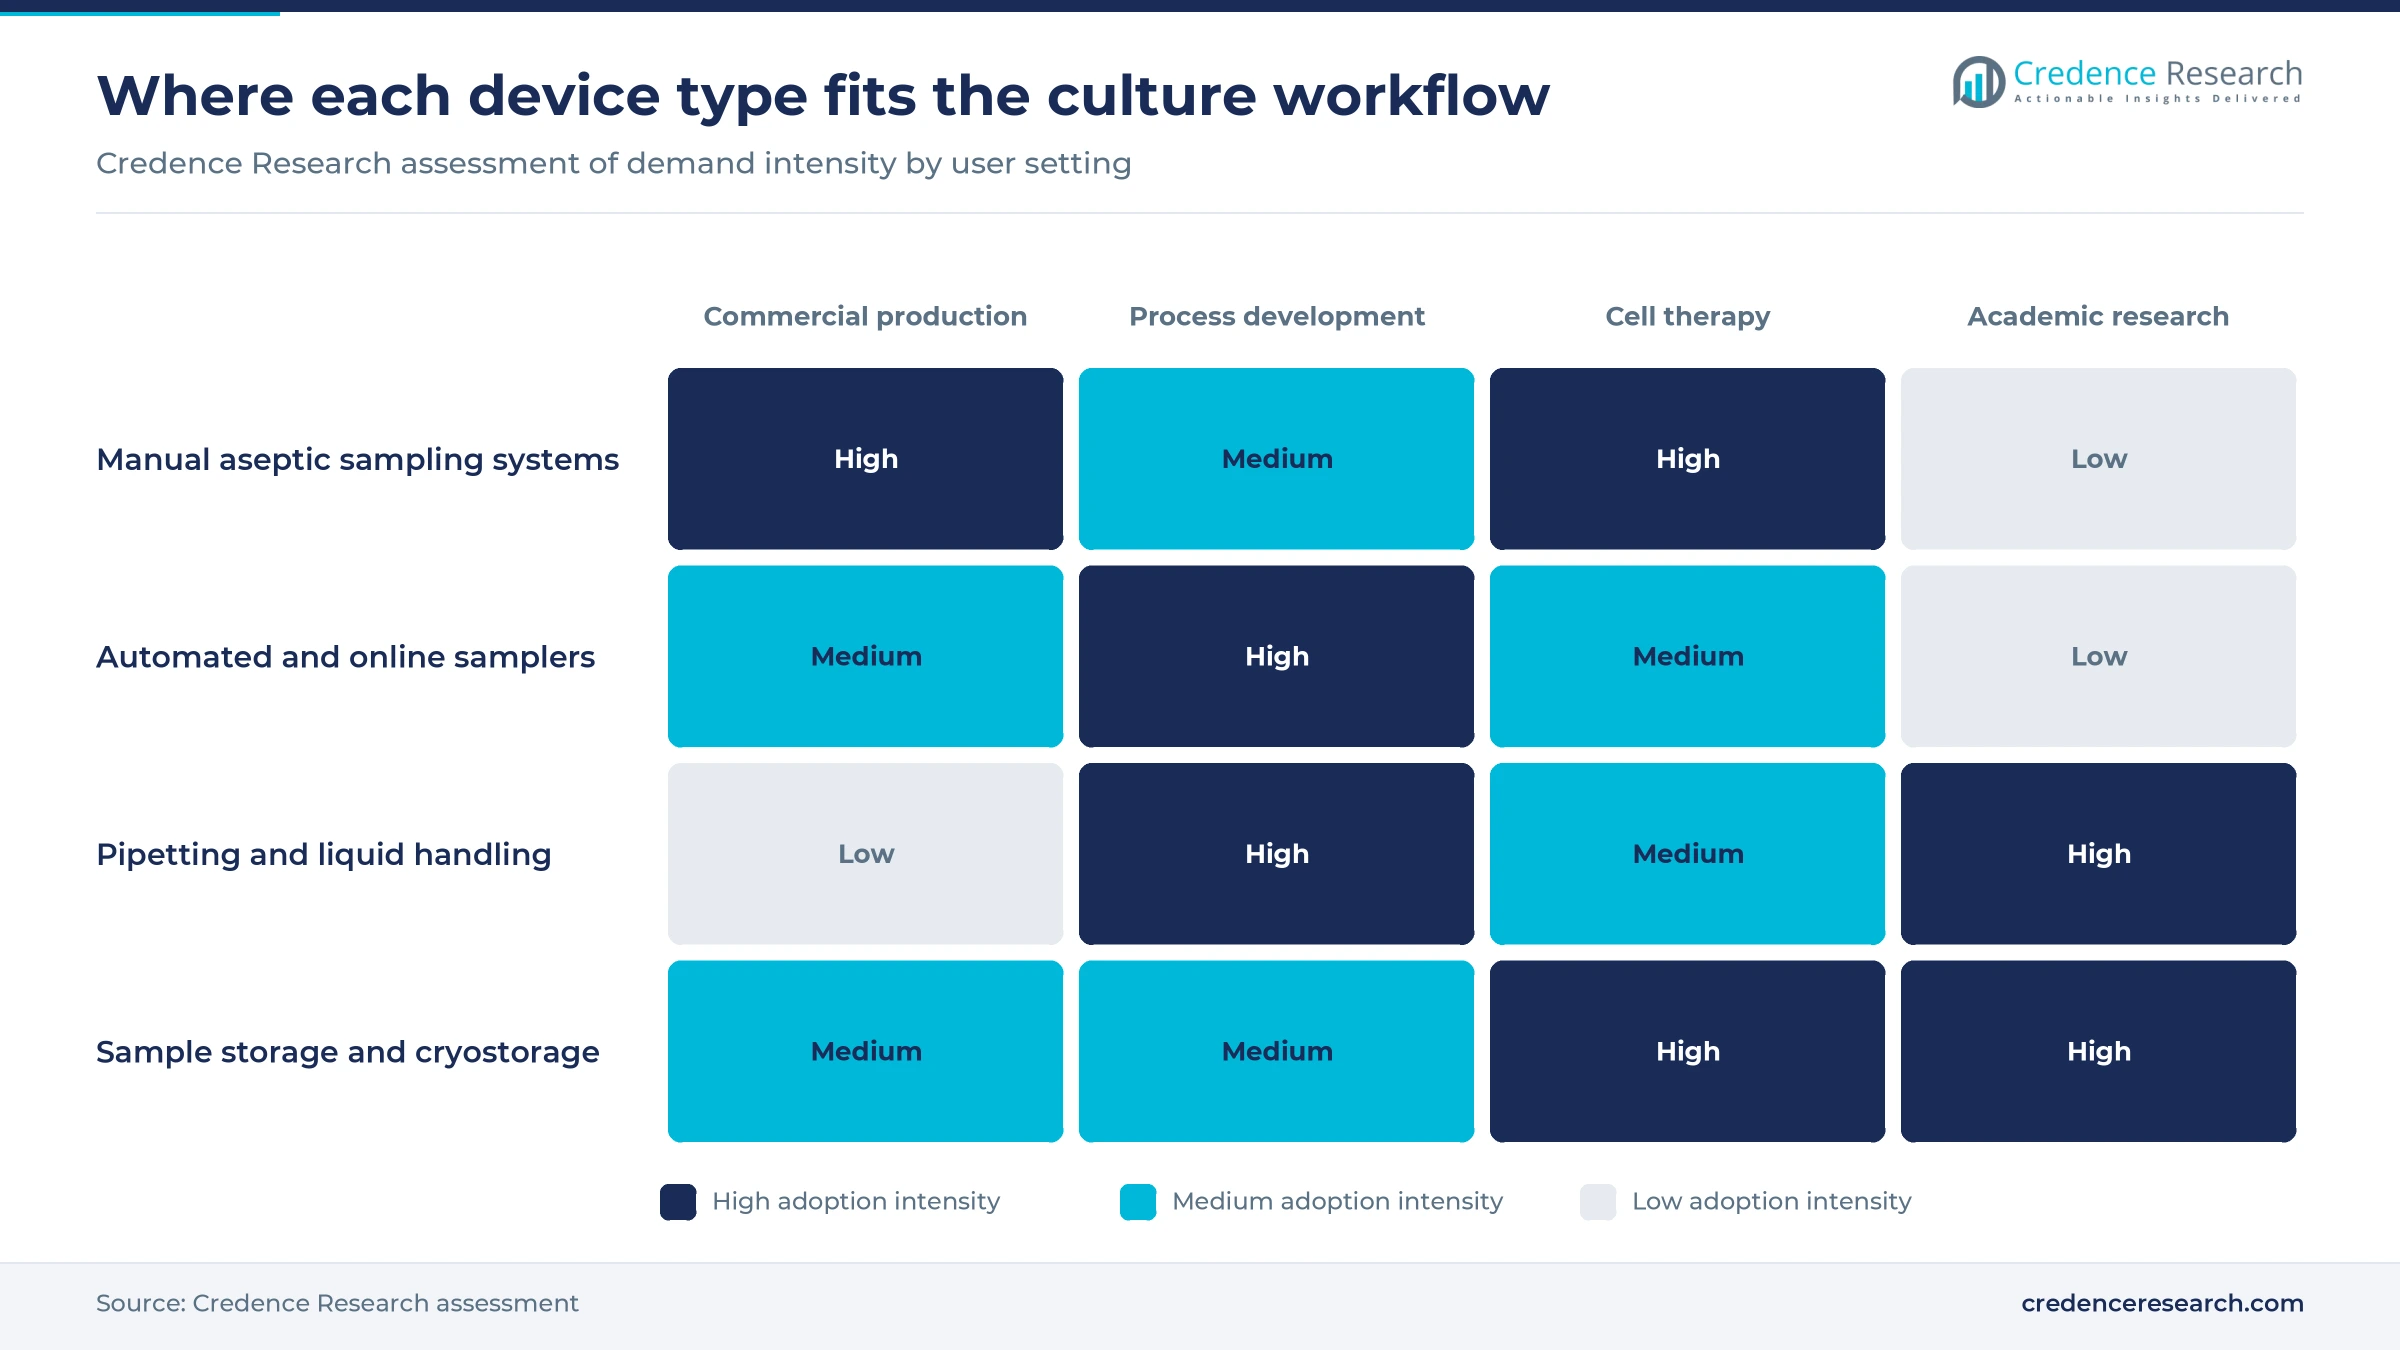
Based on device, the market is categorized into manual aseptic sampling systems, automated and online sampling systems, pipetting and liquid handling instruments, and sample storage and cryostorage equipment. Manual Aseptic Sampling Systems led with 38.0% of 2025 value because every batch needs single-use closed draws, and Merck KGaA keeps most standard NovaSeptum SURe assemblies in stock, in formats from 50 to 1,000 milliliter bags to 5 or 20 milliliter syringes. Automated and online sampling systems grow fastest at 13.8% a year, as Securecell's Axon HT transport adds automatic sampling four times every 24 hours to up to six Ambr 250 systems. Storage demand follows retained samples and cell banks kept in cryogenic vials and freezers.
How does antibody production keep the largest application share?
Based on application, the market is categorized into biopharmaceutical production, drug development, cell and gene therapy, cancer research and other applications. Biopharmaceutical Production led with 41.0% of 2025 value because large antibody plants sample every bioreactor several times a day, and Samsung Biologics' Songdo campus alone reached 784,000 liters of capacity in April 2025. Cell and gene therapy grows fastest at 14.2% a year, as China's National Medical Products Administration approved the country's first hemophilia B gene therapy on April 10, 2025, opening a new commercial setting for closed, small-volume draws. Cancer research demand rests mainly on academic and hospital laboratories, where pipetting and storage outweigh automated samplers.
Why are contract organizations the fastest-growing buyers?
Based on end user, the market is categorized into biopharmaceutical companies, contract development and research organizations, academic and research institutes, and hospitals and clinical laboratories. Biopharmaceutical Companies led with 50.0% of 2025 value because sponsors run both process development and in-house production, and FDA's drug center approved 46 novel drugs in 2025, including 11 antibodies. Contract development and research organizations grow fastest at 13.4% a year, as Fujifilm opened eight 20,000-liter cell culture bioreactors at Holly Springs, North Carolina, in September 2025, with eight more planned in a second phase. Hospital demand stays small and centers on cell therapy processing.
| Segment Group | Leading Sub-segment | Share, 2025 | Fastest-growing Sub-segment | CAGR, 2026–2035 |
|---|---|---|---|---|
| By Device | Manual Aseptic Sampling Systems | 38.0% | Automated and Online Sampling Systems | 13.8% |
| By Application | Biopharmaceutical Production | 41.0% | Cell and Gene Therapy | 14.2% |
| By End User | Biopharmaceutical Companies | 50.0% | Contract Development and Research Organizations | 13.4% |
Single-use assemblies carry a recurring cost per batch
Pricing splits between capital equipment bought once and consumables bought with every batch. A closed sampling assembly is single-use, so its cost recurs with each draw, and validated configurations with bags, syringes or manifold lines cost far more than open containers. Automated samplers are priced per project, with analyzer links and software integration set during quotation, so published list prices are rare. Benchtop pipettes follow catalog pricing, with frequent distributor promotions on top of list prices. Recurring assembly spending, rather than instrument sales, is where suppliers hold most margin, and buyers locked into a validated design have little room to negotiate once a process is filed.
| Offer or segment | Typical price or fee | Basis |
|---|---|---|
| NovaSeptum SURe high-purity bag assembly, Merck KGaA | USD 3,127 per catalog unit | Fisher Scientific listing, November 2026 |
| Eppendorf Research plus single-channel pipette, 0.25 to 2.5 mL | USD 924.50 list, USD 459.12 web promotion | Fisher Scientific listing, November 2026 |
| Standard manual sterile sampling assembly | USD 200 to 1,500 per assembly | Credence Research estimate from catalog configurations |
| Automated multi-bioreactor sampling system | USD 60,000 to 150,000 per installation | Credence Research estimate from system scope and analyzer links |
Request a Free Sample
Fill in your details and we'll send you a free sample report.
- Sample data tables & charts
- Research methodology
New capacity, Annex 1 and cell therapy lift sample volumes
Mammalian capacity additions multiply sampling points
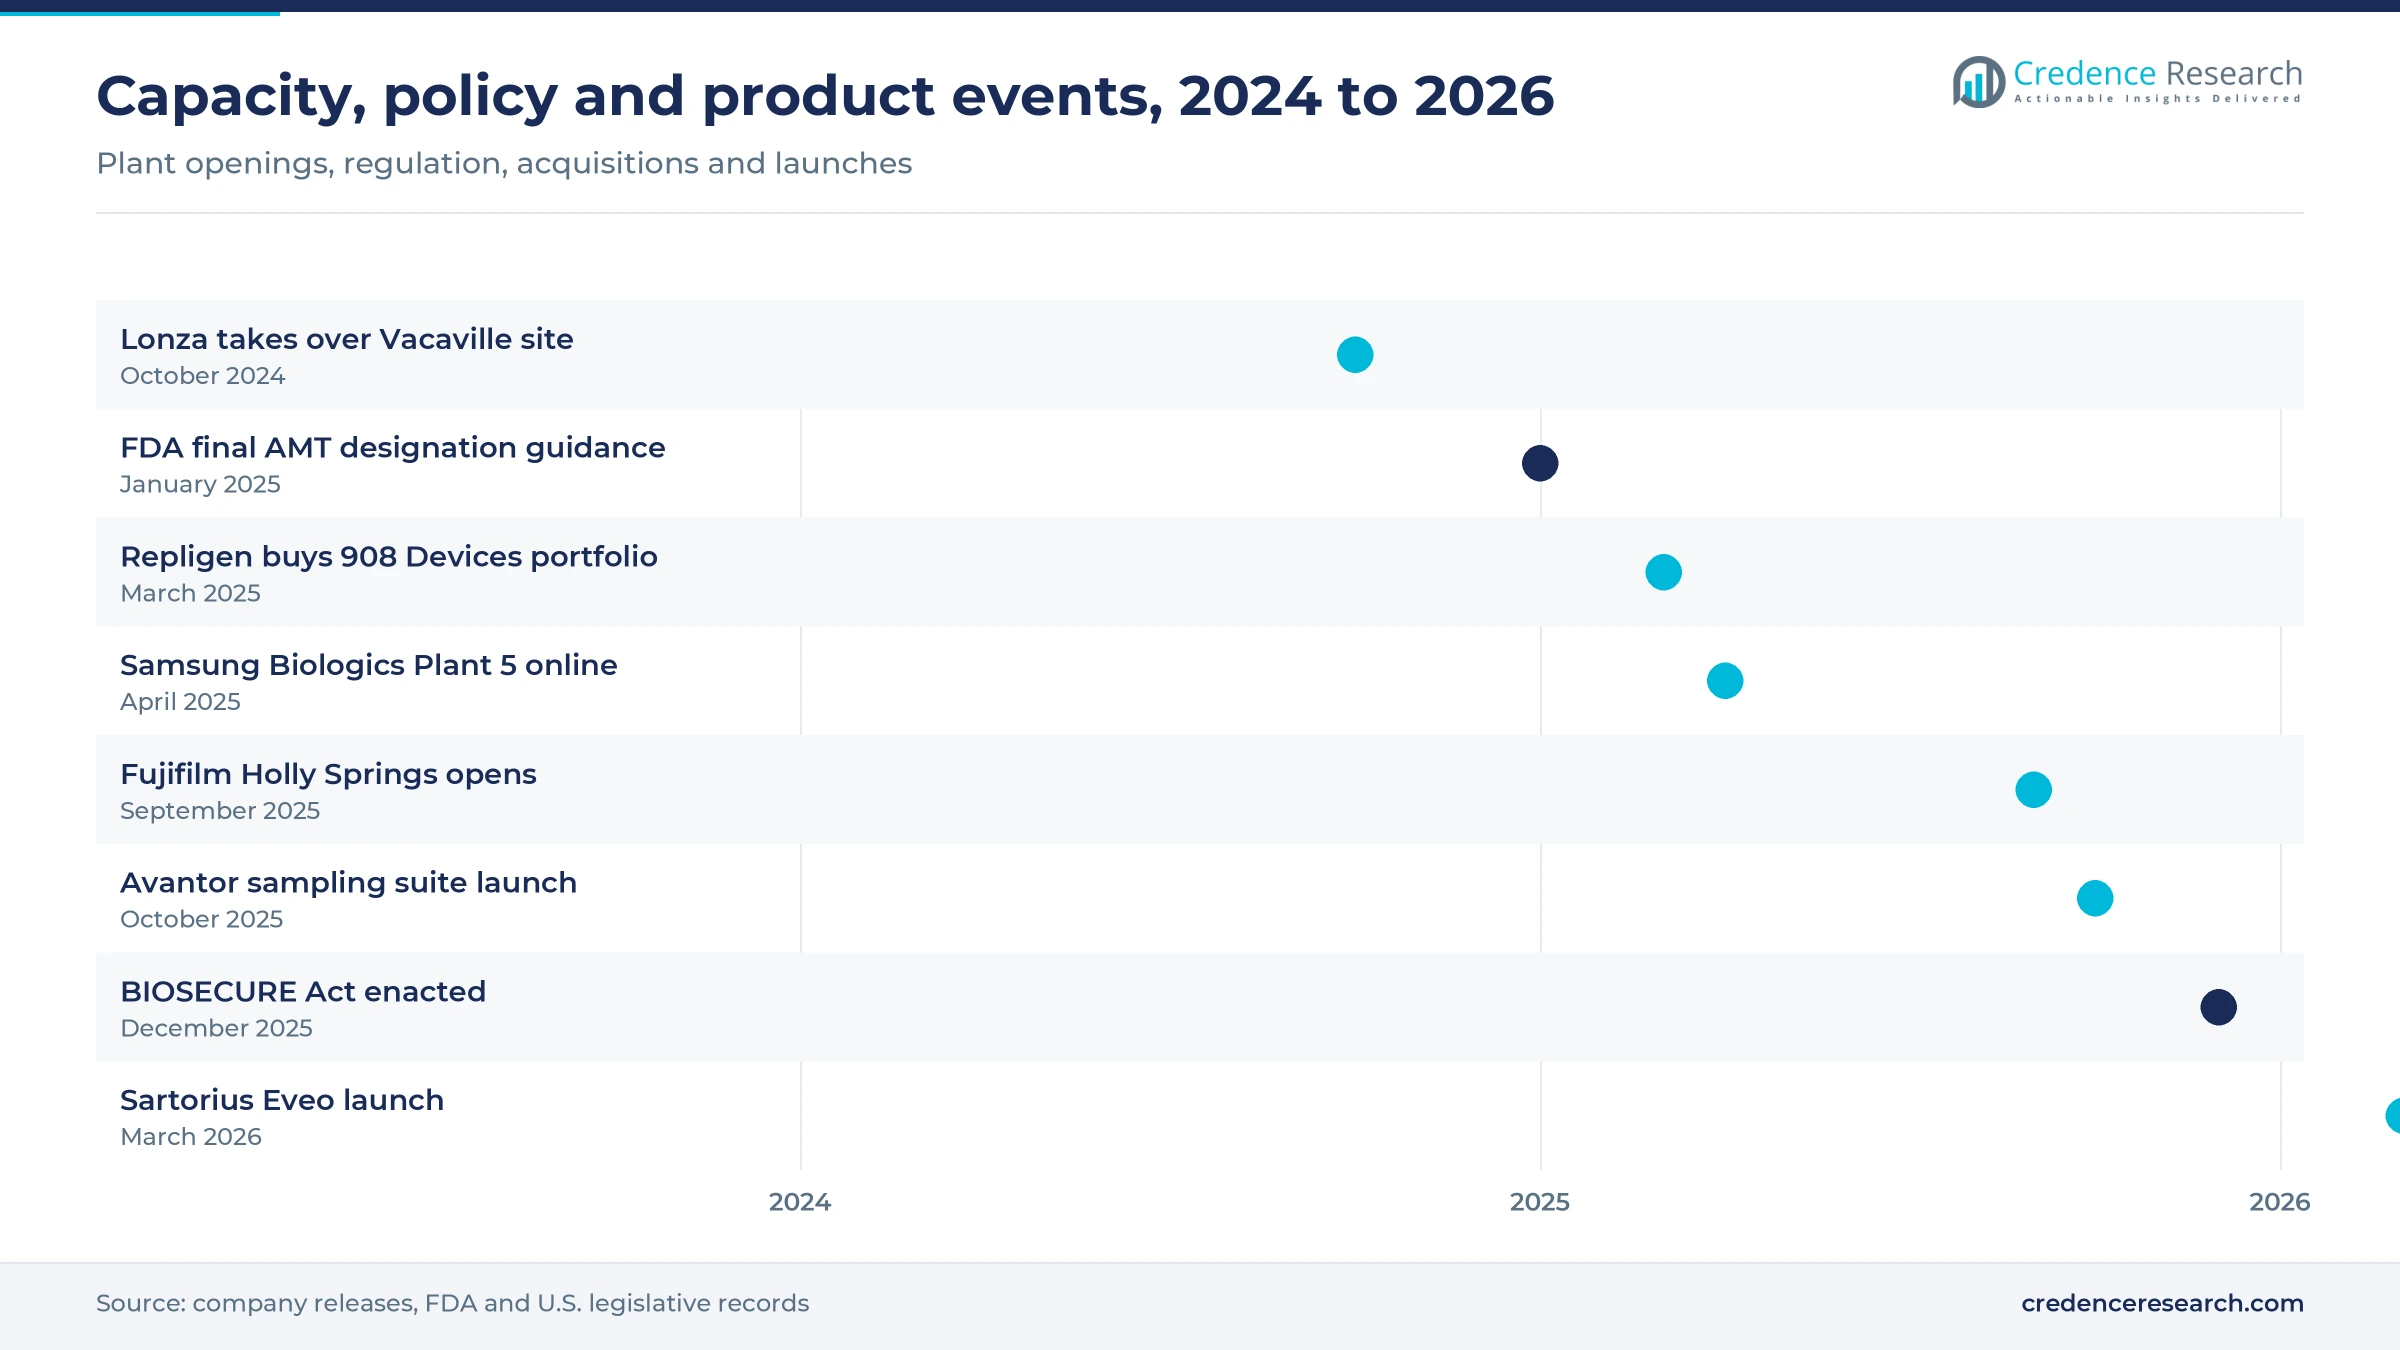
Every new production bioreactor adds sampling ports that are used several times a day for cell density, viability, metabolite and bioburden checks, so capacity build-outs translate directly into recurring demand for assemblies and samplers. Samsung Biologics brought its fifth Songdo plant online in April 2025, adding 180,000 liters and lifting its total antibody manufacturing capacity to 784,000 liters, according to Pharma Manufacturing. Lonza completed the purchase of the Genentech site in Vacaville, California, from Roche in October 2024 for USD 1.2 billion, taking over about 330,000 liters of bioreactor capacity. Biopharmaceutical production already accounts for 41.0% of 2025 demand, so suppliers with qualified assemblies for large stainless and single-use trains gain most as these plants ramp.
Annex 1 rewards closed, low-touch sample transfers
The revised EU GMP Annex 1, in force since Aug. 25, 2023, turns every open sample draw into a contamination risk that a manufacturer must justify in its contamination control strategy. The harmonized text, as published by Health Canada, states that aseptic connections should be performed in grade A with a grade B background unless subsequently sterilized in place, and that single-use systems should be designed to reduce manipulations. It also requires bioburden samples from the bulk product immediately before final sterile filtration, which fixes a sampling step in every batch. Merck KGaA's NovaSeptum SURe assemblies connect through AseptiQuik or MicroCNX connectors or by welding C-Flex or PVC tubing, the closed formats this rule favors over open ports.
Cell and gene therapy approvals need small-volume closed draws
Cell and gene therapies change what a sample is, because a batch may be one patient's dose and every milliliter withdrawn for testing reduces the product left to infuse. The FDA list of 2025 biologics license approvals includes five cell or gene therapies, among them Encelto on March 5, 2025 and the gene-corrected cell sheet therapy Zevaskyn on April 28, 2025. Some 80 gene therapy trials started in the second quarter of 2025, 64% of them in oncology, according to the American Society of Gene and Cell Therapy's Q2 2025 report. Merck KGaA sells an autologous cell therapy version of its NovaSeptum SURe assemblies with DEHP-free tubing and an integrated air vent to limit cells left behind. Vendors with exact-volume, low hold-up designs are best placed for this demand.
Steady novel biologic approvals keep development labs busy
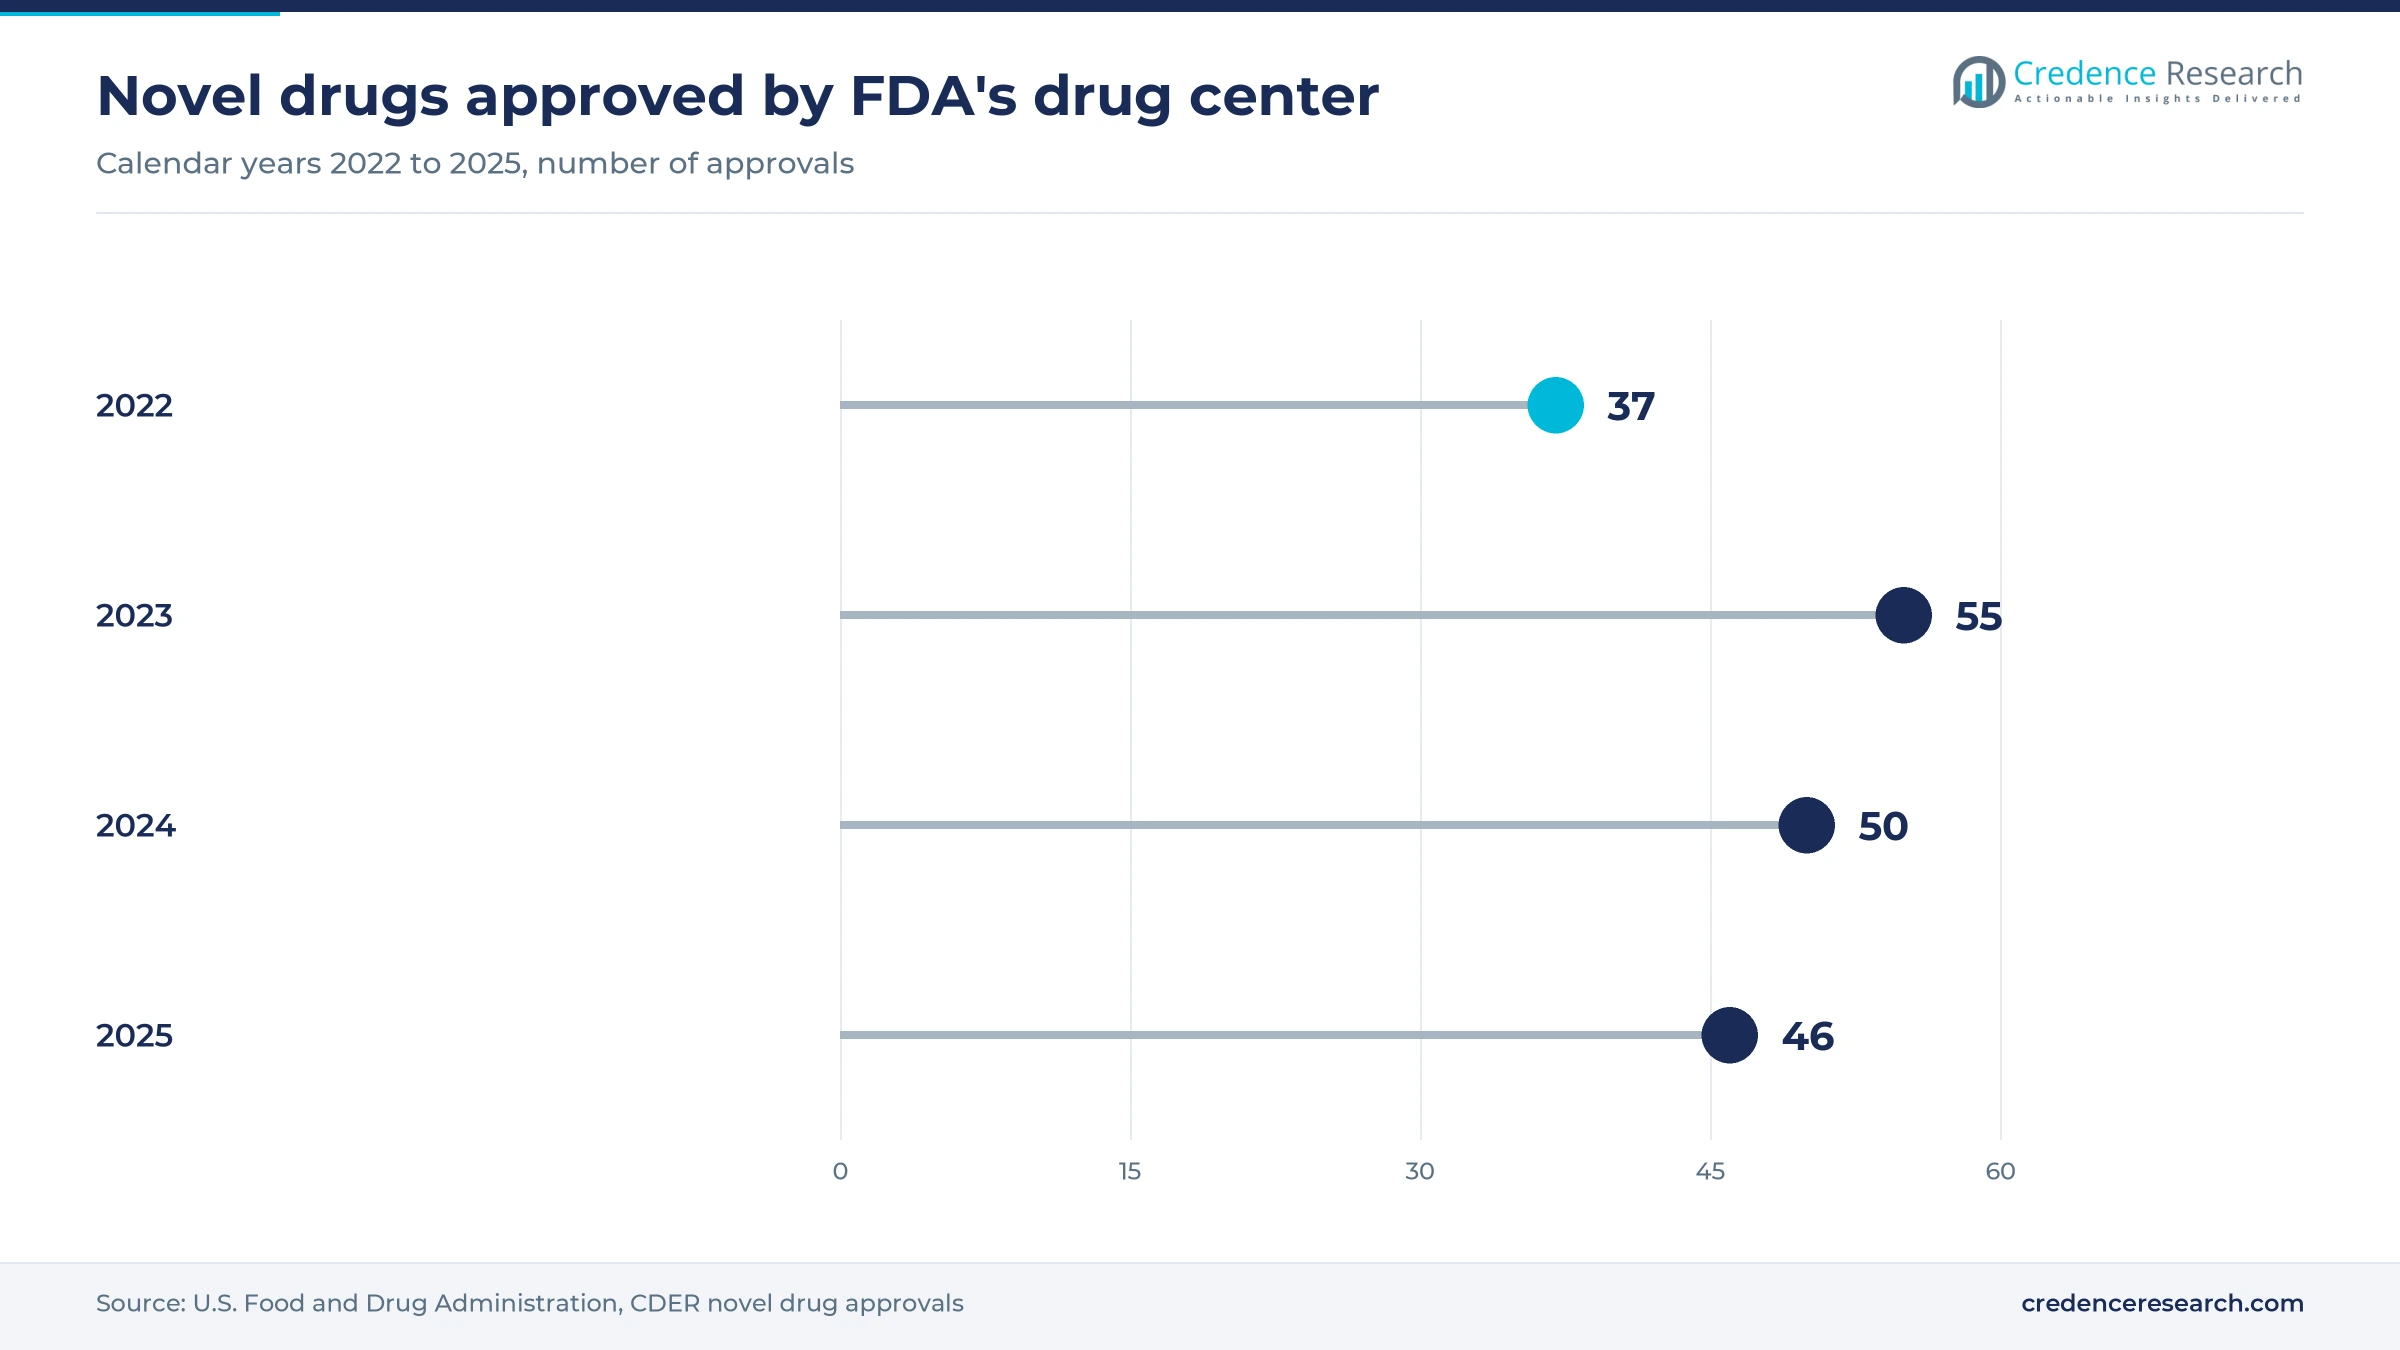
Each antibody or protein approval represents years of process development in which scale-down bioreactors are sampled far more often than commercial vessels, so approval flow is a lagging signal of sampling intensity. FDA's drug center approved 46 novel drugs in 2025, and 11 of them carried the antibody naming stem, after 55 novel approvals in 2023 and 50 in 2024. Thermo Fisher Scientific introduced a 5-liter DynaDrive model of its single-use bioreactors on April 14, 2025 to speed process development and scale-up work. Pipetting and benchtop sample handling follow the same development workload, so instrument suppliers that sell into both process development and quality control laboratories capture this demand twice.
Robotic sampling, linked data and cell therapy openings
Process groups shift to robotic multi-reactor sampling
Process development teams are shifting from hand-drawn samples toward robots that sample dozens of small bioreactors on a fixed schedule, because parallel experiments only pay off when every vessel is measured the same way. Securecell's Integra1 64 platform runs up to 64 bioreactors at 200 milliliter scale, with a robotic arm drawing samples through a cleanable needle. Merck KGaA's MAST system, bought from Lonza in April 2022, collects samples from up to 10 bioreactors and routes them to four analyzers. FDA finalized its Advanced Manufacturing Technologies designation program guidance on Jan. 2, 2025, offering sponsors early agency interaction on new manufacturing methods. Automated and online sampling systems are the fastest-growing device type at 13.8% a year, which favors vendors that combine samplers, analyzers and control software.
Sampling and analytics are merging into one data workflow
Suppliers are shifting from selling samplers and analyzers separately toward connected workflows in which the sample, the measurement and the process record move together, addressing data-integrity expectations in regulated plants. Repligen bought the desktop bioprocessing portfolio of 908 Devices, including the REBEL at-line media analyzer, for USD 70 million in cash on March 4, 2025, adding bioprocess analyzers to its portfolio. Cytiva became exclusive global distributor of Culture Biosciences' cloud-connected Stratyx bioreactor platform on Aug. 6, 2025. On Oct. 14, 2026, Securecell and Beckman Coulter Life Sciences said they would link the Vi-CELL BLU viability analyzer to the Numera 3 autosampler, with interfaces expected in about nine months. Vendors without analyzer and software partners risk being designed out of new lines.
Exact-volume closed draws are an opening in cell therapy
Autologous therapy developers are an underserved buyer group, because most sampling assemblies were designed for liter-scale antibody batches rather than milliliter-scale patient doses. Avantor launched an Exact Volume Sampling System for cell and gene therapy work on Oct. 30, 2025, alongside a needle-free sampling system and pre-engineered filter integrity test assemblies. Sartorius said on March 16, 2026 that it had launched its Eveo cell therapy platform, letting one operator run eight patient batches at once in space that previously handled two, with order-taking planned from September 2026. Cell and gene therapy is the fastest-growing application at 14.2% a year, and developers of CAR-T therapies need samplers sized for these parallel closed lines. Suppliers that validate low hold-up volumes gain the clearest advantage here.
BIOSECURE and India's BioE3 create an opening for regional supply
Supply-chain policy is creating an opportunity for suppliers that can document their sourcing, especially among United States federal contractors and Indian biomanufacturers. The BIOSECURE Act, enacted through Section 851 of the FY2026 National Defense Authorization Act in December 2025, bars executive agencies from buying biotechnology equipment or services from companies of concern. The Office of Management and Budget must name the covered companies within 12 months, and the purchase bans apply once federal acquisition rules are updated. India's Union Cabinet approved the BioE3 policy on Aug. 24, 2024, setting up biomanufacturing hubs, Bio-AI hubs and a biofoundry across six thematic sectors that include precision biotherapeutics. Qualified suppliers with Indian service networks are best placed here.
Funding, qualification costs and inline sensors limit growth
Academic budgets became less predictable after the NIH cap
Academic laboratories buy pipettes, small samplers and storage from grant overhead and equipment lines, so federal funding uncertainty delays their purchases first. The National Institutes of Health announced a 15% across-the-board cap on indirect cost reimbursement in early February 2025, and the 1st U.S. Circuit Court of Appeals upheld the block on that policy on Jan. 5, 2026, according to Higher Ed Dive. The cap never took effect, but almost a year of litigation left institutions planning equipment budgets without a settled overhead rate. Benchtop instrument makers with heavy university exposure feel this most.
Supplier qualification raises the cost of switching assemblies
Once a sampling assembly is written into a validated process, changing it requires new qualification data, which slows the entry of lower-cost suppliers and locks buyers into incumbents. The Annex 1 text requires sterility assurance of sterile single-use systems to be verified as part of supplier qualification, with each unit checked on receipt and its sterilization proof reviewed before use. Aseptic connections must also be assessed and their effectiveness verified. Smaller assembly makers without documented sterilization validation face the longest sales cycles, while buyers carry the cost of dual sourcing.
Deep catalog discounts squeeze benchtop instrument margins
Benchtop pipetting is a mature, distributor-led category and catalog promotions show how hard suppliers compete for laboratory replacement cycles. Fisher Scientific lists an Eppendorf Research plus single-channel pipette of 0.25 to 2.5 milliliters at USD 924.50, with a web promotion of USD 459.12, or about half the list price. Such discounting compresses margins for mid-tier brands of pipettes and pipettors that lack automation or service contracts. Makers that rely on single-unit laboratory sales are the most exposed when budgets tighten.
Inline sensors remove some routine sample draws
Inline probes measure some culture variables without removing any material, which reduces the number of draws needed for routine checks and caps volume growth for consumable assemblies. ABER Instruments and Sartorius Stedim Biotech said on Nov. 13, 2025 that they had launched BioPAT Viamass, a single-use capacitance sensor for viable biomass that is integrated into Ambr high-throughput bioreactor vessels. Viable cell density is one of the most frequent reasons for a manual draw, so this substitution reaches manual assembly suppliers first. Sterility, titer and product quality tests still need physical samples, which limits how far it goes.
North America leads as Asia Pacific adds capacity fastest
| Region | Value, 2025 (USD billion) | Share, 2025 | CAGR, 2026–2035 |
|---|---|---|---|
| North America | 1.22 | 39.0% | 10.8% |
| Europe | 0.91 | 29.0% | 10.5% |
| Asia Pacific | 0.72 | 23.0% | 13.0% |
| Latin America | 0.16 | 5.0% | 11.7% |
| Middle East & Africa | 0.12 | 4.0% | 11.9% |
North America leads on licensed biologics and contract capacity
North America held 39.0% of 2025 value and grows at 10.8% a year, because it combines the largest base of licensed biologics with an expanding contract manufacturing footprint. The Holly Springs and Vacaville sites described above together account for about 490,000 liters of United States mammalian capacity, counting only the first Holly Springs phase. The five cell or gene therapy approvals of 2025 add closed, small-volume sampling needs at clinical and commercial sites. The BIOSECURE Act steers federal contractors toward documented suppliers, while academic demand remains the weaker part of the region given the overhead dispute.
Europe's early Annex 1 compliance shapes assembly demand
Europe held 29.0% of 2025 value and grows at 10.5% a year, with demand shaped more by regulation than by new capacity. The revised Annex 1 has applied to sterile manufacturing in the European Union since Aug. 25, 2023, so European plants were the first to rework sampling steps around closed connections. The region also hosts the main assembly and sampler makers, with Sartorius and Merck KGaA based in Germany and Securecell in Switzerland, which shortens qualification and service cycles for local plants. Slower growth reflects a mature installed base where replacement rather than new lines drives most orders.
Asia Pacific grows fastest on Korean, Chinese and Indian capacity
Asia Pacific held 23.0% of 2025 value and is the fastest-growing region at 13.0% a year, because the largest single blocks of new mammalian capacity are being built there. Samsung Biologics' fifth Songdo plant, noted above, is the largest single capacity addition among the plants reviewed for this report. China's first approved hemophilia B gene therapy opens a domestic commercial supply chain for closed draws, and India's BioE3 hubs add new biomanufacturing sites. Export-oriented plants that file with the FDA and European regulators tend to specify the same qualified assemblies used in the West, which favors established suppliers.
Latin America buys mainly for vaccines, biosimilars and research
Latin America held 5.0% of 2025 value and grows at 11.7% a year, from a base concentrated in Brazil, Mexico and Argentina. Public data on installed bioreactor capacity in the region are thin, so this share is a Credence Research estimate built from the location of biologics producers and research institutes rather than from a reported statistic. Demand centers on vaccine, biosimilar and academic laboratories, where pipetting and storage equipment outweigh automated samplers. Most hardware arrives through distributors, which adds lead time and favors suppliers holding local stock.
Middle East and Africa start from research laboratories
The Middle East and Africa held 4.0% of 2025 value and grow at 11.9% a year, from the smallest base of the five regions. Demand comes mainly from university and hospital research laboratories and a small number of vaccine and biologics projects in the Gulf states and South Africa. No public statistic tracks spending on this equipment in the region, so the share is a Credence Research estimate and carries the widest uncertainty of any region. Buyers rely on distributors for validation documents and service, which favors full-line suppliers.
Launches, acquisitions and partnerships, 2025 to 2026
| Development | Status and market relevance |
|---|---|
| In March 2025, Repligen bought the desktop bioprocessing portfolio of 908 Devices, including the REBEL at-line media analyzer, for USD 70 million in cash. | Completed acquisition announced March 4, 2025; it moves at-line analysis closer to the bioreactor sampling point. |
| In October 2025, Avantor launched needle-free and exact-volume sterile sampling systems and pre-engineered PUPSIT filter integrity assemblies. | Commercial launch announced Oct. 30, 2025; it widens closed sampling options for cell and gene therapy and filtration trains. |
| In November 2025, ABER Instruments and Sartorius Stedim Biotech launched the BioPAT Viamass single-use biomass sensor. | Product launch with integration into Ambr 250 high-throughput vessels; inline measurement can replace some viable cell density draws. |
| In March 2026, Sartorius launched the Eveo cell therapy platform for closed, automated, multi-parallel autologous production. | Launch announced March 16, 2026, with order-taking planned from September 2026 and first deliveries expected in 2027. |
| In October 2026, Securecell and Beckman Coulter Life Sciences agreed to integrate the Vi-CELL BLU analyzer with the Numera 3 autosampler. | Development partnership announced Oct. 14, 2026, with hardware and software interfaces expected in about nine months. |
Closed needle, weld and automated designs set the standard
- Needle-based closed sampling draws from stainless-steel vessels through a septum interface, keeping the path closed without a weld or connector change.
- Needle-free closed sampling removes sharps from the operator area and suits single-use bags where needle handling is a safety concern.
- Weldable and connector-based assemblies join sampling bags, bottles or syringes to single-use lines by tube welding or intrinsic sterile connectors.
- Automated samplers with analyzer links draw on schedule from several vessels and route material to cell counters, metabolite analyzers or chromatography.
- Inline capacitance probes measure viable biomass inside the vessel and reduce the number of routine draws needed for cell density.
Need a Custom Version of This Report?
Tailor the scope, geography, or segments to your exact requirements.
- Custom geography or segment scope
- Direct access to our analyst team
Full-line bioprocess suppliers compete with specialists
Competition among suppliers of cell culture sampling devices is decided less by the hardware itself than by how well it fits a buyer's validated process. Sartorius and Merck KGaA compete as integrated platform suppliers, pairing sampling assemblies and automated sampling with their own bioreactors, connectors and analytics, and Merck adds regulatory documentation through its Emprove program. Thermo Fisher Scientific and Danaher, through Cytiva and Pall, compete on breadth, selling bioreactors, single-use bags and fluid transfer assemblies to the same plants. Avantor competes on closed manual sampling formats and distribution reach, extended by its October 2025 launches. Securecell competes as an automation specialist, winning process development groups that need many small vessels sampled on schedule. Eppendorf and Corning compete in benchtop pipetting and sample storage, where catalog pricing, distributor coverage and familiarity in research laboratories matter most.
Who controls validated assemblies and automated samplers?
The supply side of the market has two layers with different economics. A small group of full-line bioprocess suppliers, including Sartorius, Merck KGaA, Thermo Fisher Scientific and Danaher through Cytiva and Pall, sells validated single-use sampling assemblies alongside the bioreactors, bags and connectors they plug into, so a sampling choice is often made together with the bioreactor platform. Specialists such as Securecell compete in automated sampling, while Avantor sells closed sampling systems through its own distribution channel. Benchtop pipetting and storage are more fragmented and distributor-led, with Eppendorf and Corning among the main brands. Entry barriers are highest where sterilization validation and regulatory documentation are required, and margins sit with recurring single-use consumables.
Companies profiled and their roles in this market
| Company | Type | Role in the market |
|---|---|---|
| Sartorius AG | Full-line supplier | Sells sampling assemblies, bioreactors, inline sensors and cell therapy platforms |
| Merck KGaA (MilliporeSigma) | Full-line supplier | Sells NovaSeptum SURe closed sampling assemblies and the MAST autosampling system |
| Thermo Fisher Scientific Inc. | Full-line supplier | Supplies single-use bioreactors, sample handling consumables and laboratory pipettes |
| Danaher Corporation (Cytiva and Pall) | Full-line supplier | Sells single-use bioprocess assemblies and bioreactors through Cytiva and Pall |
| Avantor, Inc. | Sampling specialist and distributor | Sells needle-based, needle-free and exact-volume closed sampling systems |
| Securecell AG | Automation specialist | Makes Numera autosamplers and robotic multi-bioreactor sampling platforms |
| Eppendorf SE | Laboratory instrument maker | Makes pipettes, sample tubes and freezers used in culture laboratories |
| Corning Incorporated | Laboratory consumables maker | Supplies serological pipettes, cryogenic vials and sample storage products |
Recurring consumables, not instruments, carry the value
Credence Research's view is that value in the cell culture sampling devices market is shifting from instruments bought once toward single-use assemblies bought with every batch and every patient dose. Capacity added in Korea and the United States should raise the number of active sampling ports, while Annex 1 makes closed designs the default for new lines. The real contest is automation, where robotic samplers and linked analyzers decide which supplier's consumables are designed into a process. Inline sensors will remove some routine draws but cannot replace sterility and product quality samples. Suppliers that own the bioreactor platform hold the strongest position.
Earlier value updated and checked against capacity data
The report uses 2025 as the base year and forecasts to 2035. The earlier published value for the cell culture sampling devices market was rolled forward at its own growth rate and then checked bottom up against disclosed bioreactor capacity, catalog prices for sampling assemblies and pipettes, and the regulatory approvals that drive process development work. The resulting 2025 value of USD 3.12 billion covers sampling assemblies, automated samplers, pipetting instruments and sample storage equipment. Regional and segment shares are Credence Research estimates built from the location of biologics capacity, approvals and research spending, and they are stated as estimates because no official statistic separates this equipment. Sources used are regulator documents, company releases, trade association data and supplier catalogs. No interviews or surveys were conducted for this edition of the report.
Capacity ramp-up and closed processing set the pace to 2035
Through 2035 sampling device demand should grow with the number of active production and development bioreactors rather than with laboratory headcount. Plants opened in 2024 and 2025 move from qualification into routine production over the next few years, which converts capacity into recurring assembly orders. Cell therapy lines will add many small, closed draws and automated samplers will spread from development laboratories into manufacturing as regulators accept continuous data. Inline sensing and tighter laboratory budgets will hold back the manual and benchtop segments. Suppliers able to document sterility assurance and connect samplers to analytics should gain share over the forecast period.
What would move growth above or below the base case?
The range of outcomes depends on how fast new capacity fills and on how many sample draws inline sensors replace. If the Korean, United States and Indian plants described above reach full utilization and cell therapy lines scale out in parallel, consumable sampling demand runs above the base case. If biologics capacity sits underused or inline sensing replaces routine viability draws faster than expected, growth slows toward the pace of laboratory instrument replacement. Regulatory pressure for closed processing supports demand in all three cases.
| Scenario | CAGR, 2026–2035 | Value, 2035 | What has to hold |
|---|---|---|---|
| Downside | 9.3% | USD 7.74 billion | New biologics capacity stays underused and inline sensors replace routine viable cell draws |
| Base | 11.30% | USD 9.11 billion | Capacity ramps on announced schedules and closed sampling becomes standard in new lines |
| Upside | 12.8% | USD 10.27 billion | Cell therapy scale-out and automated multi-reactor sampling spread faster than planned |
Frequently Asked Questions
How big is the cell culture sampling devices market?
What does the cell culture sampling device market include?
Which device type holds the largest share?
Which device type is growing fastest?
Which region leads the market?
How does EU GMP Annex 1 affect sampling?
Which companies lead the market?
What do sampling products cost?
Table of Content
Chapter 1 Market Segmentation
- 1.1 Segmentation Framework
- 1.1.1 Product and Service Classification
- 1.1.2 Application and End-Use Classification
- 1.1.3 Technology and Solution Classification
- 1.1.4 Customer and Distribution Channel Classification
- 1.1.5 Geographic Segmentation
- 1.1.6 Market Segment Definitions and Boundaries
- 1.2 By Device
- 1.2.1 Manual Aseptic Sampling Systems
- 1.2.2 Automated and Online Sampling Systems
- 1.2.3 Pipetting and Liquid Handling Instruments
- 1.2.4 Sample Storage and Cryostorage Equipment
- 1.3 By Application
- 1.3.1 Biopharmaceutical Production
- 1.3.2 Drug Development
- 1.3.3 Cell and Gene Therapy
- 1.3.4 Cancer Research
- 1.3.5 Other Applications
- 1.4 By End User
- 1.4.1 Biopharmaceutical Companies
- 1.4.2 Contract Development and Research Organizations
- 1.4.3 Academic and Research Institutes
- 1.4.4 Hospitals and Clinical Laboratories
Chapter 2 Introduction
- 2.1 Report Objectives and Scope
- 2.2 Product Definition and Industry Terminology
- 2.3 Market Inclusions and Exclusions
- 2.4 Research Process
- 2.4.1 Primary Research and Expert Interviews
- 2.4.2 Secondary Research and Source Review
- 2.4.3 Top-Down and Bottom-Up Estimation
- 2.4.4 Data Triangulation and Verification
- 2.5 Market Size Measurement Basis
- 2.5.1 2025: USD 3.12 billion → 2035: USD 9.11 billion
- 2.6 Historical and Forecast Reference Periods
- 2.6.1 Historical Period: 2018-2025
- 2.6.2 Base Year: 2025
- 2.6.3 Forecast Period: 2025-2035
- 2.7 Research Assumptions and Limitations
Chapter 3 Executive Summary
- 3.1 Market Snapshot and Key Findings
- 3.2 Base-Year Market Size, 2025
- 3.3 Forecast Market Size, 2035
- 3.4 Revenue and Volume Growth Outlook
- 3.5 Key Demand and Supply Indicators
- 3.6 Leading Market Segments
- 3.7 Fastest-Growing Market Opportunities
- 3.8 Regional Performance Highlights
- 3.9 Technology and Industry Transformation
- 3.10 Competitive Landscape Summary
- 3.11 Analyst View and Strategic Implications
Chapter 4 Global Cell Culture Sampling Devices Market Trends and Developments
- 4.1 Historical Industry Development, 2018-2025
- 4.2 Recent Market Trends and Developments
- 4.3 Demand and Customer Behavior Trends
- 4.4 Technology and Product Innovation
- 4.5 Artificial Intelligence, Automation and Digitalization
- 4.6 Local Manufacturing and Supply Chain Realignment
- 4.7 Industry Partnerships, Mergers and Acquisitions
- 4.8 Sustainability and Circular Economy Developments
- 4.9 Government and Private Sector Investment Trends
- 4.10 Emerging Business Models and Commercialization
- 4.11 Industry Developments and Announcements
Chapter 5 Global Cell Culture Sampling Devices Market Production, Supply and Demand Analysis
- 5.1 Demand Trend and Consumption Analysis, 2018-2025
- 5.2 Demand Forecast, 2025-2035
- 5.3 Production and Output Trend, 2018-2025
- 5.4 Production and Output Forecast, 2025-2035
- 5.5 Installed Capacity and Capacity Utilization
- 5.6 Company-Wise Production Plants and Statistics
- 5.6.1 Installed Production Capacity
- 5.6.2 Actual Production
- 5.6.3 Planned Capacity and Expansion Targets
- 5.7 Supply Chain Structure and Procurement Trends
- 5.8 Supply-Demand Gap and Bottlenecks
- 5.9 Import Dependence and Sourcing Structure
- 5.10 Contract Manufacturing and Outsourcing
- 5.11 Regional Supply and Demand Concentration
Chapter 6 Global Cell Culture Sampling Devices Market Pricing Analysis
- 6.1 Pricing Structure and Measurement
- 6.2 Historical Pricing Trends, 2018-2025
- 6.3 Pricing Outlook, 2025-2035
- 6.4 Average Selling Price and Unit Economics
- 6.5 Pricing by Product and Market Segment
- 6.6 Geographic Pricing Differences
- 6.7 Key Input, Energy, Labor and Logistics Costs
- 6.8 Contract Pricing and Purchasing Models
- 6.9 Pricing Sensitivity and Competitive Positioning
- 6.10 Price, Margin and Profitability Implications
Chapter 7 Global Cell Culture Sampling Devices Market Dynamics
- 7.1 Market Growth Drivers
- 7.1.1 Demand-Side Drivers
- 7.1.2 Technology and Innovation Drivers
- 7.1.3 Infrastructure and Investment Drivers
- 7.1.4 Regulatory and Policy Drivers
- 7.2 Market Restraints
- 7.2.1 Cost and Affordability Constraints
- 7.2.2 Technology and Adoption Barriers
- 7.2.3 Supply Chain and Operational Constraints
- 7.3 Market Challenges
- 7.3.1 Competitive Pressure and Margin Erosion
- 7.3.2 Skills, Infrastructure and Implementation Gaps
- 7.4 Emerging Market Opportunities
- 7.5 Market Dynamics Impact and Time-Horizon Assessment
Chapter 8 Global Cell Culture Sampling Devices Value Chain Analysis
- 8.1 Industry Value Chain Overview
- 8.2 Upstream Suppliers and Critical Inputs
- 8.3 Technology and Component Providers
- 8.4 Manufacturing or Service Delivery
- 8.5 Distribution, Channel Partners and Integrators
- 8.6 Downstream Applications and End Users
- 8.7 Value Addition and Profit Pools
- 8.8 Vertical Integration and Outsourcing
- 8.9 Supplier Concentration and Risk
- 8.10 Supply Chain Localization and Resilience
Chapter 9 Global Cell Culture Sampling Devices Market Regulations and Policies
- 9.1 Relevant Laws, Standards and Compliance Frameworks
- 9.2 Product, Service, Safety and Quality Requirements
- 9.3 Government Policies, Incentives and Subsidies
- 9.4 Imports, Exports and Trade Barriers
- 9.5 Public Procurement and Local Content Requirements
- 9.6 Environmental and Sustainability Compliance
- 9.7 Upcoming Policy Changes and Market Implications
Chapter 10 Global Cell Culture Sampling Devices Market Hotspots and Opportunities
- 10.1 Market Opportunity Mapping and Growth Hotspots
- 10.2 High-Growth Applications and Customer Groups
- 10.3 Underserved Markets and White-Space Opportunities
- 10.4 Emerging Technology and Product Opportunities
- 10.5 New Capacity and Investment Hotspots
- 10.6 Market Entry and Expansion Opportunities
- 10.7 Distribution and Partnership Opportunities
- 10.8 Near-Term and Long-Term Commercial Potential
- 10.9 Opportunity Attractiveness and Execution Risks
Chapter 11 Global Cell Culture Sampling Devices Market Outlook, 2025-2035
- 11.1 Market Size and Analysis
- 11.1.1 Revenue (Market Measurement: 2025: USD 3.12 billion → 2035: USD 9.11 billion)
- 11.1.2 Market Volume and Quantity Sold
- 11.1.3 Historical Market Size, 2018-2025
- 11.1.4 Base-Year Market Size, 2025
- 11.2 Market Forecast, 2025-2035
- 11.2.1 Revenue Forecast to 2035
- 11.2.2 Volume Forecast to 2035
- 11.2.3 CAGR and Year-on-Year Growth
- 11.2.4 Incremental Revenue Opportunity
- 11.3 Forecast Assumptions and Scenario Analysis
- 11.3.1 Base-Case Forecast
- 11.3.2 Optimistic and Conservative Scenarios
- 11.3.3 Technology, Pricing and Policy Sensitivities
- 11.4 Market Attractiveness and Growth Outlook
Chapter 12 Global Cell Culture Sampling Devices Market Segmentation and Outlook
- 12.1 Segmentation Summary and Market Shares, 2025
- 12.2 Largest and Fastest-Growing Segments
- 12.3 By Device - Market Size and Forecast, 2025-2035
- 12.3.1 Segment Definition and Scope
- 12.3.2 Historical Market Size, 2018-2025
- 12.3.3 Revenue Forecast, 2025-2035
- 12.3.4 Volume Forecast, 2025-2035
- 12.3.5 Base-Year Market Share, 2025
- 12.3.6 Segment CAGR and Growth Drivers
- 12.3.7 Subsegment Market Size and Forecast
- 12.3.7.1 Manual Aseptic Sampling Systems
- 12.3.7.2 Automated and Online Sampling Systems
- 12.3.7.3 Pipetting and Liquid Handling Instruments
- 12.3.7.4 Sample Storage and Cryostorage Equipment
- 12.3.8 Subsegment Pricing and Adoption Trends
- 12.3.9 Leading Suppliers and Competition
- 12.3.10 Regional Demand and Opportunities
- 12.4 By Application - Market Size and Forecast, 2025-2035
- 12.4.1 Segment Definition and Scope
- 12.4.2 Historical Market Size, 2018-2025
- 12.4.3 Revenue Forecast, 2025-2035
- 12.4.4 Volume Forecast, 2025-2035
- 12.4.5 Base-Year Market Share, 2025
- 12.4.6 Segment CAGR and Growth Drivers
- 12.4.7 Subsegment Market Size and Forecast
- 12.4.7.1 Biopharmaceutical Production
- 12.4.7.2 Drug Development
- 12.4.7.3 Cell and Gene Therapy
- 12.4.7.4 Cancer Research
- 12.4.7.5 Other Applications
- 12.4.8 Subsegment Pricing and Adoption Trends
- 12.4.9 Leading Suppliers and Competition
- 12.4.10 Regional Demand and Opportunities
- 12.5 By End User - Market Size and Forecast, 2025-2035
- 12.5.1 Segment Definition and Scope
- 12.5.2 Historical Market Size, 2018-2025
- 12.5.3 Revenue Forecast, 2025-2035
- 12.5.4 Volume Forecast, 2025-2035
- 12.5.5 Base-Year Market Share, 2025
- 12.5.6 Segment CAGR and Growth Drivers
- 12.5.7 Subsegment Market Size and Forecast
- 12.5.7.1 Biopharmaceutical Companies
- 12.5.7.2 Contract Development and Research Organizations
- 12.5.7.3 Academic and Research Institutes
- 12.5.7.4 Hospitals and Clinical Laboratories
- 12.5.8 Subsegment Pricing and Adoption Trends
- 12.5.9 Leading Suppliers and Competition
- 12.5.10 Regional Demand and Opportunities
- 12.6 Segment Growth Comparison
- 12.7 Segment Attractiveness and Priority Matrix
Chapter 13 Global Cell Culture Sampling Devices End-Use and Application Market Outlook
- 13.1 End-Use Industry and Customer Demand Structure
- 13.2 Leading Applications and Customer Groups
- 13.3 End-Use Market Size, Share and Forecast
- 13.4 Major End-Use Industry Deep Dives
- 13.4.1 Customer Requirements and Use Cases
- 13.4.2 Demand and Replacement Cycles
- 13.4.3 Technical and Regulatory Considerations
- 13.4.4 Purchasing and Procurement Models
- 13.4.5 Leading Vendors and Distribution Channels
- 13.4.6 Forecast and Commercial Opportunities
- 13.5 Emerging Applications and Cross-Segment Demand
- 13.6 End-Use Industry Investment Priorities
Chapter 14 Global Cell Culture Sampling Devices Geographic Market Outlook, 2025-2035
- 14.1 Regional Market Size and Share, 2025
- 14.2 Regional Market Forecast, 2025-2035
- 14.3 Regional Pricing, Production and Demand Differences
- 14.4 North America
- 14.4.1 United States
- 14.4.2 Canada
- 14.4.3 Mexico
- 14.5 Europe
- 14.5.1 Germany
- 14.5.2 France
- 14.5.3 Italy
- 14.5.4 United Kingdom
- 14.5.5 Spain
- 14.5.6 Poland
- 14.5.7 Russia
- 14.5.8 Netherlands
- 14.5.9 Belgium
- 14.5.10 Sweden
- 14.5.11 Denmark
- 14.5.12 Norway
- 14.5.13 Rest of Europe
- 14.6 Asia Pacific
- 14.6.1 China
- 14.6.2 India
- 14.6.3 Japan
- 14.6.4 South Korea
- 14.6.5 Thailand
- 14.6.6 Indonesia
- 14.6.7 Vietnam
- 14.6.8 Malaysia
- 14.6.9 Australia
- 14.6.10 Rest of Asia Pacific
- 14.7 Latin America
- 14.7.1 Brazil
- 14.7.2 Argentina
- 14.7.3 Colombia
- 14.7.4 Chile
- 14.7.5 Rest of Latin America
- 14.8 Middle East
- 14.8.1 Saudi Arabia
- 14.8.2 United Arab Emirates
- 14.8.3 Turkey
- 14.8.4 Israel
- 14.8.5 Iran
- 14.8.6 Rest of the Middle East
- 14.9 Africa
- 14.9.1 South Africa
- 14.9.2 Egypt
- 14.9.3 Nigeria
- 14.9.4 Morocco
- 14.9.5 Rest of Africa
- 14.10 Regional Investment, Policy and Supply Chain Differences
- 14.11 Regional Competitive Landscape
- 14.12 Geographic Growth Hotspots
Chapter 15 Global Cell Culture Sampling Devices Technology, Innovation and Sustainability Outlook
- 15.1 Technology Landscape and Maturity
- 15.2 Product, Process and Service Innovation
- 15.3 AI, Automation and Digital Tools in the Industry
- 15.4 Technology Adoption and Performance Benchmarking
- 15.5 Innovation Pipeline and R&D Investment
- 15.6 Patent and Intellectual Property Trends
- 15.7 Energy Efficiency and Resource Management
- 15.8 Sustainability, Recycling and Circularity
- 15.9 Technology Roadmap, 2025-2035
- 15.10 Risks of Obsolescence and Technology Substitution
Chapter 16 Global Cell Culture Sampling Devices Market Key Strategic Imperatives
- 16.1 Growth and Market Entry Priorities
- 16.2 High-Return Products and Segments
- 16.3 Pricing, Profitability and Cost Optimization
- 16.4 Technology Investment and Product Differentiation
- 16.5 Supply Chain Localization and Resilience
- 16.6 Distribution and Customer Acquisition
- 16.7 Partnership, Acquisition and Capacity Strategy
- 16.8 Regional Expansion Priorities
- 16.9 Short-, Medium- and Long-Term Actions
Chapter 17 Competition Outlook
- 17.1 Industry Competition Characteristics
- 17.2 Market Structure and Concentration
- 17.3 Market Share and Competitive Positioning, 2025
- 17.4 Company-Wise Revenue and Product Benchmarking
- 17.5 Production and Service Capacity Benchmarking
- 17.6 Technology, Pricing and Differentiation
- 17.7 Regional Footprint and Distribution Strength
- 17.8 Mergers, Acquisitions and Strategic Alliances
- 17.9 New Entrants and Competitive Threats
- 17.10 Porter's Five Forces and Industry Attractiveness
- 17.11 Competitive Outlook, 2025-2035
Chapter 18 Company Profiles
- 18.1 Company Coverage and Selection Criteria
- 18.2 Sartorius AG
- 18.2.1 Business Description
- 18.2.2 Company Ownership and Geographic Presence
- 18.2.3 Product and Service Portfolio
- 18.2.4 Manufacturing and Operating Footprint
- 18.2.5 Production Capacity and Expansion Plans
- 18.2.6 Financial Performance and Investment
- 18.2.7 Market Share and Competitive Position
- 18.2.8 Technology and Innovation Capabilities
- 18.2.9 Strategic Alliances or Partnerships
- 18.2.10 Recent Developments
- 18.2.11 Growth Strategy and Outlook
- 18.3 Merck KGaA (MilliporeSigma)
- 18.4 Thermo Fisher Scientific Inc.
- 18.5 Danaher Corporation (Cytiva and Pall)
- 18.6 Avantor, Inc.
- 18.7 Securecell AG
- 18.8 Eppendorf SE
- 18.9 Corning Incorporated
- 18.10 Other Relevant Market Participants
Note: Every listed company is profiled on the structure shown under the first company. The company list is preliminary and may change based on research findings, market developments, data availability and client requirements.
Chapter 19 Disclaimer
- 19.1 Research and Forecast Disclaimer
- 19.2 Data Source and Estimation Limitations
Note: The depth of individual sections depends on data availability for this market. Volume, capacity, trade and other unit-based metrics are included where applicable.