
Market Overview:
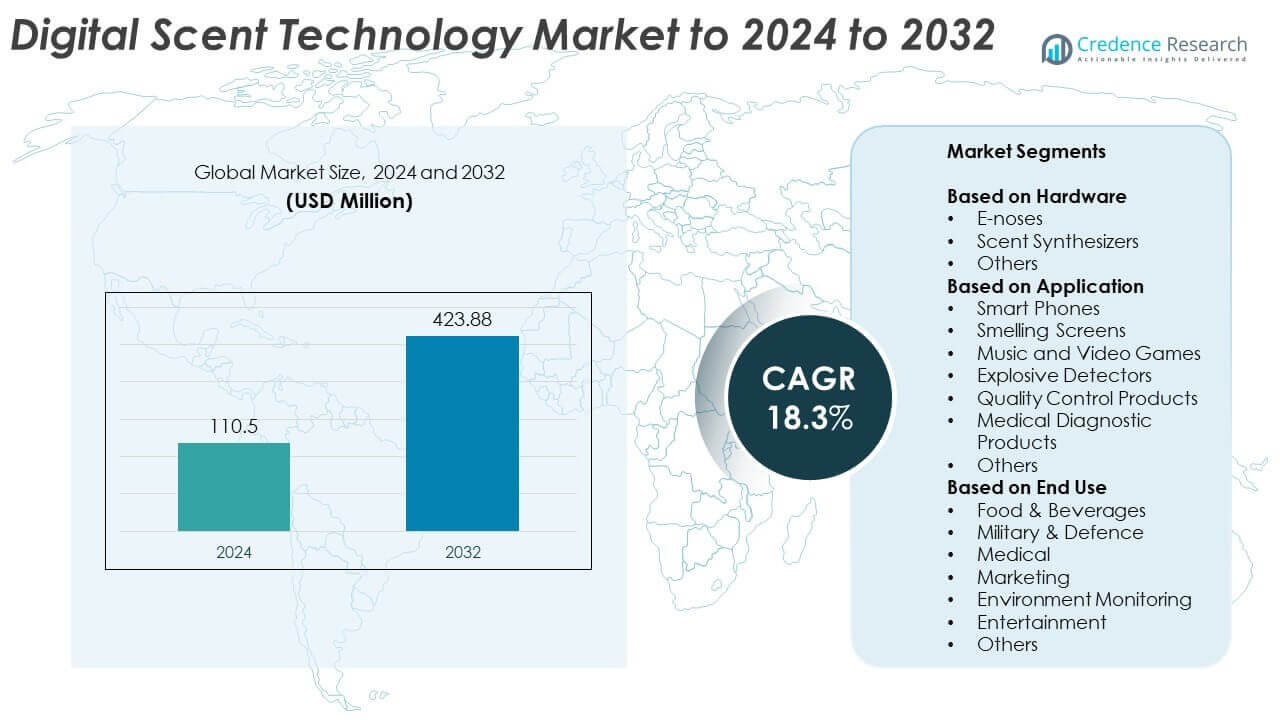
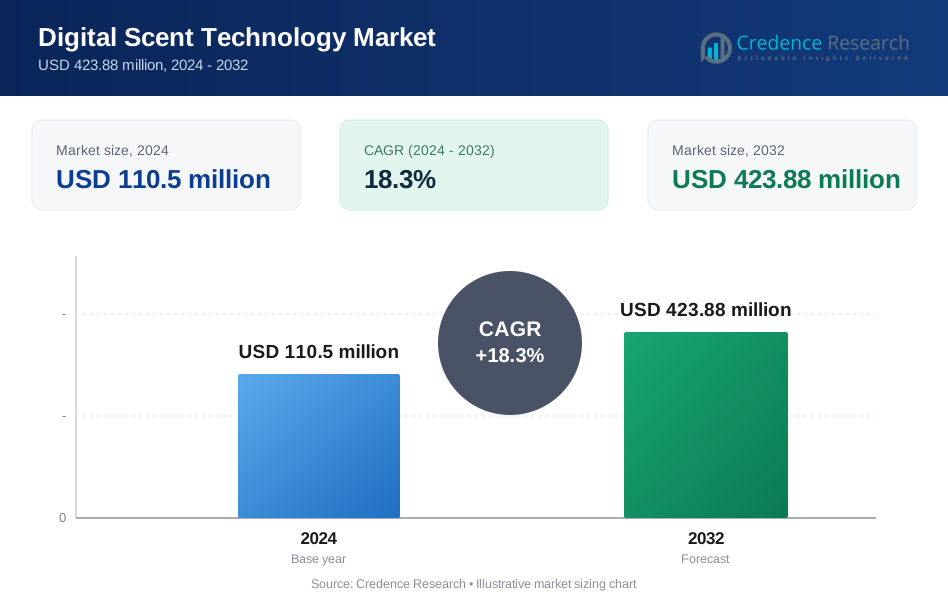
Digital Scent Technology Market size was valued at USD 110.5 million in 2024 and is anticipated to reach USD 423.88 million by 2032, at a CAGR of 18.3% during the forecast period.
| REPORT ATTRIBUTE | DETAILS |
|---|---|
| Historical Period | 2020-2023 |
| Base Year | 2024 |
| Forecast Period | 2025-2032 |
| Digital Scent Technology Market Size 2024 | USD 1110.5 million |
| Digital Scent Technology Market, CAGR | 18.3% |
| Digital Scent Technology Market Size 2032 | USD 423.88 million |
The digital scent technology market is led by companies such as Aromajoin Corporation, Owlstone Inc., Smiths Detection Group Ltd., Fraunhofer IIS, Sensigent LLC, OVR Technology, Aryballe, Scentsy, Inc., Aroma Bit, Inc., Affectiva, The eNose Company, and Kiwa Bio-Tech Products Group Corporation. These firms are advancing innovations in e-nose systems, scent synthesizers, and AI-powered odor recognition platforms to enhance applications across healthcare, defense, food processing, and entertainment industries. North America dominated the market with a 39% share in 2024, driven by strong technological integration and industrial adoption, followed by Europe with 31% and Asia-Pacific with 22%, supported by expanding research investments and rising consumer electronics demand.
Market Insights
- The Digital Scent Technology Market was valued at USD 110.5 million in 2024 and is projected to reach USD 423.88 million by 2032, growing at a CAGR of 18.3%.
- Rising demand for advanced sensing solutions in healthcare diagnostics, food testing, and defense applications is driving global market expansion.
- Key trends include the integration of AI and IoT in e-noses, growing use of scent synthesizers in entertainment, and miniaturized sensor innovations.
- The market is competitive, with companies focusing on R&D collaborations, scalable manufacturing, and AI-powered scent data platforms to enhance precision and usability.
- North America led with a 39% share in 2024, followed by Europe at 31% and Asia-Pacific at 22%, while the e-noses segment dominated with 48% of the total market share.
Market Segmentation Analysis:
By Hardware
E-noses dominated the digital scent technology market with a 48% share in 2024. Their widespread adoption in food quality testing, medical diagnostics, and environmental monitoring drives this dominance. These sensors detect volatile compounds using chemical and biosensor arrays, enabling precise odor identification. Scent synthesizers are gaining traction in entertainment and virtual reality due to their ability to reproduce scents in real time. Continuous innovations in nanomaterial-based sensors and compact hardware designs further enhance sensitivity and integration potential across consumer and industrial applications.
- For instance, Sensigent’s Cyranose 320 uses a 32-sensor array of nanocomposite polymer sensors.
By Application
Quality control products led the market with a 36% share in 2024. These systems are crucial in ensuring product consistency in food, beverages, and cosmetics manufacturing. Their use in detecting contamination and maintaining aroma standards enhances efficiency and compliance. Explosive detectors and medical diagnostic products are emerging applications, driven by safety and healthcare demand. Smelling screens and gaming integration are also expanding, supported by advances in olfactory display technologies that enhance user experiences in entertainment and digital media sectors.
- For instance, Alpha MOS’s HERACLES Neo fast-GC e-nose completes an aroma run in 110 seconds, supporting high-throughput quality control.
By End Use
The food and beverages segment held the largest share of 41% in 2024. Manufacturers increasingly adopt scent-based monitoring systems for freshness detection, flavor profiling, and packaging quality assurance. The medical sector follows closely, leveraging scent analysis for disease diagnosis and non-invasive monitoring. Military and defense applications are expanding as e-nose devices detect hazardous gases and explosives. Growing interest from marketing and entertainment industries, using scent diffusion for immersive advertising and sensory branding, continues to create new opportunities across consumer-centric sectors.
Market Overview
Key Growth Drivers
Rising Adoption in Healthcare and Diagnostics
The integration of digital scent technology in medical diagnostics is a major growth driver. E-nose systems are increasingly used for non-invasive detection of diseases through breath analysis, offering faster and more accurate diagnosis. These devices help identify volatile organic compounds linked to respiratory, metabolic, and infectious conditions. Growing healthcare digitalization and investments in AI-based medical devices further enhance adoption. The ability to deliver real-time and chemical-free diagnostic results is expanding their role in early disease detection and patient monitoring.
- For instance, one study using The eNose Company’s aeoNose, which is based on an artificial neural network, reported that in non-small cell lung cancer (NSCLC) cohorts, the device demonstrated a sensitivity of 94.2% and a specificity of 44.1%.
Growing Demand from Food and Beverage Industry
Digital scent systems are gaining strong traction in food and beverage quality assurance. E-nose devices enable precise detection of spoilage, contamination, and freshness levels, ensuring consistent product standards. Manufacturers are adopting these technologies to enhance sensory evaluation and maintain flavor integrity during production and packaging. Increasing global demand for processed and packaged foods, along with stringent quality regulations, is accelerating their use. The technology supports predictive quality control and improves efficiency in production lines.
- For instance, OVR Technology’s ION VR add-on carries nine scent cartridges for programmable blends in immersive apps.
Expanding Use in Consumer Electronics and Entertainment
The integration of scent technology into consumer devices such as smartphones, VR headsets, and gaming systems is fueling growth. Companies are embedding micro scent emitters to provide immersive sensory experiences. This advancement enhances realism in virtual environments and interactive media, attracting strong interest from gaming and entertainment developers. Rising consumer demand for multisensory engagement is prompting major electronics firms to explore scent-enabled interfaces. As digital experiences evolve, this segment is expected to contribute significantly to future market expansion.
Key Trends & Opportunities
Advancements in AI and Machine Learning Integration
AI integration is revolutionizing scent analysis accuracy and speed. Machine learning algorithms enable e-noses to identify complex odor patterns, improving predictive analytics in quality testing and diagnostics. Automated data interpretation reduces human error and enhances repeatability in industrial applications. The growing use of AI-driven scent profiling offers new opportunities for customization in healthcare, manufacturing, and defense sectors. These advancements support the development of intelligent olfactory systems capable of self-calibration and real-time environmental sensing.
- For instance, Bosch Sensortec’s BME688 employs on-device AI and detects VOCs in the ppb range within a 3.0 × 3.0 × 0.9 mm package.
Emergence of Scent-Enabled Virtual Reality Applications
Virtual reality developers are increasingly integrating scent synthesis to enhance immersive experiences. The inclusion of digital scent emitters in VR and AR devices allows users to experience lifelike environments through smell. This creates opportunities in entertainment, marketing, and training simulations where realism improves engagement. The trend aligns with rising investments in sensory technologies by gaming and media companies. As hardware miniaturization and wireless integration advance, scent-enabled VR applications are expected to gain commercial viability and widespread adoption.
- For instance, Aromajoin’s Aroma Shooter achieves scent switching in 0.1 seconds, enabling synchronized olfactory cues in media and VR.
Key Challenges
High Cost of Development and Implementation
The high production and integration cost of digital scent hardware remains a major challenge. Advanced sensors, microfluidic components, and AI-driven control systems significantly increase device pricing. This limits adoption among small and medium enterprises, especially in developing economies. Manufacturing complexities and the need for specialized calibration add further expense. To achieve scalability, companies must focus on cost-efficient materials, standardized designs, and modular systems that reduce overall deployment and maintenance costs while maintaining performance accuracy.
Lack of Standardization and Sensory Accuracy
The absence of uniform standards for scent measurement and interpretation poses a barrier to widespread adoption. Variations in odor perception across users and environments make calibration difficult. Inconsistent results between devices hinder cross-platform compatibility in industrial and consumer applications. This limitation affects trust and repeatability in sectors like healthcare and food quality testing. Developing global frameworks for scent coding, detection protocols, and data interoperability is essential to ensure reliable, consistent performance across industries.
Regional Analysis
North America
North America dominated the digital scent technology market with a 39% share in 2024. The region’s leadership is driven by strong adoption across healthcare, defense, and food industries. The U.S. leads with major investments in e-nose development and AI-based diagnostics. High consumer awareness and technological maturity support the integration of scent systems in entertainment and wearable devices. Continuous research funding and the presence of major tech innovators are further propelling regional growth. Canada’s focus on industrial automation and environmental monitoring also contributes significantly to overall market expansion.
Europe
Europe held a 31% share of the digital scent technology market in 2024. Strong research initiatives in Germany, France, and the U.K. are advancing applications in medical diagnostics and food testing. The region benefits from strict quality regulations and sustainability-focused innovation. European industries are integrating digital scent systems for safety monitoring and industrial odor management. Expanding adoption in marketing, fragrance testing, and consumer electronics further strengthens demand. Collaborative research programs between universities and technology firms continue to enhance system accuracy and operational efficiency across industrial sectors.
Asia-Pacific
Asia-Pacific accounted for 22% of the digital scent technology market in 2024. The region’s rapid growth is supported by increasing demand from consumer electronics, food processing, and healthcare industries. China, Japan, and South Korea are leading adopters of e-nose and scent synthesizer technologies. Expanding urbanization and rising disposable incomes are fueling adoption of immersive entertainment products. Government initiatives promoting advanced manufacturing and digital innovation further support market expansion. Growing investment in AI and sensor-based technologies positions the region as a major hub for future development.
Latin America
Latin America captured a 5% share of the digital scent technology market in 2024. The region’s growth is primarily driven by adoption in food quality testing and environmental monitoring. Brazil and Mexico lead the market with initiatives focused on enhancing product safety and freshness control. Increasing investment in healthcare and agriculture sectors is creating new opportunities for scent-based analytical devices. Rising interest in digital marketing and sensory branding is also boosting adoption. However, limited local manufacturing capabilities slightly restrain the region’s overall market pace.
Middle East & Africa
The Middle East & Africa region held a 3% share of the digital scent technology market in 2024. The market is gradually expanding with growing use in security screening, defense, and environmental applications. Countries such as the UAE and Saudi Arabia are investing in digital transformation and smart technologies, supporting early adoption. Industrial hygiene and air quality monitoring are emerging focus areas. Despite limited research infrastructure, partnerships with global technology providers are enabling steady regional progress. The sector is expected to gain momentum with increased government-backed innovation programs.
Market Segmentations:
By Hardware
- E-noses
- Scent Synthesizers
- Others
By Application
- Smart Phones
- Smelling Screens
- Music and Video Games
- Explosive Detectors
- Quality Control Products
- Medical Diagnostic Products
- Others
By End Use
- Food & Beverages
- Military & Defence
- Medical
- Marketing
- Environment Monitoring
- Entertainment
- Others
By Geography
- North America
- U.S.
- Canada
- Mexico
- Europe
- Germany
- France
- U.K.
- Italy
- Spain
- Rest of Europe
- Asia Pacific
- China
- Japan
- India
- South Korea
- South-east Asia
- Rest of Asia Pacific
- Latin America
- Brazil
- Argentina
- Rest of Latin America
- Middle East & Africa
- GCC Countries
- South Africa
- Rest of the Middle East and Africa
Competitive Landscape
The digital scent technology market features leading players such as Aromajoin Corporation, Smiths Detection Group Ltd., Owlstone Inc., Sensigent LLC, OVR Technology, Fraunhofer IIS, Scentsy, Inc., Aryballe, Aroma Bit, Inc., Affectiva, The eNose Company, and Kiwa Bio-Tech Products Group Corporation. The competitive landscape is defined by continuous innovation in e-nose design, sensor miniaturization, and AI-based odor analytics. Companies are investing heavily in research collaborations and product diversification to strengthen their technological capabilities. Strategic partnerships with healthcare, defense, and consumer electronics firms are helping expand applications across multiple industries. Vendors are focusing on enhancing sensitivity, reducing response time, and integrating digital scent solutions into connected ecosystems. Competition is intensifying as new entrants explore affordable hardware models and cloud-based odor databases. Regional expansion strategies and patent-driven product differentiation are further shaping market positioning, fostering a dynamic environment focused on accuracy, sustainability, and user experience enhancement.
Key Player Analysis
- Aromajoin Corporation
- Smiths Detection Group Ltd.
- Owlstone Inc.
- Sensigent LLC
- OVR Technology
- Fraunhofer IIS
- Scentsy, Inc.
- Aryballe
- Aroma Bit, Inc.
- Affectiva
- The eNose Company
- Kiwa Bio-Tech Products Group Corporation
Recent Developments
- In 2024, Aroma Bit, Inc. Developed a new type of odor imaging sensor chip using CMOS semiconductors, creating a prototype e-nose with a small sensor element integrated with driver and A/D converter circuits.
- In 2023, Aryballe Launched the Digital Olfaction Hub, a cloud-based software platform designed for faster and more intuitive odor analysis. The platform provides tools for customers to effectively use digital odor data.
- In 2023, OVR Technology Launched ION 3, a wearable scent technology solution for multisensory experiences, particularly aimed at immersive environments in VR.
Report Coverage
The research report offers an in-depth analysis based on Hardware, Application, End-Use and Geography. It details leading market players, providing an overview of their business, product offerings, investments, revenue streams, and key applications. Additionally, the report includes insights into the competitive environment, SWOT analysis, current market trends, as well as the primary drivers and constraints. Furthermore, it discusses various factors that have driven market expansion in recent years. The report also explores market dynamics, regulatory scenarios, and technological advancements that are shaping the industry. It assesses the impact of external factors and global economic changes on market growth. Lastly, it provides strategic recommendations for new entrants and established companies to navigate the complexities of the market.
Future Outlook
- Growing integration of AI and machine learning will enhance odor recognition accuracy and response time.
- Healthcare adoption will expand through breath-based disease diagnostics and non-invasive testing applications.
- Advancements in miniaturized sensors will enable wider use in smartphones and wearable devices.
- Scent-enabled virtual and augmented reality will gain popularity in gaming and entertainment sectors.
- Rising demand for quality control in food and beverage industries will drive consistent technology upgrades.
- Development of standardized scent databases will improve interoperability across hardware platforms.
- Collaboration between tech firms and research institutions will accelerate innovation and commercialization.
- Integration with IoT networks will enable real-time environmental and industrial odor monitoring.
- Adoption in marketing and retail will grow through personalized scent-based consumer engagement strategies.
- Increasing investment in sustainable and energy-efficient scent systems will strengthen global market expansion.
Request a Free Sample
Fill in your details and we'll send you a free sample report.
- Sample data tables & charts
- Research methodology
Need a Custom Version of This Report?
Tailor the scope, geography, or segments to your exact requirements.
- Custom geography or segment scope
- Direct access to our analyst team
Frequently Asked Questions
What is the current market size for Digital Scent Technology Market, and what is its projected size in 2032?
At what Compound Annual Growth Rate is the Digital Scent Technology Market projected to grow between 2025 and 2032?
Which Digital Scent Technology Market segment held the largest share in 2024?
What are the primary factors fueling the growth of the Digital Scent Technology Market?
Who are the leading companies in the Digital Scent Technology Market?
Which region commanded the largest share of the Digital Scent Technology Market in 2024?
Table of Content
Chapter 1. Report Introduction
- 1.1 Report Description & Purpose
- 1.1.1 Report Title & Market Definition
- 1.1.2 Unique Selling Propositions (USP) & Key Differentiators
- 1.1.3 Value Proposition for Stakeholders
- 1.2 Research Objectives
- 1.2.1 Market Sizing Objectives (Volume & Revenue)
- 1.2.2 Segmentation Objectives
- 1.2.3 Competitive Intelligence Objectives
- 1.2.4 Forecast & Scenario Objectives
- 1.3 Report Scope
- 1.3.1 Digital Scent Technology Scope – Types & Subtypes Covered
- 1.3.2 Geographic Scope – Regions & Countries Covered
- 1.3.3 Historical Period, Base Year & Forecast Period (2024; forecast to 2032)
- 1.3.4 Inclusions & Exclusions
- 1.4 HS Code & Classification Framework
- 1.5 Currency, Units & Pricing Basis
- 1.6 Target Stakeholders
- 1.7 Limitations & Assumptions
Chapter 2. Executive Summary
- 2.1 Global Digital Scent Technology Market Snapshot
- 2.1.1 Market Size – Historical (2024) & Forecast (2024-2032) (2024: USD 110.5 million → 2032: USD 423.88 million)
- 2.1.2 Volume & Revenue – Global Totals
- 2.1.3 Key Market Highlights – Top Five Facts
- 2.2 Digital Scent Technology Market Segmentation Snapshot
- 2.2.1 Market Split by Region – 2024 vs. 2032
- 2.3 Competitive Snapshot
- 2.3.1 Top 10 Players by Revenue Share – 2024
- 2.3.2 Top 10 Players by Volume Share – 2024
- 2.3.3 Recent Strategic Developments (18-Month Summary)
- 2.4 Key Investment Highlights & Strategic Conclusions
Chapter 3. Digital Scent Technology Market Dynamics & Industry Analysis
- 3.1 Market Overview & Context
- 3.1.1 Digital Scent Technology Market Position in the Broader Automotive Value Chain
- 3.1.2 OEM vs. Replacement Market Dynamics
- 3.1.3 Market Maturity & Development Stage by Region
- 3.2 Digital Scent Technology Market Drivers
- 3.3 Digital Scent Technology Market Restraints & Challenges
- 3.4 Digital Scent Technology Market Opportunities
- 3.5 Porter's Five Forces Analysis
- 3.5.1 Threat of New Entrants
- 3.5.2 Bargaining Power of Suppliers
- 3.5.3 Bargaining Power of Buyers
- 3.5.4 Threat of Substitutes
- 3.5.5 Competitive Rivalry – Intensity Assessment
- 3.6 Digital Scent Technology Value Chain Analysis
- 3.6.1 Upstream – Raw Material/Input Suppliers
- 3.6.1.1 Raw Material/Input 1
- 3.6.1.2 Raw Material/Input 2
- 3.6.1.3 Raw Material/Input 3
- 3.6.2 Midstream – Production/Manufacturing/Service Delivery
- 3.6.2.1 Production/Process Overview
- 3.6.2.2 Key Facility Locations & Capacity by Manufacturer
- 3.6.3 Downstream – Distribution & End Consumer
- 3.6.3.1 Primary Channel – B2B/OEM
- 3.6.3.2 Secondary Channels – Dealer, Retail, Online, Direct
- 3.6.4 Value Chain Profitability Analysis
- 3.6.1 Upstream – Raw Material/Input Suppliers
- 3.7 PESTEL Analysis
- 3.7.1 Political Factors
- 3.7.2 Economic Factors
- 3.7.3 Social Factors
- 3.7.4 Technological Factors
- 3.7.5 Environmental Factors
- 3.7.6 Legal Factors
- 3.8 Digital Scent Technology Supply Chain Analysis
- 3.8.1 Raw Material/Input Supply Risk Assessment
- 3.8.2 Manufacturing Concentration Risk (Geographic Exposure)
- 3.8.3 Trade Disruption Impact Analysis
- 3.9 Regulatory & Policy Landscape
Note: The regulatory and policy landscape section covers regulations based on their applicability to the market, Digital Scent Technology category, geography, and scope of the study. Only regulatory frameworks with a material impact on operations, compliance, trade, sustainability, or market access are analyzed in detail.
Chapter 4. Key Investment Pockets & Opportunity Analysis
- 4.1 Digital Scent Technology Market Attractiveness Analysis
- 4.1.1 By Region – Investment Attractiveness Matrix (Volume × CAGR)
- 4.2 Absolute Revenue Growth Opportunity
- 4.2.1 By Region – Absolute USD Growth Through 2032
- 4.3 Incremental Volume Opportunity
- 4.3.1 By Region – Incremental Volume Through 2032
- 4.3.2 Segment – Incremental Volume
- 4.4 Emerging Submarket Opportunity Deep Dive (Subject to Applicability)
- 4.5 Emerging Market Opportunity Scorecards
- 4.5.1 United States
- 4.5.2 Europe
- 4.5.3 Asia
- 4.5.4 Middle East & Africa
Note: Emerging Market Opportunity Scorecards will be included based on relevance and strategic importance. Regions listed are indicative and may vary depending on data availability and market dynamics.
Chapter 5. Digital Scent Technology Import-Export Analysis & Trade Flows
- 5.1 Global Trade Overview
- 5.1.1 Global Export Value by Country (2024)
- 5.1.2 Global Export Volume by Country (2024)
- 5.1.3 Global Import Value by Country (2024)
- 5.1.4 Global Import Volume by Country (2024)
- 5.1.5 Net Trade Balance by Country (2024)
- 5.2 Export Analysis – Segment
- 5.2.1 Type 1 (HS Code)
- 5.2.2 Type 2 (HS Code)
- 5.2.3 Type 3 (HS Code)
- 5.2.4 Type 4 (HS Code)
- 5.2.5 Type 5 (HS Code)
- 5.3 Import Analysis – Segment
- 5.3.1 Type 1 (HS Code)
- 5.3.2 Type 2 (HS Code)
- 5.3.3 Type 3 (HS Code)
- 5.3.4 Type 4 (HS Code)
- 5.3.5 Type 5 (HS Code)
- 5.4 Average Unit Trade Prices
- 5.4.1 Average Export Price – Segment & Country
- 5.4.2 Average Import Price – Segment & Source Country
- 5.4.3 Price Trends (2024)
- 5.5 Key Trade Route Analysis
- 5.5.1 Trade Route 1
- 5.5.2 Trade Route 2
- 5.5.3 Trade Route 3
- 5.5.4 Trade Route 4
- 5.5.5 Trade Route 5
- 5.6 Trade Policy Impact Assessment
- 5.6.1 US Anti-Dumping & Section 301 Tariffs
- 5.6.2 EU Customs Union Impact
- 5.6.3 Major Free Trade Agreements
- 5.6.4 USMCA Rules of Origin
Note: Trade policy analysis will be included only where relevant to the Digital Scent Technology market.
Chapter 6. Competitive Landscape & Company Benchmarking
- 6.1 Digital Scent Technology Market Concentration & Structure
- 6.1.1 Herfindahl-Hirschman Index (HHI) – vs. 2024
- 6.1.2 Tier 1, Tier 2 & Tier 3 Market Structure
- 6.1.3 Global, Regional & Local Player Dynamics
- 6.2 Digital Scent Technology Market Share Analysis – 2024
- 6.2.1 Global Revenue Share by Company
- 6.2.2 Global Volume Share by Company
- 6.2.3 Regional Revenue Share
- 6.2.4 Market Share Evolution ( vs. 2024)
- 6.2.5 OEM Segment Share by Company
- 6.2.6 Replacement Segment Share by Company
- 6.3 Production/Delivery Capacity & Facility Analysis
- 6.3.1 Global Installed Capacity
- 6.3.2 Capacity Utilization Rates
- 6.3.3 Production/Output Volume
- 6.3.4 Facility Locations & Capacity Map
- 6.3.5 Planned Capacity Additions
- 6.4 Digital Scent Technology Competitive Benchmarking Matrix
- 6.4.1 Revenue, Volume, CAGR & Profitability Comparison
- 6.4.2 Channel Revenue Mix
- 6.4.3 Geographic Revenue Exposure
- 6.4.4 R&D Intensity
- 6.4.5 Sustainability Maturity
- 6.5 Strategic Developments in Digital Scent Technology (Last 24 Months)
- 6.5.1 Mergers, Acquisitions & Divestments
- 6.5.2 New Digital Scent Technology Launches
- 6.5.3 Facility Expansions
- 6.5.4 Strategic Alliances, Joint Ventures & Partnerships
- 6.5.5 Distribution Expansion & Market Entry
- 6.5.6 Sustainability & ESG Initiatives
- 6.6 Competitive Strategy Mapping
- 6.6.1 Leader, Challenger, Follower & Niche Classification
- 6.6.2 Pricing Strategy Comparison
- 6.6.3 Channel Strategy Matrix
Note: Strategic developments are included based on their materiality and the availability of reliable information.
Chapter 7. Global Digital Scent Technology Market – By Distribution Channel
- 7.1 Segment Overview
- 7.1.1 Volume & Revenue Split by Channel (2024 & 2032)
- 7.1.2 Channel Mix Evolution (2024-2032)
Chapter 8. Regional Market Analysis – Global Overview
- 8.1 Global Regional Overview
- 8.1.1 Regional Volume Share
- 8.1.2 Regional Revenue Share
- 8.1.3 Regional Volume by Region
- 8.1.4 Regional Revenue by Region
- 8.1.5 Regional Forecast Through 2032
- 8.2 Cross-Regional Segment Analysis
- 8.2.1 By Distribution Channel
- 8.2.2 By Brand/Price Tier
Chapter 9. North America Digital Scent Technology Market
- 9.1 United States
- 9.2 Canada
- 9.3 Mexico
Chapter 10. Europe Digital Scent Technology Market
- 10.1 Germany
- 10.2 France
- 10.3 Italy
- 10.4 United Kingdom
- 10.5 Spain
- 10.6 Poland
- 10.7 Russia
- 10.8 Netherlands
- 10.9 Belgium
- 10.10 Sweden
- 10.11 Denmark
- 10.12 Norway
- 10.13 Rest of Europe
Chapter 11. Asia Pacific Digital Scent Technology Market
- 11.1 China
- 11.2 India
- 11.3 Japan
- 11.4 South Korea
- 11.5 Thailand
- 11.6 Indonesia
- 11.7 Vietnam
- 11.8 Malaysia
- 11.9 Australia
- 11.10 Rest of Asia Pacific
Chapter 12. Latin America Digital Scent Technology Market
- 12.1 Brazil
- 12.2 Argentina
- 12.3 Colombia
- 12.4 Chile
- 12.5 Rest of Latin America
Chapter 13. Middle East Digital Scent Technology Market
- 13.1 Saudi Arabia
- 13.2 United Arab Emirates
- 13.3 Turkey
- 13.4 Israel
- 13.5 Iran
- 13.6 Rest of the Middle East
Chapter 14. Africa Digital Scent Technology Market
- 14.1 South Africa
- 14.2 Egypt
- 14.3 Nigeria
- 14.4 Morocco
- 14.5 Rest of Africa
Chapter 15. Digital Scent Technology Company Profiles
- 15.1 [Company 01]
- 15.1.1 Company Overview
- 15.1.2 Key Management Personnel
- 15.1.3 Products & Services Portfolio
- 15.1.4 Financial Performance
- 15.1.5 Key Market Focus & Geographic Presence
- 15.1.6 Recent Developments & Strategic Initiatives
Note: The company profile list is preliminary and may change based on research findings, market developments, data availability, and client requirements.
Chapter 16. Appendices
- Appendix A – List of Abbreviations & Acronyms
- Appendix B – Industry Classification Code Reference – Full Series
- Appendix C – Production & Capacity Data Tables
- Appendix D – End-Use & Demand Base Tables
- Appendix E – Consumption & Replacement Rate Assumptions
- Appendix F – ASP Reference Tables
- Appendix G – Manufacturing & Facility Database
- Appendix H – Import-Export Data Tables
- Appendix I – Regulatory Summary Tables
- Appendix J – Primary Research Participant List (Anonymized)
- Appendix K – Primary Research Questionnaire Framework
- Appendix L – Data Sources & Bibliography
- Appendix M – Market Size Divergence & Source Comparison
Chapter 17. Research Methodology
- 17.1 Research Framework & Philosophy
- 17.2 Secondary Research – Sources, Hierarchy & Data Extraction
- 17.3 Data Modeling – Bottom-Up & Top-Down Market Sizing
- 17.4 Primary Research – Stakeholder Framework, LOI & Sample Sizes
- 17.5 Forecast Methodology – Regression, Scenario & Sensitivity Analysis
- 17.6 Quality Control – Four-Layer Validation Framework
- 17.7 Limitations & Standard Assumptions
- 17.8 Disclaimer
