
Market Overview:
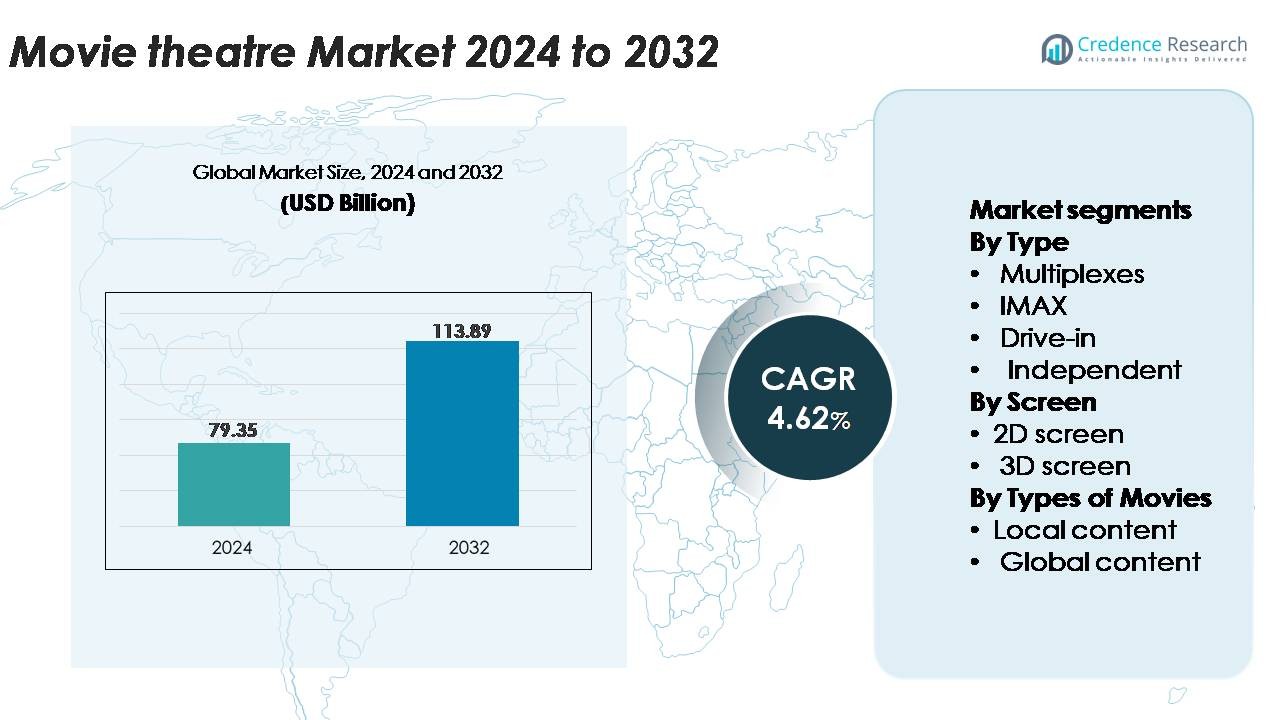
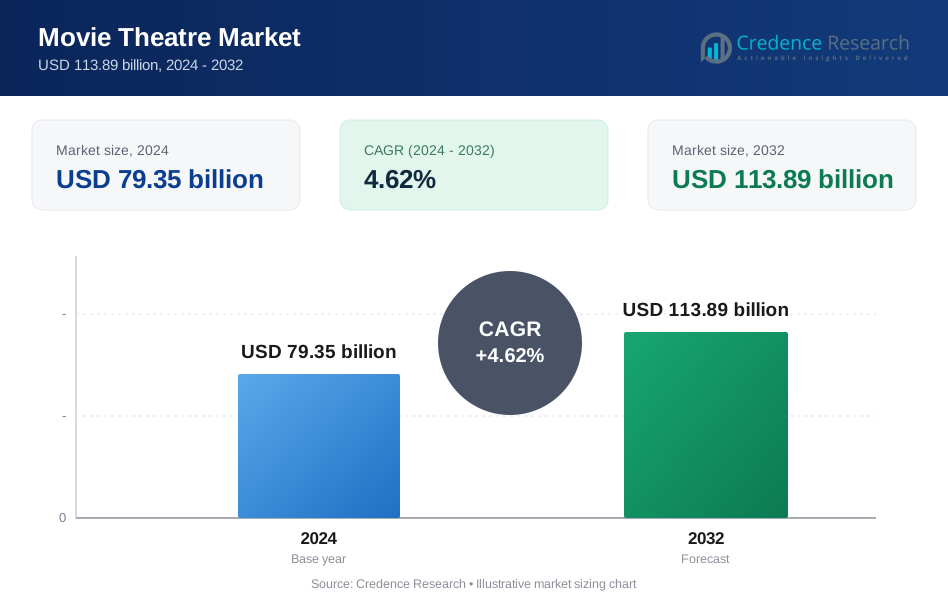
The global movie theatre market was valued at USD 79.35 billion in 2024 and is projected to reach USD 113.89 billion by 2032, expanding at a CAGR of 4.62% over the forecast period.
| REPORT ATTRIBUTE | DETAILS |
|---|---|
| Historical Period | 2020-2023 |
| Base Year | 2024 |
| Forecast Period | 2025-2032 |
| Movie Theatre Market Size 2024 | USD 79.35 Billion |
| Movie Theatre Market, CAGR | 4.62% |
| Movie Theatre Market Size 2032 | USD 113.89 Billion |
The movie theatre market is shaped by major global and regional exhibitors, including Cineworld, PVR INOX, B&B Theatres, Cinepolis, CJ CGV, Cinemex, Odeon Cinemas, Cinemark, Cineplex, and CGR Cinemas, each contributing to diverse content offerings and premium-screen expansion. These operators focus on widening multiplex footprints, upgrading projection technologies, and enhancing luxury seating formats to strengthen audience engagement. Asia-Pacific leads the global market with approximately 34% share, driven by rapid screen expansion in China, India, and Southeast Asia. North America follows with about 32%, supported by strong premium-format adoption and consistent franchise-driven attendance, anchoring competitive momentum for top theatre chains worldwide.
Market Insights:
- The global movie theatre market was valued at USD 79.35 billion in 2024 and is projected to reach USD 113.89 billion by 2032, registering a CAGR of 4.62% over the forecast period.
- Market growth is driven by rising demand for premium formats such as IMAX, 4DX, and laser projection, along with expanding multiplex infrastructure across urban and semi-urban regions.
- Key trends include diversification into alternative content, technology integration for personalized experiences, and increasing adoption of luxury seating and dine-in cinema formats that enhance per-patron spending.
- The competitive landscape features leading exhibitors such as Cineworld, PVR INOX, Cinepolis, Cinemark, and CJ CGV, supported by ongoing upgrades in projection systems and expansion into high-growth emerging markets.
- Asia-Pacific leads with 34% share, followed by North America at 32% and Europe at 26%, while multiplexes remain the dominant segment, accounting for the highest share due to multi-screen flexibility and premium-format integration.
Market Segmentation Analysis:
By Type:
Multiplexes represent the dominant segment in the movie theatre market, accounting for the largest share due to their extensive screen counts, premium seating formats, and strong integration with shopping and entertainment complexes. Their ability to operate multiple screens under one roof allows for higher show frequency, flexible programming, and efficient allocation of blockbuster and regional releases. IMAX and independent theatres complement the landscape with immersive formats and niche offerings, while drive-in theatres retain relevance in select regions for their experiential appeal. The scalability and operating efficiency of multiplex chains continue to strengthen their competitive edge and market leadership.
- For instance, PVR INOX has deployed more than 1,000 2K and 4K digital projection screens across India, including auditoriums equipped with laser projection systems delivering up to 35,000 lumens for enhanced brightness and contrast.
By Screen:
2D screens hold the largest share in the market, driven by their widespread availability, lower ticket prices, and suitability for both mainstream and regional films. Their lower installation and operating costs make them the preferred choice for large chains and independent operators alike. While 3D screens remain important for action, animation, and high-visual-effects titles, their uptake is more selective and driven by premium pricing strategies. The dominance of 2D screens is further supported by consistent demand across urban and semi-urban areas and their ability to accommodate a broader mix of movie genres and audience preferences.
- For instance, Cineplex Canada operates approximately 1,607 screens nationwide across 155 theatres, utilizing a variety of digital projectors from different manufacturers, including a major ongoing rollout of Barco laser projectors alongside existing technology, which deliver various brightness levels optimized for different screen sizes and premium experiences like 3D, IMAX, and UltraAVX.
By Types of Movies:
Global content dominates the market, capturing the largest share owing to strong box-office performance of international franchises, high marketing visibility, and broad audience appeal. Hollywood and other global releases often secure more screens and longer runs in multiplex chains, reinforcing their commercial advantage. Local content remains critical for regional engagement and contributes significantly in markets with strong domestic film industries, but global blockbusters drive consistent footfall and premium-format demand. The dominance of global content is primarily driven by robust production quality, multi-language releases, and high repeat-viewing potential across diverse audience groups.
Key Growth Drivers:
Rising Demand for Premium and Immersive Cinema Experiences
Premium entertainment formats continue to drive substantial growth in the movie theatre market as consumers increasingly seek elevated and differentiated viewing experiences. The surge in demand for large-format screens, recliner seating, 4DX motion effects, and laser-projection technology has strengthened revenues across leading multiplex chains. Operators are integrating Dolby Atmos sound, IMAX dual-laser systems, and high-dynamic-range screens to deliver exceptional visual and auditory immersion that cannot be easily replicated by home entertainment systems. Premium offerings often command higher ticket prices, longer occupancy rates, and higher per-patron spending at concessions. This shift allows exhibitors to offset rising operational costs while enhancing customer loyalty. The expansion of hybrid entertainment concepts such as luxury dine-in theatres and boutique cinemas further accelerates adoption in urban hubs. As content producers increasingly focus on visually intensive blockbusters, the market benefits from sustained growth in premium-format footfall and differentiated experience-driven demand.
- For instance, CJ 4DPLEX has installed more than 790 global 4DX auditoriums equipped with motion-enabled seats capable of over 21 synchronized environmental effects, including wind blasts.
Expansion of Global Film Content and Strong Franchise Performance
The globalisation of film distribution and the dominance of international franchises significantly accelerate growth in the movie theatre market. Major studios continue to prioritize multi-language releases, synchronized global premiers, and cross-platform promotional strategies that generate strong pre-release momentum and high opening-weekend turnouts. Successful franchises across action, fantasy, and animation categories consistently deliver high revenue cycles for theatres, reinforcing their role as dependable box-office anchors. The increasing collaboration between film studios and cinema operators through early screenings, premium-format premieres, and exclusive content partnerships also boosts foot traffic. Moreover, the rise of global streaming platforms has amplified content discovery, often increasing demand for theatrical viewing of high-anticipation titles. Stronger integration across global film industries enables theatres to expand programming diversity, attract varied audience segments, and maintain consistent show occupancy levels, particularly during peak release windows anchored by major franchise launches.
- For instance, Disney has executed day-and-date global releases across more than 100 international territories for its major franchises, supported by localization workflows capable of producing over 50 language masters per title using its proprietary localization pipeline.
Growing Urbanization and Investments in Theatre Infrastructure
Rapid urbanization, rising disposable incomes, and modernization of entertainment infrastructure form a core growth driver for the global movie theatre industry. Emerging economies continue to witness accelerated multiplex expansion within shopping malls, lifestyle centres, and commercial hubs, increasing accessibility to high-quality cinema experiences. Operators are investing in digital projection upgrades, automated ticketing, energy-efficient lighting, and smart seating layouts to improve operational efficiency and overall theatre ambience. Modern theatres increasingly incorporate experiential zones, gourmet concessions, and social interaction spaces that extend consumer dwell time and diversify revenue streams. Meanwhile, advancements in centralized screen management and digital distribution reduce content delivery costs and support flexible programming across multiple locations. Suburban and semi-urban regions are also seeing rapid theatre penetration, enabled by smaller-format multiplexes tailored to regional audiences. These infrastructure-driven improvements enhance service quality, elevate customer experience, and strengthen long-term market growth prospects.
Key Trends & Opportunities:
Growth of Alternative Content and Non-Movie Programming
Movie theatres are increasingly leveraging non-traditional programming to diversify revenue and attract new audience segments. Live screenings of sports events, concerts, theatrical performances, and cultural festivals have created alternative content opportunities beyond standard movie releases. These formats benefit from high audience engagement, premium pricing potential, and repeat viewership during major global events. The rise of anime films, documentary specials, and limited-release art content also supports niche programming strategies. Partnerships with streaming platforms and concert production houses further open avenues for exclusive theatrical releases. As theatres optimize scheduling flexibility through digital projection, they can allocate screens to high-demand alternative content during peak event cycles. This trend strengthens occupancy rates, balances seasonal demand fluctuations, and enables exhibitors to build multi-genre entertainment portfolios that appeal to diverse consumer groups seeking more than traditional film viewing experiences.
- For instance, Fathom Events one of the largest alternative content distributors streams more than 150 unique live and pre-recorded events annually across over 1,100 theatres in the U.S., enabled through satellite delivery systems capable of transmitting up to 45 Mbps video feeds to participating cinemas.
Technology Integration to Enhance Personalization and Operational Efficiency
Technology-enabled innovation presents significant opportunities for theatres to elevate consumer experience and streamline operations. Mobile ticketing, AI-based audience analytics, and dynamic pricing strategies allow operators to tailor promotions, optimize seat inventory, and push personalized offers based on viewing preferences. Digital loyalty programs and app-based gamification strengthen customer engagement and encourage repeat visits. Behind the scenes, cloud-based content delivery, automated screening systems, and centralized show management reduce operational complexity and enable faster programming adjustments. The integration of digital advertising networks also creates new revenue streams through targeted on-screen marketing. As theatres adopt data-driven decision-making, they can improve concession planning, reduce energy consumption, and enhance staffing efficiencies. Together, these innovations create ample opportunities for operators to strengthen profitability while delivering seamless, personalized entertainment experiences.
For instance, National CineMedia (NCM) Media Network serves approximately 18,000 screens with programmatic ad delivery using a centralized content hub that distributes cinema-ready ads encoded at high bitrates for large-format playback.
Key Challenges:
Competition from Streaming Platforms and At-Home Entertainment
The proliferation of streaming services continues to pose a substantial challenge to the theatrical industry as consumers gain easy access to large content libraries from home. The convenience of on-demand viewing, bundled subscription pricing, and high-quality home entertainment systems including 4K televisions and surround-sound setups have raised expectations for cinematic experiences. Some studios are also experimenting with shortened theatrical windows or hybrid releases, reducing the exclusivity advantage traditionally enjoyed by theatres. This shift forces exhibitors to continually enhance experiential value, invest in premium infrastructure, and differentiate offerings to maintain footfall. Balancing programming strategies for niche, regional, and blockbuster content further complicates efforts to compete effectively with digital platforms operating at global scale.
High Operational Costs and Sensitivity to Economic Volatility
Movie theatres face persistent cost pressures related to real estate, staffing, technology upgrades, and energy consumption. Premium-format screens, recliner seating, and laser projection deliver strong revenue potential but require substantial upfront investment and ongoing maintenance. Concession operations and in-theatre services also demand high logistics efficiency to sustain margins. Economic downturns, fluctuating consumer spending, and rising inflation directly impact ticket sales and discretionary entertainment visits. Moreover, theatres must continuously renegotiate revenue-sharing agreements with studios while managing unpredictable release schedules that can create demand gaps. These financial vulnerabilities challenge operators to maintain profitability, optimize operating models, and adopt cost-efficient technologies without compromising customer experience.
Regional Analysis:
North America
North America holds around 32% of the global movie theatre market, supported by mature multiplex chains, high per-capita entertainment spending, and strong demand for premium large formats such as IMAX and Dolby Cinema. The region benefits from consistent box-office performance of Hollywood franchises, which secure extensive screen allocations and drive recurring footfall. Ongoing investments in luxury recliner seating, dine-in formats, and immersive projections enhance customer experience and sustain stable occupancy rates. The U.S. market leads regional performance, while Canada maintains steady growth through modernized mid-sized theatres focused on diversified programming.
Europe
Europe accounts for roughly 26% of global market share, driven by well-established cinema networks, strong domestic film industries, and widespread adoption of digital projection technologies. Western European countries particularly the UK, France, and Germany lead the region with high screen density and continued upgrades toward premium formats. The expansion of boutique cinemas and experiential concepts, including luxury seating and curated film events, supports audience engagement. Eastern Europe contributes steady growth through emerging multiplex infrastructure and increasing international content penetration. The region’s diverse cultural preferences enable sustained demand for both global blockbusters and regional-language productions.
Asia-Pacific
Asia-Pacific holds the largest share at approximately 34%, driven by rapid urbanization, rising disposable incomes, and aggressive multiplex expansion across China, India, and Southeast Asia. China’s high-volume box-office output and India’s strong regional and Bollywood industries create a robust content ecosystem that fuels high theatre utilization. Major exhibitors invest heavily in IMAX, 4DX, and laser projection to meet rising demand for premium experiences. The region also benefits from a young demographic base, high cinema visitation frequency, and growing penetration into tier-2 and tier-3 cities, making it the fastest-growing contributor to global theatrical revenues.
Latin America
Latin America represents around 5% of the global market, supported by growing multiplex investments, expanding shopping mall infrastructure, and rising preference for international cinema releases. Countries such as Brazil, Mexico, and Argentina anchor regional performance with strong attendance for global franchises and selective domestic successes. Economic volatility and currency fluctuations influence ticket affordability, but operators continue to modernize theatres with recliner seating, digital screens, and improved concessions to enhance value. Expanding middle-class consumption and increasing regional content production gradually strengthen the region’s long-term growth potential.
Middle East & Africa
The Middle East & Africa region holds roughly 3% of global market share, with growth concentrated in the Gulf Cooperation Council (GCC) countries due to rapid entertainment infrastructure development. Saudi Arabia, following cinema liberalization, experiences significant screen additions and premium-format adoption, making it one of the fastest-expanding submarkets. The UAE and Qatar maintain strong performance through luxury cinema offerings, including dine-in concepts and IMAX screens. Africa’s growth is slower but supported by emerging multiplex chains in South Africa, Nigeria, and Kenya. Increasing urbanization and lifestyle-centric retail expansion continue to shape regional opportunities.
Market Segmentations:
By Type
- Multiplexes
- IMAX
- Drive-in
- Independent
By Screen
- 2D screen
- 3D screen
By Types of Movies
- Local content
- Global content
By Geography
- North America
- U.S.
- Canada
- Mexico
- Europe
- Germany
- France
- U.K.
- Italy
- Spain
- Rest of Europe
- Asia Pacific
- China
- Japan
- India
- South Korea
- South-east Asia
- Rest of Asia Pacific
- Latin America
- Brazil
- Argentina
- Rest of Latin America
- Middle East & Africa
- GCC Countries
- South Africa
- Rest of the Middle East and Africa
Competitive Landscape:
The movie theatre market is characterized by a highly competitive landscape dominated by global multiplex chains, premium large-format technology providers, and regionally strong independent exhibitors. Leading operators focus on expanding screen networks, enhancing premium experiences, and integrating advanced projection technologies such as laser systems, IMAX formats, and Dolby Atmos sound to differentiate offerings. Strategic partnerships with film studios for early screenings and exclusive premieres strengthen audience retention and drive higher occupancy rates. Consolidation remains a key trend as major players acquire smaller chains to widen market presence and optimize operating efficiencies. Luxury seating upgrades, dine-in cinema models, and digital loyalty programs further intensify competition by elevating customer engagement and increasing per-patron spending. Regional exhibitors remain competitive through localized content strategies and cost-efficient theatre formats tailored to neighborhood demographics. As technological innovation accelerates, operators increasingly invest in automation, digital ticketing, and targeted marketing to sustain profitability and defend market share.
Key Player Analysis:
- Cineworld
- PVR INOX
- B&B Theatres
- Cinepolis
- CJ CGV
- Cinemex
- Odeon Cinemas
- Cinemark
- Cineplex
- CGR Cinemas
Recent Developments:
- In 20 November 2025, PVR INOX declared its plan to add 100 new screens in FY26, including entering tier-III markets and targeting ticket pricing of INR 150-200, while reviewing closure of 10-15 underperforming screens.
- In July 2024 Cineworld announced the closure of six UK cinemas (Glasgow Parkhead, Bedford, Hinckley, Loughborough, Yate and Swindon – Regent Circus) as part of a cost-cutting and restructuring drive.
- In 12 June 2025, B&B Theatres announced the construction of a luxury 7-screen cinema in Joplin, Missouri (at 32nd Street & Hammons Boulevard) scheduled for grand opening late August 2025.
Report Coverage:
The research report offers an in-depth analysis based on Type, Screen, Types of movies and Geography. It details leading market players, providing an overview of their business, product offerings, investments, revenue streams, and key applications. Additionally, the report includes insights into the competitive environment, SWOT analysis, current market trends, as well as the primary drivers and constraints. Furthermore, it discusses various factors that have driven market expansion in recent years. The report also explores market dynamics, regulatory scenarios, and technological advancements that are shaping the industry. It assesses the impact of external factors and global economic changes on market growth. Lastly, it provides strategic recommendations for new entrants and established companies to navigate the complexities of the market.
Future Outlook:
- The industry will continue shifting toward premium large formats and immersive technologies to strengthen theatrical differentiation.
- Multiplex operators will expand luxury seating, dine-in service, and experiential zones to increase per-patron spending.
- Global franchise films will maintain strong box-office momentum, supporting consistent occupancy across major regions.
- Alternative content such as concerts, sports, and anime releases will broaden audience segments and stabilize off-peak demand.
- Digital ticketing, dynamic pricing, and AI-driven personalization will further optimize admissions and customer engagement.
- Theatre chains will expand into emerging urban and semi-urban markets with compact multiplex formats.
- Partnerships between studios and exhibitors will deepen, enabling exclusive screenings and event-based releases.
- Sustainability initiatives, including energy-efficient projection and reduced waste operations, will become more common.
- Strategic consolidation among major cinema operators will strengthen competitive positioning and scale advantages.
- Regional content diversification will increase, supporting stronger performance in Asia-Pacific, Latin America, and local-language markets.
Request a Free Sample
Fill in your details and we'll send you a free sample report.
- Sample data tables & charts
- Research methodology
Need a Custom Version of This Report?
Tailor the scope, geography, or segments to your exact requirements.
- Custom geography or segment scope
- Direct access to our analyst team
Frequently Asked Questions
What is the current market size for the movie theatre market, and what is its projected size in 2032?
At what Compound Annual Growth Rate is the movie theatre market projected to grow between 2024 and 2032?
Which movie theatre segment held the largest share in 2024?
What are the primary factors fueling the growth of the movie theatre market?
Who are the leading companies in the movie theatre market?
Which region commanded the largest share of the movie theatre market in 2024?
Table of Content
Chapter 1. Report Introduction
- 1.1 Report Description & Purpose
- 1.1.1 Report Title & Market Definition
- 1.1.2 Unique Selling Propositions (USP) & Key Differentiators
- 1.1.3 Value Proposition for Stakeholders
- 1.2 Research Objectives
- 1.2.1 Market Sizing Objectives (Volume & Revenue)
- 1.2.2 Segmentation Objectives
- 1.2.3 Competitive Intelligence Objectives
- 1.2.4 Forecast & Scenario Objectives
- 1.3 Report Scope
- 1.3.1 Movie Theatre Scope – Types & Subtypes Covered
- 1.3.2 Geographic Scope – Regions & Countries Covered
- 1.3.3 Historical Period, Base Year & Forecast Period (2024; forecast to 2032)
- 1.3.4 Inclusions & Exclusions
- 1.4 HS Code & Classification Framework
- 1.5 Currency, Units & Pricing Basis
- 1.6 Target Stakeholders
- 1.7 Limitations & Assumptions
Chapter 2. Executive Summary
- 2.1 Global Movie Theatre Market Snapshot
- 2.1.1 Market Size – Historical (2024) & Forecast (2024-2032) (2024: USD 79.35 billion → 2032: USD 113.89 billion)
- 2.1.2 Volume & Revenue – Global Totals
- 2.1.3 Key Market Highlights – Top Five Facts
- 2.2 Movie Theatre Market Segmentation Snapshot
- 2.2.1 Market Split by Region – 2024 vs. 2032
- 2.3 Competitive Snapshot
- 2.3.1 Top 10 Players by Revenue Share – 2024
- 2.3.2 Top 10 Players by Volume Share – 2024
- 2.3.3 Recent Strategic Developments (18-Month Summary)
- 2.4 Key Investment Highlights & Strategic Conclusions
Chapter 3. Movie Theatre Market Dynamics & Industry Analysis
- 3.1 Market Overview & Context
- 3.1.1 Movie Theatre Market Position in the Broader Automotive Value Chain
- 3.1.2 OEM vs. Replacement Market Dynamics
- 3.1.3 Market Maturity & Development Stage by Region
- 3.2 Movie Theatre Market Drivers
- 3.3 Movie Theatre Market Restraints & Challenges
- 3.4 Movie Theatre Market Opportunities
- 3.5 Porter's Five Forces Analysis
- 3.5.1 Threat of New Entrants
- 3.5.2 Bargaining Power of Suppliers
- 3.5.3 Bargaining Power of Buyers
- 3.5.4 Threat of Substitutes
- 3.5.5 Competitive Rivalry – Intensity Assessment
- 3.6 Movie Theatre Value Chain Analysis
- 3.6.1 Upstream – Raw Material/Input Suppliers
- 3.6.1.1 Raw Material/Input 1
- 3.6.1.2 Raw Material/Input 2
- 3.6.1.3 Raw Material/Input 3
- 3.6.2 Midstream – Production/Manufacturing/Service Delivery
- 3.6.2.1 Production/Process Overview
- 3.6.2.2 Key Facility Locations & Capacity by Manufacturer
- 3.6.3 Downstream – Distribution & End Consumer
- 3.6.3.1 Primary Channel – B2B/OEM
- 3.6.3.2 Secondary Channels – Dealer, Retail, Online, Direct
- 3.6.4 Value Chain Profitability Analysis
- 3.6.1 Upstream – Raw Material/Input Suppliers
- 3.7 PESTEL Analysis
- 3.7.1 Political Factors
- 3.7.2 Economic Factors
- 3.7.3 Social Factors
- 3.7.4 Technological Factors
- 3.7.5 Environmental Factors
- 3.7.6 Legal Factors
- 3.8 Movie Theatre Supply Chain Analysis
- 3.8.1 Raw Material/Input Supply Risk Assessment
- 3.8.2 Manufacturing Concentration Risk (Geographic Exposure)
- 3.8.3 Trade Disruption Impact Analysis
- 3.9 Regulatory & Policy Landscape
Note: The regulatory and policy landscape section covers regulations based on their applicability to the market, Movie Theatre category, geography, and scope of the study. Only regulatory frameworks with a material impact on operations, compliance, trade, sustainability, or market access are analyzed in detail.
Chapter 4. Key Investment Pockets & Opportunity Analysis
- 4.1 Movie Theatre Market Attractiveness Analysis
- 4.1.1 By Region – Investment Attractiveness Matrix (Volume × CAGR)
- 4.2 Absolute Revenue Growth Opportunity
- 4.2.1 By Region – Absolute USD Growth Through 2032
- 4.3 Incremental Volume Opportunity
- 4.3.1 By Region – Incremental Volume Through 2032
- 4.3.2 Segment – Incremental Volume
- 4.4 Emerging Submarket Opportunity Deep Dive (Subject to Applicability)
- 4.5 Emerging Market Opportunity Scorecards
- 4.5.1 United States
- 4.5.2 Europe
- 4.5.3 Asia
- 4.5.4 Middle East & Africa
Note: Emerging Market Opportunity Scorecards will be included based on relevance and strategic importance. Regions listed are indicative and may vary depending on data availability and market dynamics.
Chapter 5. Movie Theatre Import-Export Analysis & Trade Flows
- 5.1 Global Trade Overview
- 5.1.1 Global Export Value by Country (2024)
- 5.1.2 Global Export Volume by Country (2024)
- 5.1.3 Global Import Value by Country (2024)
- 5.1.4 Global Import Volume by Country (2024)
- 5.1.5 Net Trade Balance by Country (2024)
- 5.2 Export Analysis – Segment
- 5.2.1 Type 1 (HS Code)
- 5.2.2 Type 2 (HS Code)
- 5.2.3 Type 3 (HS Code)
- 5.2.4 Type 4 (HS Code)
- 5.2.5 Type 5 (HS Code)
- 5.3 Import Analysis – Segment
- 5.3.1 Type 1 (HS Code)
- 5.3.2 Type 2 (HS Code)
- 5.3.3 Type 3 (HS Code)
- 5.3.4 Type 4 (HS Code)
- 5.3.5 Type 5 (HS Code)
- 5.4 Average Unit Trade Prices
- 5.4.1 Average Export Price – Segment & Country
- 5.4.2 Average Import Price – Segment & Source Country
- 5.4.3 Price Trends (2024)
- 5.5 Key Trade Route Analysis
- 5.5.1 Trade Route 1
- 5.5.2 Trade Route 2
- 5.5.3 Trade Route 3
- 5.5.4 Trade Route 4
- 5.5.5 Trade Route 5
- 5.6 Trade Policy Impact Assessment
- 5.6.1 US Anti-Dumping & Section 301 Tariffs
- 5.6.2 EU Customs Union Impact
- 5.6.3 Major Free Trade Agreements
- 5.6.4 USMCA Rules of Origin
Note: Trade policy analysis will be included only where relevant to the Movie Theatre market.
Chapter 6. Competitive Landscape & Company Benchmarking
- 6.1 Movie Theatre Market Concentration & Structure
- 6.1.1 Herfindahl-Hirschman Index (HHI) – vs. 2024
- 6.1.2 Tier 1, Tier 2 & Tier 3 Market Structure
- 6.1.3 Global, Regional & Local Player Dynamics
- 6.2 Movie Theatre Market Share Analysis – 2024
- 6.2.1 Global Revenue Share by Company
- 6.2.2 Global Volume Share by Company
- 6.2.3 Regional Revenue Share
- 6.2.4 Market Share Evolution ( vs. 2024)
- 6.2.5 OEM Segment Share by Company
- 6.2.6 Replacement Segment Share by Company
- 6.3 Production/Delivery Capacity & Facility Analysis
- 6.3.1 Global Installed Capacity
- 6.3.2 Capacity Utilization Rates
- 6.3.3 Production/Output Volume
- 6.3.4 Facility Locations & Capacity Map
- 6.3.5 Planned Capacity Additions
- 6.4 Movie Theatre Competitive Benchmarking Matrix
- 6.4.1 Revenue, Volume, CAGR & Profitability Comparison
- 6.4.2 Channel Revenue Mix
- 6.4.3 Geographic Revenue Exposure
- 6.4.4 R&D Intensity
- 6.4.5 Sustainability Maturity
- 6.5 Strategic Developments in Movie Theatre (Last 24 Months)
- 6.5.1 Mergers, Acquisitions & Divestments
- 6.5.2 New Movie Theatre Launches
- 6.5.3 Facility Expansions
- 6.5.4 Strategic Alliances, Joint Ventures & Partnerships
- 6.5.5 Distribution Expansion & Market Entry
- 6.5.6 Sustainability & ESG Initiatives
- 6.6 Competitive Strategy Mapping
- 6.6.1 Leader, Challenger, Follower & Niche Classification
- 6.6.2 Pricing Strategy Comparison
- 6.6.3 Channel Strategy Matrix
Note: Strategic developments are included based on their materiality and the availability of reliable information.
Chapter 7. Global Movie Theatre Market – By Distribution Channel
- 7.1 Segment Overview
- 7.1.1 Volume & Revenue Split by Channel (2024 & 2032)
- 7.1.2 Channel Mix Evolution (2024-2032)
Chapter 8. Regional Market Analysis – Global Overview
- 8.1 Global Regional Overview
- 8.1.1 Regional Volume Share
- 8.1.2 Regional Revenue Share
- 8.1.3 Regional Volume by Region
- 8.1.4 Regional Revenue by Region
- 8.1.5 Regional Forecast Through 2032
- 8.2 Cross-Regional Segment Analysis
- 8.2.1 By Distribution Channel
- 8.2.2 By Brand/Price Tier
Chapter 9. North America Movie Theatre Market
- 9.1 United States
- 9.2 Canada
- 9.3 Mexico
Chapter 10. Europe Movie Theatre Market
- 10.1 Germany
- 10.2 France
- 10.3 Italy
- 10.4 United Kingdom
- 10.5 Spain
- 10.6 Poland
- 10.7 Russia
- 10.8 Netherlands
- 10.9 Belgium
- 10.10 Sweden
- 10.11 Denmark
- 10.12 Norway
- 10.13 Rest of Europe
Chapter 11. Asia Pacific Movie Theatre Market
- 11.1 China
- 11.2 India
- 11.3 Japan
- 11.4 South Korea
- 11.5 Thailand
- 11.6 Indonesia
- 11.7 Vietnam
- 11.8 Malaysia
- 11.9 Australia
- 11.10 Rest of Asia Pacific
Chapter 12. Latin America Movie Theatre Market
- 12.1 Brazil
- 12.2 Argentina
- 12.3 Colombia
- 12.4 Chile
- 12.5 Rest of Latin America
Chapter 13. Middle East Movie Theatre Market
- 13.1 Saudi Arabia
- 13.2 United Arab Emirates
- 13.3 Turkey
- 13.4 Israel
- 13.5 Iran
- 13.6 Rest of the Middle East
Chapter 14. Africa Movie Theatre Market
- 14.1 South Africa
- 14.2 Egypt
- 14.3 Nigeria
- 14.4 Morocco
- 14.5 Rest of Africa
Chapter 15. Movie Theatre Company Profiles
- 15.1 [Company 01]
- 15.1.1 Company Overview
- 15.1.2 Key Management Personnel
- 15.1.3 Products & Services Portfolio
- 15.1.4 Financial Performance
- 15.1.5 Key Market Focus & Geographic Presence
- 15.1.6 Recent Developments & Strategic Initiatives
Note: The company profile list is preliminary and may change based on research findings, market developments, data availability, and client requirements.
Chapter 16. Appendices
- Appendix A – List of Abbreviations & Acronyms
- Appendix B – Industry Classification Code Reference – Full Series
- Appendix C – Production & Capacity Data Tables
- Appendix D – End-Use & Demand Base Tables
- Appendix E – Consumption & Replacement Rate Assumptions
- Appendix F – ASP Reference Tables
- Appendix G – Manufacturing & Facility Database
- Appendix H – Import-Export Data Tables
- Appendix I – Regulatory Summary Tables
- Appendix J – Primary Research Participant List (Anonymized)
- Appendix K – Primary Research Questionnaire Framework
- Appendix L – Data Sources & Bibliography
- Appendix M – Market Size Divergence & Source Comparison
Chapter 17. Research Methodology
- 17.1 Research Framework & Philosophy
- 17.2 Secondary Research – Sources, Hierarchy & Data Extraction
- 17.3 Data Modeling – Bottom-Up & Top-Down Market Sizing
- 17.4 Primary Research – Stakeholder Framework, LOI & Sample Sizes
- 17.5 Forecast Methodology – Regression, Scenario & Sensitivity Analysis
- 17.6 Quality Control – Four-Layer Validation Framework
- 17.7 Limitations & Standard Assumptions
- 17.8 Disclaimer
