
Market Overview:
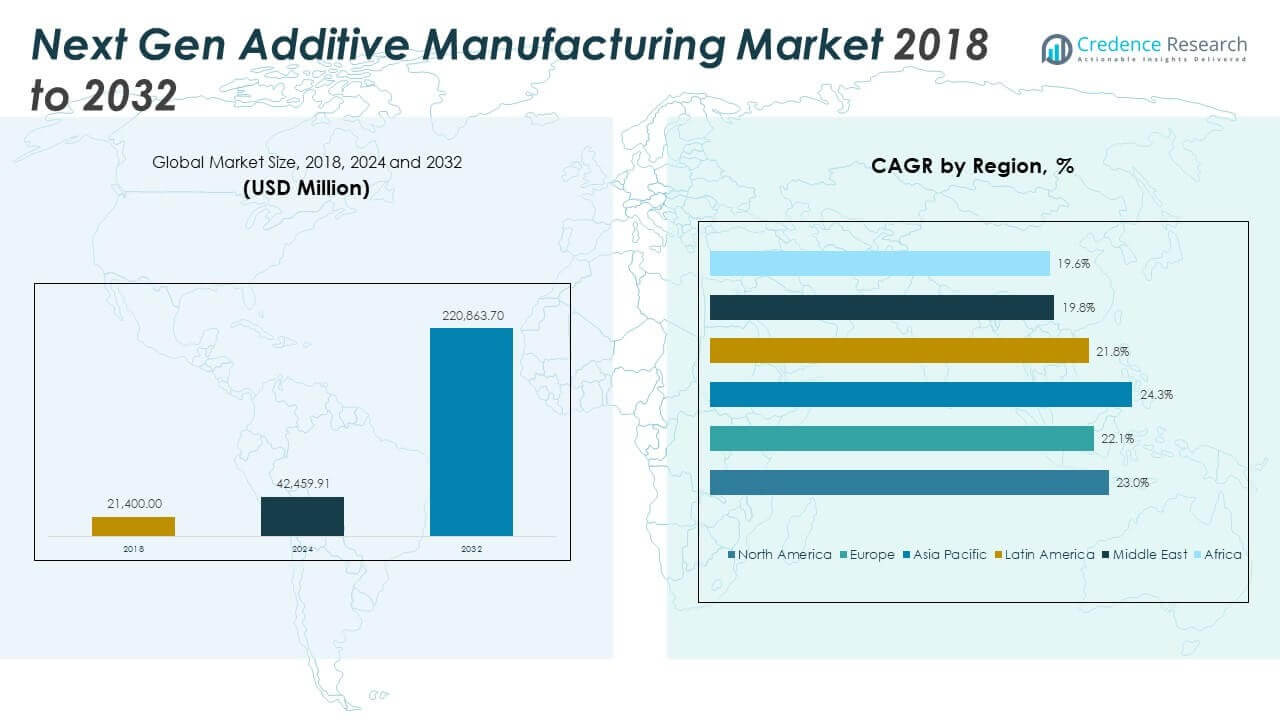
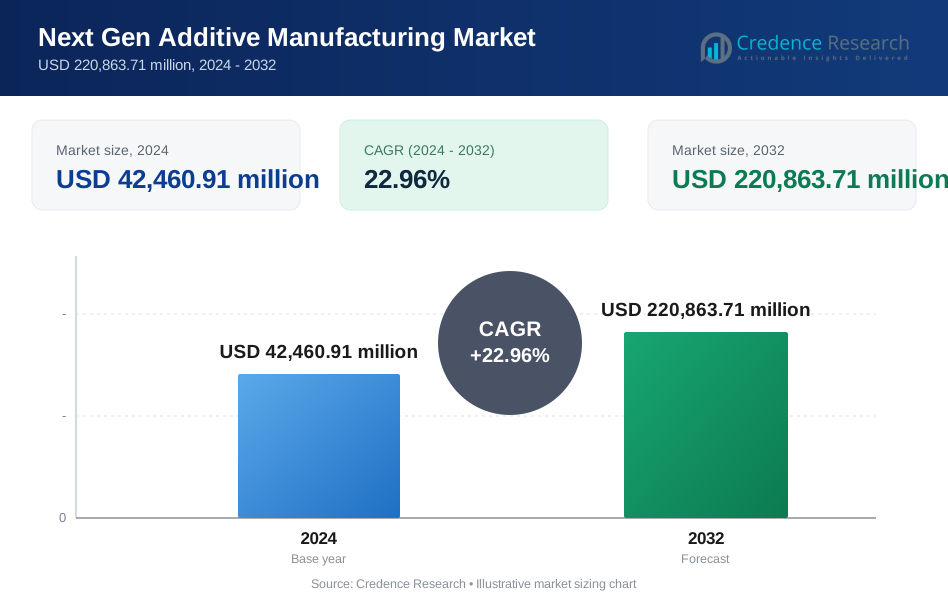
The Next Gen Additive Manufacturing Market size was valued at USD 21,400.00 million in 2018 to USD 42,459.91 million in 2024 and is anticipated to reach USD 220,863.70 million by 2032, at a CAGR of 22.96% during the forecast period.
| REPORT ATTRIBUTE | DETAILS |
|---|---|
| Historical Period | 2020-2023 |
| Base Year | 2024 |
| Forecast Period | 2025-2032 |
| Next Gen Additive Manufacturing Market Size 2024 | USD 42,459.91 million |
| Next Gen Additive Manufacturing Market, CAGR | 22.96% |
| Next Gen Additive Manufacturing Market Size 2032 | USD 220,863.70 million |
The market is expanding due to increased demand for on-demand production, complex part design, and reduced supply chain dependence. Aerospace, automotive, and healthcare sectors drive innovation by integrating advanced 3D printing for lightweight structures, patient-specific devices, and custom tooling. Improved material availability, growing preference for decentralized manufacturing, and software advancements further support rapid adoption across production stages. Enterprises are shifting from prototyping to low-volume and mass-customized manufacturing models to gain agility and reduce waste.
North America leads in adoption due to strong industrial infrastructure, innovation funding, and major aerospace programs. Europe follows with advanced automotive and healthcare integration supported by leading equipment manufacturers. Asia Pacific is emerging fast, driven by rapid industrialization in China, Japan, and India, alongside government initiatives promoting local production. Latin America, the Middle East, and Africa show early-stage growth with rising investments, but infrastructure and skill gaps still limit broader deployment.
Market Insights:
- The Next Gen Additive Manufacturing Market was valued at USD 21,400.00 million in 2018, reached USD 42,459.91 million in 2024, and is projected to hit USD 220,863.70 million by 2032, expanding at a CAGR of 22.96%.
- North America leads the market with a 30.6% share in 2024, followed by Asia Pacific at 23.9% and Europe at 21.5%, driven by early industrial adoption, advanced R&D, and strong investments in aerospace, automotive, and medical sectors.
- Asia Pacific is the fastest-growing region with a CAGR of 24.3%, supported by government-led manufacturing initiatives, industrial digitalization, and rising adoption across electronics and healthcare industries.
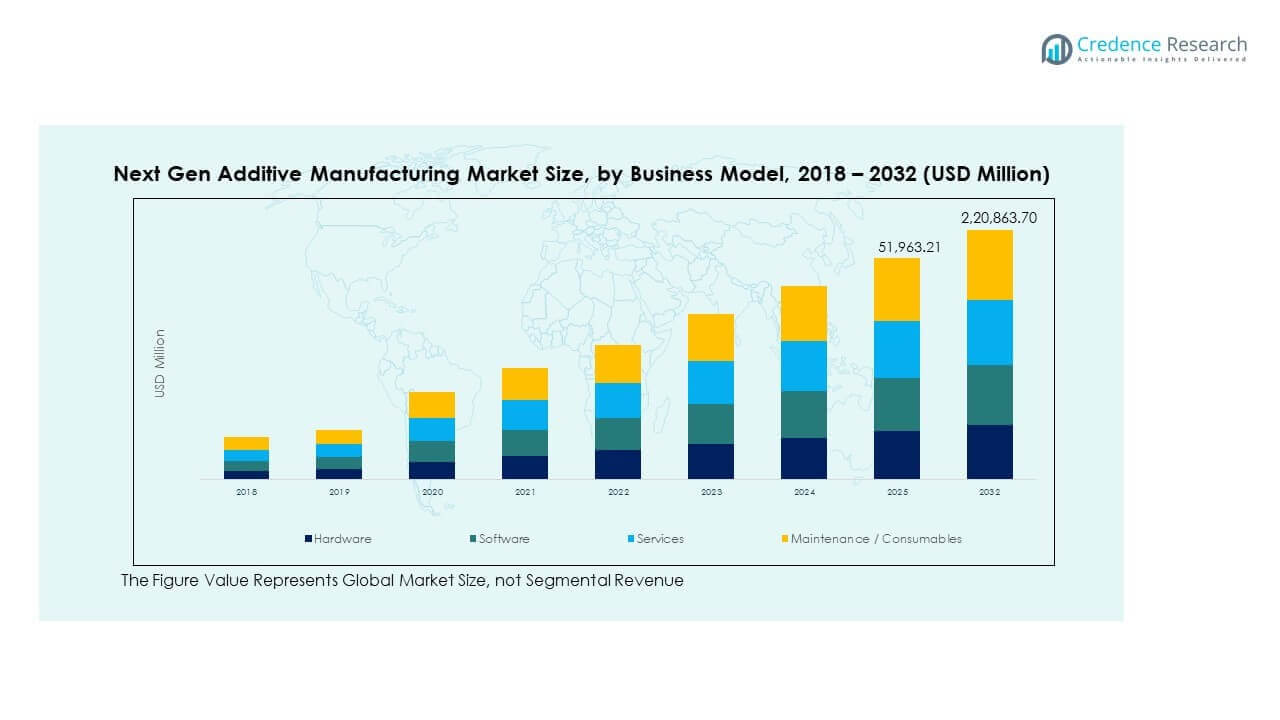
- In 2024, hardware accounted for the largest revenue share among business models, driven by the rising installation of metal and polymer-based 3D printing systems in production environments.
- Software and services segments show steady growth, supported by demand for print optimization, process monitoring, and scalable AM workflow integration across mid-sized enterprises and OEMs.
Market Drivers
Wider Industrial Shift Toward Agile and On-Demand Production Models
Manufacturers are under pressure to deliver faster and more flexibly. Traditional supply chains often fail under demand spikes or geopolitical disruptions. Additive manufacturing allows decentralized production and short lead times. This shift reduces overstocking and dependence on single-source suppliers. In the [Next Gen Additive Manufacturing Market], firms deploy systems to bring production closer to consumption. Sectors like automotive and aerospace push to localize part manufacturing. This approach supports mass customization and small-batch production at scale. Industries now view 3D printing as a core tool, not a prototyping step. On-demand production creates structural demand for additive platforms.
- For instance, BAE Systems reduced lead times and costs for prototyping, aircraft tooling, and production parts like Typhoon fighter cockpit floor covers using four Stratasys F900 industrial 3D printers in their Factory of the Future program.
Increased Use of Complex, Lightweight, and Functional Designs Across Sectors
Design engineers seek parts with improved strength-to-weight ratios and functionality. Conventional subtractive methods limit design freedom. Additive manufacturing unlocks internal lattices, cooling channels, and bio-mimicry structures. The [Next Gen Additive Manufacturing Market] benefits from growing demand for parts that are lighter and smarter. Medical implants now mirror organic structures for better integration. Aerospace companies redesign parts to combine multiple components into one. Structural optimization leads to weight savings and reduced material use. Generative design software expands what engineers can create. These benefits justify growing investment in advanced AM systems.
Demand Growth for High-Performance Materials Compatible With 3D Printing
Material science innovations play a central role in expanding 3D printing use cases. Aerospace, defense, and medical users demand high strength, corrosion resistance, or biocompatibility. New powder alloys and composites support tougher specifications. The [Next Gen Additive Manufacturing Market] expands with each new qualified material. Producers now offer titanium, nickel alloys, PEEK, and carbon-fiber-infused thermoplastics. These high-value materials drive margin expansion for suppliers. Qualification processes now cover certification for flight- and implant-ready components. Firms compete on faster print speeds and material compatibility. The market continues shifting from generic polymers to specialty-grade feedstocks.
- For instance, Lockheed Martin qualified Antero 840CN03 material on Stratasys F900 printers by printing over 280 test coupons to validate flight-ready aerospace parts for Orion spacecraft applications.
Integration of Additive Manufacturing Into Existing Digital Manufacturing Ecosystems
Companies aim to connect additive machines with digital twins, MES, and PLM systems. This shift enables real-time monitoring, error reduction, and part traceability. The [Next Gen Additive Manufacturing Market] supports end-to-end workflow optimization. Software tools now simulate print outcomes before production. This reduces material waste and rework. Machine learning supports automated print parameter adjustment. Integration helps firms scale from prototype to serial production. It enables predictive maintenance and production planning. This level of integration appeals to enterprise-level adopters seeking ROI.
Market Trends
Adoption of Binder Jetting and Directed Energy Deposition for Large-Scale Applications
Industries require faster production of larger, structurally strong parts. Binder jetting and directed energy deposition offer faster throughput than traditional laser fusion. The [Next Gen Additive Manufacturing Market] shifts toward these methods for tooling, castings, and large structural components. Energy and aerospace firms adopt these for blades, casings, and housings. Machines now support multi-meter build envelopes and faster deposition rates. These trends favor heavy industries aiming to reduce turnaround times. Printhead and laser control systems grow more advanced. These technologies gain share in capital-intensive manufacturing settings.
Hybrid Manufacturing Systems Combining Additive and Subtractive Methods on One Platform
Machines that combine 3D printing and CNC milling now offer improved surface finishes and tolerances. Hybrid setups allow users to build and finish parts in one setup. The [Next Gen Additive Manufacturing Market] sees increasing deployment of these multi-process platforms. Aerospace and mold-making sectors lead adoption due to tight specifications. These machines reduce labor costs and repositioning errors. Toolpath software enables synchronized additive and subtractive operations. Manufacturers benefit from better geometrical accuracy and reduced post-processing. Hybrid AM lowers the barriers for production-grade output. It supports use of hard-to-machine materials as well.
- For instance, DMG Mori’s LASERTEC 65 3D hybrid machine combines laser metal deposition with 5-axis milling, enabling near-net shape production and high-precision finishing. The system achieves surface finishes as fine as 4 µm Ra through its subtractive milling operations within the same setup.
Growing Demand for Multi-Material and Multi-Color Additive Manufacturing
Industries now explore multi-material applications in electronics, consumer products, and wearables. Printers capable of depositing polymers, metals, and conductive inks in one build gain traction. The [Next Gen Additive Manufacturing Market] responds with machines that handle multiple print heads and cartridges. This enables embedded electronics, sensors, or color gradients in single parts. Medical device manufacturers print soft and rigid tissues in one operation. R&D centers explore bio-printing with live cell-laden hydrogels and support scaffolds. Multi-color printing enhances consumer product personalization. Software advances in slicing and print scheduling improve output control.
- For instance, the Stratasys J850 Digital Anatomy Printer supports up to 8 base materials and delivers over 500,000 color combinations within a 490 × 390 × 200 mm build volume, enabling the production of highly realistic, multi-material medical models.
Surge in Cloud-Connected AM Platforms and Remote Print Management Tools
Enterprise users demand fleet management, remote monitoring, and process standardization. Cloud platforms now manage multiple AM systems across global locations. The [Next Gen Additive Manufacturing Market] benefits from software-defined workflows and data integration. Operators can start, pause, or optimize prints remotely. Cloud-based AI recommends parameter changes for better yield. These systems track material use, uptime, and defect rates. Companies gain visibility across operations and reduce downtime. Vendors add cybersecurity and access control layers to protect IP. This trend supports enterprise scalability and ROI tracking.
Market Challenges Analysis
High Equipment Costs and Limited ROI Across Certain Industry Segments Remain Major Barriers
Advanced additive systems still demand high capital expenditure. Metal 3D printers, in particular, cost significantly more than traditional machines. The [Next Gen Additive Manufacturing Market] faces adoption hurdles in small and mid-sized enterprises. Many firms struggle to justify investment without full production integration. Maintenance, material waste, and certification costs further raise total ownership cost. ROI varies by sector, and payback often takes multiple years. Applications like tooling or short-run production offer limited economic benefits. Firms also face challenges in hiring skilled operators and technicians. These limitations reduce mass adoption outside aerospace and defense.
Lack of Standardization and Qualification Protocols Slows Industrial-Scale Adoption
Certifications for additive-manufactured parts are not harmonized across regions. Standards vary by industry, material, and printing method. The [Next Gen Additive Manufacturing Market] lacks unified testing frameworks for strength, fatigue, or thermal resistance. Regulatory bodies move slowly on approving new material-process combinations. Qualification for critical applications like implants or turbine parts takes years. Companies must develop in-house testing protocols or partner with certified labs. This raises costs and delays market entry. Equipment vendors often offer proprietary formats, reducing interoperability across platforms.
Market Opportunities
Rising Demand from Aerospace, Defense, and Space Sectors to Drive Adoption of Metal AM
Aerospace and defense require lightweight, complex components with high performance. Space missions rely on topology-optimized parts with minimal mass. The [Next Gen Additive Manufacturing Market] can meet these demands using metal AM technologies. Titanium, Inconel, and aluminum alloys see rising demand. Defense OEMs adopt 3D printing for rapid prototyping and low-rate production. Space firms print satellite brackets, thruster nozzles, and fuel tanks. Governments fund AM programs for national security and manufacturing independence.
Growing Role in Mass Customization and Personalized Production Across Healthcare and Consumer Goods
Consumer demand for custom-fit and unique products continues to rise. Hearing aids, dental aligners, and prosthetics rely on patient-specific designs. The [Next Gen Additive Manufacturing Market] enables scalable personalization. Consumer brands use 3D printing for custom phone cases, eyewear, and shoes. Software tools now automate scan-to-print workflows. This supports high-volume personalization with minimal manual intervention. It opens opportunities in fashion, sports, and lifestyle markets.
Market Segmentation Analysis:
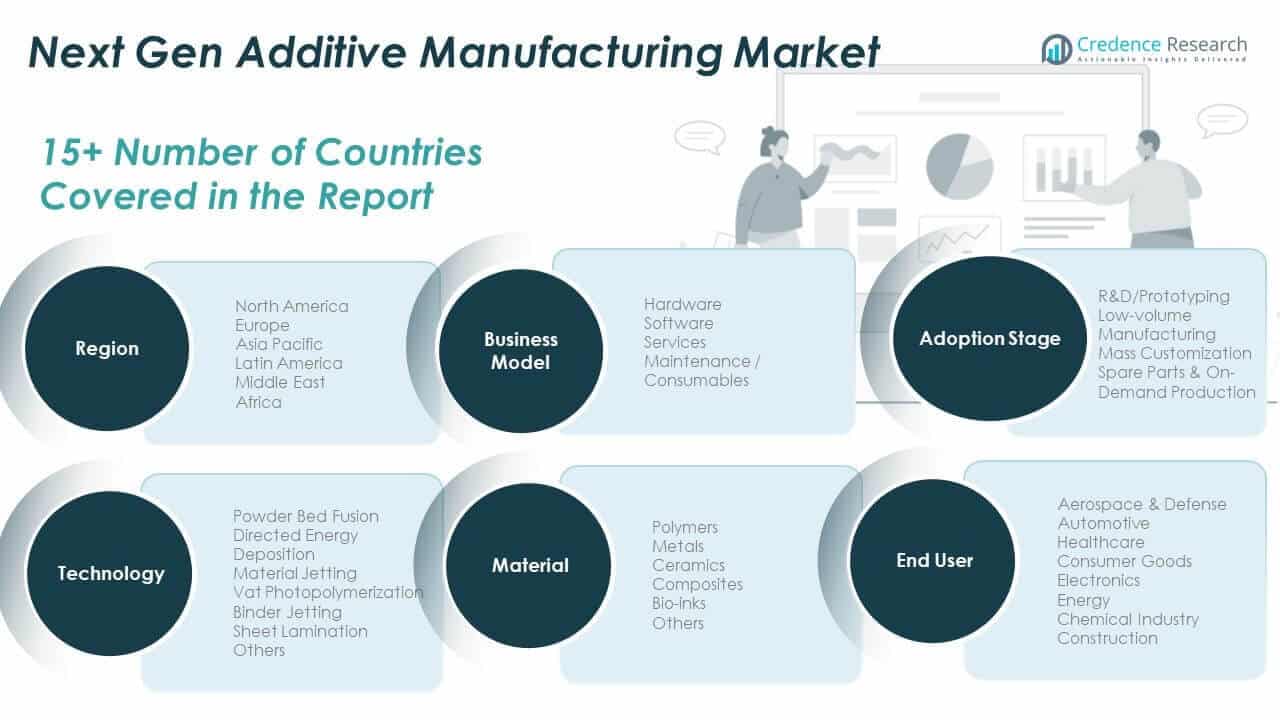
The Next Gen Additive Manufacturing Market shows strong momentum across five core segmentation axes.
By business model, hardware holds the largest share due to high-cost capital equipment purchases, while software gains traction with simulation and print optimization tools. Services and maintenance segments grow with rising outsourcing and lifecycle support demand.
- For instance, GE Additive’s ATLAS system produced a one-meter-diameter turbine center frame casing in nickel alloy 718, consolidating over 150 parts into one, achieving a 30% weight reduction, and cutting lead time from 9 months to 2.5 months.
By adoption stage, R&D and prototyping remain foundational, but low-volume manufacturing and mass customization see faster growth. On-demand production of spare parts expands in aerospace and heavy industries due to supply chain constraints.
- For instance, Materialise 3D printed a titanium aerospace component at its Bremen facility, achieving a 63% reduction in material use through optimized lightweight structural design.
By end-user, aerospace and defense lead in high-value applications needing lightweight and complex geometries. Healthcare rapidly scales with patient-specific implants and dental products. Automotive and electronics sectors drive demand for prototyping and functional components. Consumer goods, energy, chemicals, and construction adopt AM for cost-effective customization and durable part fabrication.
By technology, powder bed fusion dominates metal part production, followed by directed energy deposition for larger components. Material jetting and vat photopolymerization support high-resolution applications. Binder jetting and sheet lamination address tooling and low-cost parts.
By material, polymers remain widely used, but metals represent the highest revenue due to application in critical parts. Ceramics and composites gain adoption in defense and energy sectors. Bio-inks fuel growth in regenerative medicine research. It continues evolving with material innovation and process expansion across industries.
Segmentation:
By Business Model
- Hardware
- Software
- Services
- Maintenance / Consumables
By Adoption Stage
- R&D / Prototyping
- Low-volume Manufacturing
- Mass Customization
- Spare Parts & On-Demand Production
By End-User
- Aerospace & Defense
- Automotive
- Healthcare
- Consumer Goods
- Electronics
- Energy
- Chemical Industry
- Construction
By Technology
- Powder Bed Fusion
- Directed Energy Deposition
- Material Jetting
- Vat Photopolymerization
- Binder Jetting
- Sheet Lamination
- Others
By Material
- Polymers
- Metals
- Ceramics
- Composites
- Bio-inks
- Others
By Region
- North America
- U.S.
- Canada
- Mexico
- Europe
- Germany
- France
- U.K.
- Italy
- Spain
- Rest of Europe
- Asia Pacific
- China
- Japan
- India
- South Korea
- South-east Asia
- Rest of Asia Pacific
- Latin America
- Brazil
- Argentina
- Rest of Latin America
- Middle East & Africa
- GCC Countries
- South Africa
- Rest of the Middle East and Africa
Regional Analysis:
North America
The North America Next Gen Additive Manufacturing Market size was valued at USD 7,811.00 million in 2018 to USD 15,310.79 million in 2024 and is anticipated to reach USD 79,533.42 million by 2032, at a CAGR of 23.0% during the forecast period. North America holds the largest market share at 30.6% in 2024. The [Next Gen Additive Manufacturing Market] in this region benefits from strong defense, aerospace, and healthcare sectors. U.S. manufacturers deploy additive systems across production and prototyping lines. Federal research grants and military programs support technology adoption. Leading players like GE Additive, HP, and 3D Systems anchor the innovation landscape. The region invests heavily in metal 3D printing and software integration. High R&D spending and mature digital infrastructure accelerate enterprise-scale rollouts. Demand continues to rise across medical devices, automotive tooling, and aviation parts.
Europe
The Europe Next Gen Additive Manufacturing Market size was valued at USD 5,649.60 million in 2018 to USD 10,775.16 million in 2024 and is anticipated to reach USD 52,952.66 million by 2032, at a CAGR of 22.1% during the forecast period. Europe holds a 21.5% market share in 2024. It features strong academic-industry collaboration in additive design and materials. Germany, France, and the UK dominate regional demand due to advanced automotive and aerospace sectors. Companies like EOS GmbH, Renishaw, and SLM Solutions lead in equipment innovation. Sustainability mandates support localized, low-waste production models. Medical and dental segments grow with high precision requirements. The European Union funds AM adoption in SMEs and cross-border research. Print farms and hybrid systems gain visibility in industrial hubs.
Asia Pacific
The Asia Pacific Next Gen Additive Manufacturing Market size was valued at USD 5,803.68 million in 2018 to USD 11,975.64 million in 2024 and is anticipated to reach USD 68,136.63 million by 2032, at a CAGR of 24.3% during the forecast period. Asia Pacific holds a 23.9% market share in 2024. China, Japan, and South Korea lead in materials and machine development. The [Next Gen Additive Manufacturing Market] in this region sees fast deployment in electronics, consumer goods, and precision engineering. Government initiatives like Made in China 2025 and India’s AM roadmap push public-private collaboration. Local vendors scale low-cost printers and expand software tools. Adoption spreads in dental labs, automotive suppliers, and contract manufacturers. Export-driven economies view AM as a productivity multiplier. Investment in vocational AM training builds long-term talent pools.
Latin America
The Latin America Next Gen Additive Manufacturing Market size was valued at USD 1,326.80 million in 2018 to USD 2,606.61 million in 2024 and is anticipated to reach USD 12,560.52 million by 2032, at a CAGR of 21.8% during the forecast period. Latin America holds a 5.2% market share in 2024. The region shows interest in AM for spare parts, automotive components, and tooling. Brazil leads with rising government grants and university-industry tie-ups. Medical and dental labs in Mexico and Argentina explore 3D-printed implants and guides. The [Next Gen Additive Manufacturing Market] expands through partnerships with international OEMs. Low-cost adoption in education and training fuels future skill growth. Service bureaus bridge gaps for small enterprises. Energy and mining industries consider AM for remote maintenance needs.
Middle East
The Middle East Next Gen Additive Manufacturing Market size was valued at USD 449.40 million in 2018 to USD 789.48 million in 2024 and is anticipated to reach USD 3,336.26 million by 2032, at a CAGR of 19.8% during the forecast period. The Middle East holds a 1.6% share in 2024. Countries like the UAE and Saudi Arabia invest in industrial innovation hubs. The [Next Gen Additive Manufacturing Market] grows through construction, energy, and healthcare use cases. Dubai’s 3D Printing Strategy accelerates municipal and healthcare deployment. Government procurement drives the shift to localized production. Oil and gas firms pilot spare part printing to cut downtime. Regional universities collaborate on material development. The defense sector explores low-volume production and part repair.
Africa
The Africa Next Gen Additive Manufacturing Market size was valued at USD 359.52 million in 2018 to USD 1,002.23 million in 2024 and is anticipated to reach USD 4,344.22 million by 2032, at a CAGR of 19.6% during the forecast period. Africa accounts for a 2.0% market share in 2024. The [Next Gen Additive Manufacturing Market] remains in the early growth stage. South Africa leads in equipment deployment and metal printing research. Universities support medical and prosthetic innovations using AM. Energy and mining sectors see use cases in tool repair and spare parts. Limited infrastructure and high import dependence slow full-scale adoption. NGOs and development agencies fund AM training programs. Mobile print labs and low-cost printers enable rural access. Growth depends on improved logistics and funding channels.
Key Player Analysis:
- 3D Systems
- Stratasys
- EOS GmbH
- GE Additive
- HP Inc.
- Markforged
- Materialise
- SLM Solutions
- Renishaw
- Carbon Inc.
- ExOne
- Velo3D
- Siemens
- Autodesk
Competitive Analysis:
The Next Gen Additive Manufacturing Market is highly competitive, driven by rapid innovation in hardware, materials, and software integration. Key players include 3D Systems, Stratasys, EOS GmbH, GE Additive, and HP Inc., each offering specialized technologies for industrial and medical applications. Velo3D and SLM Solutions focus on high-precision metal printing, while Markforged and Carbon Inc. emphasize composite and polymer-based systems. Siemens and Autodesk strengthen their positions through advanced AM software platforms. Companies compete on print speed, accuracy, material compatibility, and workflow automation. Strategic acquisitions and product launches shape competitive positioning. Firms invest in hybrid systems, large-format printers, and AI-driven optimization tools. The market rewards players with scalable solutions and end-to-end service capabilities. Global expansion, OEM collaborations, and certification-ready offerings continue to define leadership. It evolves through partnerships and differentiation across aerospace, healthcare, and automotive verticals. Competitive pressure drives continuous upgrades and ecosystem-based growth strategies.
Recent Developments:
- In November 2025, 3D Systems introduced the SLA 825 Dual, a next-generation large-frame stereolithography printer, along with ArrayCast digital solution for investment casting and new materials Accura SbF and Accura Xtreme Black, debuting these at Formnext 2025.
- In April 2025, at RAPID+TCT, the company unveiled the Figure 4 135 3D printer paired with Figure 4 Tough 75C FR Black material for high-mix, low-volume production, plus a new module for EXT Titan Pellet printers and QuickCast Diamond build style.
- In April 2025.Velo3D signed a $15 million partnership deal with space company Momentus, exchanging stock for five years of additive manufacturing services.
Report Coverage:
The research report offers an in-depth analysis based on Business Model, Adoption Stage, End-User and Technology, Material. It details leading market players, providing an overview of their business, product offerings, investments, revenue streams, and key applications. Additionally, the report includes insights into the competitive environment, SWOT analysis, current market trends, as well as the primary drivers and constraints. Furthermore, it discusses various factors that have driven market expansion in recent years. The report also explores market dynamics, regulatory scenarios, and technological advancements that are shaping the industry. It assesses the impact of external factors and global economic changes on market growth. Lastly, it provides strategic recommendations for new entrants and established companies to navigate the complexities of the market.
Future Outlook:
- Demand will accelerate with the shift toward localized, on-demand production across key manufacturing sectors.
- Material innovation in metals, ceramics, and bio-inks will expand industrial and medical applications.
- Software platforms will grow rapidly with AI-driven design, simulation, and remote print management capabilities.
- Integration with digital twins and smart factory ecosystems will boost enterprise adoption and automation.
- Hybrid systems combining additive and subtractive technologies will gain strong traction in tooling and aerospace.
- Growth in mass customization will push adoption in consumer goods, electronics, and healthcare.
- Strategic government initiatives and funding programs will enhance adoption in Asia Pacific and Europe.
- Service bureaus and contract manufacturers will scale to meet demand from small and mid-size enterprises.
- Sustainability-driven manufacturing models will prioritize additive processes for material and energy efficiency.
- Strategic partnerships, M&A, and product innovations will continue to shape the competitive landscape.
Request a Free Sample
Fill in your details and we'll send you a free sample report.
- Sample data tables & charts
- Research methodology
Need a Custom Version of This Report?
Tailor the scope, geography, or segments to your exact requirements.
- Custom geography or segment scope
- Direct access to our analyst team
Frequently Asked Questions
What is the current market size for Next Gen Additive Manufacturing Market, and what is its projected size in 2032?
At what Compound Annual Growth Rate is the Next Gen Additive Manufacturing Market projected to grow between 2024 and 2032?
Which Next Gen Additive Manufacturing Market segment held the largest share in 2024?
What are the primary factors fueling the growth of the Next Gen Additive Manufacturing Market?
Who are the leading companies in the Next Gen Additive Manufacturing Market?
Which region commanded the largest share of the Next Gen Additive Manufacturing Market in 2024?
Table of Content
Chapter 1. Report Introduction
- 1.1 Report Description & Purpose
- 1.1.1 Report Title & Market Definition
- 1.1.2 Unique Selling Propositions (USP) & Key Differentiators
- 1.1.3 Value Proposition for Stakeholders
- 1.2 Research Objectives
- 1.2.1 Market Sizing Objectives (Volume & Revenue)
- 1.2.2 Segmentation Objectives
- 1.2.3 Competitive Intelligence Objectives
- 1.2.4 Forecast & Scenario Objectives
- 1.3 Report Scope
- 1.3.1 Next Gen Additive Manufacturing Scope – Types & Subtypes Covered
- 1.3.2 Geographic Scope – Regions & Countries Covered
- 1.3.3 Historical Period, Base Year & Forecast Period (2024; forecast to 2032)
- 1.3.4 Inclusions & Exclusions
- 1.4 HS Code & Classification Framework
- 1.5 Currency, Units & Pricing Basis
- 1.6 Target Stakeholders
- 1.7 Limitations & Assumptions
Chapter 2. Executive Summary
- 2.1 Global Next Gen Additive Manufacturing Market Snapshot
- 2.1.1 Market Size – Historical (2024) & Forecast (2024-2032) (2024: USD 42,460.91 million → 2032: USD 220,863.71 million)
- 2.1.2 Volume & Revenue – Global Totals
- 2.1.3 Key Market Highlights – Top Five Facts
- 2.2 Next Gen Additive Manufacturing Market Segmentation Snapshot
- 2.2.1 Market Split by Region – 2024 vs. 2032
- 2.3 Competitive Snapshot
- 2.3.1 Top 10 Players by Revenue Share – 2024
- 2.3.2 Top 10 Players by Volume Share – 2024
- 2.3.3 Recent Strategic Developments (18-Month Summary)
- 2.4 Key Investment Highlights & Strategic Conclusions
Chapter 3. Next Gen Additive Manufacturing Market Dynamics & Industry Analysis
- 3.1 Market Overview & Context
- 3.1.1 Next Gen Additive Manufacturing Market Position in the Broader Automotive Value Chain
- 3.1.2 OEM vs. Replacement Market Dynamics
- 3.1.3 Market Maturity & Development Stage by Region
- 3.2 Next Gen Additive Manufacturing Market Drivers
- 3.3 Next Gen Additive Manufacturing Market Restraints & Challenges
- 3.4 Next Gen Additive Manufacturing Market Opportunities
- 3.5 Porter's Five Forces Analysis
- 3.5.1 Threat of New Entrants
- 3.5.2 Bargaining Power of Suppliers
- 3.5.3 Bargaining Power of Buyers
- 3.5.4 Threat of Substitutes
- 3.5.5 Competitive Rivalry – Intensity Assessment
- 3.6 Next Gen Additive Manufacturing Value Chain Analysis
- 3.6.1 Upstream – Raw Material/Input Suppliers
- 3.6.1.1 Raw Material/Input 1
- 3.6.1.2 Raw Material/Input 2
- 3.6.1.3 Raw Material/Input 3
- 3.6.2 Midstream – Production/Manufacturing/Service Delivery
- 3.6.2.1 Production/Process Overview
- 3.6.2.2 Key Facility Locations & Capacity by Manufacturer
- 3.6.3 Downstream – Distribution & End Consumer
- 3.6.3.1 Primary Channel – B2B/OEM
- 3.6.3.2 Secondary Channels – Dealer, Retail, Online, Direct
- 3.6.4 Value Chain Profitability Analysis
- 3.6.1 Upstream – Raw Material/Input Suppliers
- 3.7 PESTEL Analysis
- 3.7.1 Political Factors
- 3.7.2 Economic Factors
- 3.7.3 Social Factors
- 3.7.4 Technological Factors
- 3.7.5 Environmental Factors
- 3.7.6 Legal Factors
- 3.8 Next Gen Additive Manufacturing Supply Chain Analysis
- 3.8.1 Raw Material/Input Supply Risk Assessment
- 3.8.2 Manufacturing Concentration Risk (Geographic Exposure)
- 3.8.3 Trade Disruption Impact Analysis
- 3.9 Regulatory & Policy Landscape
Note: The regulatory and policy landscape section covers regulations based on their applicability to the market, Next Gen Additive Manufacturing category, geography, and scope of the study. Only regulatory frameworks with a material impact on operations, compliance, trade, sustainability, or market access are analyzed in detail.
Chapter 4. Key Investment Pockets & Opportunity Analysis
- 4.1 Next Gen Additive Manufacturing Market Attractiveness Analysis
- 4.1.1 By Region – Investment Attractiveness Matrix (Volume × CAGR)
- 4.2 Absolute Revenue Growth Opportunity
- 4.2.1 By Region – Absolute USD Growth Through 2032
- 4.3 Incremental Volume Opportunity
- 4.3.1 By Region – Incremental Volume Through 2032
- 4.3.2 Segment – Incremental Volume
- 4.4 Emerging Submarket Opportunity Deep Dive (Subject to Applicability)
- 4.5 Emerging Market Opportunity Scorecards
- 4.5.1 United States
- 4.5.2 Europe
- 4.5.3 Asia
- 4.5.4 Middle East & Africa
Note: Emerging Market Opportunity Scorecards will be included based on relevance and strategic importance. Regions listed are indicative and may vary depending on data availability and market dynamics.
Chapter 5. Next Gen Additive Manufacturing Import-Export Analysis & Trade Flows
- 5.1 Global Trade Overview
- 5.1.1 Global Export Value by Country (2024)
- 5.1.2 Global Export Volume by Country (2024)
- 5.1.3 Global Import Value by Country (2024)
- 5.1.4 Global Import Volume by Country (2024)
- 5.1.5 Net Trade Balance by Country (2024)
- 5.2 Export Analysis – Segment
- 5.2.1 Type 1 (HS Code)
- 5.2.2 Type 2 (HS Code)
- 5.2.3 Type 3 (HS Code)
- 5.2.4 Type 4 (HS Code)
- 5.2.5 Type 5 (HS Code)
- 5.3 Import Analysis – Segment
- 5.3.1 Type 1 (HS Code)
- 5.3.2 Type 2 (HS Code)
- 5.3.3 Type 3 (HS Code)
- 5.3.4 Type 4 (HS Code)
- 5.3.5 Type 5 (HS Code)
- 5.4 Average Unit Trade Prices
- 5.4.1 Average Export Price – Segment & Country
- 5.4.2 Average Import Price – Segment & Source Country
- 5.4.3 Price Trends (2024)
- 5.5 Key Trade Route Analysis
- 5.5.1 Trade Route 1
- 5.5.2 Trade Route 2
- 5.5.3 Trade Route 3
- 5.5.4 Trade Route 4
- 5.5.5 Trade Route 5
- 5.6 Trade Policy Impact Assessment
- 5.6.1 US Anti-Dumping & Section 301 Tariffs
- 5.6.2 EU Customs Union Impact
- 5.6.3 Major Free Trade Agreements
- 5.6.4 USMCA Rules of Origin
Note: Trade policy analysis will be included only where relevant to the Next Gen Additive Manufacturing market.
Chapter 6. Competitive Landscape & Company Benchmarking
- 6.1 Next Gen Additive Manufacturing Market Concentration & Structure
- 6.1.1 Herfindahl-Hirschman Index (HHI) – vs. 2024
- 6.1.2 Tier 1, Tier 2 & Tier 3 Market Structure
- 6.1.3 Global, Regional & Local Player Dynamics
- 6.2 Next Gen Additive Manufacturing Market Share Analysis – 2024
- 6.2.1 Global Revenue Share by Company
- 6.2.2 Global Volume Share by Company
- 6.2.3 Regional Revenue Share
- 6.2.4 Market Share Evolution ( vs. 2024)
- 6.2.5 OEM Segment Share by Company
- 6.2.6 Replacement Segment Share by Company
- 6.3 Production/Delivery Capacity & Facility Analysis
- 6.3.1 Global Installed Capacity
- 6.3.2 Capacity Utilization Rates
- 6.3.3 Production/Output Volume
- 6.3.4 Facility Locations & Capacity Map
- 6.3.5 Planned Capacity Additions
- 6.4 Next Gen Additive Manufacturing Competitive Benchmarking Matrix
- 6.4.1 Revenue, Volume, CAGR & Profitability Comparison
- 6.4.2 Channel Revenue Mix
- 6.4.3 Geographic Revenue Exposure
- 6.4.4 R&D Intensity
- 6.4.5 Sustainability Maturity
- 6.5 Strategic Developments in Next Gen Additive Manufacturing (Last 24 Months)
- 6.5.1 Mergers, Acquisitions & Divestments
- 6.5.2 New Next Gen Additive Manufacturing Launches
- 6.5.3 Facility Expansions
- 6.5.4 Strategic Alliances, Joint Ventures & Partnerships
- 6.5.5 Distribution Expansion & Market Entry
- 6.5.6 Sustainability & ESG Initiatives
- 6.6 Competitive Strategy Mapping
- 6.6.1 Leader, Challenger, Follower & Niche Classification
- 6.6.2 Pricing Strategy Comparison
- 6.6.3 Channel Strategy Matrix
Note: Strategic developments are included based on their materiality and the availability of reliable information.
Chapter 7. Global Next Gen Additive Manufacturing Market – By Distribution Channel
- 7.1 Segment Overview
- 7.1.1 Volume & Revenue Split by Channel (2024 & 2032)
- 7.1.2 Channel Mix Evolution (2024-2032)
Chapter 8. Regional Market Analysis – Global Overview
- 8.1 Global Regional Overview
- 8.1.1 Regional Volume Share
- 8.1.2 Regional Revenue Share
- 8.1.3 Regional Volume by Region
- 8.1.4 Regional Revenue by Region
- 8.1.5 Regional Forecast Through 2032
- 8.2 Cross-Regional Segment Analysis
- 8.2.1 By Distribution Channel
- 8.2.2 By Brand/Price Tier
Chapter 9. North America Next Gen Additive Manufacturing Market
- 9.1 United States
- 9.2 Canada
- 9.3 Mexico
Chapter 10. Europe Next Gen Additive Manufacturing Market
- 10.1 Germany
- 10.2 France
- 10.3 Italy
- 10.4 United Kingdom
- 10.5 Spain
- 10.6 Poland
- 10.7 Russia
- 10.8 Netherlands
- 10.9 Belgium
- 10.10 Sweden
- 10.11 Denmark
- 10.12 Norway
- 10.13 Rest of Europe
Chapter 11. Asia Pacific Next Gen Additive Manufacturing Market
- 11.1 China
- 11.2 India
- 11.3 Japan
- 11.4 South Korea
- 11.5 Thailand
- 11.6 Indonesia
- 11.7 Vietnam
- 11.8 Malaysia
- 11.9 Australia
- 11.10 Rest of Asia Pacific
Chapter 12. Latin America Next Gen Additive Manufacturing Market
- 12.1 Brazil
- 12.2 Argentina
- 12.3 Colombia
- 12.4 Chile
- 12.5 Rest of Latin America
Chapter 13. Middle East Next Gen Additive Manufacturing Market
- 13.1 Saudi Arabia
- 13.2 United Arab Emirates
- 13.3 Turkey
- 13.4 Israel
- 13.5 Iran
- 13.6 Rest of the Middle East
Chapter 14. Africa Next Gen Additive Manufacturing Market
- 14.1 South Africa
- 14.2 Egypt
- 14.3 Nigeria
- 14.4 Morocco
- 14.5 Rest of Africa
Chapter 15. Next Gen Additive Manufacturing Company Profiles
- 15.1 [Company 01]
- 15.1.1 Company Overview
- 15.1.2 Key Management Personnel
- 15.1.3 Products & Services Portfolio
- 15.1.4 Financial Performance
- 15.1.5 Key Market Focus & Geographic Presence
- 15.1.6 Recent Developments & Strategic Initiatives
Note: The company profile list is preliminary and may change based on research findings, market developments, data availability, and client requirements.
Chapter 16. Appendices
- Appendix A – List of Abbreviations & Acronyms
- Appendix B – Industry Classification Code Reference – Full Series
- Appendix C – Production & Capacity Data Tables
- Appendix D – End-Use & Demand Base Tables
- Appendix E – Consumption & Replacement Rate Assumptions
- Appendix F – ASP Reference Tables
- Appendix G – Manufacturing & Facility Database
- Appendix H – Import-Export Data Tables
- Appendix I – Regulatory Summary Tables
- Appendix J – Primary Research Participant List (Anonymized)
- Appendix K – Primary Research Questionnaire Framework
- Appendix L – Data Sources & Bibliography
- Appendix M – Market Size Divergence & Source Comparison
Chapter 17. Research Methodology
- 17.1 Research Framework & Philosophy
- 17.2 Secondary Research – Sources, Hierarchy & Data Extraction
- 17.3 Data Modeling – Bottom-Up & Top-Down Market Sizing
- 17.4 Primary Research – Stakeholder Framework, LOI & Sample Sizes
- 17.5 Forecast Methodology – Regression, Scenario & Sensitivity Analysis
- 17.6 Quality Control – Four-Layer Validation Framework
- 17.7 Limitations & Standard Assumptions
- 17.8 Disclaimer
