
A unified exchange rate pulls diaspora money into banks
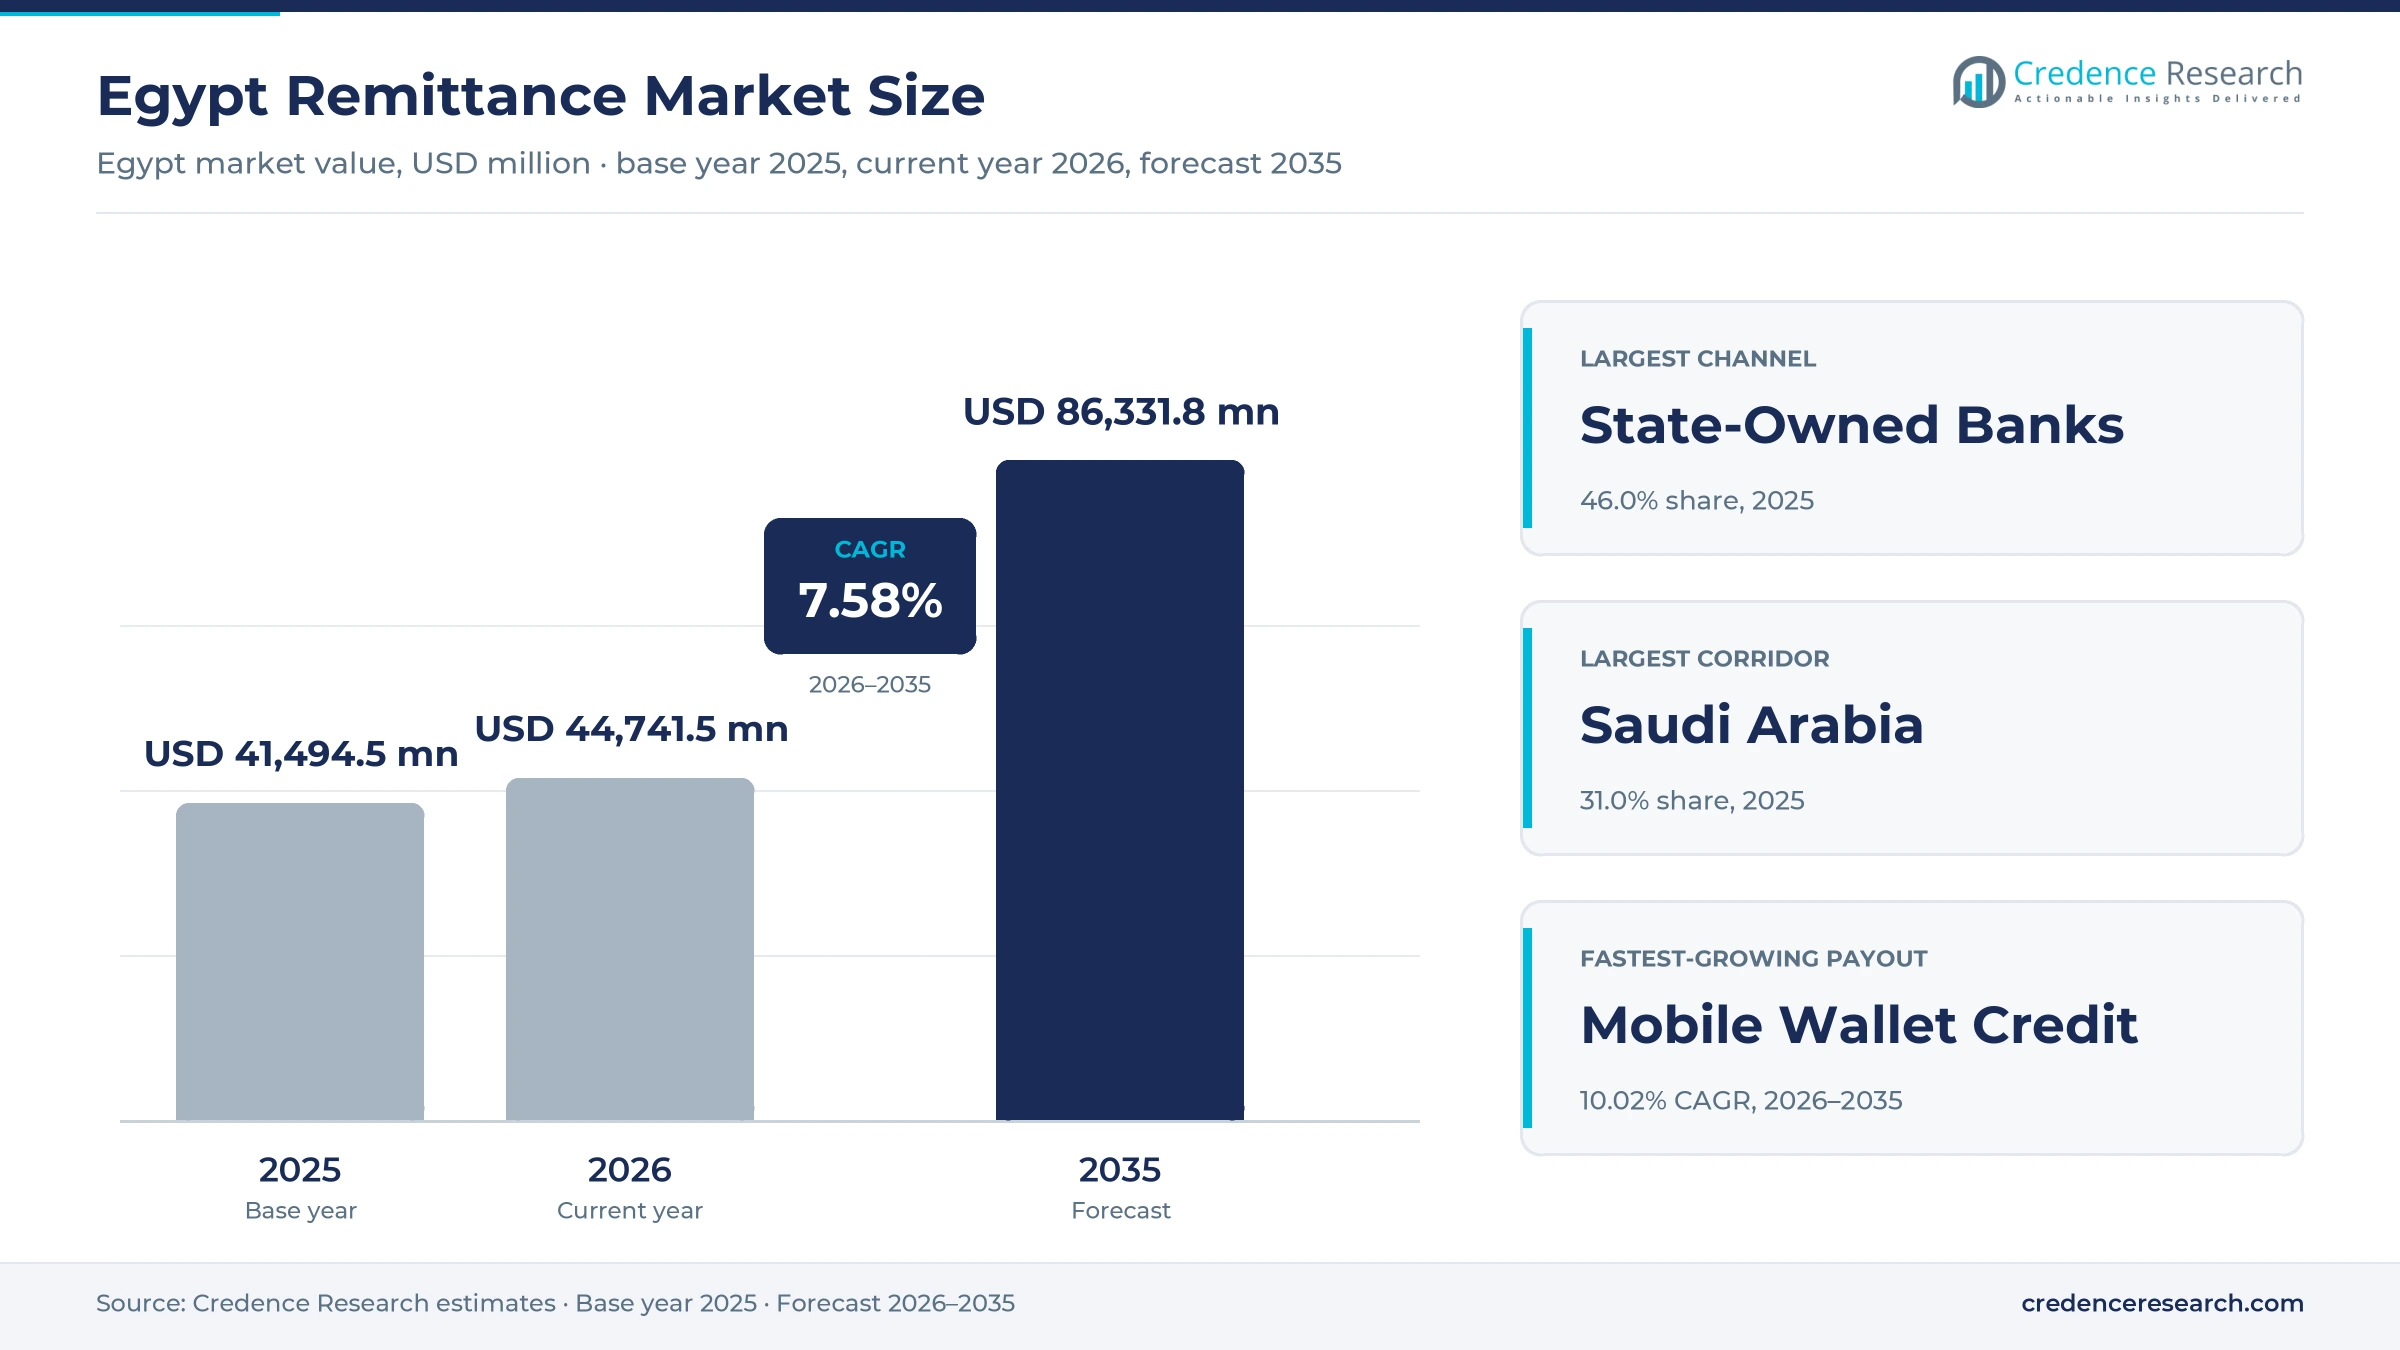
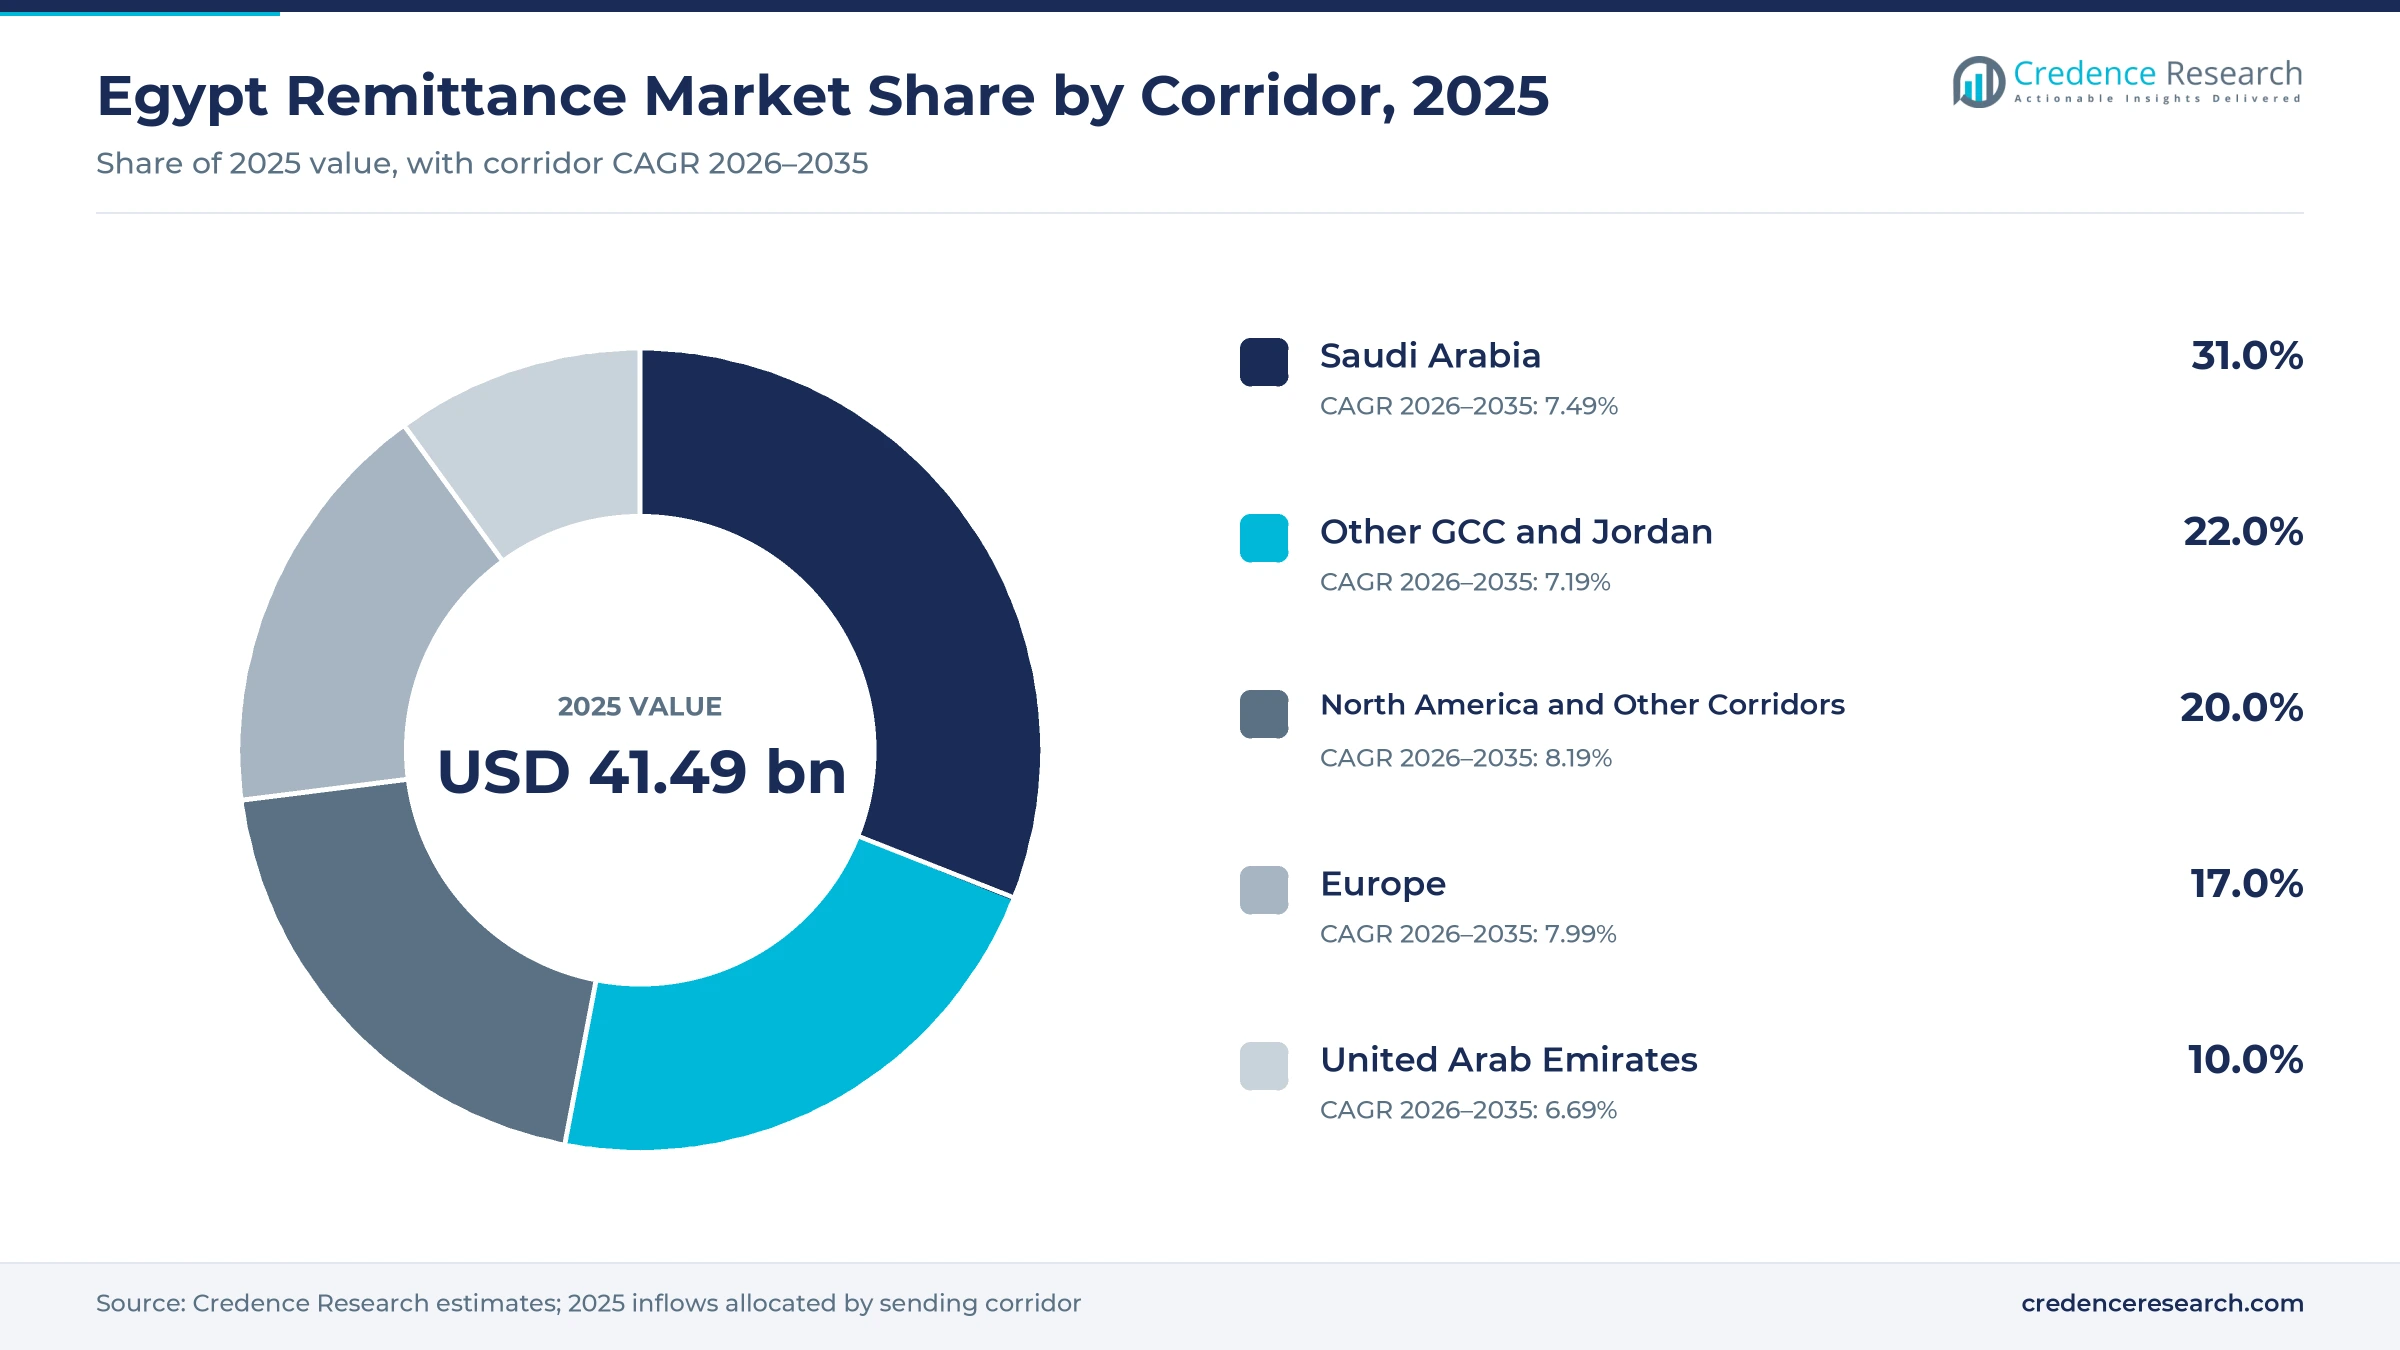
The Egypt remittance market was valued at USD 41.49 billion in 2025 and is projected to increase from USD 44.74 billion in 2026 to USD 86.33 billion by 2035, registering a CAGR of 7.58% during 2026–2035. Inflows rest on more than 10 million Egyptians working abroad, most of them in Gulf countries, and on a shift from informal dealers to banks after the exchange rate was unified in March 2024. Saudi Arabia held the largest corridor share, 31.0% in 2025, because about 1.5 million Egyptians live there and it is the largest single source of transfers. North America and other corridors grow fastest at 8.19% a year, as skilled professionals in the United States, Canada and other markets send larger amounts through apps. On the commercial side, new fintech senders and wallet payout links let families receive money on their phones within minutes.
Which diaspora transfers does the estimate include?
The estimate measures personal transfers received in Egypt from Egyptians and other senders abroad, credited through banks, money transfer operators, digital fintech platforms and licensed exchange companies. It covers payouts to bank accounts, cash pickup, mobile wallets and cards for family support, property, savings, education and healthcare. Values are stated in USD million at current prices for each calendar year.
The estimate excludes foreign direct investment, portfolio flows, official aid and business payments for goods and services. It also excludes money carried by hand across borders and informal dealer transfers. The value chain runs from senders and sending agents abroad through correspondent banks and payment networks to receiving banks, wallets and families in Egypt.
Egypt Remittance Market Insights
- The market was valued at USD 41.49 billion in 2025 and is projected to reach USD 86.33 billion by 2035, registering a CAGR of 7.58% during 2026–2035.
- Saudi Arabia held 31.0% of 2025 inflows, because about 1.5 million Egyptians work there and it is the largest single sending country.
- State-owned banks led receiving channels with 46.0% of 2025 value, as National Bank of Egypt and Banque Misr hold the widest branch networks.
- Remittances rose 29.6% to a record USD 47.3 billion in fiscal year 2025-2026, according to Central Bank of Egypt figures released in August 2026.
- Financial inclusion reached 76.3% of Egyptians aged 15 and above in June 2025, which widens the base of families able to receive transfers digitally.
State banks, account credit and Gulf workers lead inflows
Why do state-owned banks receive the most transfers?
Based on receiving channel, the market is categorized into state-owned banks, private and foreign banks, money transfer operators and digital fintech platforms. State-Owned Banks led with 46.0% of 2025 value, because National Bank of Egypt, Banque Misr and Banque du Caire hold the widest branch networks. Digital Fintech Platforms grows fastest at 10.07% a year, as app-based senders deliver money straight to accounts and wallets.
Which payout method gains the most share?
Based on settlement method, the market is categorized into bank account credit, cash pickup, mobile wallet credit and card and prepaid credit. Bank Account Credit led with 58.0% of 2025 value, because larger transfers for property and savings land in accounts. Mobile Wallet Credit grows fastest at 10.02% a year, as wallet links let families in villages and small towns receive money without visiting a branch.
Who sends the most money home?
Based on customer segment, the market is categorized into GCC contract workers, skilled professionals abroad, permanent diaspora households and foreign residents and outbound senders. GCC Contract Workers led with 55.0% of 2025 value, because most Egyptians abroad work in Gulf countries. Skilled Professionals Abroad grows fastest at 8.02% a year, as engineers, doctors and technology workers earn higher wages abroad.
What do families use transfers for?
Based on transfer purpose, the market is categorized into family maintenance, real estate and investment, education and healthcare, and savings and asset accumulation. Family Maintenance led with 52.0% of 2025 value, because households rely on monthly support for food, rent and bills. Real Estate and Investment grows fastest at 8.12% a year, as senders buy apartments and land in new cities.
| Segment Group | Leading Sub-segment | Share, 2025 | Fastest-growing Sub-segment | CAGR, 2026–2035 |
|---|---|---|---|---|
| By Receiving Channel | State-Owned Banks | 46.0% | Digital Fintech Platforms | 10.07% |
| By Settlement Method | Bank Account Credit | 58.0% | Mobile Wallet Credit | 10.02% |
| By Customer Segment | GCC Contract Workers | 55.0% | Skilled Professionals Abroad | 8.02% |
| By Transfer Purpose | Family Maintenance | 52.0% | Real Estate and Investment | 8.12% |
Request a Free Sample
Fill in your details and we'll send you a free sample report.
- Sample data tables & charts
- Research methodology
Exchange reform, digital rails and Gulf workers lift inflows
How did foreign-exchange reform formalize transfers?
Formalization following foreign-exchange reform is the main driver, because senders now get the same rate at a bank as from an informal dealer. Remittances have trended upward since March 2024, when the Central Bank of Egypt let market forces set the exchange rate and the parallel market disappeared, according to The Star. Inflows reached a record USD 47.3 billion in fiscal year 2025-2026, up 29.6% from USD 36.5 billion a year earlier. In March 2024, Egypt also agreed an expanded USD 8 billion program with the IMF, alongside a 600-basis-point rate rise. As a result, bank account credit held 58.0% of 2025 value, the largest payout method.
How do digital receiving rails widen financial inclusion?
Digital receiving rails and financial inclusion widen the base of families who can take money into accounts and wallets. Financial inclusion reached 76.3% of Egyptians aged 15 and above in June 2025, with 53.8 million of 70.5 million eligible citizens holding transaction accounts, which gives senders abroad a far wider choice of payout options. InstaPay connects bank accounts with telecom wallets and handles about 65% of incoming transfers to them, while the instant payment network processed 263 million transactions in the first quarter of 2025, according to Zawya. In turn, mobile wallet credit grows at 10.02% a year, the fastest payout method, as mobile wallets reach families outside large cities.
Why does a large Gulf-linked sender base anchor demand?
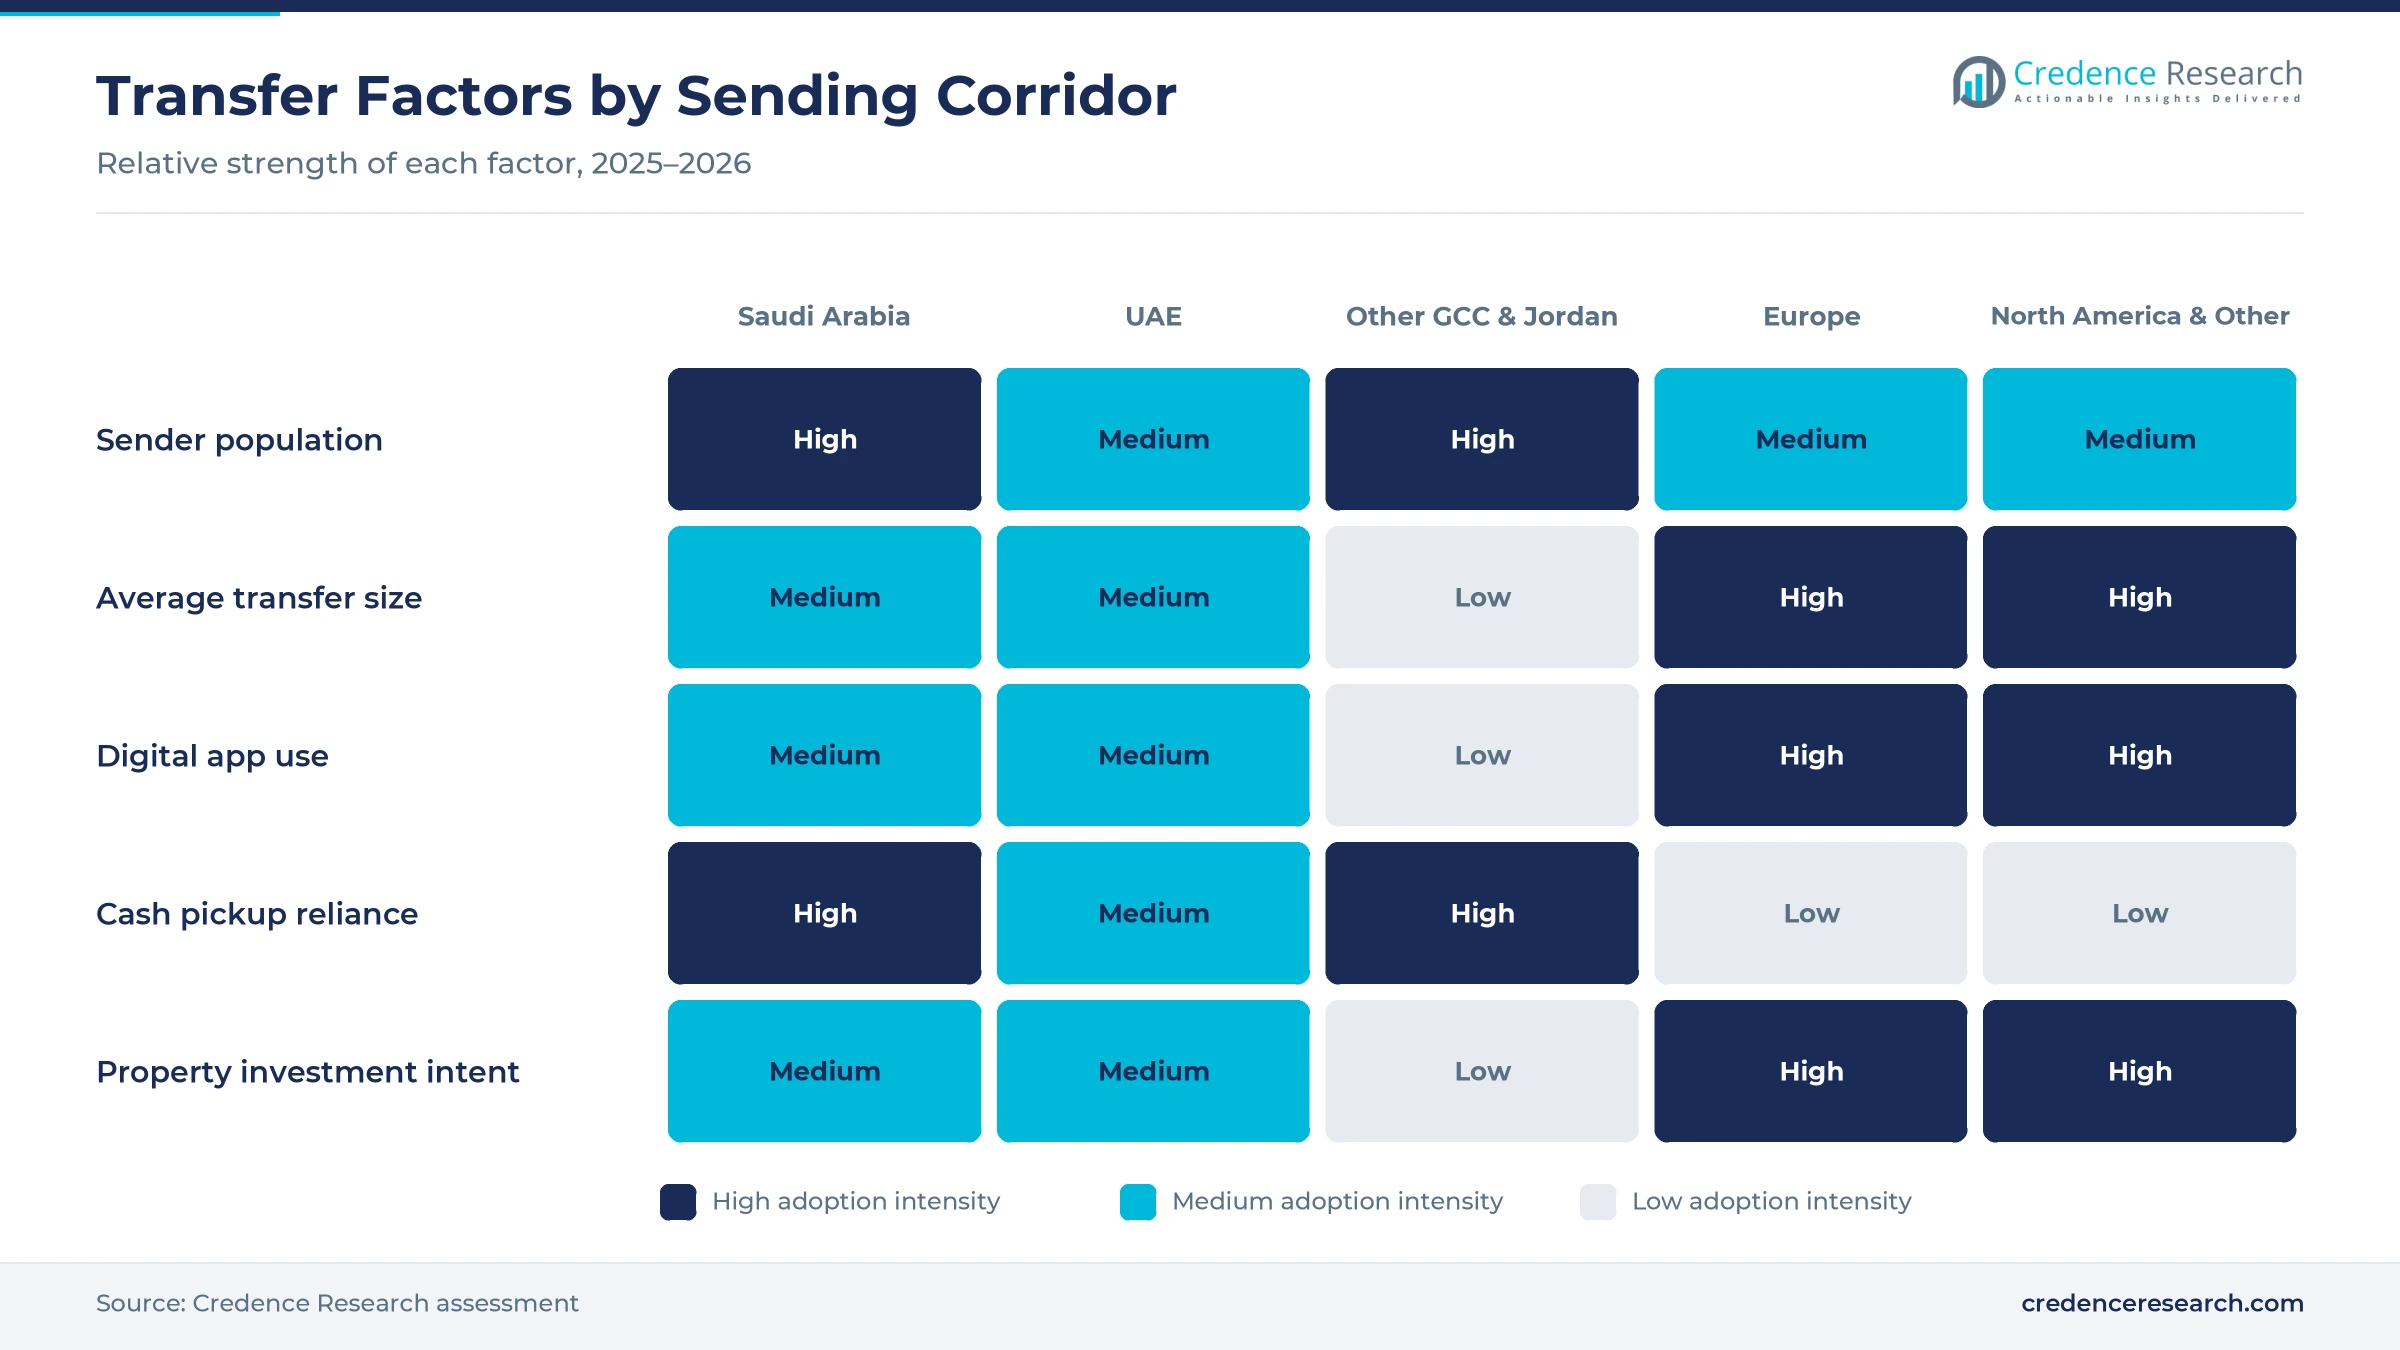
A large Gulf-linked sender base anchors demand, because contract workers in Saudi Arabia, Kuwait and the United Arab Emirates send money home every month. About 1.5 million Egyptians live in Saudi Arabia, which sent about USD 8 billion in 2023-2024 and was the largest single source, according to AGBI. Kuwait, Saudi Arabia and the United Arab Emirates together sent about USD 12 billion that year, almost half of the total, a share that shows how central the Gulf is to demand. Around 975,000 Egyptians live in the United Arab Emirates, close to 10% of its population. Therefore, GCC contract workers held 55.0% of 2025 value, the largest customer segment.
How does record monthly volume reflect stronger confidence?
Record monthly volume reflects stronger sender confidence, because families abroad now move savings into Egypt rather than holding them in Gulf accounts. Inflows rose 40.5% in calendar 2025, and December 2025 brought about USD 4.0 billion, the highest monthly figure on record, according to Amwal Al Ghad. World Bank data show remittances equal to 11.4% of GDP in 2025, up from 7.6% in 2024, according to World Bank figures. June 2026 inflows reached about USD 4.2 billion, up 15.6% from June 2025. As a result, real estate and investment transfers grow at 8.12% a year, the fastest purpose in this report.
Wallet payouts and fintech apps reshape the receiving side
How are wallet payouts shifting the receiving side?
Wallet payouts are shifting the receiving side, because families can collect money on a phone instead of traveling to a branch or agent. In March 2026, Vodafone Egypt and TapTap Send launched transfers from more than 30 countries straight into Vodafone Cash wallets, with no extra sender fees. InstaPay charges 0.1% per transfer from April 1, 2025, with a cap of EGP 20, which keeps onward payments cheap. Women's financial inclusion also rose to 70% in June 2025, and many recipients of family support are women. As a result, peer-to-peer mobile transfers are becoming the last step of many cross-border payments to Egypt.
Why are fintech senders rising in Western corridors?
Fintech senders are rising in Western corridors, because skilled Egyptians in the United States, the United Kingdom and Canada prefer app-based transfers with clear fees. LemFi announced its Egyptian service in July 2025 for the diaspora in the United States, Canada, the United Kingdom and Europe, after raising a USD 53 million Series B in January 2025. The company says it has served more than 2 million customers across its markets. Digital fintech platforms grow at 10.07% a year, the fastest receiving channel in this report. In turn, money transfer apps compete with banks on speed and price for these higher-value senders.
Can account opening abroad open a new channel?
Account opening abroad offers a clear opening, because Egyptians who hold a home account can send money at lower cost and buy local savings products. On Oct. 26, 2025, Banque Misr and the National Bank of Egypt signed a protocol with the foreign ministry under the Open Your Account in Egypt initiative. Egyptians can open pound or dollar accounts at embassies and consulates in Saudi Arabia, the United Arab Emirates, Kuwait, Qatar, the United Kingdom, the United States and Canada. Remittances reached a record USD 32.6 billion from March 2024 to February 2025, which shows how much Egypt remittance flow these accounts can capture. Skilled professionals abroad grow at 8.02% a year, the fastest customer segment. Therefore, banks that pair accounts with savings certificates can capture more of each transfer.
Is there room to grow property and savings transfers?
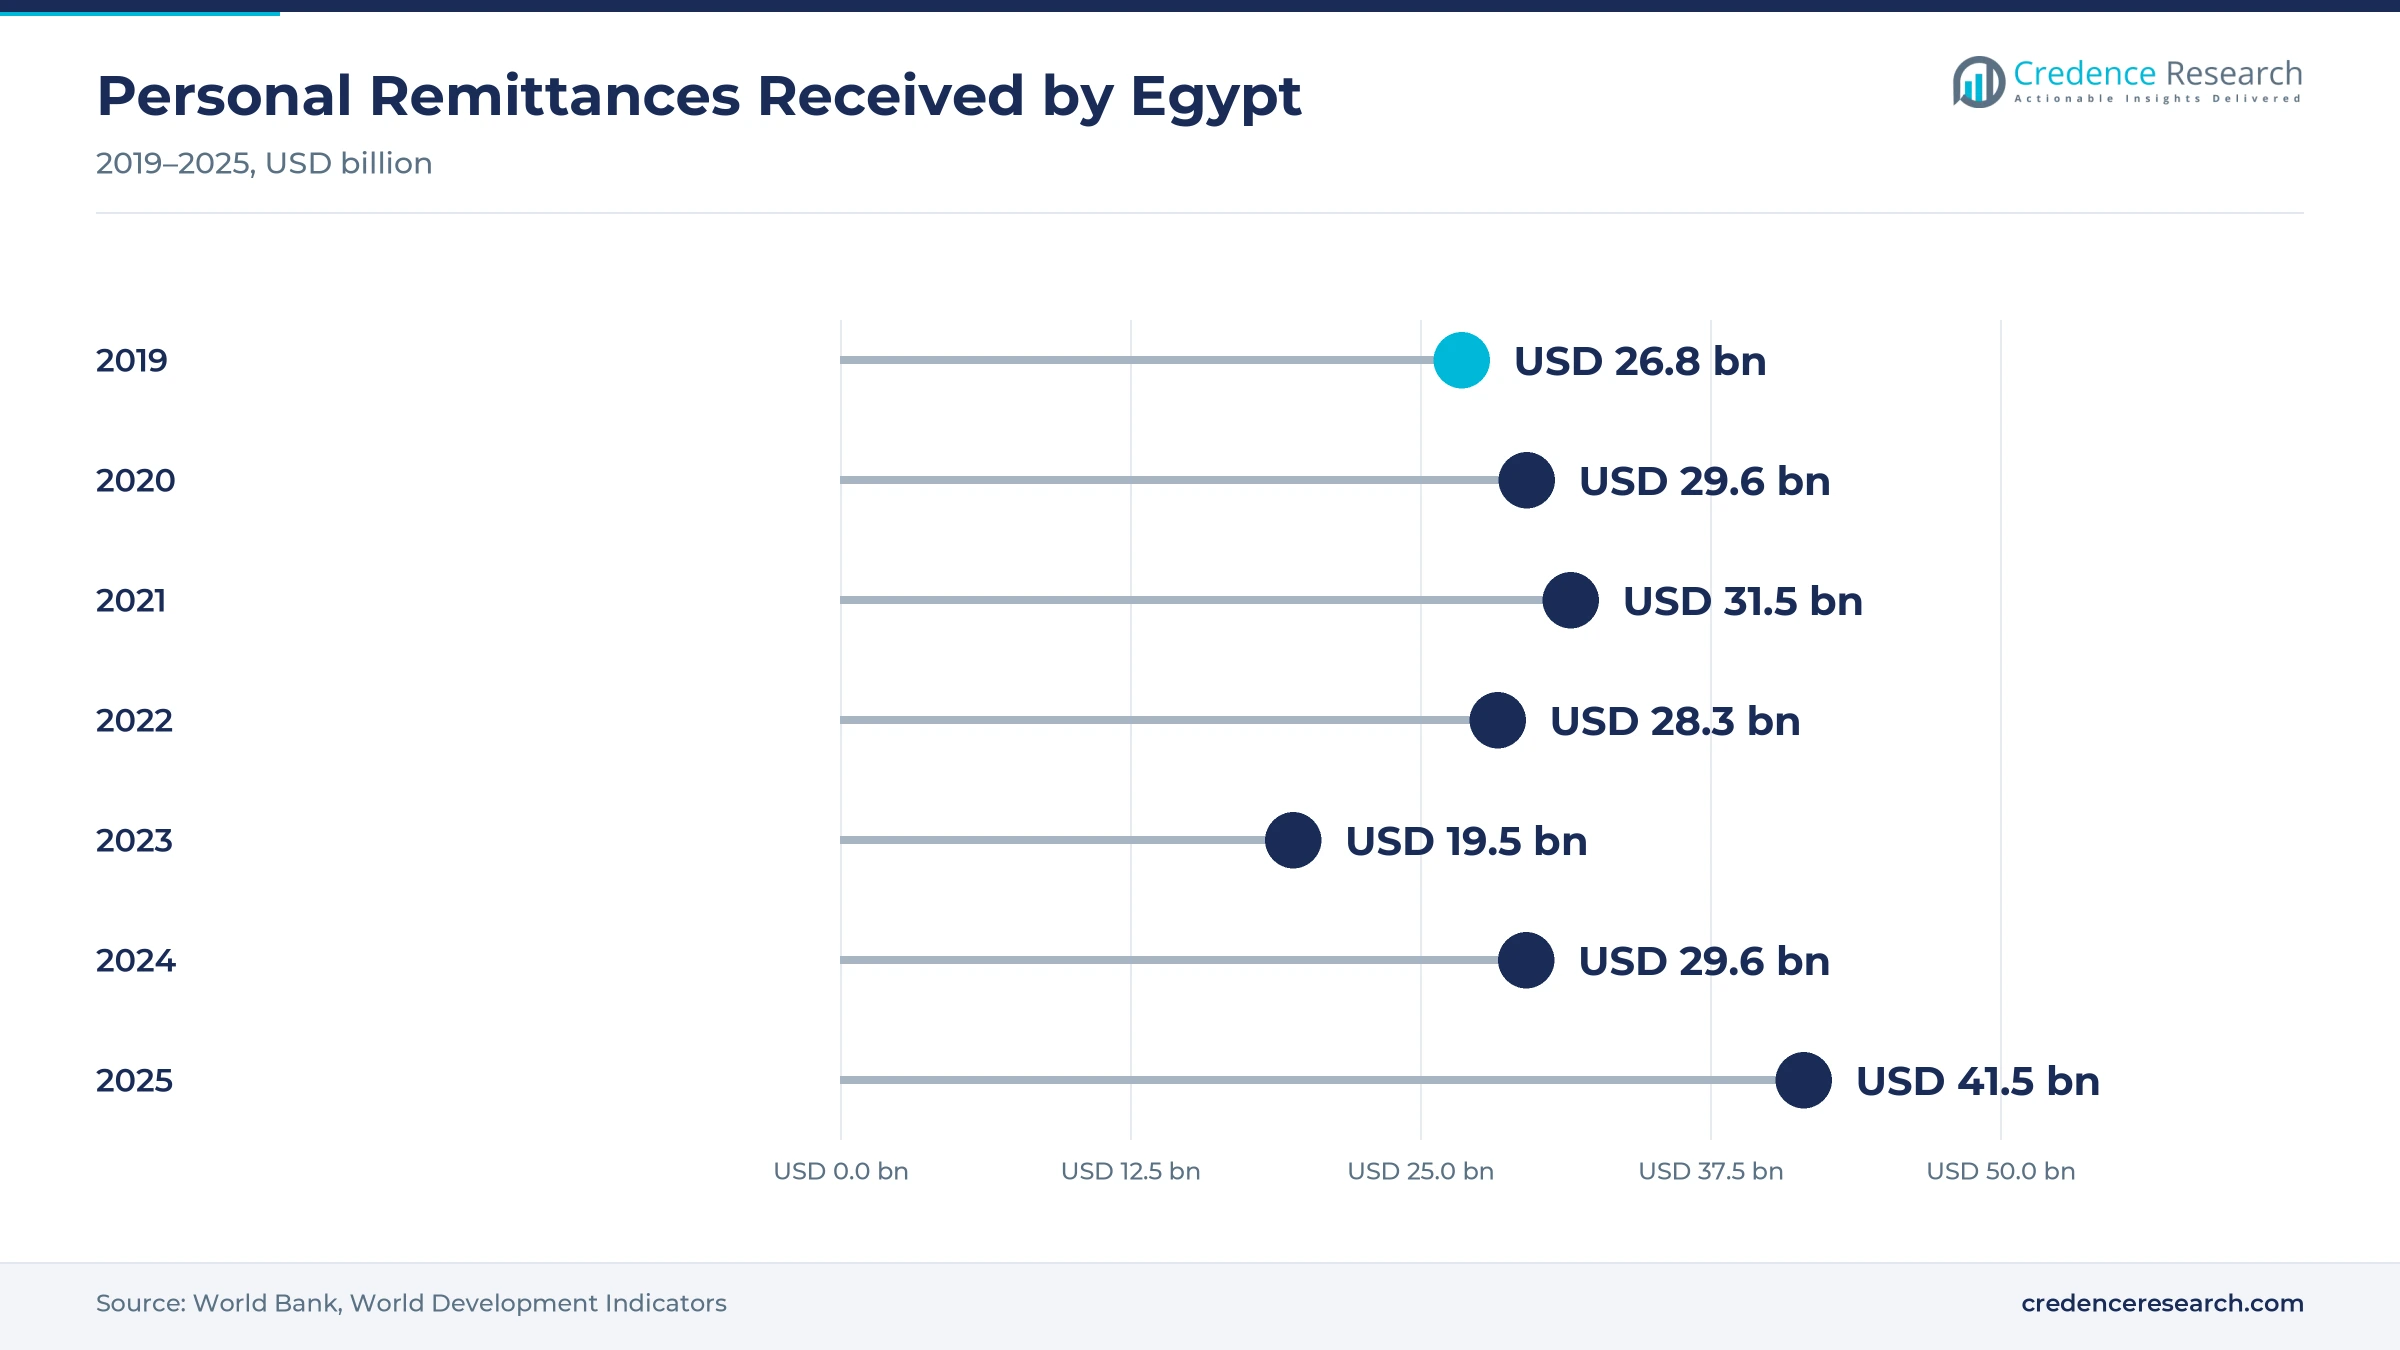
Property and savings transfers offer an opening, because a stable exchange rate makes long-term investment in Egypt more attractive to the diaspora. Remittances reached about USD 41.5 billion in calendar 2025 according to World Bank data, up from about USD 29.6 billion in 2024 and USD 19.5 billion in 2023. Egypt also ranked sixth worldwide for remittances in 2023, which shows the depth of demand for diaspora investment products. Real estate and investment purposes grow faster than family maintenance in this report. As a result, developers and banks that sell apartments, land and savings products directly to Egyptians abroad can turn monthly transfers into larger, planned investments.
Rate risk, Gulf labor shifts and costs weigh on transfers
How does exchange rate risk affect sender behavior?
Exchange rate risk affects sender behavior, because workers delay transfers when they expect the pound to weaken further. Egypt saw a parallel market reduce the formal share of inflows sharply before March 2024, when the official and black market rates were far apart. As a result, any return of a large rate gap could pull money back to informal dealers. Credible monetary policy and a flexible rate remain the main safeguards for formal channels.
Why do shifts in Gulf labor markets create risk?
Shifts in Gulf labor markets create risk, because most transfers come from contract workers whose jobs depend on Gulf construction, services and government spending. Remittances from the United Arab Emirates fell by nearly a quarter in the first seven months of 2025, which shows how quickly single corridors can change. In turn, lower oil revenue or nationalization of jobs could reduce flows. Diversification toward Western corridors softens this exposure, because Europe and North America held a large share of inflows in 2025.
How do transfer costs and fees reduce net inflows?
Transfer costs and fees reduce net inflows, because sending fees and exchange margins take a share of each small monthly payment. Workers who send low amounts feel these costs most, and some still use cash carried by relatives. Therefore, price competition in cross-border payments among banks, operators and fintech apps matters for formal volume. Wallet payouts and instant transfers help, but compliance costs for providers keep a floor under fees.
Why does inflation erode the value of transfers?
Inflation erodes the value of transfers, because families need more money each month to cover food, rent and school costs. Annual core inflation stood at 14.3% in June 2026, which means monthly support buys less and lifts demand for larger transfers over time. As a result, senders face pressure to send more while their own living costs in Gulf cities also rise. Stable prices at home would let more transfers move into savings and investment.
Saudi Arabia leads while Western corridors grow fastest
| Corridor | Value, 2025 (USD billion) | Share, 2025 | CAGR, 2026–2035 |
|---|---|---|---|
| Saudi Arabia | 12.86 | 31.0% | 7.49% |
| Other GCC and Jordan | 9.13 | 22.0% | 7.19% |
| North America and Other Corridors | 8.30 | 20.0% | 8.19% |
| Europe | 7.05 | 17.0% | 7.99% |
| United Arab Emirates | 4.15 | 10.0% | 6.69% |
Why does Saudi Arabia lead diaspora transfers?
Saudi Arabia held 31.0% of 2025 inflows and grows at 7.49% a year, supported by about 1.5 million Egyptian residents. Most of them are contract workers in construction, health care, education and services who send fixed monthly amounts to families. Egyptian embassies in the kingdom now open home accounts under the Open Your Account in Egypt initiative. As a result, Saudi Arabia remains the anchor corridor for state banks and money transfer operators.
How do the other GCC states and Jordan add flows?
Other GCC states and Jordan held 22.0% of 2025 inflows and grow at 7.19% a year, led by Kuwait and Qatar. Kuwait, Saudi Arabia and the United Arab Emirates together sent about half of all transfers in 2023-2024, which shows how central the Gulf remains. Jordan adds a large group of agricultural and construction workers. Therefore, exchange houses and cash pickup networks stay important in these corridors.
What keeps North America and other corridors growing fastest?
North America and other corridors held 20.0% of 2025 inflows and grow at 8.19% a year, the fastest pace among the five corridors. Skilled Egyptians in the United States, Canada and other markets earn higher wages and send larger amounts. LemFi and other app-based senders target these customers with low fees and fast delivery. Their share of 2025 inflows is still smaller than the Gulf total, but average transfer sizes are higher. In turn, digital channels gain share fastest in these corridors.
How does Europe support steady inflows?
Europe held 17.0% of 2025 inflows and grows at 7.99% a year, supported by long-settled Egyptian communities in Italy, France, Germany and the United Kingdom. Many senders are permanent residents who invest in property at home. As a result, bank transfers and fintech apps both compete for this corridor.
Why is the United Arab Emirates corridor growing slower?
The United Arab Emirates held 10.0% of 2025 inflows and grows at 6.69% a year, the slowest pace among the corridors. Transfers from the country fell to nearly USD 1.7 billion in the first seven months of 2025, from USD 2.2 billion a year earlier. Therefore, providers in this corridor focus on price and wallet payouts.
Rate reform, account access and new apps mark 2024 to 2026
| Development | Status and market relevance |
|---|---|
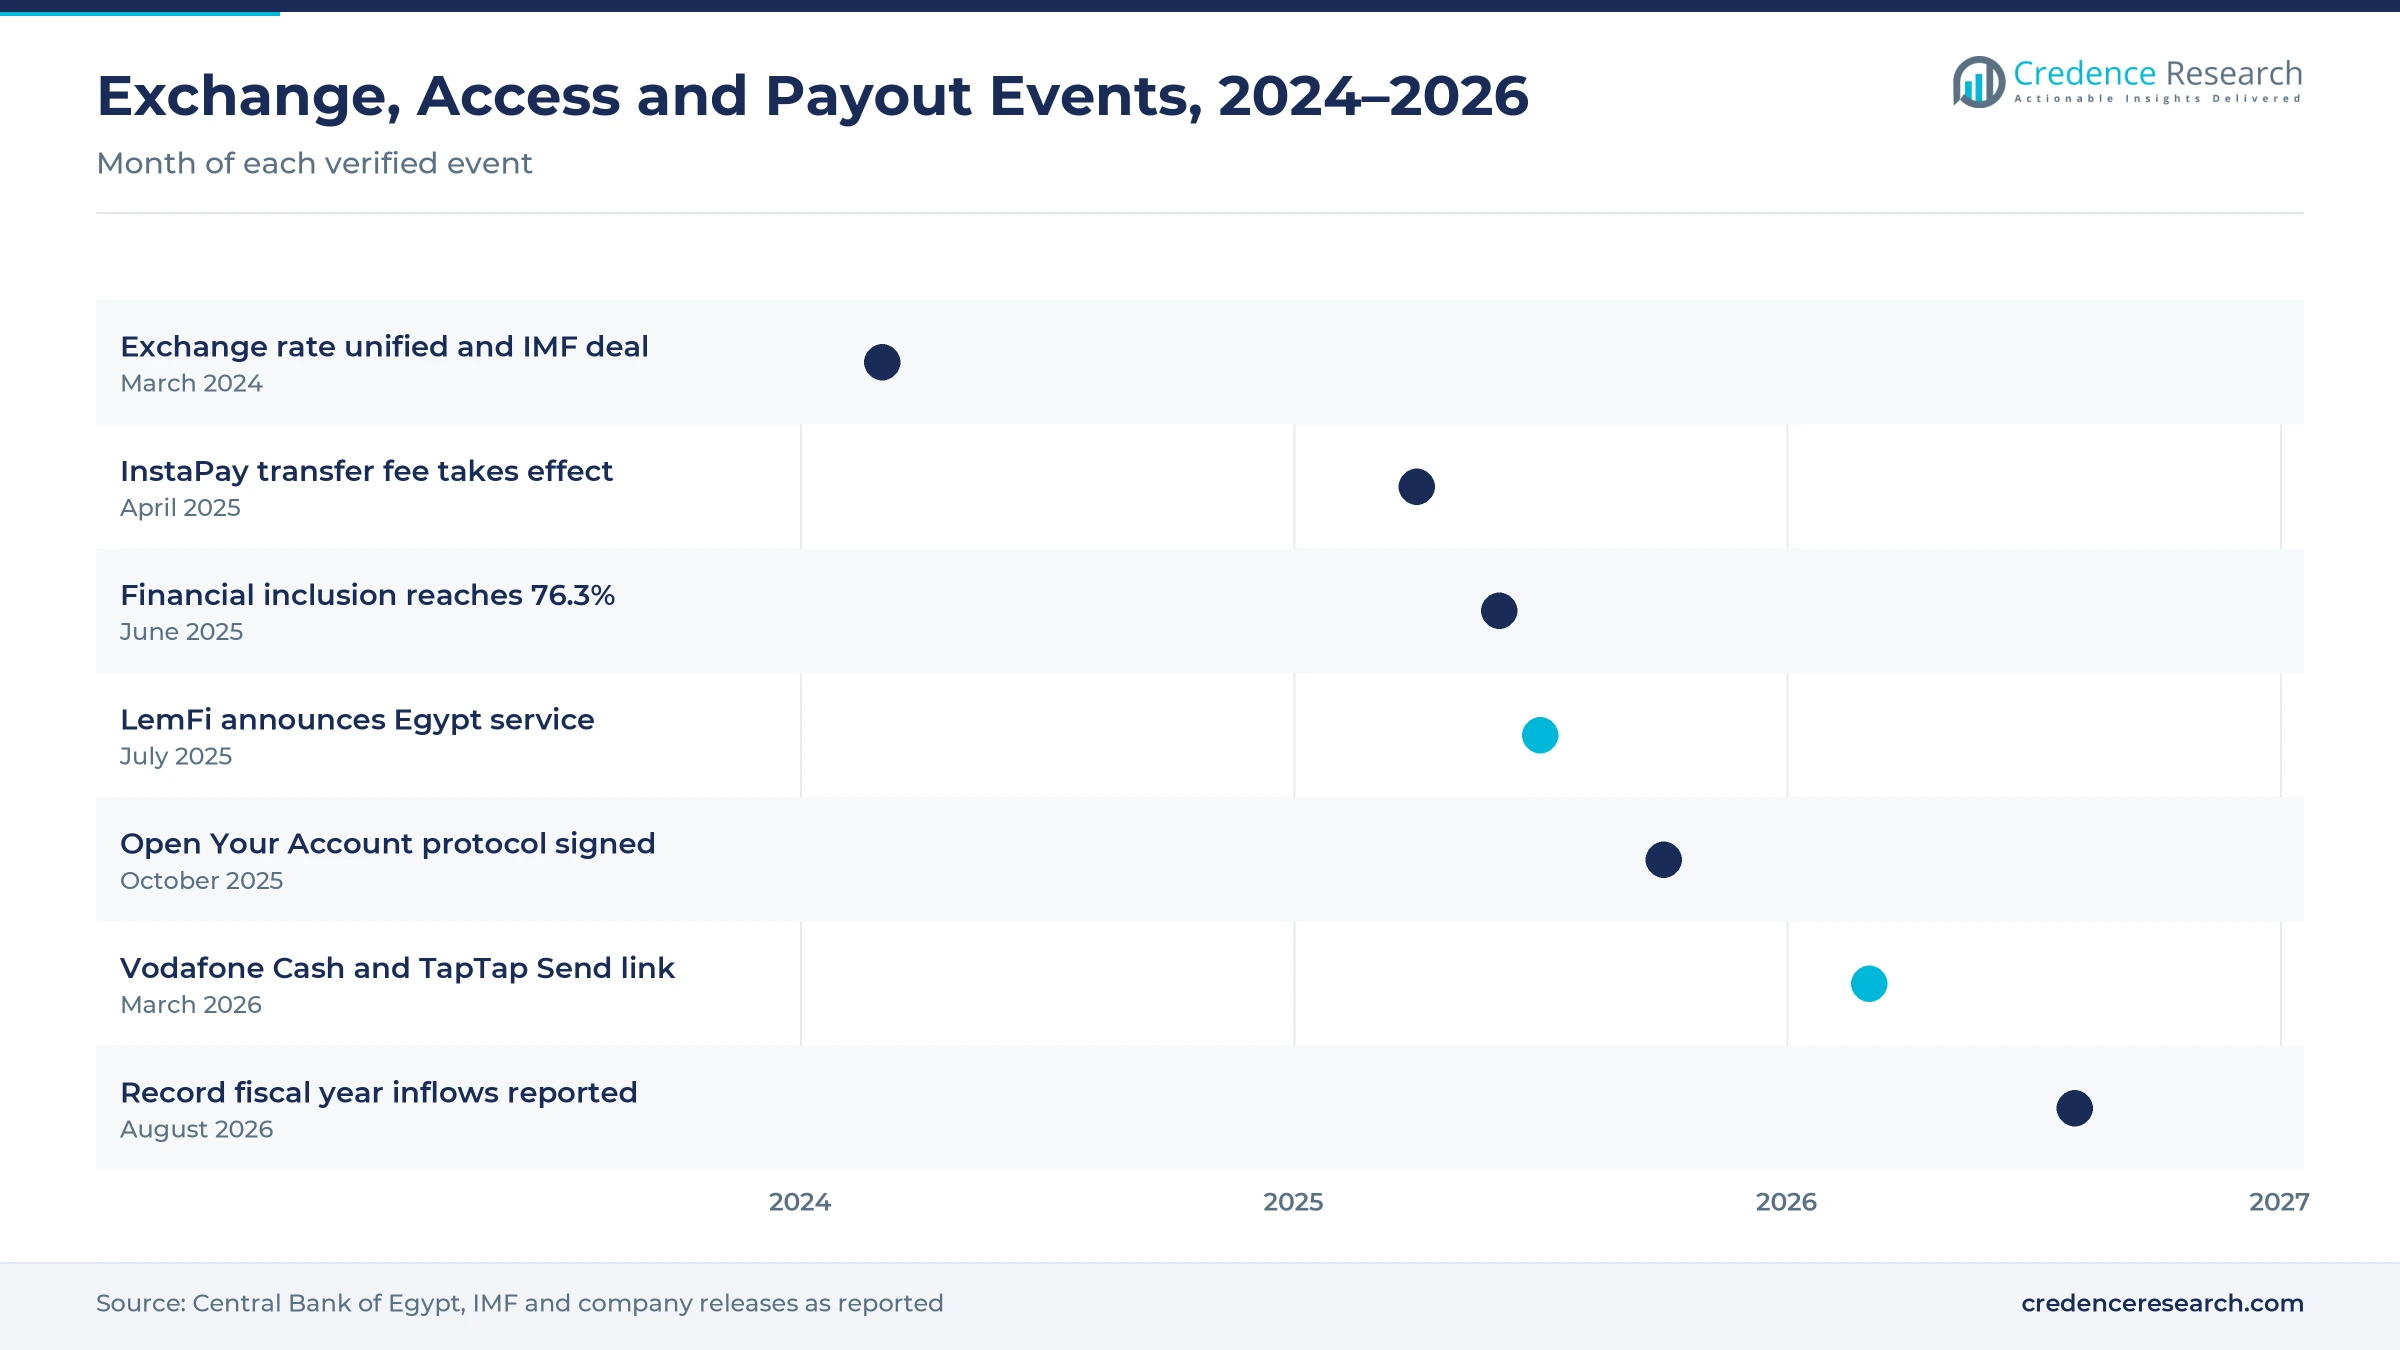
| In March 2024, the Central Bank of Egypt let market forces set the exchange rate as Egypt agreed an expanded IMF program. | Removed the gap that pushed transfers to informal dealers |
| In July 2025, LemFi announced its Egyptian service for the diaspora in the United States, Canada, the United Kingdom and Europe. | Adds an app-based sending option in Western corridors |
| In October 2025, Banque Misr and the National Bank of Egypt joined the Open Your Account in Egypt initiative for Egyptians abroad. | Lets workers open home accounts at embassies and consulates |
| In March 2026, Vodafone Egypt and TapTap Send launched cross-border transfers into Vodafone Cash wallets from more than 30 countries. | Brings direct wallet payouts to diaspora transfers |
| In August 2026, the Central Bank of Egypt reported record remittances of USD 47.3 billion for fiscal year 2025-2026. | Confirms strong inflows through formal channels |
Instant payments and wallet links speed money home
- The instant payment network links bank accounts with telecom wallets, which lets recipients move money onward within seconds at low cost.
- Wallet payout links let sending apps credit Vodafone Cash and other wallets directly, which serves families far from bank branches.
- Remote account opening at embassies and consulates gives workers abroad a home bank account without a trip to Egypt.
- Digital identity checks let fintech senders verify customers in minutes, which speeds sign-up and supports compliance with anti-money-laundering rules.
Need a Custom Version of This Report?
Tailor the scope, geography, or segments to your exact requirements.
- Custom geography or segment scope
- Direct access to our analyst team
State banks, global operators and fintechs compete
Competition in the Egypt remittance market combines large state-owned banks, private and foreign banks, global money transfer operators and fast-growing fintech apps. National Bank of Egypt and Banque Misr lead receiving volume through branch networks, correspondent links with Gulf banks and the Open Your Account in Egypt initiative. Together with Banque du Caire, they own a 40% stake in IBAG, the Western Union agent in Egypt since 1995, which serves more than 2 million clients. LemFi targets skilled senders in Western corridors with app-based transfers, while wallet operators such as Vodafone Egypt partner with sending apps. Rivals compete on exchange rates, fees, delivery speed, payout options and the ability to sell savings and property products to senders, while wallet and instant payment links reshape the final step.
Companies profiled and their roles in this market
| Company | Type | Role in the market |
|---|---|---|
| National Bank of Egypt | State-owned bank | Joined the Open Your Account in Egypt initiative and holds a stake in IBAG |
| Banque Misr | State-owned bank | Signed the October 2025 protocol for accounts at embassies and holds a stake in IBAG |
| Banque du Caire | State-owned bank | Joined Banque Misr and National Bank of Egypt as an IBAG shareholder |
| Western Union | Money transfer operator | Operates in Egypt through its agent IBAG, which serves more than 2 million clients |
| LemFi | Digital remittance fintech | Announced its Egyptian service for Western corridors in July 2025 |
Credence Research view on formal channels and wallets
Credence Research's view is that Egypt remittance inflows will grow steadily as the unified exchange rate keeps money in formal channels and digital payouts reach more families. Gulf contract workers will remain the core of the market, but skilled senders in Western corridors and app-based platforms should gain share. State banks keep the largest receiving role, while wallet links and fintech senders change the final step. However, a return of a large exchange rate gap or weaker Gulf labor demand would slow growth, so policy credibility is the key factor to watch.
How the diaspora transfer inflow estimate was built
The report uses 2025 as the base year on a calendar basis, with values in USD million at current prices. Market values come from the Credence Research model, which starts from personal transfer inflow data and projects them by sending corridor and channel. Corridor, channel, payout and purpose splits are Credence Research estimates built from published country data, diaspora population figures and payment network statistics. Sources used are World Bank data, Central Bank of Egypt releases reported by the press, trade press and company announcements, and no interviews or surveys were used.
Steady growth through 2035 as formal channels deepen
Egypt remittance inflows are expected to reach USD 86.33 billion by 2035, a 7.58% CAGR during 2026–2035, as more transfers move through banks, wallets and fintech apps. Growth should stay firm in 2026 and 2027 as formal channels keep the gains made since the exchange rate reform. After that, skilled senders in Western corridors and property investment should add more value, while Gulf flows grow more slowly. Stable prices and rates would lift this outlook, while a weaker Gulf job market would lower it.
Frequently Asked Questions
How big is the Egypt remittance market?
Which corridor sends the most money to Egypt?
Which corridor grows fastest?
Which payout method holds the largest share?
Why did remittances to Egypt rise after 2024?
How does financial inclusion affect transfers?
Who are the leading remittance companies in Egypt?
How large were remittances in fiscal year 2025-2026?
Table of Content
Chapter 1 Market Segmentation
- 1.1 Segmentation Framework
- 1.1.1 Product and Service Classification
- 1.1.2 Application and End-Use Classification
- 1.1.3 Technology and Solution Classification
- 1.1.4 Customer and Distribution Channel Classification
- 1.1.5 Geographic Segmentation
- 1.1.6 Market Segment Definitions and Boundaries
- 1.2 By Receiving Channel
- 1.2.1 State-Owned Banks
- 1.2.2 Money Transfer Operators
- 1.2.3 Private and Foreign Banks
- 1.2.4 Digital Fintech Platforms
- 1.3 By Settlement Method
- 1.3.1 Bank Account Credit
- 1.3.2 Cash Pickup
- 1.3.3 Mobile Wallet Credit
- 1.3.4 Card and Prepaid Credit
- 1.4 By Customer Segment
- 1.4.1 GCC Contract Workers
- 1.4.2 Skilled Professionals Abroad
- 1.4.3 Permanent Diaspora Households
- 1.4.4 Foreign Residents and Outbound Senders
- 1.5 By Transfer Purpose
- 1.5.1 Family Maintenance
- 1.5.2 Real Estate and Investment
- 1.5.3 Savings and Asset Accumulation
- 1.5.4 Education and Healthcare
- 1.6 By Corridor
- 1.6.1 Saudi Arabia
- 1.6.2 United Arab Emirates
- 1.6.3 Other GCC and Jordan
- 1.6.4 Europe
- 1.6.5 North America and Other Corridors
Chapter 2 Introduction
- 2.1 Report Objectives and Scope
- 2.2 Product Definition and Industry Terminology
- 2.3 Market Inclusions and Exclusions
- 2.4 Research Process
- 2.4.1 Primary Research and Expert Interviews
- 2.4.2 Secondary Research and Source Review
- 2.4.3 Top-Down and Bottom-Up Estimation
- 2.4.4 Data Triangulation and Verification
- 2.5 Market Size Measurement Basis
- 2.5.1 2025: USD 41.49 billion → 2035: USD 86.33 billion
- 2.6 Historical and Forecast Reference Periods
- 2.6.1 Historical Period: 2018-2025
- 2.6.2 Base Year: 2025
- 2.6.3 Forecast Period: 2025-2035
- 2.7 Research Assumptions and Limitations
Chapter 3 Executive Summary
- 3.1 Market Snapshot and Key Findings
- 3.2 Base-Year Market Size, 2025
- 3.3 Forecast Market Size, 2035
- 3.4 Revenue and Volume Growth Outlook
- 3.5 Key Demand and Supply Indicators
- 3.6 Leading Market Segments
- 3.7 Fastest-Growing Market Opportunities
- 3.8 Regional Performance Highlights
- 3.9 Technology and Industry Transformation
- 3.10 Competitive Landscape Summary
- 3.11 Analyst View and Strategic Implications
Chapter 4 Egypt Remittance Market Trends and Developments
- 4.1 Historical Industry Development, 2018-2025
- 4.2 Recent Market Trends and Developments
- 4.3 Demand and Customer Behavior Trends
- 4.4 Technology and Product Innovation
- 4.5 Artificial Intelligence, Automation and Digitalization
- 4.6 Local Manufacturing and Supply Chain Realignment
- 4.7 Industry Partnerships, Mergers and Acquisitions
- 4.8 Sustainability and Circular Economy Developments
- 4.9 Government and Private Sector Investment Trends
- 4.10 Emerging Business Models and Commercialization
- 4.11 Industry Developments and Announcements
Chapter 5 Egypt Remittance Market Supply and Demand Analysis
- 5.1 Demand Trend and Consumption Analysis, 2018-2025
- 5.2 Demand Forecast, 2025-2035
- 5.3 Supply Chain Structure and Procurement Trends
- 5.4 Supply-Demand Gap and Bottlenecks
- 5.5 Import Dependence and Sourcing Structure
- 5.6 Regional Supply and Demand Concentration
Chapter 6 Egypt Remittance Market Pricing Analysis
- 6.1 Pricing Structure and Measurement
- 6.2 Historical Pricing Trends, 2018-2025
- 6.3 Pricing Outlook, 2025-2035
- 6.4 Pricing by Product and Market Segment
- 6.5 Geographic Pricing Differences
- 6.6 Key Input, Energy, Labor and Logistics Costs
- 6.7 Contract Pricing and Purchasing Models
- 6.8 Pricing Sensitivity and Competitive Positioning
- 6.9 Price, Margin and Profitability Implications
Chapter 7 Egypt Remittance Market Dynamics
- 7.1 Market Growth Drivers
- 7.1.1 Demand-Side Drivers
- 7.1.2 Technology and Innovation Drivers
- 7.1.3 Infrastructure and Investment Drivers
- 7.1.4 Regulatory and Policy Drivers
- 7.2 Market Restraints
- 7.2.1 Cost and Affordability Constraints
- 7.2.2 Technology and Adoption Barriers
- 7.2.3 Supply Chain and Operational Constraints
- 7.3 Market Challenges
- 7.3.1 Competitive Pressure and Margin Erosion
- 7.3.2 Skills, Infrastructure and Implementation Gaps
- 7.4 Emerging Market Opportunities
- 7.5 Market Dynamics Impact and Time-Horizon Assessment
Chapter 8 Egypt Remittance Value Chain Analysis
- 8.1 Industry Value Chain Overview
- 8.2 Upstream Suppliers and Critical Inputs
- 8.3 Technology and Component Providers
- 8.4 Manufacturing or Service Delivery
- 8.5 Distribution, Channel Partners and Integrators
- 8.6 Downstream Applications and End Users
- 8.7 Value Addition and Profit Pools
- 8.8 Vertical Integration and Outsourcing
- 8.9 Supplier Concentration and Risk
- 8.10 Supply Chain Localization and Resilience
Chapter 9 Egypt Remittance Market Regulations and Policies
- 9.1 Relevant Laws, Standards and Compliance Frameworks
- 9.2 Product, Service, Safety and Quality Requirements
- 9.3 Government Policies, Incentives and Subsidies
- 9.4 Imports, Exports and Trade Barriers
- 9.5 Public Procurement and Local Content Requirements
- 9.6 Data Protection, AI and Cybersecurity Compliance
- 9.7 Upcoming Policy Changes and Market Implications
Chapter 10 Egypt Remittance Market Hotspots and Opportunities
- 10.1 Market Opportunity Mapping and Growth Hotspots
- 10.2 High-Growth Applications and Customer Groups
- 10.3 Underserved Markets and White-Space Opportunities
- 10.4 Emerging Technology and Product Opportunities
- 10.5 New Capacity and Investment Hotspots
- 10.6 Market Entry and Expansion Opportunities
- 10.7 Distribution and Partnership Opportunities
- 10.8 Near-Term and Long-Term Commercial Potential
- 10.9 Opportunity Attractiveness and Execution Risks
Chapter 11 Egypt Remittance Market Outlook, 2025-2035
- 11.1 Market Size and Analysis
- 11.1.1 Revenue (Market Measurement: 2025: USD 41.49 billion → 2035: USD 86.33 billion)
- 11.1.2 Historical Market Size, 2018-2025
- 11.1.3 Base-Year Market Size, 2025
- 11.2 Market Forecast, 2025-2035
- 11.2.1 Revenue Forecast to 2035
- 11.2.2 CAGR and Year-on-Year Growth
- 11.2.3 Incremental Revenue Opportunity
- 11.3 Forecast Assumptions and Scenario Analysis
- 11.3.1 Base-Case Forecast
- 11.3.2 Optimistic and Conservative Scenarios
- 11.3.3 Technology, Pricing and Policy Sensitivities
- 11.4 Market Attractiveness and Growth Outlook
Chapter 12 Egypt Remittance Market Segmentation and Outlook
- 12.1 Segmentation Summary and Market Shares, 2025
- 12.2 Largest and Fastest-Growing Segments
- 12.3 By Receiving Channel - Market Size and Forecast, 2025-2035
- 12.3.1 Segment Definition and Scope
- 12.3.2 Historical Market Size, 2018-2025
- 12.3.3 Revenue Forecast, 2025-2035
- 12.3.4 Base-Year Market Share, 2025
- 12.3.5 Segment CAGR and Growth Drivers
- 12.3.6 Subsegment Market Size and Forecast
- 12.3.6.1 State-Owned Banks
- 12.3.6.2 Money Transfer Operators
- 12.3.6.3 Private and Foreign Banks
- 12.3.6.4 Digital Fintech Platforms
- 12.3.7 Subsegment Pricing and Adoption Trends
- 12.3.8 Leading Suppliers and Competition
- 12.3.9 Regional Demand and Opportunities
- 12.4 By Settlement Method - Market Size and Forecast, 2025-2035
- 12.4.1 Segment Definition and Scope
- 12.4.2 Historical Market Size, 2018-2025
- 12.4.3 Revenue Forecast, 2025-2035
- 12.4.4 Base-Year Market Share, 2025
- 12.4.5 Segment CAGR and Growth Drivers
- 12.4.6 Subsegment Market Size and Forecast
- 12.4.6.1 Bank Account Credit
- 12.4.6.2 Cash Pickup
- 12.4.6.3 Mobile Wallet Credit
- 12.4.6.4 Card and Prepaid Credit
- 12.4.7 Subsegment Pricing and Adoption Trends
- 12.4.8 Leading Suppliers and Competition
- 12.4.9 Regional Demand and Opportunities
- 12.5 By Customer Segment - Market Size and Forecast, 2025-2035
- 12.5.1 Segment Definition and Scope
- 12.5.2 Historical Market Size, 2018-2025
- 12.5.3 Revenue Forecast, 2025-2035
- 12.5.4 Base-Year Market Share, 2025
- 12.5.5 Segment CAGR and Growth Drivers
- 12.5.6 Subsegment Market Size and Forecast
- 12.5.6.1 GCC Contract Workers
- 12.5.6.2 Skilled Professionals Abroad
- 12.5.6.3 Permanent Diaspora Households
- 12.5.6.4 Foreign Residents and Outbound Senders
- 12.5.7 Subsegment Pricing and Adoption Trends
- 12.5.8 Leading Suppliers and Competition
- 12.5.9 Regional Demand and Opportunities
- 12.6 By Transfer Purpose - Market Size and Forecast, 2025-2035
- 12.6.1 Segment Definition and Scope
- 12.6.2 Historical Market Size, 2018-2025
- 12.6.3 Revenue Forecast, 2025-2035
- 12.6.4 Base-Year Market Share, 2025
- 12.6.5 Segment CAGR and Growth Drivers
- 12.6.6 Subsegment Market Size and Forecast
- 12.6.6.1 Family Maintenance
- 12.6.6.2 Real Estate and Investment
- 12.6.6.3 Savings and Asset Accumulation
- 12.6.6.4 Education and Healthcare
- 12.6.7 Subsegment Pricing and Adoption Trends
- 12.6.8 Leading Suppliers and Competition
- 12.6.9 Regional Demand and Opportunities
- 12.7 By Corridor - Market Size and Forecast, 2025-2035
- 12.7.1 Segment Definition and Scope
- 12.7.2 Historical Market Size, 2018-2025
- 12.7.3 Revenue Forecast, 2025-2035
- 12.7.4 Base-Year Market Share, 2025
- 12.7.5 Segment CAGR and Growth Drivers
- 12.7.6 Subsegment Market Size and Forecast
- 12.7.6.1 Saudi Arabia
- 12.7.6.2 United Arab Emirates
- 12.7.6.3 Other GCC and Jordan
- 12.7.6.4 Europe
- 12.7.6.5 North America and Other Corridors
- 12.7.7 Subsegment Pricing and Adoption Trends
- 12.7.8 Leading Suppliers and Competition
- 12.7.9 Regional Demand and Opportunities
- 12.8 Segment Growth Comparison
- 12.9 Segment Attractiveness and Priority Matrix
Chapter 13 Egypt Remittance End-Use and Application Market Outlook
- 13.1 End-Use Industry and Customer Demand Structure
- 13.2 Leading Applications and Customer Groups
- 13.3 End-Use Market Size, Share and Forecast
- 13.4 Major End-Use Industry Deep Dives
- 13.4.1 Customer Requirements and Use Cases
- 13.4.2 Demand and Replacement Cycles
- 13.4.3 Technical and Regulatory Considerations
- 13.4.4 Purchasing and Procurement Models
- 13.4.5 Leading Vendors and Distribution Channels
- 13.4.6 Forecast and Commercial Opportunities
- 13.5 Emerging Applications and Cross-Segment Demand
- 13.6 End-Use Industry Investment Priorities
Chapter 14 Egypt Remittance Geographic Market Outlook, 2025-2035
- 14.1 Regional Market Size and Country-Level Shares, 2025
- 14.2 Country Market Size Comparison, 2025
- 14.3 Country Market Forecasts, 2025-2035
- 14.4 Subregional Industrial and Demand Clusters
- 14.5 Intra-Regional Pricing and Cost Differences
- 14.6 Cross-Border Trade and Supply Networks
- 14.7 Regional Supply and Demand Balances
- 14.8 Country Opportunity Comparison and Prioritization
Note: Every listed country is covered on the structure shown under the first country.
Chapter 15 Egypt Remittance Technology, Innovation and Sustainability Outlook
- 15.1 Technology Landscape and Maturity
- 15.2 Product, Process and Service Innovation
- 15.3 AI, Automation and Digital Tools in the Industry
- 15.4 Technology Adoption and Performance Benchmarking
- 15.5 Innovation Pipeline and R&D Investment
- 15.6 Energy Efficiency and Resource Management
- 15.7 Sustainability, Recycling and Circularity
- 15.8 Technology Roadmap, 2025-2035
- 15.9 Risks of Obsolescence and Technology Substitution
Chapter 16 Egypt Remittance Market Key Strategic Imperatives
- 16.1 Growth and Market Entry Priorities
- 16.2 High-Return Products and Segments
- 16.3 Pricing, Profitability and Cost Optimization
- 16.4 Technology Investment and Product Differentiation
- 16.5 Supply Chain Localization and Resilience
- 16.6 Distribution and Customer Acquisition
- 16.7 Partnership, Acquisition and Capacity Strategy
- 16.8 Regional Expansion Priorities
- 16.9 Short-, Medium- and Long-Term Actions
Chapter 17 Competition Outlook
- 17.1 Industry Competition Characteristics
- 17.2 Market Structure and Concentration
- 17.3 Market Share and Competitive Positioning, 2025
- 17.4 Company-Wise Revenue and Product Benchmarking
- 17.5 Production and Service Capacity Benchmarking
- 17.6 Technology, Pricing and Differentiation
- 17.7 Regional Footprint and Distribution Strength
- 17.8 Mergers, Acquisitions and Strategic Alliances
- 17.9 New Entrants and Competitive Threats
- 17.10 Porter's Five Forces and Industry Attractiveness
- 17.11 Competitive Outlook, 2025-2035
Chapter 18 Company Profiles
- 18.1 Company Coverage and Selection Criteria
- 18.2 National Bank of Egypt
- 18.2.1 Business Description
- 18.2.2 Company Ownership and Geographic Presence
- 18.2.3 Product and Service Portfolio
- 18.2.4 Manufacturing and Operating Footprint
- 18.2.5 Financial Performance and Investment
- 18.2.6 Market Share and Competitive Position
- 18.2.7 Technology and Innovation Capabilities
- 18.2.8 Strategic Alliances or Partnerships
- 18.2.9 Recent Developments
- 18.2.10 Growth Strategy and Outlook
- 18.3 Banque Misr
- 18.4 Banque du Caire
- 18.5 Commercial International Bank
- 18.6 QNB Egypt
- 18.7 Arab African International Bank
- 18.8 Western Union
- 18.9 MoneyGram
- 18.10 Ria Money Transfer
- 18.11 LemFi
- 18.12 Other Relevant Market Participants
Note: Every listed company is profiled on the structure shown under the first company. The company list is preliminary and may change based on research findings, market developments, data availability and client requirements.
Chapter 19 Disclaimer
- 19.1 Research and Forecast Disclaimer
- 19.2 Data Source and Estimation Limitations
Note: The depth of individual sections depends on data availability for this market. Volume, capacity, trade and other unit-based metrics are included where applicable.

