Wallet revenue triples as payments move beyond transfers
The Middle East and Africa digital wallet market was valued at USD 7.36 billion in 2025 and is projected to increase from USD 8.24 billion in 2026 to USD 22.86 billion by 2035, registering a CAGR of 12.00% during 2025–2035. Demand comes from unbanked adults who open a mobile money wallet as their first financial account, from merchants moving from cash to QR and till payments, from wallet credit and savings products, and from Gulf governments pushing cashless payments. East Africa held the largest sub-regional share, 34.0% of 2025 revenue, anchored by Kenya's M-PESA, while North Africa is the fastest-growing sub-region at 14.81% a year. The main commercial change is a shift in where providers earn money. Transfer fees face caps and taxes, so revenue growth now comes from merchant payments, credit and savings, while Gulf and Egyptian regulators open the market to licensed fintech and device wallets.
How do wallet providers in the region earn revenue?
Wallet providers earn fees on agent cash-in and cash-out, transfers, bill and airtime payments and remittances, plus merchant discount fees and margins on wallet-linked credit and savings. African telecom groups run most wallets through agent networks serving basic phones, while Gulf banks, telecom-backed wallets and licensed fintechs serve card-holding smartphone users. Revenue per user rises as people move from transfers to shopping, saving and borrowing.
The market includes telco mobile money wallets, fintech and bank app wallets, super-app and merchant wallets and pass-through device wallets that tokenize bank cards, counted at provider fees only. It excludes the value moved through wallets, which the GSMA puts above USD 2 trillion worldwide for mobile money in 2025, card scheme and acquirer revenue not reaching a wallet provider, and bank fees and lending unrelated to wallets.
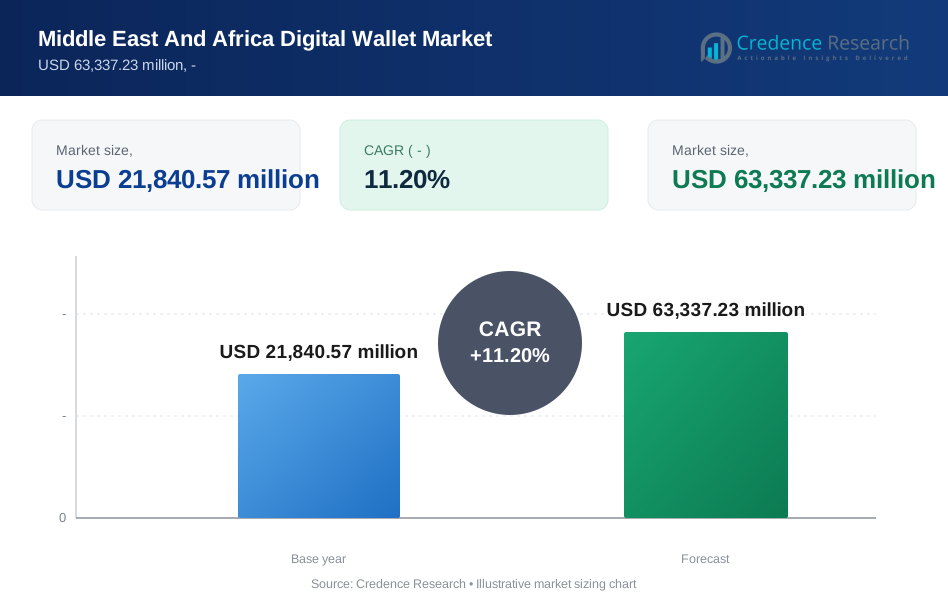
Middle East and Africa Digital Wallet Market Insights
- The Middle East and Africa digital wallet market is projected to grow from USD 8.24 billion in 2026 to USD 22.86 billion by 2035, a 12.00% CAGR, as wallets add merchant and credit services.
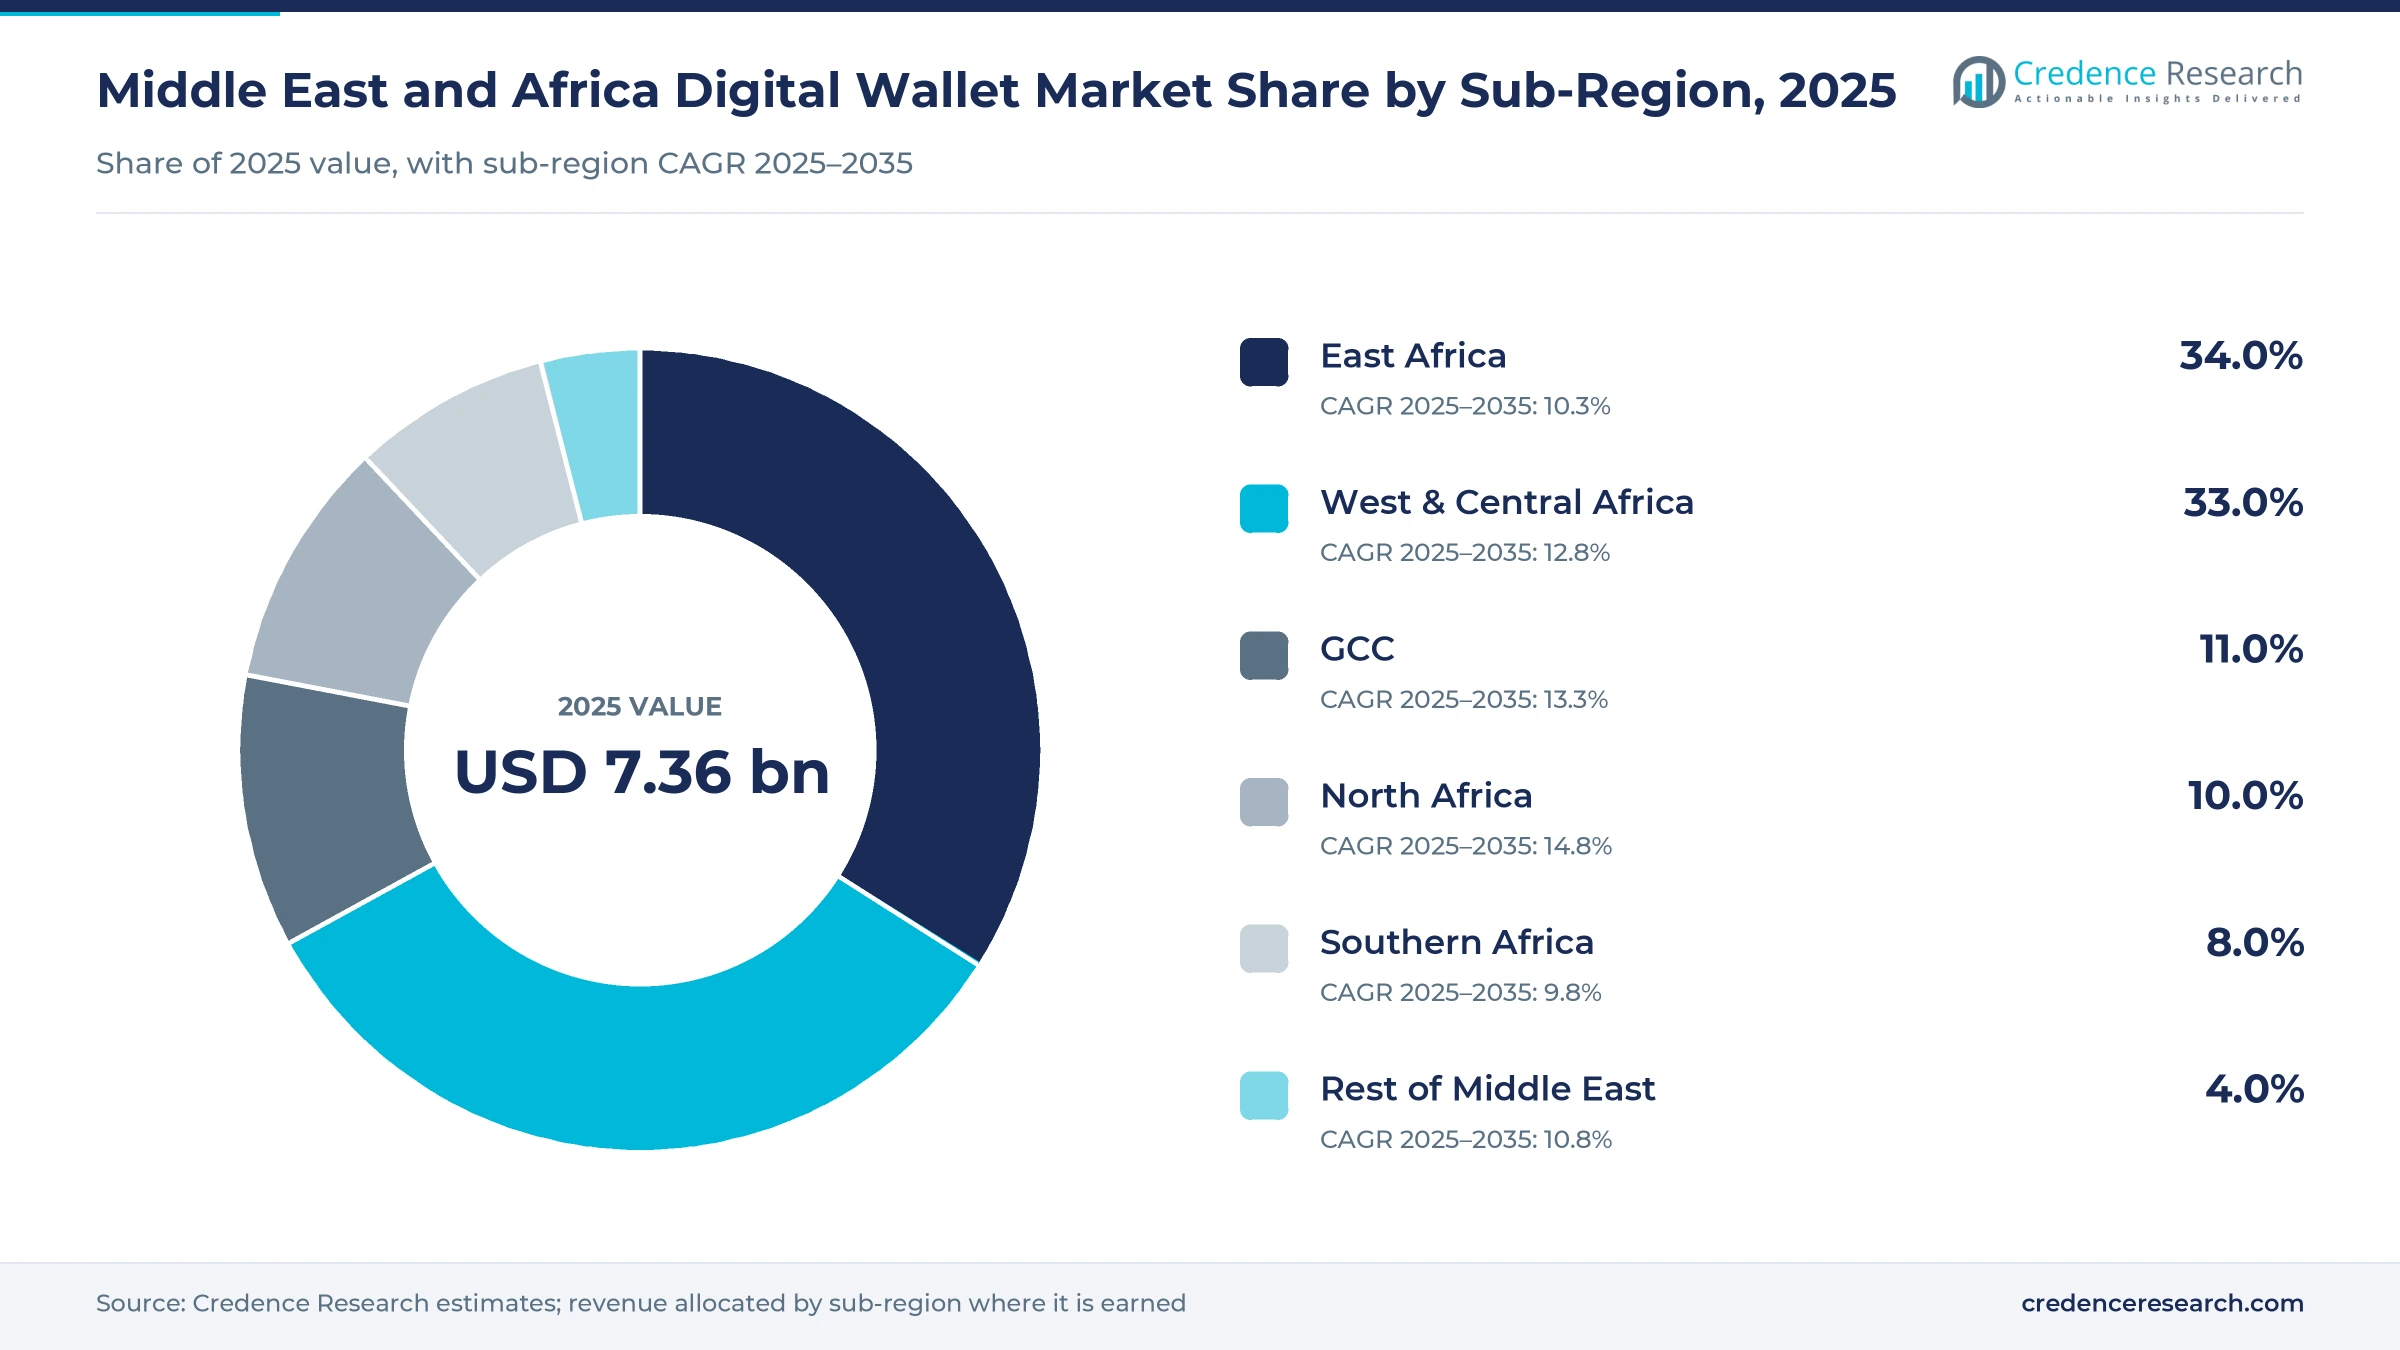
- East Africa held 34.0% of 2025 revenue, the largest sub-regional share, because M-PESA in Kenya and mobile money in Tanzania, Uganda and Ethiopia run deep ecosystems.
- Telco mobile money wallets accounted for 66.0% of 2025 revenue, the largest wallet type, because telecom groups built agent networks on basic phones before smartphones spread.
- Revenue is shifting from transfer fees toward merchant payments, the fastest-growing use case at 17.13% a year over 2025–2035, as QR and till payments replace cash.
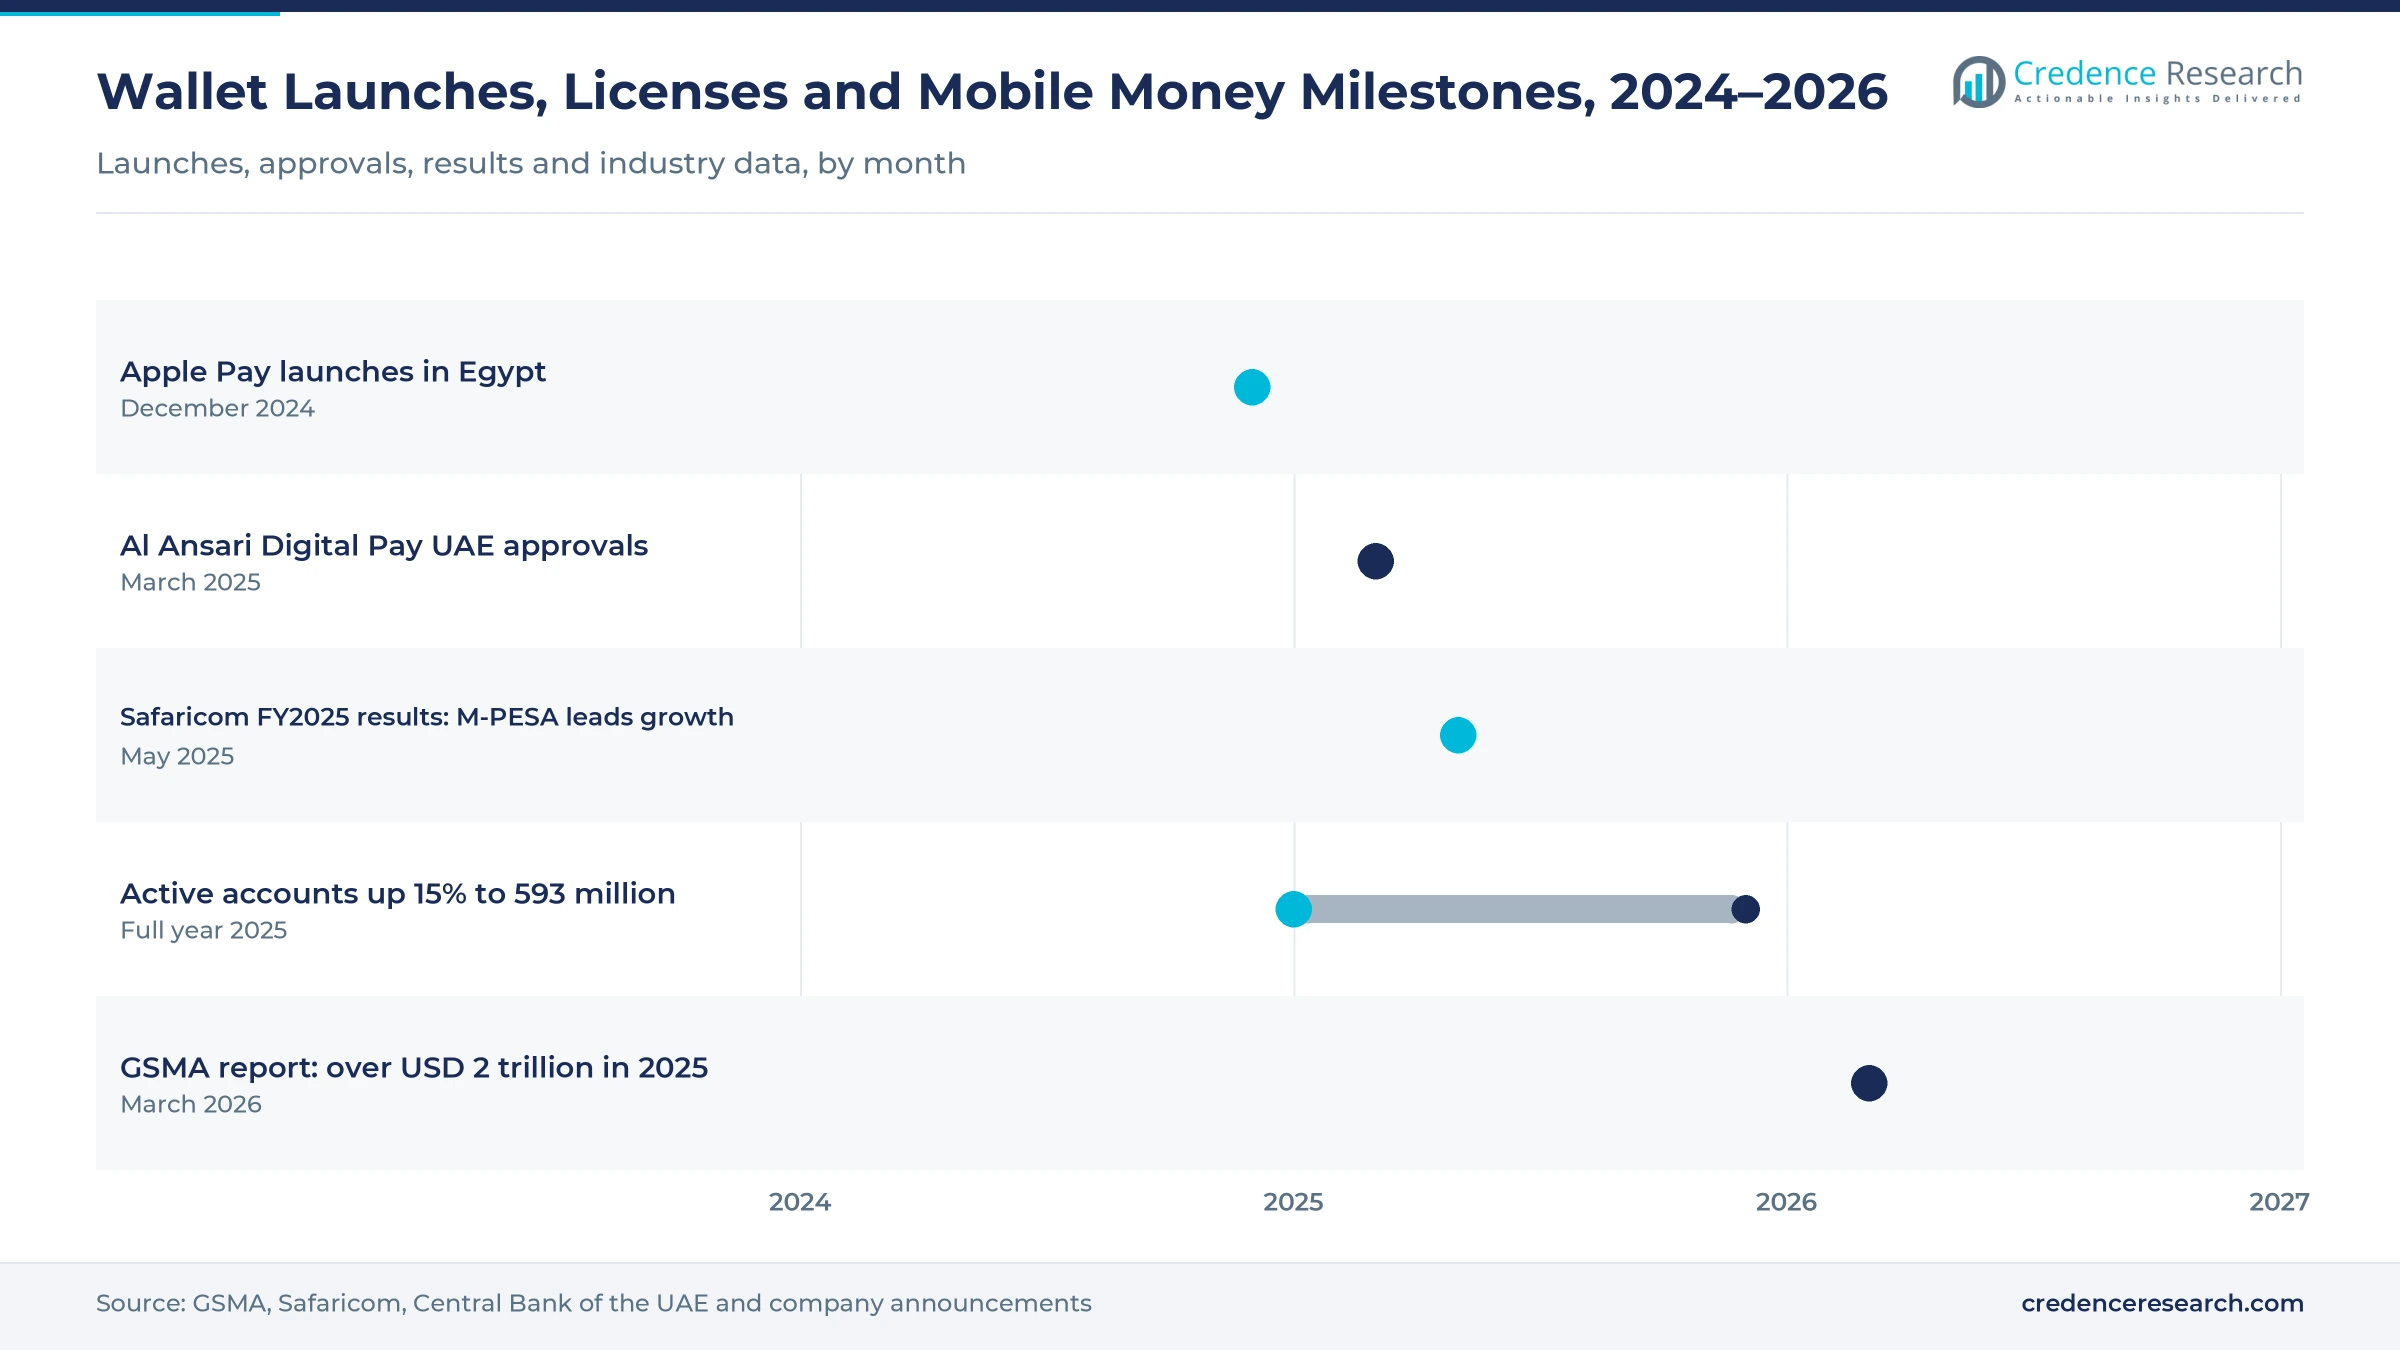
- Gulf central banks are licensing non-bank wallets, such as Al Ansari Digital Pay in March 2025, while Apple Pay's December 2024 Egypt launch brings device wallets to North Africa.
Telco wallets lead as fintech and merchant payments surge
Telco mobile money leads by wallet type while fintech and bank app wallets grow fastest
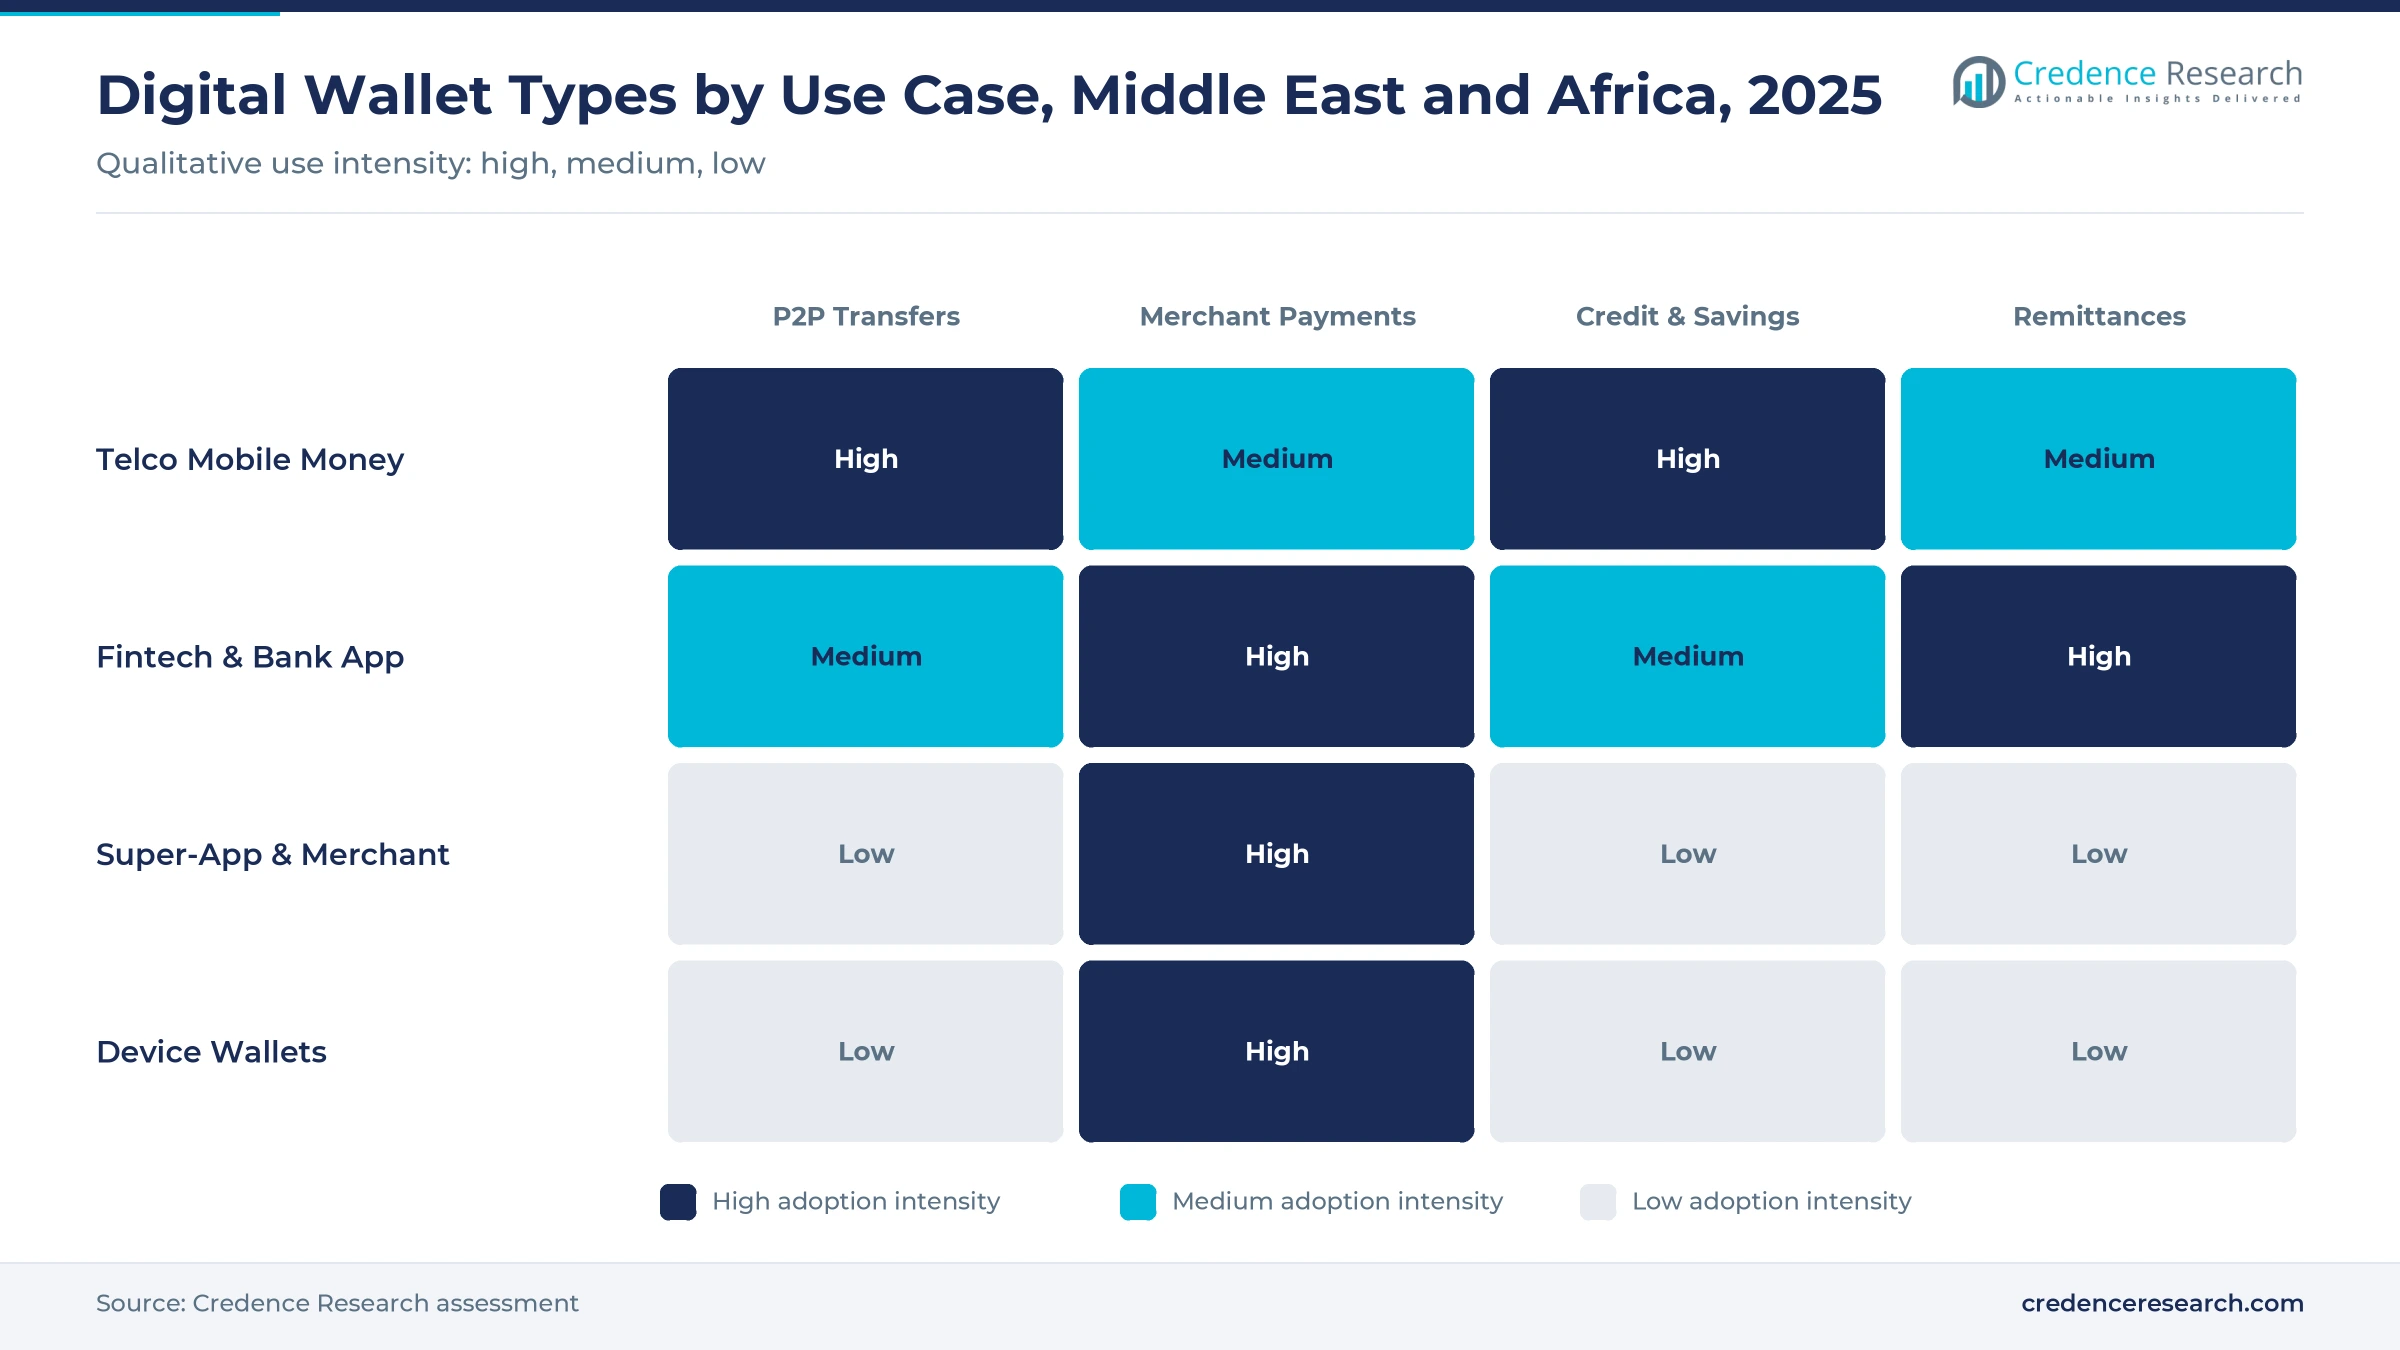
Based on wallet type, the market is categorized into telco mobile money wallets, fintech and bank app wallets, super-app and merchant wallets and pass-through device wallets. Telco mobile money wallets led with 66.0% of 2025 revenue, because Safaricom, MTN, Airtel Africa, Orange and Vodacom built agent networks on basic phones long before smartphones spread. Fintech and bank app wallets grow fastest at 15.03% a year as Nigerian challengers and Gulf licensees win users with low fees and app services.
Transfers lead use case revenue while merchant payments grow fastest
Based on use case, the market is categorized into person-to-person transfers, cash-in and cash-out, merchant payments, wallet credit and savings, bill and airtime payments and international remittances. Person-to-person transfers led with 34.0% of 2025 revenue, because sending money to family remains the core reason people open a wallet. Merchant payments grow fastest at 17.13% a year as providers push QR, till and online checkout.
| Segment Group | Leading Sub-segment | Share, 2025 | Fastest-growing Sub-segment | CAGR, 2025–2035 |
|---|---|---|---|---|
| By Wallet Type | Telco Mobile Money Wallets | 66.0% | Fintech & Bank App Wallets | 15.03% |
| By Use Case | P2P Transfers | 34.0% | Merchant Payments | 17.13% |
Request a Free Sample
Fill in your details and we'll send you a free sample report.
- Sample data tables & charts
- Research methodology
Unbanked adults, merchant QR and wallet credit lift revenue
Mobile money is the first financial account for millions of unbanked adults
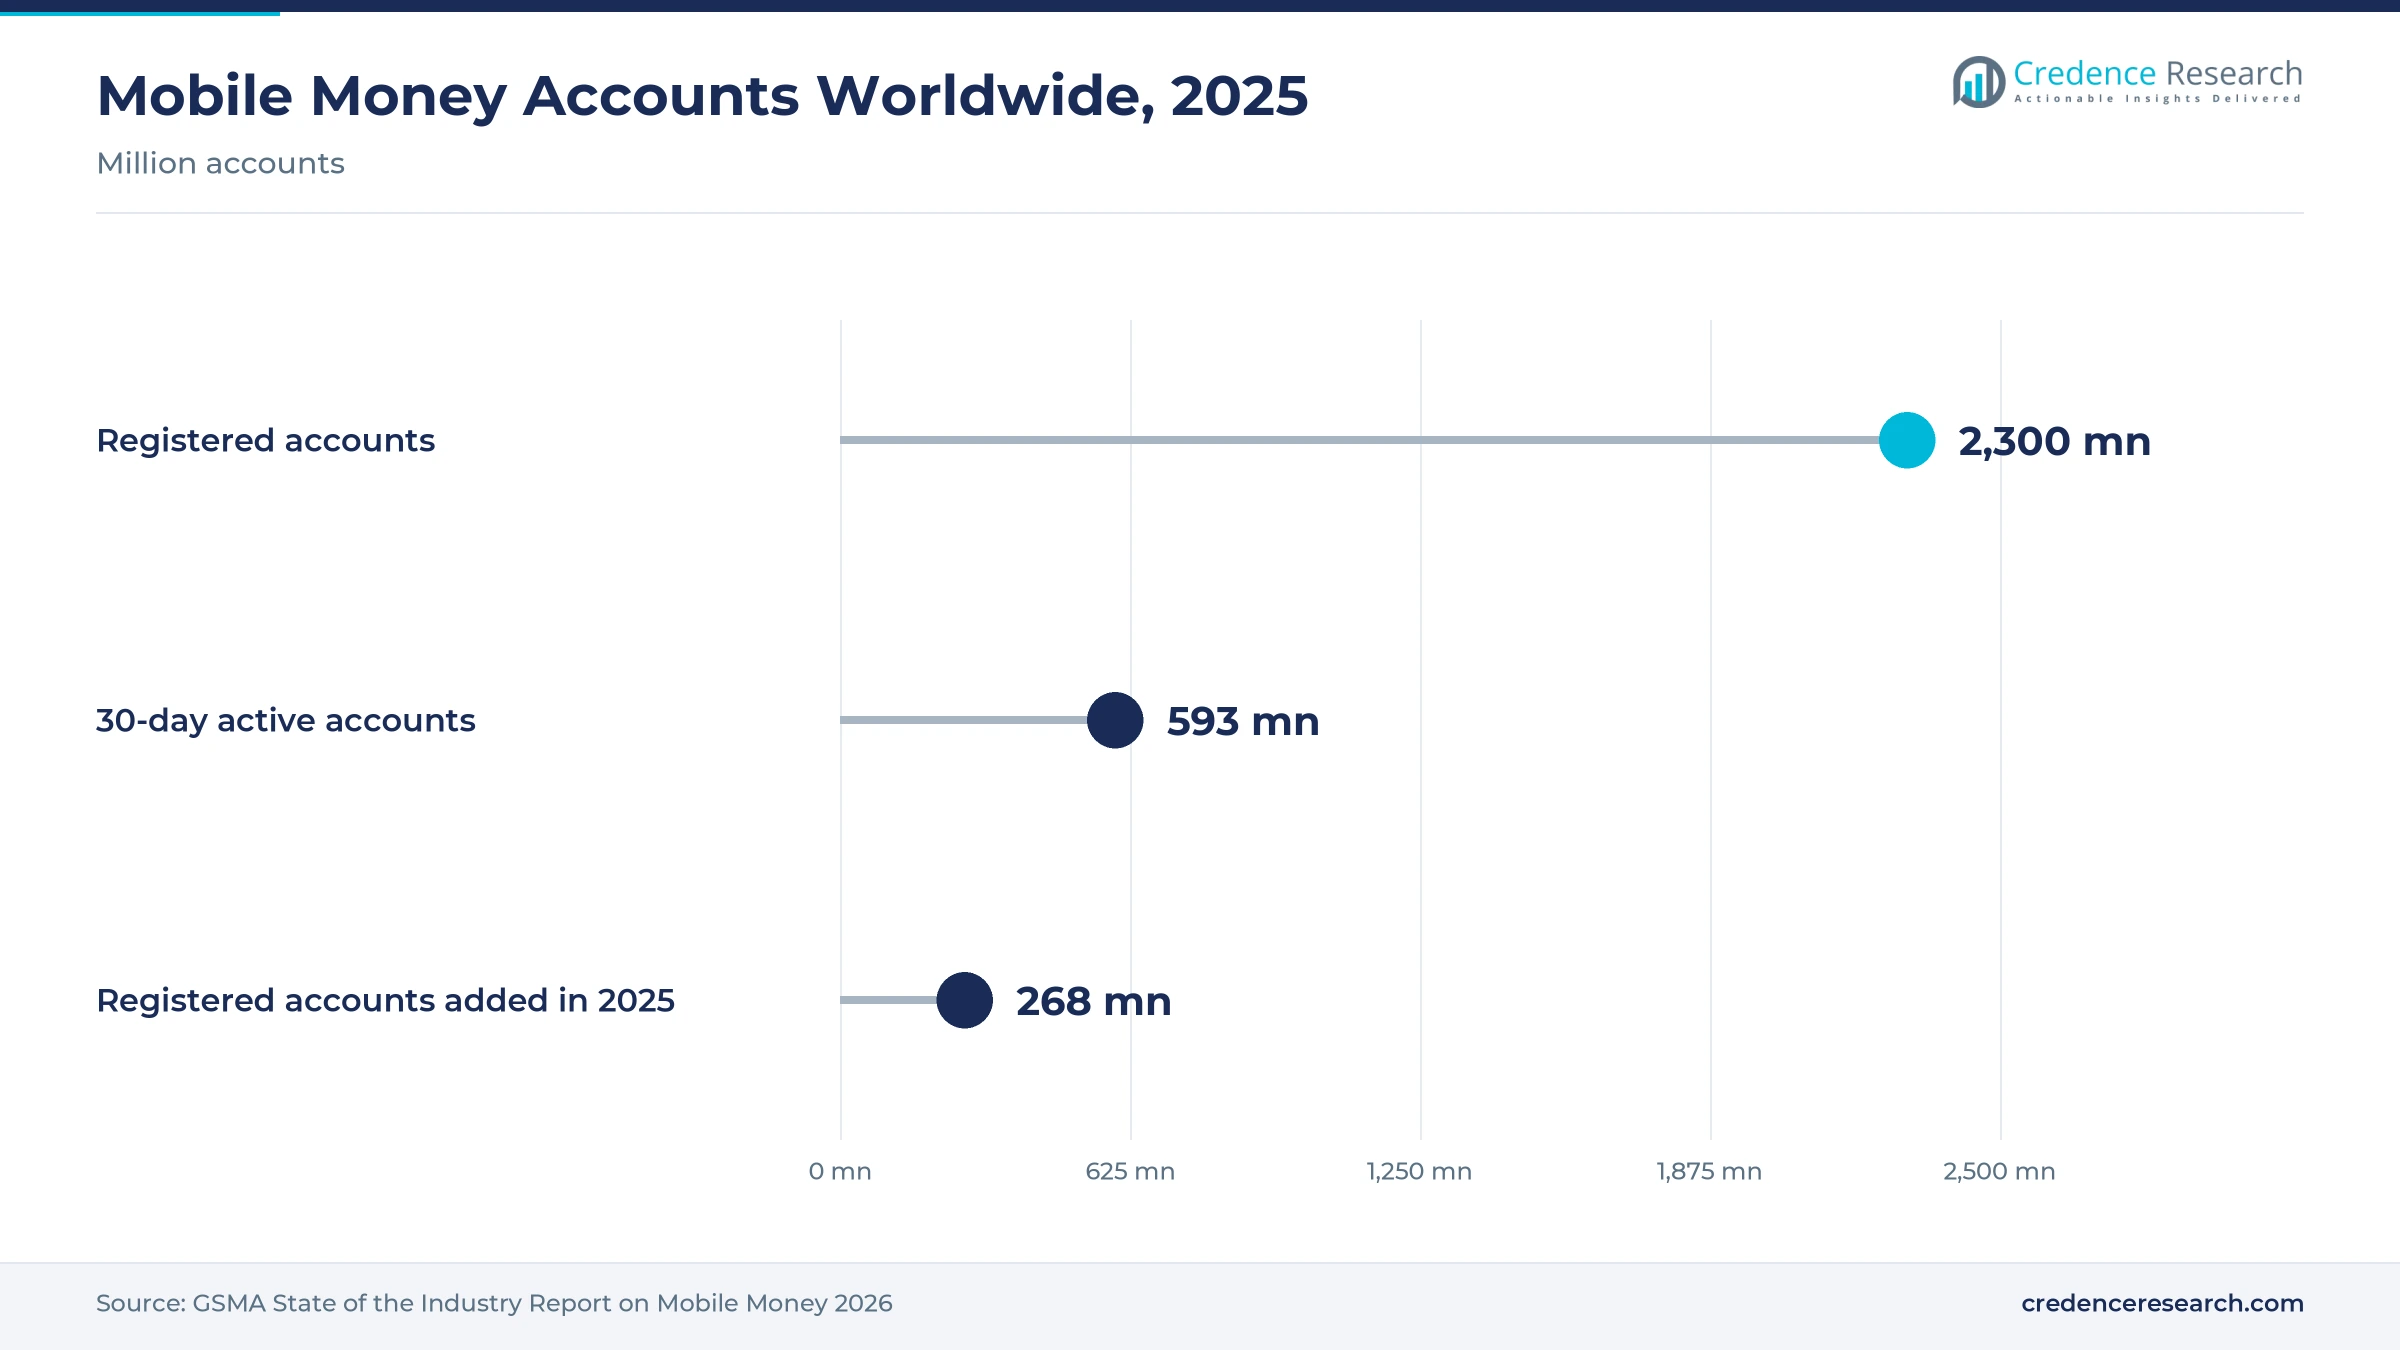
In much of Africa, a mobile money wallet is the first financial account people open, reached through agents and basic phones rather than bank branches. The GSMA reports that registered mobile money accounts reached 2.3 billion worldwide in 2025, up 268 million, and that most new registered and active accounts came from Sub-Saharan Africa. Telecom groups and fintechs in East and West Africa capture most of this demand, because their agent networks reach users on basic phones far from bank branches.
Merchant QR and till payments replace cash at the counter
Transfer fees are under pressure from regulators and free bank-app transfers, so providers are pushing merchant QR codes, till numbers and online checkout, which earn a fee on each sale. Small shops in Kenya, Nigeria, Ghana and Egypt are the main targets, along with online sellers in the Gulf. Merchant payments are the fastest-growing use case at 17.13% a year, and the shift raises revenue per active account over the medium term as more of the 593 million active accounts pay at shops.
Wallet credit, savings and insurance earn more per user than transfers
Overdrafts, nano-loans and savings linked to wallets earn more per user than transfers. The GSMA found that credit is the most widely offered adjacent mobile money service, nearly matched by savings, and that the number of providers offering insurance rose by one-third in 2025. Safaricom's FY2025 full-year results, published in May 2025, show M-PESA, which includes overdraft and savings services, as its main growth engine.
Gulf cashless policies and new licenses pull payments into wallets
Saudi Arabia, the UAE and Qatar are pushing cashless payments through national schemes, instant payment systems and new wallet licenses. In March 2025, Al Ansari Digital Pay received final Central Bank of the UAE approvals for stored value and retail payment licenses ahead of its wallet launch, as Bridge MENA reported. The GCC held 11.0% of 2025 revenue and grows at 13.31% a year, as banks, STC Bank, e& money and licensed fintechs compete for users.
Tokenized cards and interoperability reshape wallets
Device wallets tokenize bank cards in Egypt and the Gulf
Apple Pay launched in Egypt on Dec. 10, 2024, with the National Bank of Egypt, Banque Misr and CIB, after the Central Bank of Egypt approved card tokenization rules in 2023. Device wallets from Apple, Google and Samsung already serve Saudi card users alongside bank wallets. This trend moves card payments onto phones, but providers earn only pass-through fees, lifting transaction counts more than wallet revenue.
Interoperability increasingly links wallets and banks through instant payments
Instant payment systems and wallet-to-bank links let users move money across networks, cutting single-operator lock-in and pushing providers to compete on services. Over 60% of mobile money providers tell the GSMA that interoperability, know-your-customer and consumer protection rules have supported their operations. Fintech and bank app wallets benefit most, growing at 15.03% a year.
Activating dormant accounts through merchant and credit services opens an opportunity
Only 25.7% of mobile money accounts worldwide were used in a given month in 2025, according to the GSMA, leaving almost 75% inactive, and activating these users costs less than signing up new ones. Providers adding merchant payments, bill pay, savings and small loans give users a reason to transact monthly. The opportunity is largest in West and Central Africa, with 33.0% of 2025 revenue and 12.81% annual growth, where large registered bases meet fast-growing fintech merchant networks.
Gulf-to-Africa remittances moving from cash agents to wallets offer an opportunity
Gulf-based migrant workers send money home to Africa and South Asia, and wallets are winning these flows from cash agents and exchange houses. Licensed Gulf wallets compete for payroll and remittance customers, while receiving wallets in Kenya, Egypt and Nigeria credit funds to users. Providers holding licenses at both ends of a corridor can earn fees on each side.
Taxes, currency falls and fraud hold wallet revenue back
Fee caps and transaction taxes cut revenue per transfer
Regulators in several African markets cap or tax mobile money transfers, and the GSMA notes that such taxes often push users back to cash, lowering volumes and fees for telecom wallets in East and West Africa. Operators respond by seeking small-transfer exemptions and shifting revenue toward merchant payments, credit, savings and insurance.
Currency falls shrink dollar revenue in Nigeria and Egypt
Wallet revenue is earned in local currencies, so sharp falls in the naira, the Egyptian pound and other currencies cut U.S. dollar revenue even when local transactions grow strongly, hitting multinational groups and investors reporting in dollars or euros. Providers mitigate with inflation-linked pricing, regular fee reviews and more merchant and credit revenue.
Fraud and SIM-swap attacks raise losses and compliance costs
SIM-swap fraud, social engineering and agent fraud raise user losses and provider compliance costs, and the GSMA describes fraud as still widespread. Each high-profile case slows adoption and invites tighter rules, especially in Nigeria and Kenya, where large user bases raise exposure. Providers respond with device binding, new-account limits, agent monitoring and real-time fraud scoring.
Fragmented licensing and data rules slow cross-border expansion
Each country sets its own license, know-your-customer and data rules, making cross-border wallet expansion slow and costly. In GSMA data, 24% of mobile money providers say cross-border data transfer rules have hindered operations. The barrier protects incumbents but limits scale for challengers such as Wave, OPay and Moniepoint, which cut entry costs through regional payment schemes, shared identity checks and local bank partnerships.
East and West Africa lead while North Africa grows fastest
| Sub-Region | Share, 2025 | CAGR, 2025–2035 |
|---|---|---|
| East Africa | 34.0% | 10.31% |
| West & Central Africa | 33.0% | 12.81% |
| GCC | 11.0% | 13.31% |
| North Africa | 10.0% | 14.81% |
| Southern Africa | 8.0% | 9.81% |
| Rest of Middle East | 4.0% | 10.81% |
East Africa has the deepest wallet ecosystem, anchored by M-PESA
East Africa held 34.0% of 2025 revenue and grows at 10.31% a year. Kenya's M-PESA, run by Safaricom, is the region's deepest wallet ecosystem. Ethiopia is opening to new providers, with Ethio Telecom's telebirr and Safaricom's M-PESA competing. Growth trails the 12.00% market average because Kenya is already mature and transfer fees face caps and taxes.
West & Central Africa pairs Francophone mobile money with Nigerian fintech
West & Central Africa held 33.0% of 2025 revenue and grows at 12.81% a year. Ghana, Côte d'Ivoire and Senegal have mature mobile money use led by MTN, Orange and Wave. In Nigeria, fintech wallets from OPay, Moniepoint and PalmPay are growing fast through agent and merchant networks.
GCC cashless policies and new licenses drive card-linked wallets
The GCC held 11.0% of 2025 revenue and grows at 13.31% a year. STC Bank, formerly STC Pay, leads in Saudi Arabia alongside bank and device wallets, while banks, e& money and licensed fintechs compete in the UAE. Remittance and payroll services for migrant workers give Gulf wallets a revenue base that most African wallets lack.
North Africa is the fastest-growing sub-region, led by Egypt and Morocco
North Africa held 10.0% of 2025 revenue and is the fastest-growing sub-region at 14.81% a year. In Egypt, Fawry and Vodafone Cash are major wallet and payment brands alongside newer device wallets. Currency weakness cuts dollar revenue, but rising smartphone use and bank-app payments support growth.
Southern Africa and the rest of the Middle East see bank cards limit wallet revenue
Southern Africa held 8.0% of 2025 revenue and grows at 9.81% a year, the slowest sub-region, because bank cards and banking apps already serve many payments. The rest of the Middle East held 4.0% and grows at 10.81% a year as wallet use spreads from a low base.
Apple Pay, a UAE license and a USD 2 trillion milestone
| Development | Status and market relevance |
|---|---|
| In March 2026, the GSMA announced its State of the Industry Report on Mobile Money 2026, reporting more than USD 2 trillion in 2025 transactions and 593 million 30-day active accounts. | Published. Confirms Sub-Saharan Africa as the main source of new accounts. |
| In May 2025, Safaricom announced its FY2025 full-year results, with M-PESA as its main growth engine. | Reported. Shows wallet services leading telecom revenue growth. |
| In March 2025, Al Ansari Digital Pay received final Central Bank of the UAE approvals for stored value and retail payment licenses ahead of the launch of its wallet. | Licensed. Adds a remittance-led wallet to the UAE market. |
| In December 2024, Apple Pay launched in Egypt with the National Bank of Egypt, Banque Misr and CIB. | Live. Brings device wallets to North Africa's largest market. |
Instant payments, tokenization and credit data shape wallets
- Instant payments through national systems and wallet-to-bank links weaken single-operator lock-in.
- Tokenization of cards lets Apple Pay, Google Pay and Samsung Pay run on bank cards in Egypt and the Gulf.
- Credit scoring uses wallet transaction histories for nano-loan and overdraft decisions.
- Security tools such as device binding, SIM-swap checks and real-time fraud scoring cut losses.
Need a Custom Version of This Report?
Tailor the scope, geography, or segments to your exact requirements.
- Custom geography or segment scope
- Direct access to our analyst team
Telecom groups, fintechs and Gulf wallets compete for users
Competition splits into three groups, led by telecom groups running mobile money across Africa, including Vodacom, which has controlled Safaricom and its M-PESA in Kenya and Ethiopia since June 2026 and also runs M-Pesa in Tanzania, the Democratic Republic of Congo, Mozambique and Lesotho, MTN with MoMo, Airtel Africa with Airtel Money, Orange with Orange Money and Ethio Telecom with telebirr. Fintech challengers compete on low fees and merchant networks, led by Wave in Senegal and Côte d'Ivoire and by OPay, Moniepoint and PalmPay in Nigeria, while Fawry and Vodacom's Vodafone Cash are major in Egypt. Bank-led and licensed wallets, including STC Bank in Saudi Arabia and e& money in the UAE, compete with device wallets for card-linked payments. Agent networks and licenses are the main entry barriers for new providers. No provider reports wallet revenue for the region on a comparable basis, so no share ranking is given.
Telecom groups, fintechs and Gulf wallets profiled, with their roles
| Company | Type | Role in the market |
|---|---|---|
| Vodacom Group | Telecom group | Controls Safaricom M-PESA, runs M-Pesa in four markets and Vodafone Cash in Egypt |
| MTN | Telecom group | MoMo mobile money |
| Airtel Africa | Telecom group | Airtel Money mobile money |
| Orange | Telecom group | Orange Money mobile money |
| Ethio Telecom | Telecom operator | telebirr wallet in Ethiopia |
| Wave | Fintech challenger | Low-fee wallet in Senegal and Côte d'Ivoire |
| OPay | Fintech challenger | Wallet and merchant payments in Nigeria |
| Moniepoint | Fintech challenger | Agent and merchant payments in Nigeria |
| PalmPay | Fintech challenger | Mobile wallet in Nigeria |
| Fawry | Payments company | Bill and wallet payments in Egypt |
| STC Bank | Digital bank | Formerly STC Pay; leading wallet in Saudi Arabia |
| e& money | Telco-backed wallet | Wallet in the UAE |
Wallets are moving from moving money to managing it
Credence Research's view is that transfers still earn the largest share, but merchant payments, credit and savings add most new revenue as fee caps and taxes squeeze transfers. With only 25.7% of accounts worldwide used in a given month, the room to deepen use is large.
How wallet provider revenue was sized for the region
The report uses 2025 as the base year and forecasts to 2035, with CAGR calculated over 2025–2035. Market values come from Credence Research's market model, built from listed operators' fintech and mobile money disclosures, active wallet users times revenue per user, and central bank payment data; segment and sub-regional splits are Credence Research estimates. Supporting evidence comes from GSMA industry data, operator results and regulator announcements, though currency moves limit U.S. dollar precision.
Merchant, credit and remittance services set the pace
Through 2035, regional wallets will earn more from merchant payments, credit, savings and remittances and less from simple transfers. Telco mobile money, at 66.0% of 2025 revenue, will remain the largest wallet type, while fintech and bank app wallets gain share as smartphones spread and Gulf regulators license new providers. East Africa, growing 10.31% a year, stays the largest sub-region, while North Africa and the GCC grow fastest. The pace will depend on transaction taxes, currency stability, fraud control and wallet-bank interoperability.
Frequently Asked Questions
What was the size of the Middle East and Africa digital wallet market in 2025?
What is the forecast value and CAGR of the Middle East and Africa digital wallet market?
Does the market size measure the value of wallet payments?
Which sub-region holds the largest share of the market?
Which wallet type leads the market?
Which use case earns the most wallet revenue?
Who are the major companies in the Middle East and Africa digital wallet market?
What challenges could slow the Middle East and Africa digital wallet market?
Table of Content
Chapter 1 Market Segmentation
- 1.1 Segmentation Framework
- 1.1.1 Product and Service Classification
- 1.1.2 Application and End-Use Classification
- 1.1.3 Technology and Solution Classification
- 1.1.4 Customer and Distribution Channel Classification
- 1.1.5 Geographic Segmentation
- 1.1.6 Market Segment Definitions and Boundaries
- 1.2 By Wallet Type
- 1.2.1 Telco Mobile Money Wallets
- 1.2.2 Fintech & Bank App Wallets
- 1.2.3 Super-App & Merchant Wallets
- 1.2.4 Pass-Through Device Wallets
- 1.3 By Use Case
- 1.3.1 P2P Transfers
- 1.3.2 Cash-In & Cash-Out
- 1.3.3 Merchant Payments
- 1.3.4 Wallet Credit & Savings
- 1.3.5 Bill & Airtime Payments
- 1.3.6 International Remittances
- 1.4 By Sub-Region
- 1.4.1 East Africa
- 1.4.2 West & Central Africa
- 1.4.3 GCC
- 1.4.4 North Africa
- 1.4.5 Southern Africa
- 1.4.6 Rest of Middle East
Chapter 2 Introduction
- 2.1 Report Objectives and Scope
- 2.2 Product Definition and Industry Terminology
- 2.3 Market Inclusions and Exclusions
- 2.4 Research Process
- 2.4.1 Primary Research and Expert Interviews
- 2.4.2 Secondary Research and Source Review
- 2.4.3 Top-Down and Bottom-Up Estimation
- 2.4.4 Data Triangulation and Verification
- 2.5 Market Size Measurement Basis
- 2.5.1 2025: USD 7.36 billion → 2035: USD 22.86 billion
- 2.6 Historical and Forecast Reference Periods
- 2.6.1 Historical Period: 2018-2025
- 2.6.2 Base Year: 2025
- 2.6.3 Forecast Period: 2025-2035
- 2.7 Research Assumptions and Limitations
Chapter 3 Executive Summary
- 3.1 Market Snapshot and Key Findings
- 3.2 Base-Year Market Size, 2025
- 3.3 Forecast Market Size, 2035
- 3.4 Revenue and Volume Growth Outlook
- 3.5 Key Demand and Supply Indicators
- 3.6 Leading Market Segments
- 3.7 Fastest-Growing Market Opportunities
- 3.8 Regional Performance Highlights
- 3.9 Technology and Industry Transformation
- 3.10 Competitive Landscape Summary
- 3.11 Analyst View and Strategic Implications
Chapter 4 Middle East and Africa Digital Wallet Market Trends and Developments
- 4.1 Historical Industry Development, 2018-2025
- 4.2 Recent Market Trends and Developments
- 4.3 Demand and Customer Behavior Trends
- 4.4 Technology and Product Innovation
- 4.5 Artificial Intelligence, Automation and Digitalization
- 4.6 Local Manufacturing and Supply Chain Realignment
- 4.7 Industry Partnerships, Mergers and Acquisitions
- 4.8 Sustainability and Circular Economy Developments
- 4.9 Government and Private Sector Investment Trends
- 4.10 Emerging Business Models and Commercialization
- 4.11 Industry Developments and Announcements
Chapter 5 Middle East and Africa Digital Wallet Market Supply and Demand Analysis
- 5.1 Demand Trend and Consumption Analysis, 2018-2025
- 5.2 Demand Forecast, 2025-2035
- 5.3 Supply Chain Structure and Procurement Trends
- 5.4 Supply-Demand Gap and Bottlenecks
- 5.5 Import Dependence and Sourcing Structure
- 5.6 Regional Supply and Demand Concentration
Chapter 6 Middle East and Africa Digital Wallet Market Pricing Analysis
- 6.1 Pricing Structure and Measurement
- 6.2 Historical Pricing Trends, 2018-2025
- 6.3 Pricing Outlook, 2025-2035
- 6.4 Pricing by Product and Market Segment
- 6.5 Geographic Pricing Differences
- 6.6 Key Input, Energy, Labor and Logistics Costs
- 6.7 Contract Pricing and Purchasing Models
- 6.8 Pricing Sensitivity and Competitive Positioning
- 6.9 Price, Margin and Profitability Implications
Chapter 7 Middle East and Africa Digital Wallet Market Dynamics
- 7.1 Market Growth Drivers
- 7.1.1 Demand-Side Drivers
- 7.1.2 Technology and Innovation Drivers
- 7.1.3 Infrastructure and Investment Drivers
- 7.1.4 Regulatory and Policy Drivers
- 7.2 Market Restraints
- 7.2.1 Cost and Affordability Constraints
- 7.2.2 Technology and Adoption Barriers
- 7.2.3 Supply Chain and Operational Constraints
- 7.3 Market Challenges
- 7.3.1 Competitive Pressure and Margin Erosion
- 7.3.2 Skills, Infrastructure and Implementation Gaps
- 7.4 Emerging Market Opportunities
- 7.5 Market Dynamics Impact and Time-Horizon Assessment
Chapter 8 Middle East and Africa Digital Wallet Value Chain Analysis
- 8.1 Industry Value Chain Overview
- 8.2 Upstream Suppliers and Critical Inputs
- 8.3 Technology and Component Providers
- 8.4 Manufacturing or Service Delivery
- 8.5 Distribution, Channel Partners and Integrators
- 8.6 Downstream Applications and End Users
- 8.7 Value Addition and Profit Pools
- 8.8 Vertical Integration and Outsourcing
- 8.9 Supplier Concentration and Risk
- 8.10 Supply Chain Localization and Resilience
Chapter 9 Middle East and Africa Digital Wallet Market Regulations and Policies
- 9.1 Relevant Laws, Standards and Compliance Frameworks
- 9.2 Product, Service, Safety and Quality Requirements
- 9.3 Government Policies, Incentives and Subsidies
- 9.4 Imports, Exports and Trade Barriers
- 9.5 Public Procurement and Local Content Requirements
- 9.6 Data Protection, AI and Cybersecurity Compliance
- 9.7 Upcoming Policy Changes and Market Implications
Chapter 10 Middle East and Africa Digital Wallet Market Hotspots and Opportunities
- 10.1 Market Opportunity Mapping and Growth Hotspots
- 10.2 High-Growth Applications and Customer Groups
- 10.3 Underserved Markets and White-Space Opportunities
- 10.4 Emerging Technology and Product Opportunities
- 10.5 New Capacity and Investment Hotspots
- 10.6 Market Entry and Expansion Opportunities
- 10.7 Distribution and Partnership Opportunities
- 10.8 Near-Term and Long-Term Commercial Potential
- 10.9 Opportunity Attractiveness and Execution Risks
Chapter 11 Middle East and Africa Digital Wallet Market Outlook, 2025-2035
- 11.1 Market Size and Analysis
- 11.1.1 Revenue (Market Measurement: 2025: USD 7.36 billion → 2035: USD 22.86 billion)
- 11.1.2 Historical Market Size, 2018-2025
- 11.1.3 Base-Year Market Size, 2025
- 11.2 Market Forecast, 2025-2035
- 11.2.1 Revenue Forecast to 2035
- 11.2.2 CAGR and Year-on-Year Growth
- 11.2.3 Incremental Revenue Opportunity
- 11.3 Forecast Assumptions and Scenario Analysis
- 11.3.1 Base-Case Forecast
- 11.3.2 Optimistic and Conservative Scenarios
- 11.3.3 Technology, Pricing and Policy Sensitivities
- 11.4 Market Attractiveness and Growth Outlook
Chapter 12 Middle East and Africa Digital Wallet Market Segmentation and Outlook
- 12.1 Segmentation Summary and Market Shares, 2025
- 12.2 Largest and Fastest-Growing Segments
- 12.3 By Wallet Type - Market Size and Forecast, 2025-2035
- 12.3.1 Segment Definition and Scope
- 12.3.2 Historical Market Size, 2018-2025
- 12.3.3 Revenue Forecast, 2025-2035
- 12.3.4 Base-Year Market Share, 2025
- 12.3.5 Segment CAGR and Growth Drivers
- 12.3.6 Subsegment Market Size and Forecast
- 12.3.6.1 Telco Mobile Money Wallets
- 12.3.6.2 Fintech & Bank App Wallets
- 12.3.6.3 Super-App & Merchant Wallets
- 12.3.6.4 Pass-Through Device Wallets
- 12.3.7 Subsegment Pricing and Adoption Trends
- 12.3.8 Leading Suppliers and Competition
- 12.3.9 Regional Demand and Opportunities
- 12.4 By Use Case - Market Size and Forecast, 2025-2035
- 12.4.1 Segment Definition and Scope
- 12.4.2 Historical Market Size, 2018-2025
- 12.4.3 Revenue Forecast, 2025-2035
- 12.4.4 Base-Year Market Share, 2025
- 12.4.5 Segment CAGR and Growth Drivers
- 12.4.6 Subsegment Market Size and Forecast
- 12.4.6.1 P2P Transfers
- 12.4.6.2 Cash-In & Cash-Out
- 12.4.6.3 Merchant Payments
- 12.4.6.4 Wallet Credit & Savings
- 12.4.6.5 Bill & Airtime Payments
- 12.4.6.6 International Remittances
- 12.4.7 Subsegment Pricing and Adoption Trends
- 12.4.8 Leading Suppliers and Competition
- 12.4.9 Regional Demand and Opportunities
- 12.5 By Sub-Region - Market Size and Forecast, 2025-2035
- 12.5.1 Segment Definition and Scope
- 12.5.2 Historical Market Size, 2018-2025
- 12.5.3 Revenue Forecast, 2025-2035
- 12.5.4 Base-Year Market Share, 2025
- 12.5.5 Segment CAGR and Growth Drivers
- 12.5.6 Subsegment Market Size and Forecast
- 12.5.6.1 East Africa
- 12.5.6.2 West & Central Africa
- 12.5.6.3 GCC
- 12.5.6.4 North Africa
- 12.5.6.5 Southern Africa
- 12.5.6.6 Rest of Middle East
- 12.5.7 Subsegment Pricing and Adoption Trends
- 12.5.8 Leading Suppliers and Competition
- 12.5.9 Regional Demand and Opportunities
- 12.6 Segment Growth Comparison
- 12.7 Segment Attractiveness and Priority Matrix
Chapter 13 Middle East and Africa Digital Wallet Geographic Market Outlook, 2025-2035
- 13.1 Regional Market Size and Country-Level Shares, 2025
- 13.2 Country Market Size Comparison, 2025
- 13.3 Country Market Forecasts, 2025-2035
- 13.4 Subregional Industrial and Demand Clusters
- 13.5 Intra-Regional Pricing and Cost Differences
- 13.6 Cross-Border Trade and Supply Networks
- 13.7 Regional Supply and Demand Balances
- 13.8 Country Opportunity Comparison and Prioritization
Note: Every listed country is covered on the structure shown under the first country.
Chapter 14 Middle East and Africa Digital Wallet Technology, Innovation and Sustainability Outlook
- 14.1 Technology Landscape and Maturity
- 14.2 Product, Process and Service Innovation
- 14.3 AI, Automation and Digital Tools in the Industry
- 14.4 Technology Adoption and Performance Benchmarking
- 14.5 Innovation Pipeline and R&D Investment
- 14.6 Energy Efficiency and Resource Management
- 14.7 Sustainability, Recycling and Circularity
- 14.8 Technology Roadmap, 2025-2035
- 14.9 Risks of Obsolescence and Technology Substitution
Chapter 15 Middle East and Africa Digital Wallet Market Key Strategic Imperatives
- 15.1 Growth and Market Entry Priorities
- 15.2 High-Return Products and Segments
- 15.3 Pricing, Profitability and Cost Optimization
- 15.4 Technology Investment and Product Differentiation
- 15.5 Supply Chain Localization and Resilience
- 15.6 Distribution and Customer Acquisition
- 15.7 Partnership, Acquisition and Capacity Strategy
- 15.8 Regional Expansion Priorities
- 15.9 Short-, Medium- and Long-Term Actions
Chapter 16 Competition Outlook
- 16.1 Industry Competition Characteristics
- 16.2 Market Structure and Concentration
- 16.3 Market Share and Competitive Positioning, 2025
- 16.4 Company-Wise Revenue and Product Benchmarking
- 16.5 Production and Service Capacity Benchmarking
- 16.6 Technology, Pricing and Differentiation
- 16.7 Regional Footprint and Distribution Strength
- 16.8 Mergers, Acquisitions and Strategic Alliances
- 16.9 New Entrants and Competitive Threats
- 16.10 Porter's Five Forces and Industry Attractiveness
- 16.11 Competitive Outlook, 2025-2035
Chapter 17 Company Profiles
- 17.1 Company Coverage and Selection Criteria
- 17.2 Vodacom Group
- 17.2.1 Business Description
- 17.2.2 Company Ownership and Geographic Presence
- 17.2.3 Product and Service Portfolio
- 17.2.4 Manufacturing and Operating Footprint
- 17.2.5 Financial Performance and Investment
- 17.2.6 Market Share and Competitive Position
- 17.2.7 Technology and Innovation Capabilities
- 17.2.8 Strategic Alliances or Partnerships
- 17.2.9 Recent Developments
- 17.2.10 Growth Strategy and Outlook
- 17.3 MTN
- 17.4 Airtel Africa
- 17.5 Orange
- 17.6 Ethio Telecom
- 17.7 Wave
- 17.8 OPay
- 17.9 Moniepoint
- 17.10 PalmPay
- 17.11 Fawry
- 17.12 STC Bank
- 17.13 e& money
- 17.14 Other Relevant Market Participants
Note: Every listed company is profiled on the structure shown under the first company. The company list is preliminary and may change based on research findings, market developments, data availability and client requirements.
Chapter 18 Disclaimer
- 18.1 Research and Forecast Disclaimer
- 18.2 Data Source and Estimation Limitations
Note: The depth of individual sections depends on data availability for this market. Volume, capacity, trade and other unit-based metrics are included where applicable.