
Filipinos now make most retail payments digitally
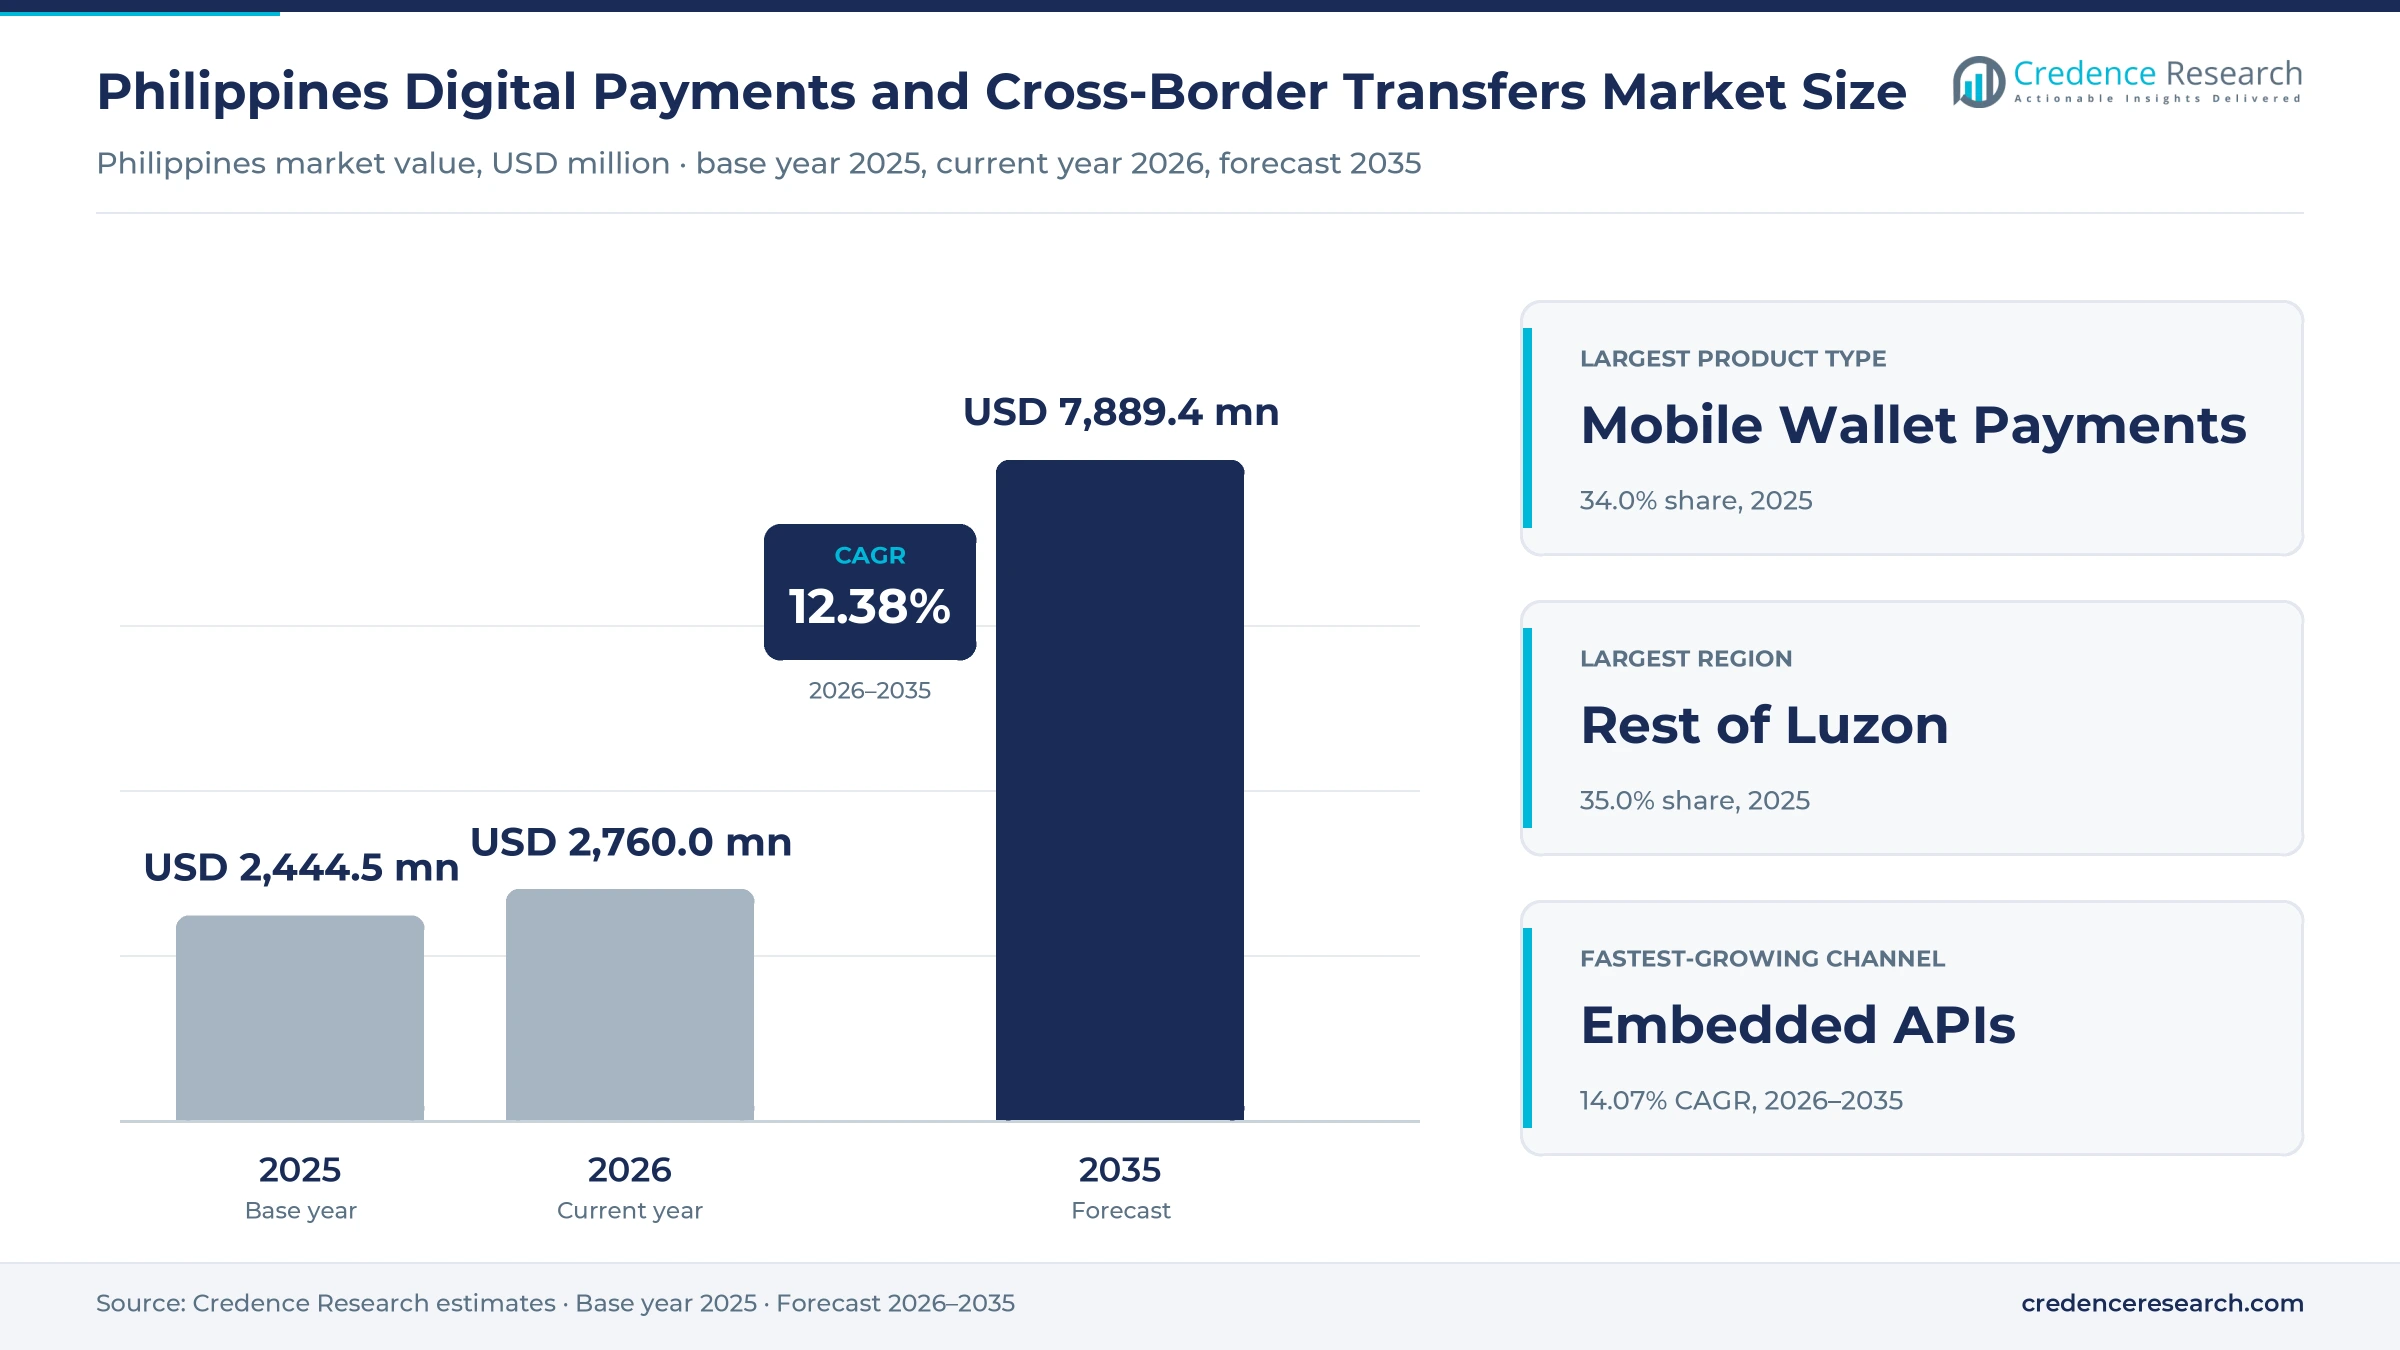
The Philippines digital payments and cross-border transfers market was valued at USD 2.44 billion in 2025 and is projected to increase from USD 2.76 billion in 2026 to USD 7.89 billion by 2035, registering a CAGR of 12.38% during 2026–2035. Demand comes from consumers who pay bills, shop and send money through mobile wallets, from merchants that accept QR codes and from families that receive money from relatives working abroad. Rest of Luzon held the largest regional share, 35.0% in 2025, because Calabarzon and Central Luzon combine large populations with many remittance-receiving households. Mindanao is the fastest-growing region at 13.17% a year, as wallets and agent networks reach provinces with fewer bank branches. Mobile wallet payments led the product mix in 2025, while account-to-account transfers gain from interoperable instant rails. A national anti-scam law signed in July 2024 lets institutions hold disputed funds, which raises trust in digital accounts across the country.
Which payment services and providers does the estimate cover?
The estimate measures the revenue that payment providers earn in the Philippines from mobile wallet payments, account-to-account transfers, merchant acquiring and payment gateways, card-based digital payments and inbound and outbound cross-border digital transfers. It counts merchant discount fees, transaction and convenience fees, foreign exchange spreads, platform fees and value-added financial services earned through these payments. Values are stated at current prices in U.S. dollars and cover every provider type.
The estimate excludes the value of the payments themselves, cash remittances sent through physical counters only, interest income from ordinary bank lending and payments infrastructure sold to providers outside the country. The value chain runs from payment system operators and settlement banks through e-money issuers, gateways and acquirers to the merchants, agents and apps that serve end users.
Philippines Digital Payments and Cross-Border Transfers Market Insights
- The Philippines digital payments and cross-border transfers market was valued at USD 2.44 billion in 2025 and is projected to reach USD 7.89 billion by 2035, registering a CAGR of 12.38% during 2026–2035.
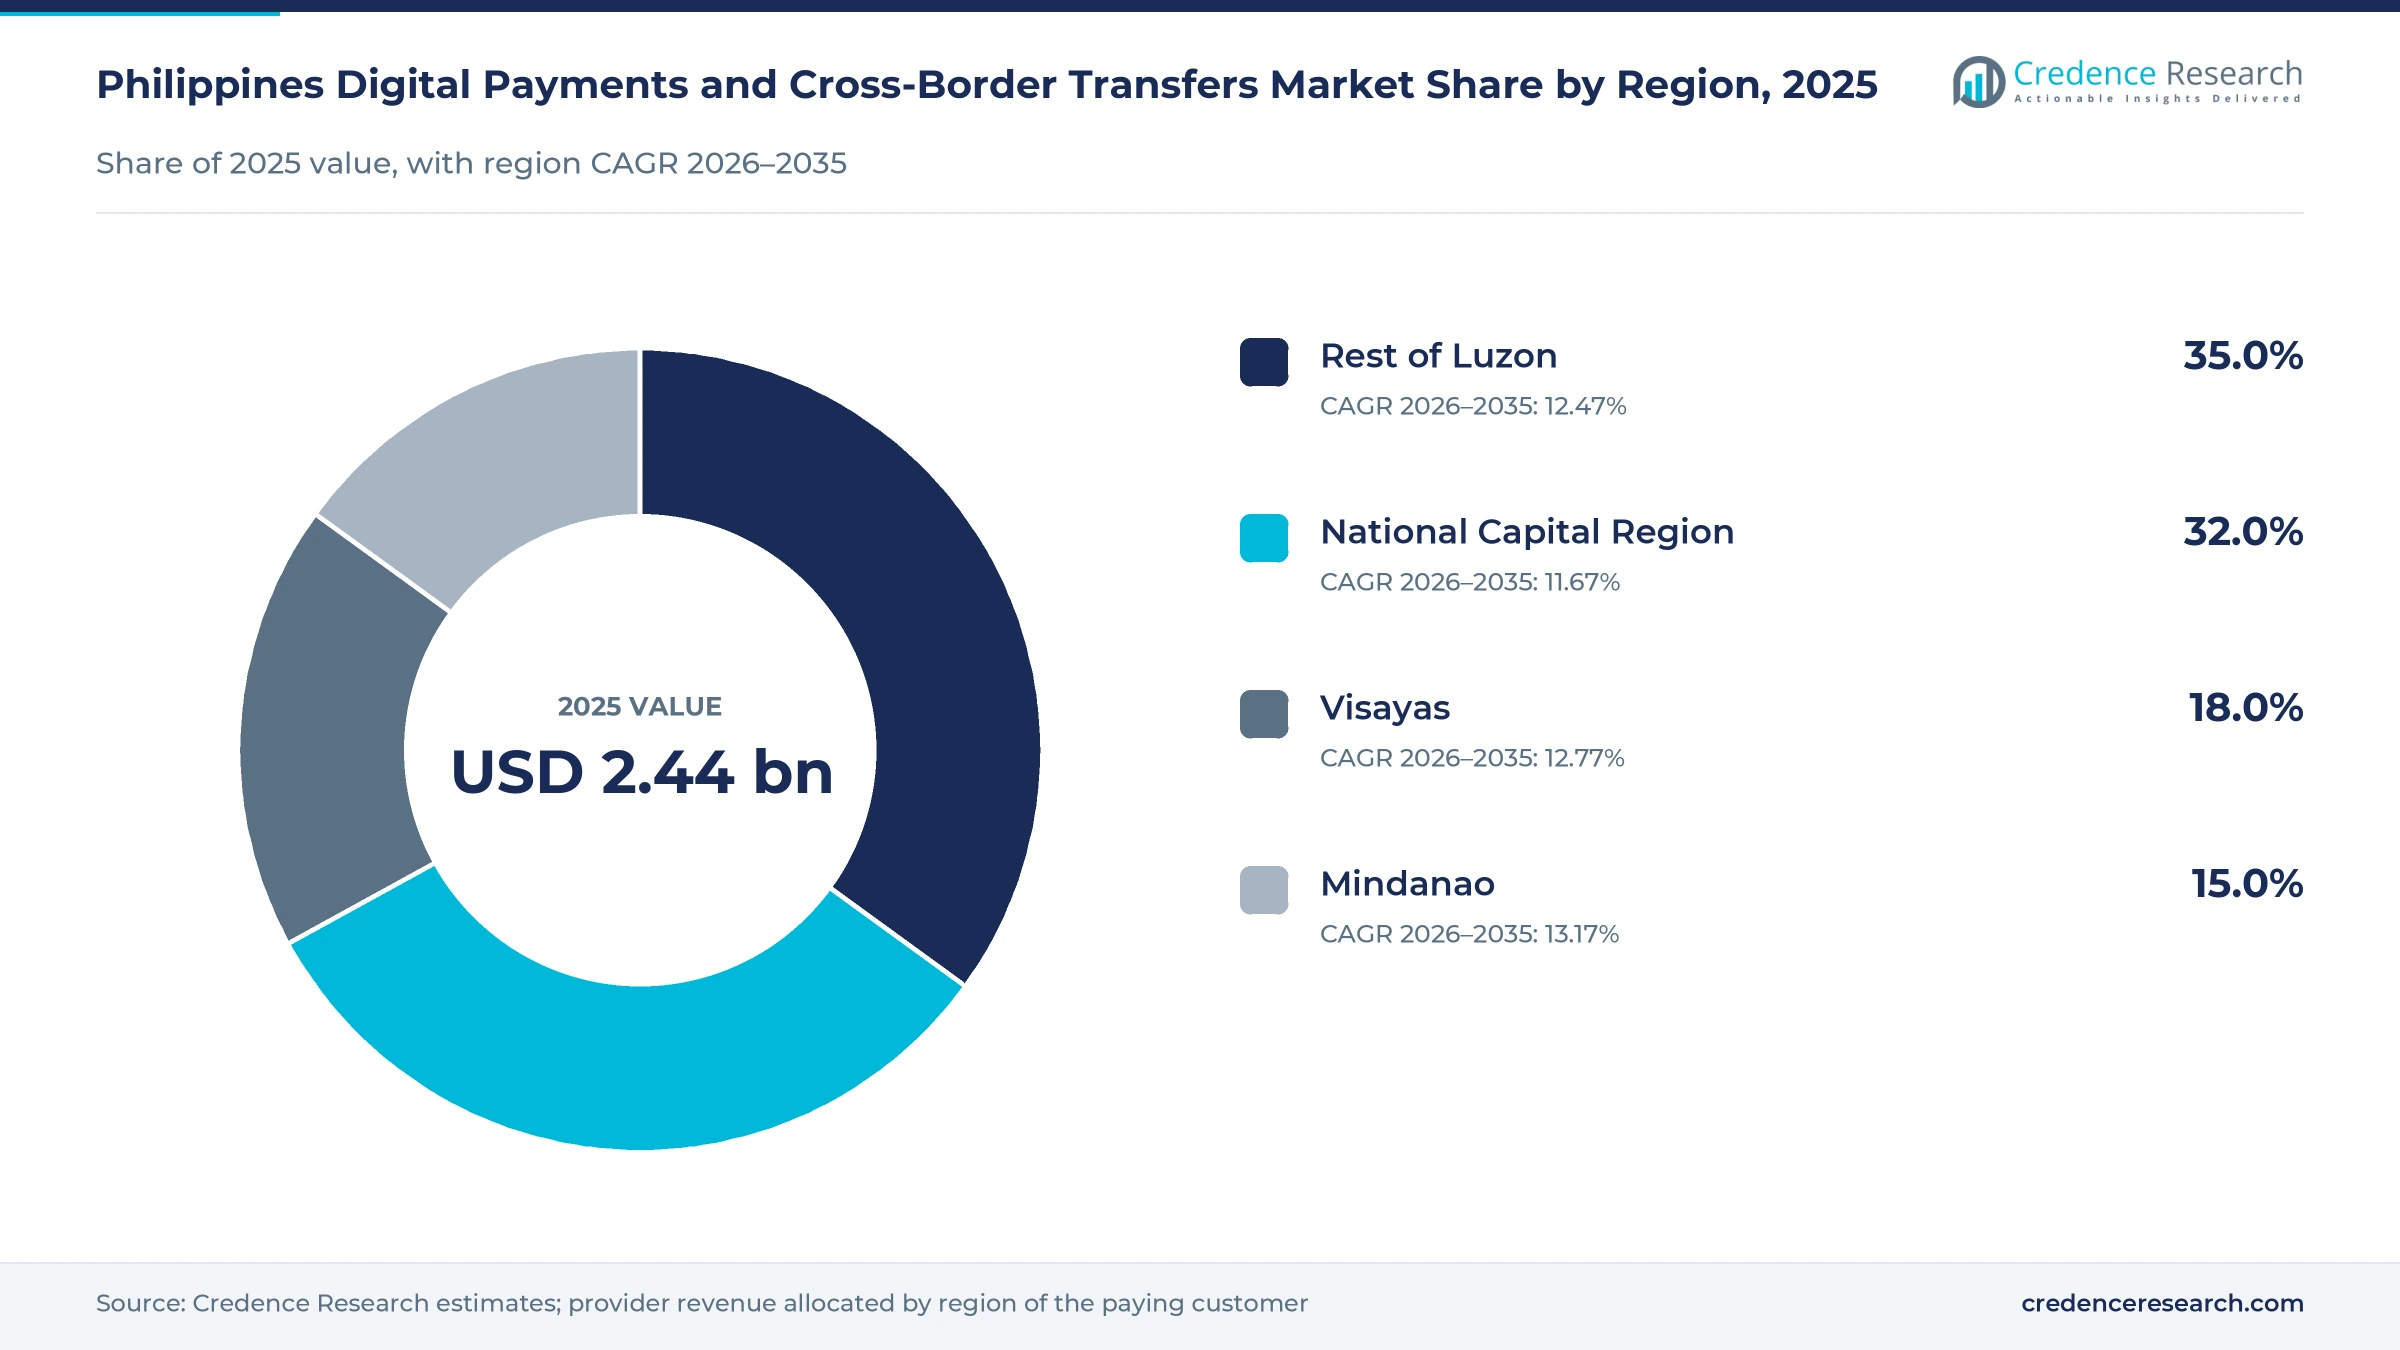
- Rest of Luzon held 35.0% of 2025 revenue, because its provinces combine large populations with many households that receive overseas remittances.
- Mobile wallet payments led with 34.0% of 2025 value, because wallets are the first digital account for many lower-income Filipinos.
- Digital payments reached 57.4% of retail transaction volume in 2024, up from 52.8% in 2023, based on central bank data, which shows cash losing ground.
- GCash parent Mynt filed for a proposed listing in June 2026, reporting about 90 million registered users and 39.1 million monthly active users.
Mobile wallets lead while account-to-account transfers rise
Why do mobile wallets lead product demand?
Based on product type, the market is categorized into mobile wallet payments, account-to-account transfers, merchant acquiring and payment gateways, card-based digital payments and cross-border digital transfers. Mobile Wallet Payments led with 34.0% of 2025 value, because wallets serve as the first account for many lower-income users. Account-to-Account Transfers grow fastest at 13.67% a year, as instant rails link banks and wallets.
Which customers account for most revenue?
Based on customer segment, the market is categorized into consumers, micro and small merchants, mid-market enterprises, large enterprises and government and institutions. Consumers led with 46.0% of 2025 value, because bill payments, transfers and online shopping generate the largest fee pool. Micro and Small Merchants grow fastest at 13.63% a year, as sari-sari stores and social sellers accept QR codes.
Which channels are gaining share?
Based on distribution channel, the market is categorized into mobile apps, bank digital channels, embedded APIs, QR acceptance networks and agent and cash-in/cash-out networks. Mobile Apps led with 44.0% of 2025 value, because wallet apps handle most consumer payments. Embedded APIs grow fastest at 14.07% a year, as platforms and software firms build checkout, payout and lending into their own services.
How do providers earn money from payments?
Based on revenue model, the market is categorized into merchant discount revenue, transaction and convenience fees, FX spread and cross-border fees, subscription and platform fees and value-added financial services. Merchant Discount Revenue led with 28.0% of 2025 value, because acquirers charge a share of each card and wallet sale. Value-Added Financial Services grow fastest at 13.70% a year, as wallets add credit, savings and insurance.
| Segment Group | Leading Sub-segment | Share, 2025 | Fastest-growing Sub-segment | CAGR, 2026–2035 |
|---|---|---|---|---|
| By Product Type | Mobile Wallet Payments | 34.0% | Account-to-Account Transfers | 13.67% |
| By Customer Segment | Consumers | 46.0% | Micro and Small Merchants | 13.63% |
| By Distribution Channel | Mobile Apps | 44.0% | Embedded APIs | 14.07% |
| By Revenue Model | Merchant Discount Revenue | 28.0% | Value-Added Financial Services | 13.70% |
Request a Free Sample
Fill in your details and we'll send you a free sample report.
- Sample data tables & charts
- Research methodology
Instant rails, wallet reach and remittances lift volumes
How does instant-payment rail expansion lift volumes?
Interoperable instant-payment rails are the main growth engine, because they let users move money between any bank and wallet in seconds. Digital payments reached 57.4% of retail transaction volume and 59.0% of value in 2024, up from 52.8% and 55.3% in 2023, according to central bank data reported by BitPinas. This surpassed the central bank's earlier target of 50% digital volume, which shows that rails now carry most retail traffic. InstaPay transactions rose 67.8% in volume and 46.3% in value during 2024. QR Ph merchant adoption also grew 148.7% year on year, which widens acceptance. As a result, account-to-account transfers become the fastest-growing product group, as national real-time settlement systems carry more retail traffic.
Why do connected consumers and merchants widen use?
Consumer connectivity and merchant digitization widen use, because each new wallet user gains more places to pay. GCash had about 90 million registered users and 39.1 million monthly active users in 2025, with 78% living outside Metro Manila, according to its parent company Mynt. GCash also processed an average of 56.7 million transactions a day in 2025, and its roughly 40 million monthly users represent nearly half of the adult population. More than 5 million merchants and social sellers accepted GCash by September 2025. In turn, mobile wallets hold 34.0% of 2025 value, the largest product share in the forecast.
How do large remittance corridors support cross-border revenue?
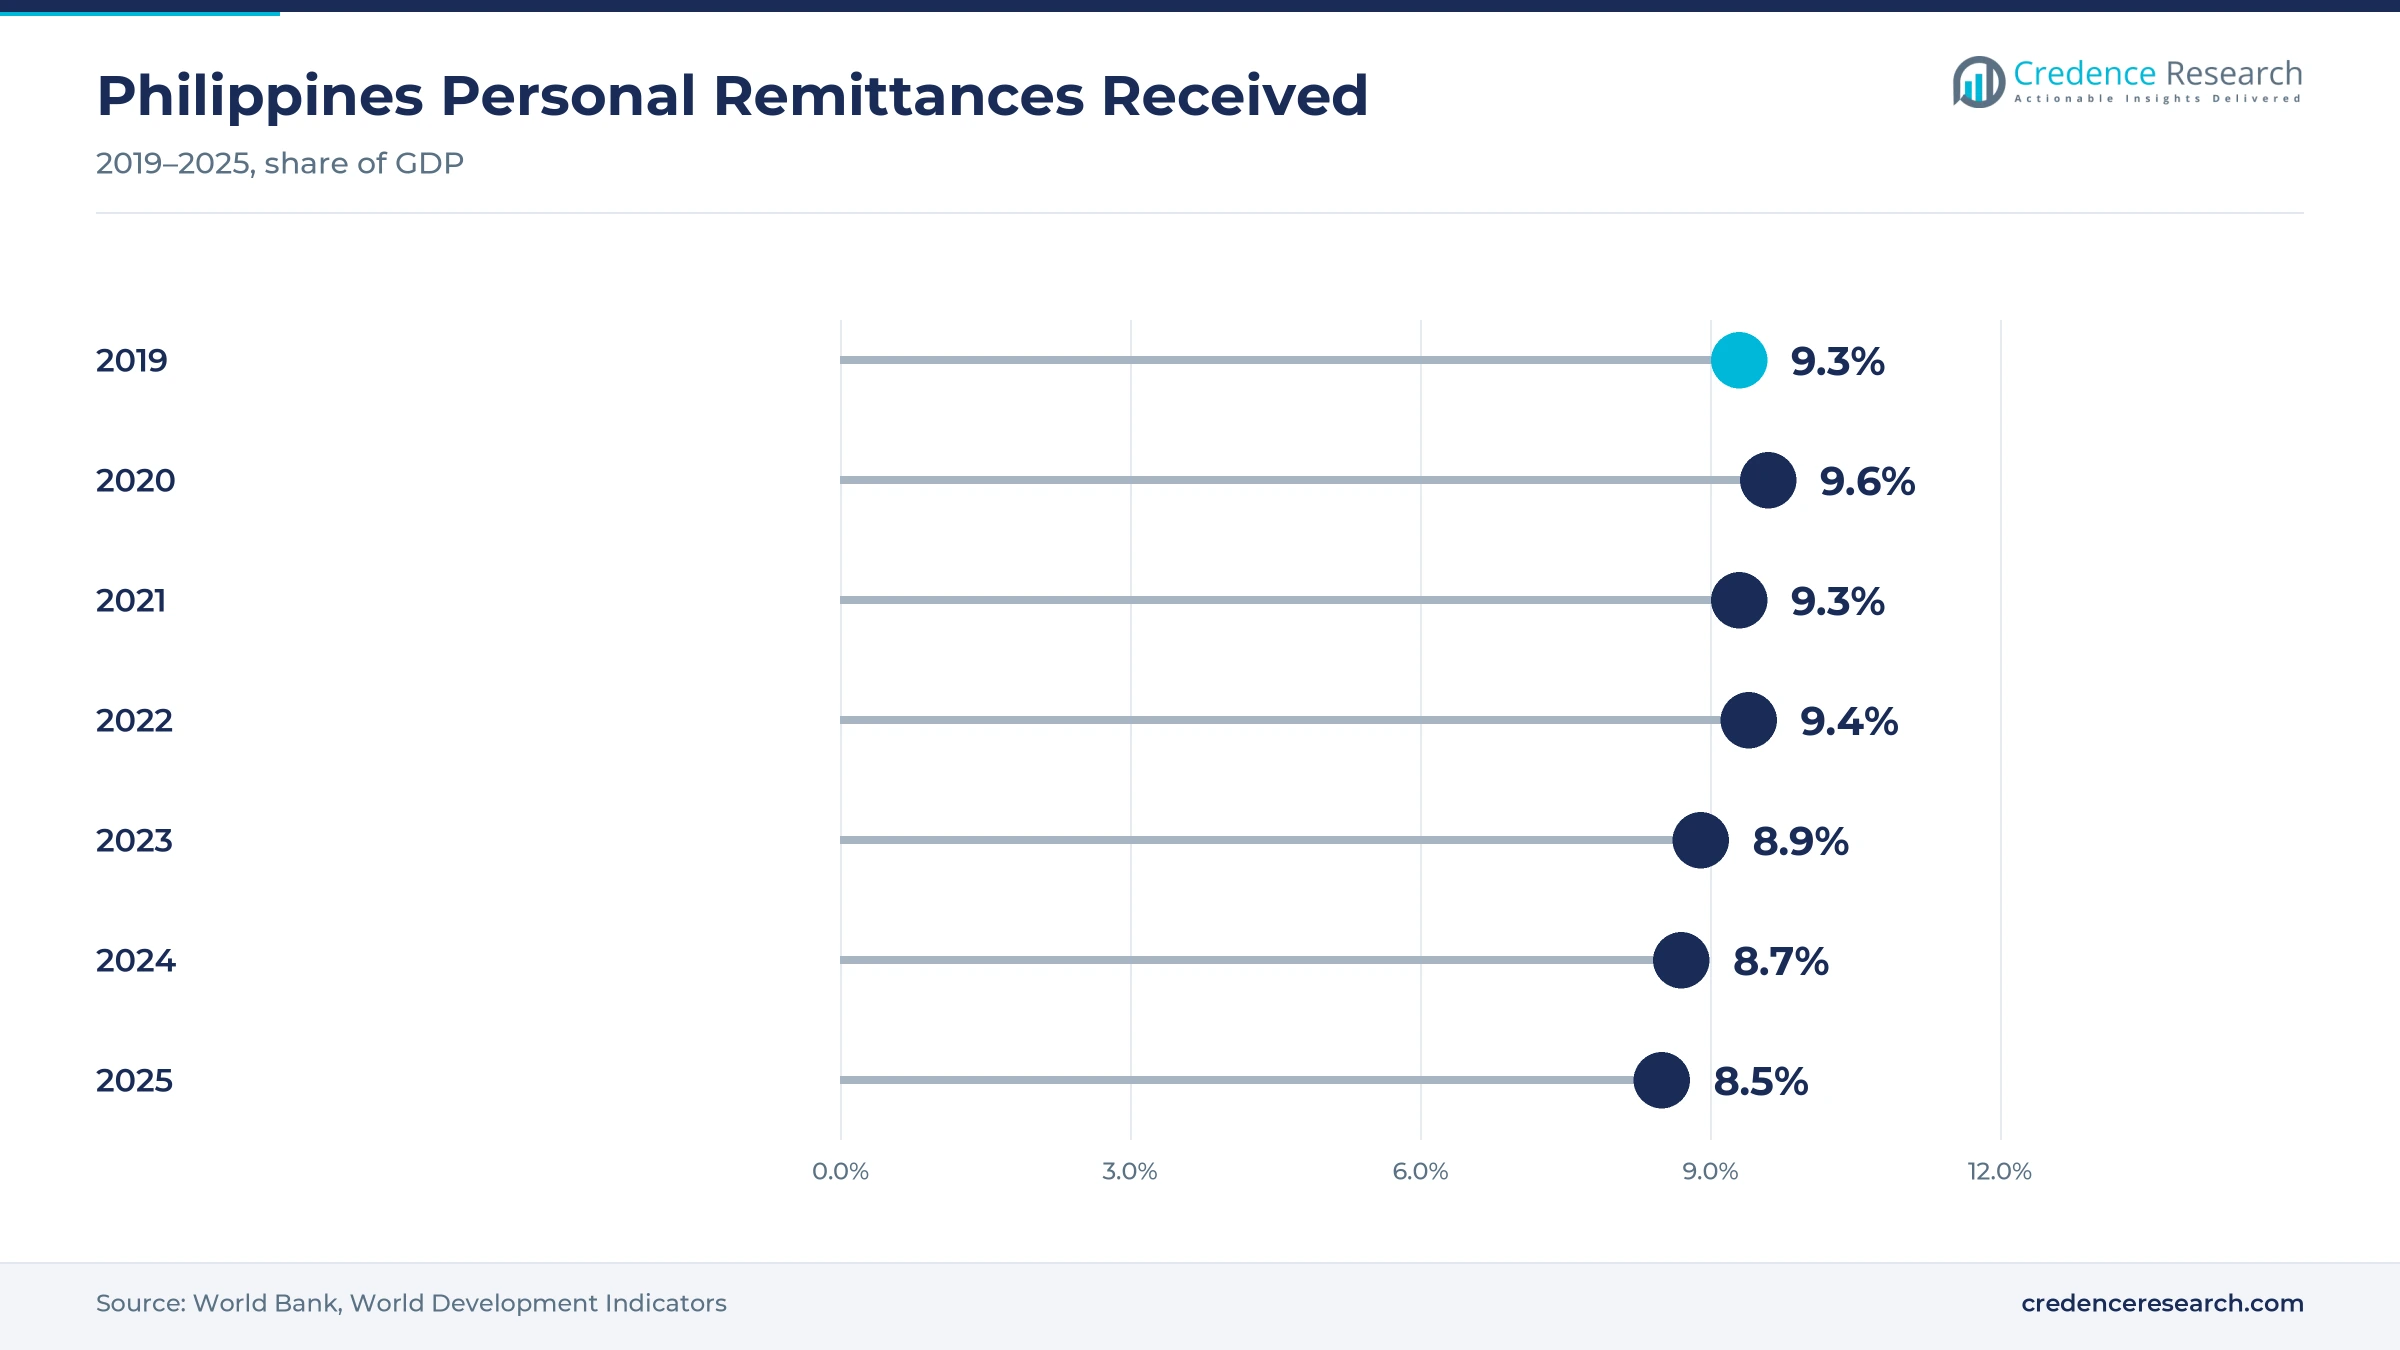
Large and recurring remittance corridors support cross-border revenue, because families receive money every month and increasingly cash out to wallets. Cash remittances through banks reached a record US$35.63 billion in 2025, up 3.3% from US$34.49 billion in 2024, as reported by The Philippine Star from central bank data. The United States supplied 39.7% of 2025 remittances, followed by Singapore at 7.3% and Saudi Arabia at 6.6%. Personal remittances, a broader measure, reached US$39.62 billion in 2025, also up 3.3%. Personal remittances equaled 8.5% of GDP in 2025, based on World Bank data. As a result, online remittance services compete for a steady inbound flow.
Why do gateways and embedded tools speed merchant uptake?
Payment gateways and embedded tools speed merchant uptake, because online sellers and software firms can add checkout and payouts quickly. PayMongo said on March 14, 2025, that it had processed US$1.1 billion in total payment volume over five years and launched an upgraded financial operating system. Xendit integrated Dragonpay in July 2026, giving 905 merchants access to more than 100 payment methods, according to Daily Tribune. Dragonpay, founded in 2010, lets people without bank accounts pay online through counters. Xendit now operates in seven markets, including Vietnam and Hong Kong, after entering Thailand in 2024. In turn, embedded APIs grow at 14.07% a year, as more platforms use online checkout gateways.
Digital banks, fraud rules and merchants reshape demand
How is the rise of digital banks and wallet credit changing revenue?
The rise of digital banks and wallet credit is changing revenue, because providers now earn from loans, savings and cards as well as fees. Maya reported 5.4 million customers at the end of 2024, up 71% from 2023, and 1.6 million borrowers, in a Feb. 28, 2025, update. Maya's deposits rose 58.5% to P39.3 billion, and it issued more than 125,000 credit cards in about six months. GCash also offers savings, credit, investments and insurance inside its app, and this mix shifts revenue from fees toward interest and service income. As a result, value-added financial services grow at 13.70% a year, the fastest revenue model rate in the forecast.
Why is the shift to stronger fraud controls gaining pace?
The shift to stronger fraud controls is gaining pace, because scams and account takeovers threaten trust in wallets and bank apps. The Anti-Financial Account Scamming Act, Republic Act No. 12010, was approved on July 20, 2024. The law lets institutions hold disputed funds for up to 30 days and requires risk controls such as multi-factor authentication and fraud management systems. It also sets prison terms of six to eight years for money mule offenses, while schemes treated as economic sabotage, such as those with three or more victims, carry life imprisonment. In turn, providers spend more on identity checks, device binding and transaction monitoring, which raises costs but supports long-term adoption.
Can business and merchant payments open a new growth channel?
Business and merchant payments offer a large opening, because firms still pay suppliers and staff largely in cash and checks. Only 19.8% of business-related payments by volume were digital in 2024, compared with 72.2% for person-to-everyone payments. Merchant payments already made up 66.4% of 3.307 billion digital transactions in 2024, which shows how fast stores are switching. PayMongo's March 2025 onboarding tool also lets businesses open an account in 30 minutes or less. An added PESONet clearing cycle also improved business-to-business efficiency, according to the 2024 e-payments report. As a result, micro and small merchants grow at 13.63% a year, the fastest customer rate in the forecast.
Is there room to reach unbanked provincial users?
Unbanked provincial users are an opening, because about half of adults still lack an account at a bank or mobile money provider. Account ownership stood at 50.2% of adults in 2024, up from 34.5% in 2017, based on World Bank Global Findex data. About 92% of GCash users belong to lower-income groups, which shows that wallets already reach poorer households. Dragonpay also lets users without cards pay online through over-the-counter channels, and its July 2026 integration with Xendit adds payouts and financing for its merchants. In turn, Mindanao and the Visayas become the fastest-growing zones, as agents and QR codes spread beyond Metro Manila.
Scams, cash habits and corridor costs slow the shift
How do scams and account takeovers hurt trust?
Scams and account takeovers hurt trust, because victims who lose money often return to cash and warn friends against apps. Social engineering attacks target users through text messages, fake links and false support calls. As a result, providers face refund claims and regulatory scrutiny. Firms respond with multi-factor checks, transaction holds, user education and shared fraud data with banks and wallets, which lowers losses but adds friction at signup and checkout.
Why do cash habits slow business adoption?
Cash habits slow business adoption, because many suppliers, drivers and small shops still prefer cash for speed and privacy. Paper checks also remain common for supplier payments, which keeps business digitization well behind consumer use. In turn, providers earn less from business flows than the economy's size suggests. Gateways respond with simple onboarding, instant settlement and payout tools that make digital collection as fast as cash for small firms.
How do connectivity gaps limit provincial reach?
Connectivity gaps limit provincial reach, because users on islands and in upland areas face weak mobile signals and costly data. Agents in these areas also need cash on hand to serve cash-in and cash-out requests. As a result, wallet use drops when networks fail or agents run short. Providers respond with offline-friendly apps, wider agent networks and partnerships with rural banks and pawnshops that keep services available during outages.
Why do corridor costs pressure transfer margins?
Corridor costs pressure transfer margins, because overseas senders compare fees and exchange rates across many apps before each transfer. Compliance checks for anti-money laundering and sanctions rules add cost to every cross-border payment. In turn, providers cut fees to win senders, which narrows spreads. Firms respond by partnering with foreign wallets and banks, automating identity checks and crediting funds directly to recipient wallets, which lowers cash-out costs.
Luzon leads while Mindanao grows fastest
| Region | Value, 2025 (USD billion) | Share, 2025 | CAGR, 2026–2035 |
|---|---|---|---|
| Rest of Luzon | 0.86 | 35.0% | 12.47% |
| National Capital Region | 0.78 | 32.0% | 11.67% |
| Visayas | 0.44 | 18.0% | 12.77% |
| Mindanao | 0.37 | 15.0% | 13.17% |
Why does Rest of Luzon hold the largest share?
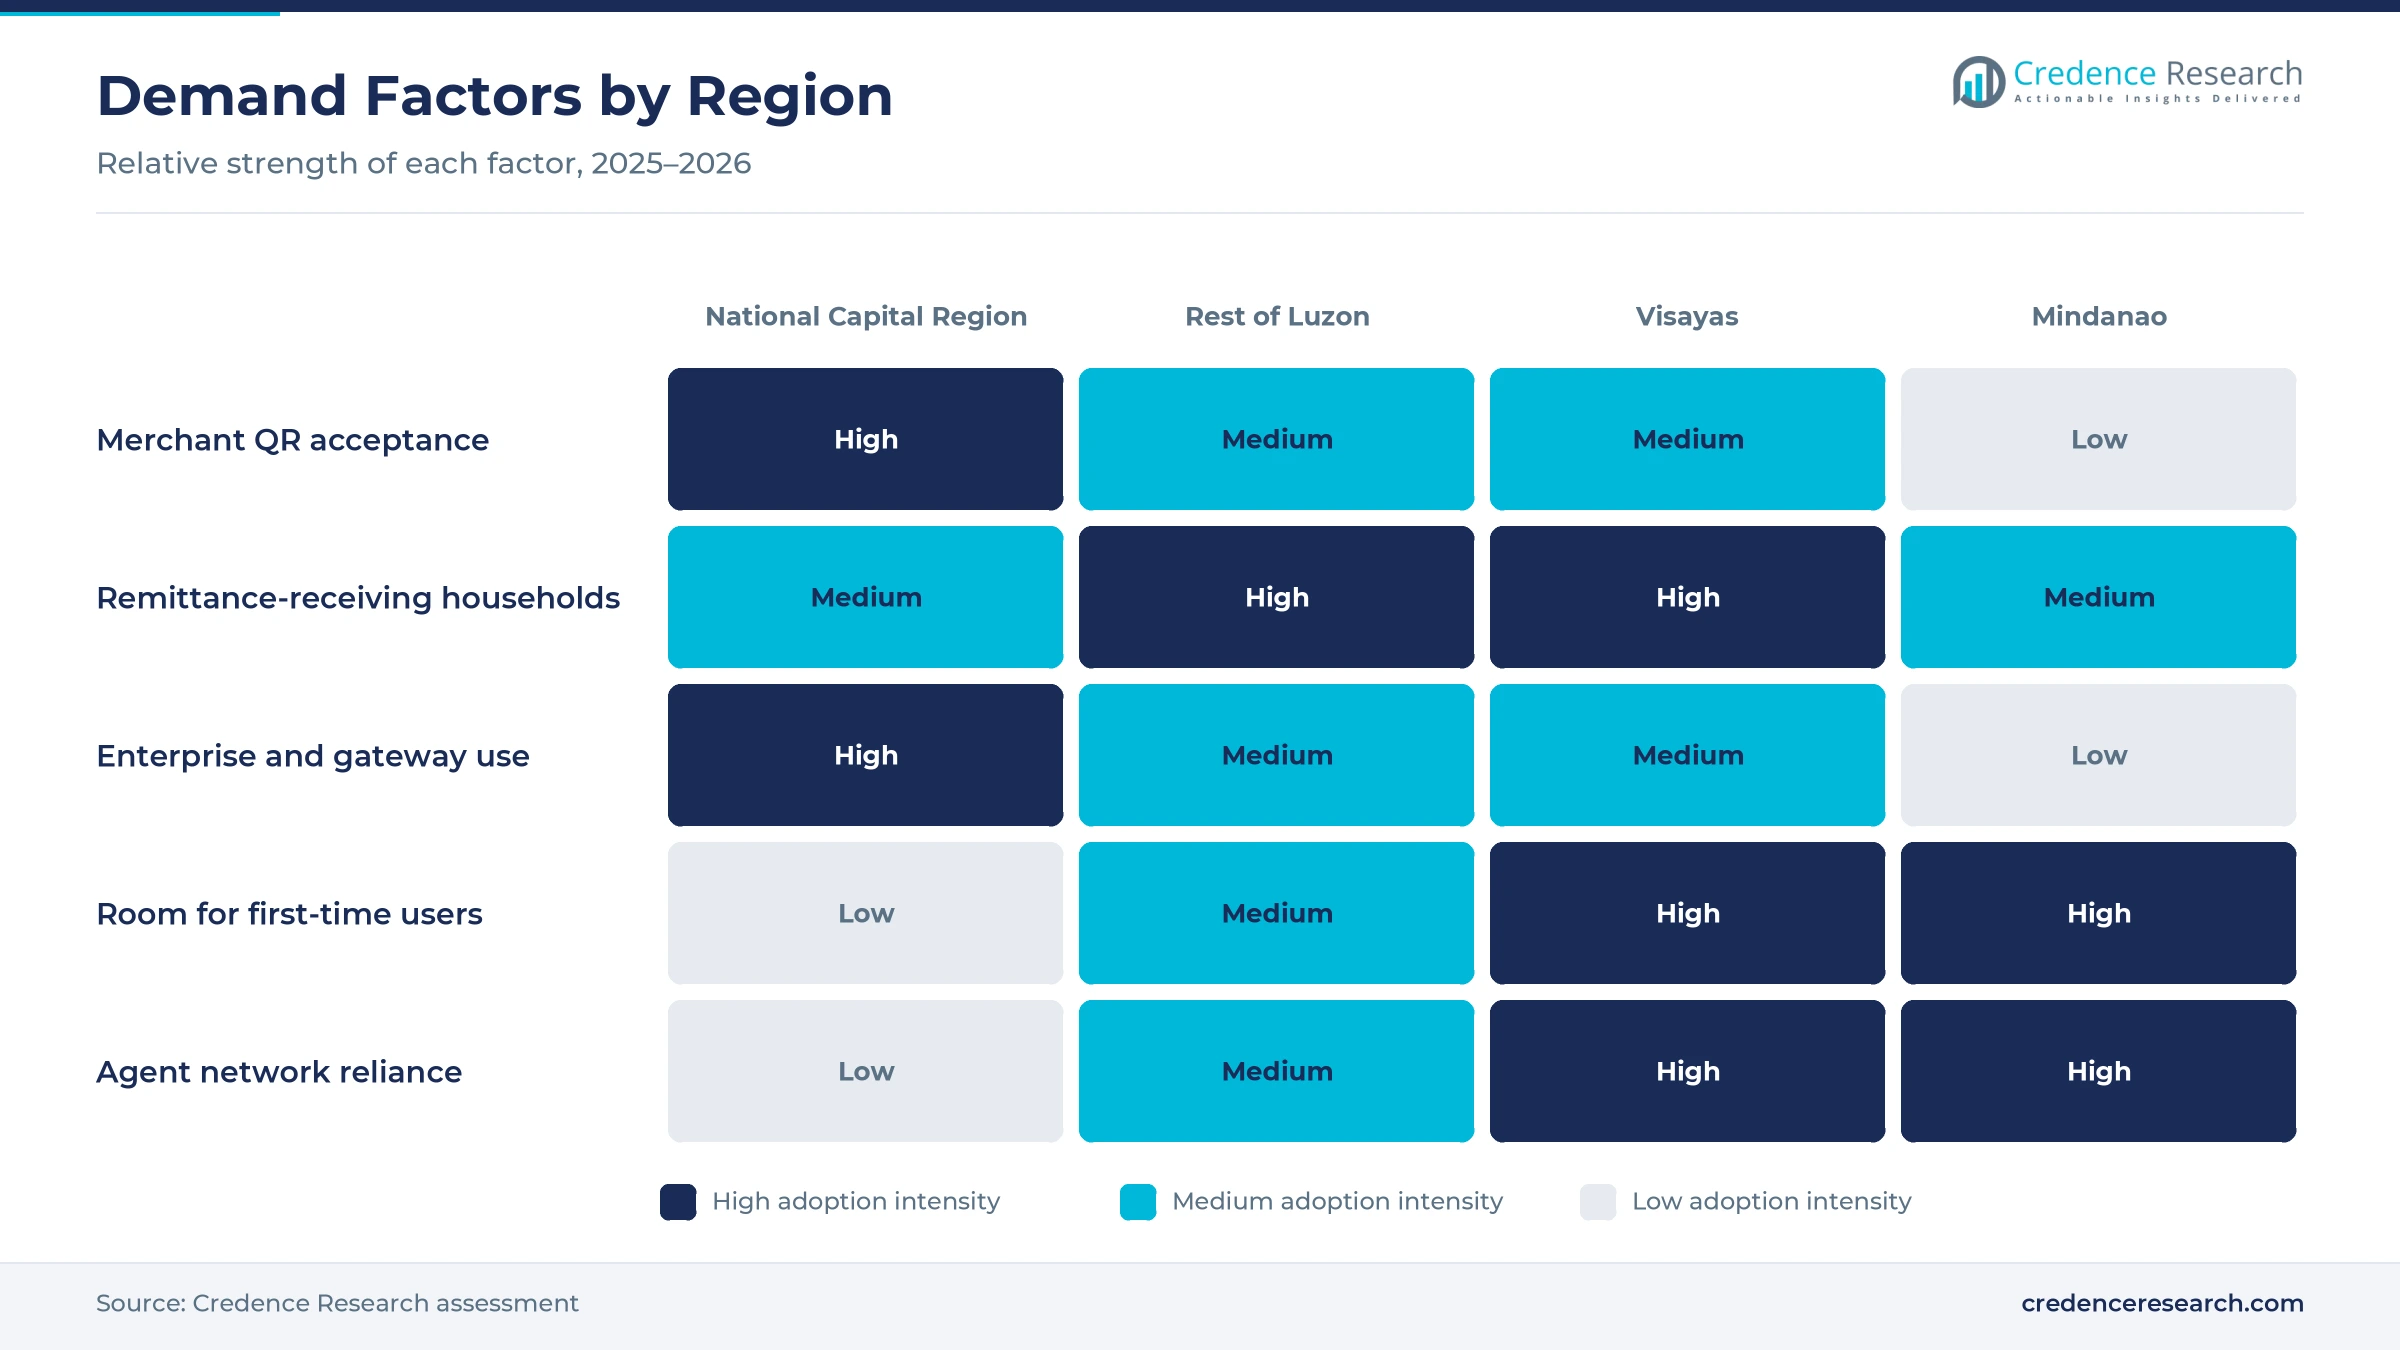
Rest of Luzon held 35.0% of 2025 revenue and grows at 12.47% a year, because Calabarzon, Central Luzon and northern provinces combine large populations with many households that receive overseas remittances. Industrial zones also pay workers digitally, which lifts wallet balances. In turn, QR acceptance spreads from malls to town markets and tricycle terminals. Remittance families convert inbound transfers into bill payments, shopping and savings inside wallets.
How does the national capital region shape the market?
The National Capital Region held 32.0% of 2025 revenue and grows at 11.67% a year, because Metro Manila hosts most corporate payers, online merchants and payment firms. Card payments, gateway checkout and business transfers are concentrated here. However, only about 22% of GCash users live in Metro Manila, which shows that growth increasingly comes from other zones. The capital still leads in enterprise use and new product launches.
What drives demand in the Visayas?
The Visayas held 18.0% of 2025 revenue and grows at 12.77% a year, because Cebu, Iloilo and Bacolod combine business process outsourcing jobs, tourism and island trade. Workers in these cities receive salaries into accounts and pay through wallets. However, smaller islands rely on agents for cash-in and cash-out, which keeps costs higher. Wider QR acceptance at stores, transport and tourism sites should raise digital use across the region.
Why is Mindanao growing fastest?
Mindanao held 15.0% of 2025 revenue and grows fastest at 13.17% a year, because account ownership and bank branch coverage are lower than in Luzon, which leaves more room for first-time wallet users. Davao, Cagayan de Oro and General Santos anchor merchant growth. As a result, agent networks, pawnshops and wallets are adding coverage, and remittance households move from cash pickup to direct wallet credit.
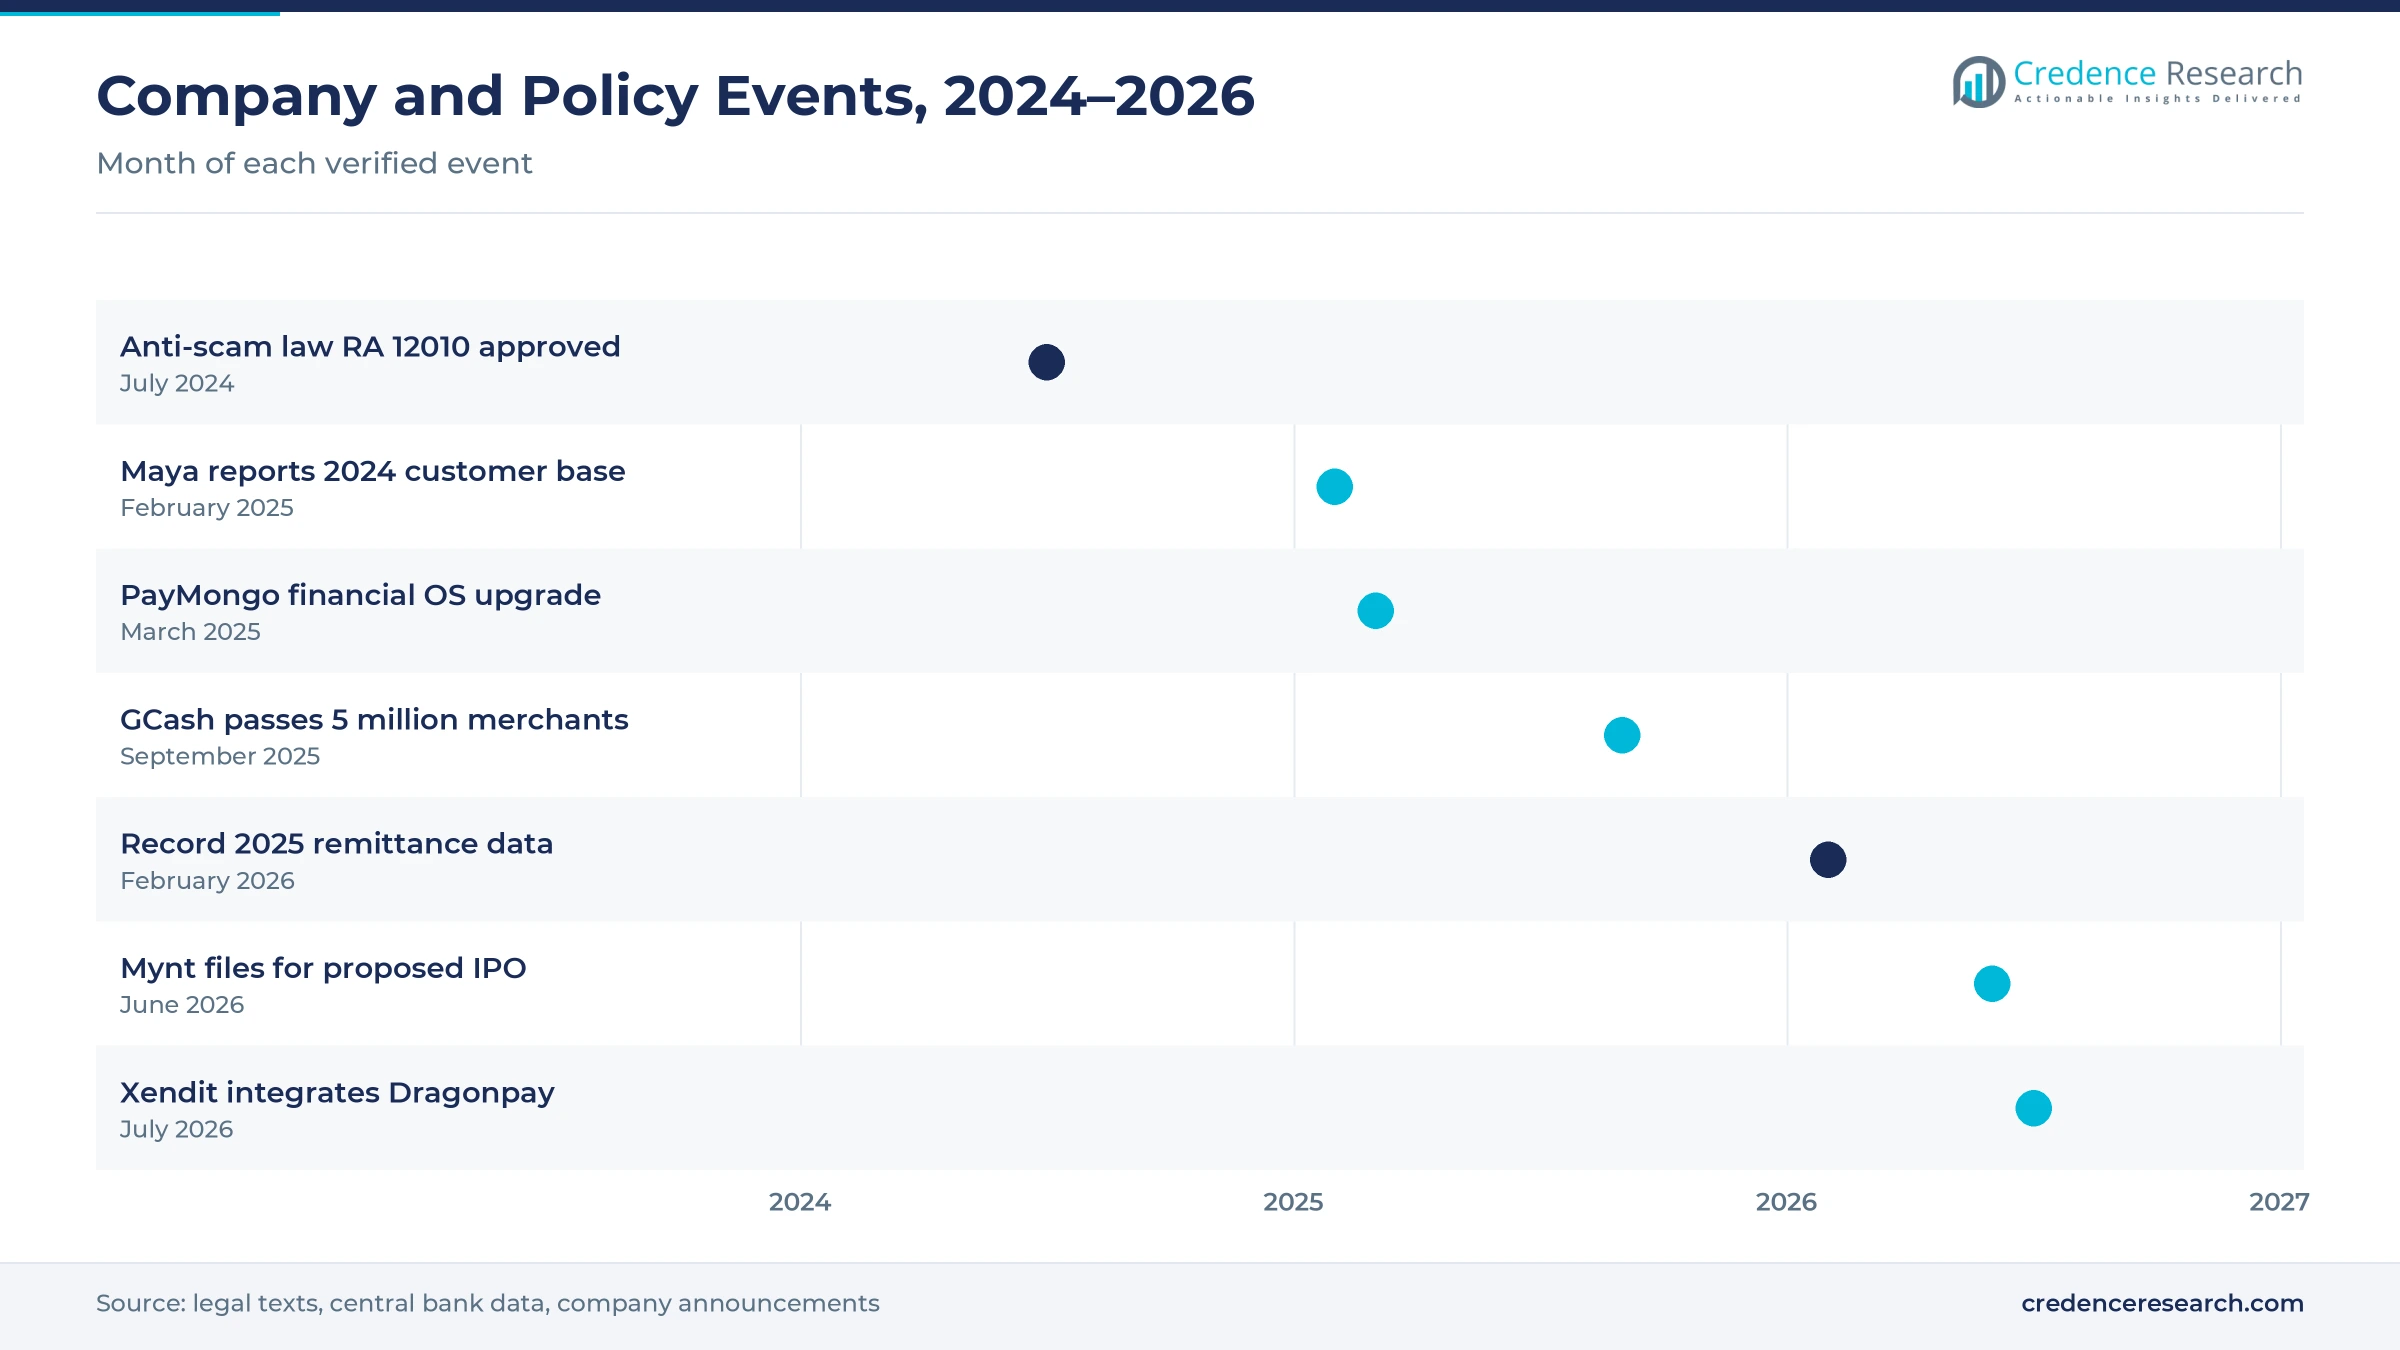
Fraud law, gateway deals and a wallet listing, 2024–2026
| Development | Status and market relevance |
|---|---|
| In July 2024, the Anti-Financial Account Scamming Act was signed into law as Republic Act No. 12010. | Lets institutions hold disputed funds and requires fraud controls |
| In February 2025, Maya reported 5.4 million customers and 1.6 million borrowers at the end of 2024. | Shows digital banks adding credit to payments |
| In March 2025, PayMongo launched an upgraded financial operating system and fast business onboarding. | Widens gateway and embedded finance options for merchants |
| In June 2026, GCash parent Mynt filed with regulators for a proposed initial public offering. | Disclosed about 90 million registered GCash users |
| In July 2026, Xendit integrated Dragonpay, giving 905 merchants access to more than 100 payment methods. | Deepens gateway consolidation and cross-border capability |
QR, open APIs and fraud tools change how money moves
- QR Ph codes let any wallet or bank app pay any participating merchant, which lowers acceptance costs for small stores and street vendors.
- Open APIs allow platforms and software firms to embed checkout, payouts and lending, which shifts volume toward embedded channels.
- Real-time fraud engines score transactions and devices in milliseconds, which helps providers meet anti-scam rules without blocking honest users.
- Wallet-to-wallet corridors connect foreign apps directly to local wallets, which cuts cash pickup costs for remittance families.
Need a Custom Version of This Report?
Tailor the scope, geography, or segments to your exact requirements.
- Custom geography or segment scope
- Direct access to our analyst team
Wallet leaders and gateways compete for merchants
Competition is led by two large wallet groups and a set of gateways that serve online merchants. GCash, run by Mynt subsidiary G-Xchange, reaches about 90 million registered users and offers payments, savings, credit, investments, insurance and merchant tools. Maya combines a wallet with a digital bank and reported 5.4 million bank customers at the end of 2024. PayMongo serves online businesses with checkout, onboarding and embedded finance, and it holds SOC 2 Type 2 certification. Xendit operates in seven Asian markets and integrated Dragonpay, a pioneer of over-the-counter online payment, in July 2026. Rivals compete on acceptance reach, settlement speed, fees, credit offers and fraud protection, while bank apps and remittance firms compete for cross-border flows.
Companies profiled and their roles in this market
| Company | Type | Role in the market |
|---|---|---|
| GCash | E-money issuer | About 90 million registered users and 39.1 million monthly active users in 2025 |
| Maya | Wallet and digital bank | 5.4 million customers and 1.6 million borrowers at end-2024 |
| PayMongo | Payment gateway | Launched upgraded financial operating system in March 2025 |
| Xendit | Payment gateway | Integrated Dragonpay in July 2026 across seven Asian markets |
| Dragonpay | Alternative payments provider | Founded in 2010; 905 merchants gain more than 100 methods |
Credence Research view on rails, credit and trust
Credence Research's view is that revenue from Philippines digital payments and cross-border transfers will grow faster than retail spending because instant rails, wallets and QR acceptance keep replacing cash. Remittance flows give providers a large, recurring base, while digital banks add credit and savings income. However, scams, cash habits in business payments and corridor fee pressure will keep margins tight. Providers that combine broad merchant acceptance, strong fraud controls and embedded tools for platforms should gain share fastest through 2035, especially in Mindanao and the Visayas.
How the Philippine payments revenue estimate was built
The report uses 2025 as the base year on a calendar basis, and market values come from the Credence Research model. That model combines central bank e-payment and remittance statistics, World Bank account ownership and remittance data, company disclosures and typical fee levels by product type. Segment and regional splits are Credence Research estimates based on population, income, remittance flows and network reach by zone. Sources used are government releases, company announcements, legal texts, news reports and statistical databases, and no interviews or surveys were used.
Merchant uptake and embedded finance carry growth to 2035
Payments revenue is expected to reach USD 7.89 billion by 2035, a 12.38% CAGR during 2026–2035, as instant rails, wallets and merchant QR acceptance keep replacing cash. Growth should stay strong through 2028 while business payments and provincial users move online. After that, embedded finance, wallet credit and cross-border wallet corridors will add steady value as consumer use matures. Major fraud losses would lower this outlook, while faster business digitization would raise it. Account-to-account transfers are expected to grow at 13.67% a year, the fastest product rate.
Frequently Asked Questions
How big is the Philippines digital payments and cross-border transfers market?
Which product type leads payments revenue in the Philippines?
Which region leads the market?
How much of retail payment volume is digital?
How large are remittances to the Philippines?
Which channel is growing fastest?
Who are the leading providers in the Philippines?
What are the main challenges for payment providers?
Table of Content
Chapter 1 Market Segmentation
- 1.1 Segmentation Framework
- 1.1.1 Product and Service Classification
- 1.1.2 Application and End-Use Classification
- 1.1.3 Technology and Solution Classification
- 1.1.4 Customer and Distribution Channel Classification
- 1.1.5 Geographic Segmentation
- 1.1.6 Market Segment Definitions and Boundaries
- 1.2 By Product Type
- 1.2.1 Mobile Wallet Payments
- 1.2.2 Account-to-Account Transfers
- 1.2.3 Merchant Acquiring and Payment Gateways
- 1.2.4 Card-Based Digital Payments
- 1.2.5 Cross-Border Digital Transfers
- 1.3 By Customer Segment
- 1.3.1 Consumers
- 1.3.2 Micro and Small Merchants
- 1.3.3 Mid-Market Enterprises
- 1.3.4 Large Enterprises
- 1.3.5 Government and Institutions
- 1.4 By Revenue Model
- 1.4.1 Merchant Discount Revenue
- 1.4.2 Transaction and Convenience Fees
- 1.4.3 FX Spread and Cross-Border Fees
- 1.4.4 Subscription and Platform Fees
- 1.4.5 Value-Added Financial Services
Chapter 2 Introduction
- 2.1 Report Objectives and Scope
- 2.2 Product Definition and Industry Terminology
- 2.3 Market Inclusions and Exclusions
- 2.4 Research Process
- 2.4.1 Primary Research and Expert Interviews
- 2.4.2 Secondary Research and Source Review
- 2.4.3 Top-Down and Bottom-Up Estimation
- 2.4.4 Data Triangulation and Verification
- 2.5 Market Size Measurement Basis
- 2.5.1 2025: USD 2.44 billion → 2035: USD 7.89 billion
- 2.6 Historical and Forecast Reference Periods
- 2.6.1 Historical Period: 2018-2025
- 2.6.2 Base Year: 2025
- 2.6.3 Forecast Period: 2025-2035
- 2.7 Research Assumptions and Limitations
Chapter 3 Executive Summary
- 3.1 Market Snapshot and Key Findings
- 3.2 Base-Year Market Size, 2025
- 3.3 Forecast Market Size, 2035
- 3.4 Revenue and Volume Growth Outlook
- 3.5 Key Demand and Supply Indicators
- 3.6 Leading Market Segments
- 3.7 Fastest-Growing Market Opportunities
- 3.8 Regional Performance Highlights
- 3.9 Technology and Industry Transformation
- 3.10 Competitive Landscape Summary
- 3.11 Analyst View and Strategic Implications
Chapter 4 Philippines Digital Payments and Cross-Border Transfers Market Trends and Developments
- 4.1 Historical Industry Development, 2018-2025
- 4.2 Recent Market Trends and Developments
- 4.3 Demand and Customer Behavior Trends
- 4.4 Technology and Product Innovation
- 4.5 Artificial Intelligence, Automation and Digitalization
- 4.6 Local Manufacturing and Supply Chain Realignment
- 4.7 Industry Partnerships, Mergers and Acquisitions
- 4.8 Sustainability and Circular Economy Developments
- 4.9 Government and Private Sector Investment Trends
- 4.10 Emerging Business Models and Commercialization
- 4.11 Industry Developments and Announcements
Chapter 5 Philippines Digital Payments and Cross-Border Transfers Market Supply and Demand Analysis
- 5.1 Demand Trend and Consumption Analysis, 2018-2025
- 5.2 Demand Forecast, 2025-2035
- 5.3 Supply Chain Structure and Procurement Trends
- 5.4 Supply-Demand Gap and Bottlenecks
- 5.5 Import Dependence and Sourcing Structure
- 5.6 Regional Supply and Demand Concentration
Chapter 6 Philippines Digital Payments and Cross-Border Transfers Market Pricing Analysis
- 6.1 Pricing Structure and Measurement
- 6.2 Historical Pricing Trends, 2018-2025
- 6.3 Pricing Outlook, 2025-2035
- 6.4 Pricing by Product and Market Segment
- 6.5 Geographic Pricing Differences
- 6.6 Key Input, Energy, Labor and Logistics Costs
- 6.7 Contract Pricing and Purchasing Models
- 6.8 Pricing Sensitivity and Competitive Positioning
- 6.9 Price, Margin and Profitability Implications
Chapter 7 Philippines Digital Payments and Cross-Border Transfers Market Dynamics
- 7.1 Market Growth Drivers
- 7.1.1 Demand-Side Drivers
- 7.1.2 Technology and Innovation Drivers
- 7.1.3 Infrastructure and Investment Drivers
- 7.1.4 Regulatory and Policy Drivers
- 7.2 Market Restraints
- 7.2.1 Cost and Affordability Constraints
- 7.2.2 Technology and Adoption Barriers
- 7.2.3 Supply Chain and Operational Constraints
- 7.3 Market Challenges
- 7.3.1 Competitive Pressure and Margin Erosion
- 7.3.2 Skills, Infrastructure and Implementation Gaps
- 7.4 Emerging Market Opportunities
- 7.5 Market Dynamics Impact and Time-Horizon Assessment
Chapter 8 Philippines Digital Payments and Cross-Border Transfers Value Chain Analysis
- 8.1 Industry Value Chain Overview
- 8.2 Upstream Suppliers and Critical Inputs
- 8.3 Technology and Component Providers
- 8.4 Manufacturing or Service Delivery
- 8.5 Distribution, Channel Partners and Integrators
- 8.6 Downstream Applications and End Users
- 8.7 Value Addition and Profit Pools
- 8.8 Vertical Integration and Outsourcing
- 8.9 Supplier Concentration and Risk
- 8.10 Supply Chain Localization and Resilience
Chapter 9 Philippines Digital Payments and Cross-Border Transfers Market Regulations and Policies
- 9.1 Relevant Laws, Standards and Compliance Frameworks
- 9.2 Product, Service, Safety and Quality Requirements
- 9.3 Government Policies, Incentives and Subsidies
- 9.4 Imports, Exports and Trade Barriers
- 9.5 Public Procurement and Local Content Requirements
- 9.6 Data Protection, AI and Cybersecurity Compliance
- 9.7 Upcoming Policy Changes and Market Implications
Chapter 10 Philippines Digital Payments and Cross-Border Transfers Market Hotspots and Opportunities
- 10.1 Market Opportunity Mapping and Growth Hotspots
- 10.2 High-Growth Applications and Customer Groups
- 10.3 Underserved Markets and White-Space Opportunities
- 10.4 Emerging Technology and Product Opportunities
- 10.5 New Capacity and Investment Hotspots
- 10.6 Market Entry and Expansion Opportunities
- 10.7 Distribution and Partnership Opportunities
- 10.8 Near-Term and Long-Term Commercial Potential
- 10.9 Opportunity Attractiveness and Execution Risks
Chapter 11 Philippines Digital Payments and Cross-Border Transfers Market Outlook, 2025-2035
- 11.1 Market Size and Analysis
- 11.1.1 Revenue (Market Measurement: 2025: USD 2.44 billion → 2035: USD 7.89 billion)
- 11.1.2 Historical Market Size, 2018-2025
- 11.1.3 Base-Year Market Size, 2025
- 11.2 Market Forecast, 2025-2035
- 11.2.1 Revenue Forecast to 2035
- 11.2.2 CAGR and Year-on-Year Growth
- 11.2.3 Incremental Revenue Opportunity
- 11.3 Forecast Assumptions and Scenario Analysis
- 11.3.1 Base-Case Forecast
- 11.3.2 Optimistic and Conservative Scenarios
- 11.3.3 Technology, Pricing and Policy Sensitivities
- 11.4 Market Attractiveness and Growth Outlook
Chapter 12 Philippines Digital Payments and Cross-Border Transfers Market Segmentation and Outlook
- 12.1 Segmentation Summary and Market Shares, 2025
- 12.2 Largest and Fastest-Growing Segments
- 12.3 By Product Type - Market Size and Forecast, 2025-2035
- 12.3.1 Segment Definition and Scope
- 12.3.2 Historical Market Size, 2018-2025
- 12.3.3 Revenue Forecast, 2025-2035
- 12.3.4 Base-Year Market Share, 2025
- 12.3.5 Segment CAGR and Growth Drivers
- 12.3.6 Subsegment Market Size and Forecast
- 12.3.6.1 Mobile Wallet Payments
- 12.3.6.2 Account-to-Account Transfers
- 12.3.6.3 Merchant Acquiring and Payment Gateways
- 12.3.6.4 Card-Based Digital Payments
- 12.3.6.5 Cross-Border Digital Transfers
- 12.3.7 Subsegment Pricing and Adoption Trends
- 12.3.8 Leading Suppliers and Competition
- 12.3.9 Regional Demand and Opportunities
- 12.4 By Customer Segment - Market Size and Forecast, 2025-2035
- 12.4.1 Segment Definition and Scope
- 12.4.2 Historical Market Size, 2018-2025
- 12.4.3 Revenue Forecast, 2025-2035
- 12.4.4 Base-Year Market Share, 2025
- 12.4.5 Segment CAGR and Growth Drivers
- 12.4.6 Subsegment Market Size and Forecast
- 12.4.6.1 Consumers
- 12.4.6.2 Micro and Small Merchants
- 12.4.6.3 Mid-Market Enterprises
- 12.4.6.4 Large Enterprises
- 12.4.6.5 Government and Institutions
- 12.4.7 Subsegment Pricing and Adoption Trends
- 12.4.8 Leading Suppliers and Competition
- 12.4.9 Regional Demand and Opportunities
- 12.5 By Revenue Model - Market Size and Forecast, 2025-2035
- 12.5.1 Segment Definition and Scope
- 12.5.2 Historical Market Size, 2018-2025
- 12.5.3 Revenue Forecast, 2025-2035
- 12.5.4 Base-Year Market Share, 2025
- 12.5.5 Segment CAGR and Growth Drivers
- 12.5.6 Subsegment Market Size and Forecast
- 12.5.6.1 Merchant Discount Revenue
- 12.5.6.2 Transaction and Convenience Fees
- 12.5.6.3 FX Spread and Cross-Border Fees
- 12.5.6.4 Subscription and Platform Fees
- 12.5.6.5 Value-Added Financial Services
- 12.5.7 Subsegment Pricing and Adoption Trends
- 12.5.8 Leading Suppliers and Competition
- 12.5.9 Regional Demand and Opportunities
- 12.6 Segment Growth Comparison
- 12.7 Segment Attractiveness and Priority Matrix
Chapter 13 Philippines Digital Payments and Cross-Border Transfers End-Use and Application Market Outlook
- 13.1 End-Use Industry and Customer Demand Structure
- 13.2 Leading Applications and Customer Groups
- 13.3 End-Use Market Size, Share and Forecast
- 13.4 Major End-Use Industry Deep Dives
- 13.4.1 Customer Requirements and Use Cases
- 13.4.2 Demand and Replacement Cycles
- 13.4.3 Technical and Regulatory Considerations
- 13.4.4 Purchasing and Procurement Models
- 13.4.5 Leading Vendors and Distribution Channels
- 13.4.6 Forecast and Commercial Opportunities
- 13.5 Emerging Applications and Cross-Segment Demand
- 13.6 End-Use Industry Investment Priorities
Chapter 14 Philippines Digital Payments and Cross-Border Transfers Geographic Market Outlook, 2025-2035
- 14.1 Regional Market Size and Country-Level Shares, 2025
- 14.2 Country Market Size Comparison, 2025
- 14.3 Country Market Forecasts, 2025-2035
- 14.4 Subregional Industrial and Demand Clusters
- 14.5 Intra-Regional Pricing and Cost Differences
- 14.6 Cross-Border Trade and Supply Networks
- 14.7 Regional Supply and Demand Balances
- 14.8 Country Opportunity Comparison and Prioritization
Note: Every listed country is covered on the structure shown under the first country.
Chapter 15 Philippines Digital Payments and Cross-Border Transfers Technology, Innovation and Sustainability Outlook
- 15.1 Technology Landscape and Maturity
- 15.2 Product, Process and Service Innovation
- 15.3 AI, Automation and Digital Tools in the Industry
- 15.4 Technology Adoption and Performance Benchmarking
- 15.5 Innovation Pipeline and R&D Investment
- 15.6 Energy Efficiency and Resource Management
- 15.7 Sustainability, Recycling and Circularity
- 15.8 Technology Roadmap, 2025-2035
- 15.9 Risks of Obsolescence and Technology Substitution
Chapter 16 Philippines Digital Payments and Cross-Border Transfers Market Key Strategic Imperatives
- 16.1 Growth and Market Entry Priorities
- 16.2 High-Return Products and Segments
- 16.3 Pricing, Profitability and Cost Optimization
- 16.4 Technology Investment and Product Differentiation
- 16.5 Supply Chain Localization and Resilience
- 16.6 Distribution and Customer Acquisition
- 16.7 Partnership, Acquisition and Capacity Strategy
- 16.8 Regional Expansion Priorities
- 16.9 Short-, Medium- and Long-Term Actions
Chapter 17 Competition Outlook
- 17.1 Industry Competition Characteristics
- 17.2 Market Structure and Concentration
- 17.3 Market Share and Competitive Positioning, 2025
- 17.4 Company-Wise Revenue and Product Benchmarking
- 17.5 Production and Service Capacity Benchmarking
- 17.6 Technology, Pricing and Differentiation
- 17.7 Regional Footprint and Distribution Strength
- 17.8 Mergers, Acquisitions and Strategic Alliances
- 17.9 New Entrants and Competitive Threats
- 17.10 Porter's Five Forces and Industry Attractiveness
- 17.11 Competitive Outlook, 2025-2035
Chapter 18 Company Profiles
- 18.1 Company Coverage and Selection Criteria
- 18.2 GCash
- 18.2.1 Business Description
- 18.2.2 Company Ownership and Geographic Presence
- 18.2.3 Product and Service Portfolio
- 18.2.4 Manufacturing and Operating Footprint
- 18.2.5 Financial Performance and Investment
- 18.2.6 Market Share and Competitive Position
- 18.2.7 Technology and Innovation Capabilities
- 18.2.8 Strategic Alliances or Partnerships
- 18.2.9 Recent Developments
- 18.2.10 Growth Strategy and Outlook
- 18.3 Maya
- 18.4 PayMongo
- 18.5 Xendit
- 18.6 Dragonpay
- 18.7 2C2P
- 18.8 Other Relevant Market Participants
Note: Every listed company is profiled on the structure shown under the first company. The company list is preliminary and may change based on research findings, market developments, data availability and client requirements.
Chapter 19 Disclaimer
- 19.1 Research and Forecast Disclaimer
- 19.2 Data Source and Estimation Limitations
Note: The depth of individual sections depends on data availability for this market. Volume, capacity, trade and other unit-based metrics are included where applicable.

