
Online Auction Market Overview:
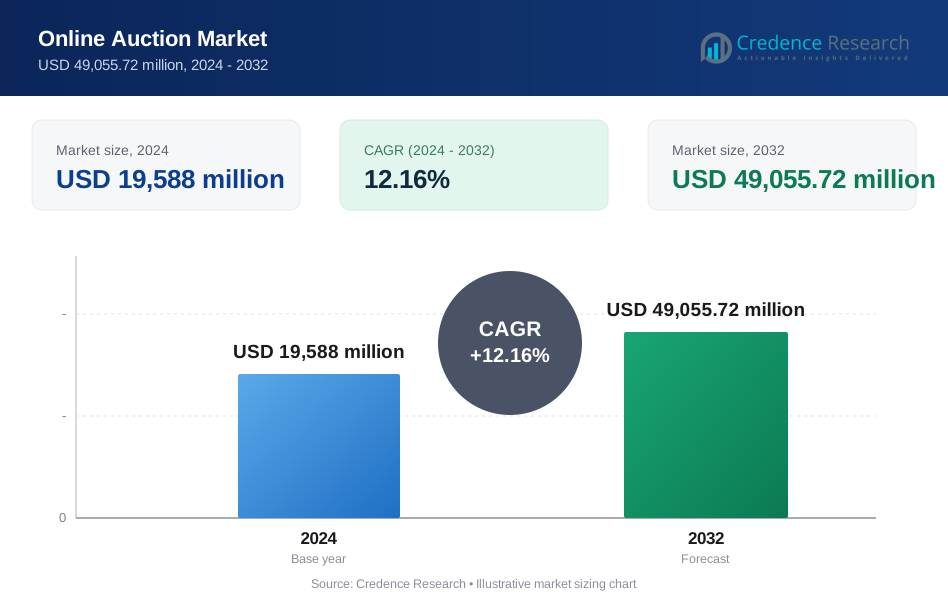
The Online Auction market size was valued at USD 19,588 million in 2024 and is anticipated to reach USD 49,055.72 million by 2032, growing at a CAGR of 12.16% during the forecast period.
| REPORT ATTRIBUTE | DETAILS |
|---|---|
| Historical Period | 2020-2023 |
| Base Year | 2024 |
| Forecast Period | 2025-2032 |
| Online Auction Market Size 2024 | USD 19,588 million |
| Online Auction Market, CAGR | 12.16% |
| Online Auction Market Size 2032 | USD 49,055.72 million |
The Online Auction market is driven by leading players such as eBay Inc., Alibaba Group, Amazon Auctions, Sotheby’s, Christie’s, Copart Inc., Heritage Auctions, LiveAuctioneers, Invaluable, and Bonhams. These companies compete through large user bases, diverse auction categories, and advanced digital bidding platforms. Market leaders focus on mobile-first experiences, secure payment systems, and buyer protection to strengthen trust. Strategic expansion into vehicles, electronics, and collectibles supports transaction growth. Regionally, North America leads the Online Auction market with a 35% market share, supported by high internet penetration, strong digital payment adoption, and mature e-commerce infrastructure. The region’s active consumer participation and established auction platforms continue to reinforce its leadership position.
Online Auction Market Insights
- The Online Auction market was valued at USD 19,588 million in 2024 and is projected to reach USD 49,055.72 million by 2032, growing at a CAGR of 12.16% during the forecast period, driven by rapid digital adoption.
- Growth is fueled by expanding e-commerce usage, mobile bidding, and secure digital payments, with forward auctions leading by auction type at a 61% market share.
- Market trends include mobile-first platforms, AI-driven recommendations, and category expansion, while competition remains strong as leading players scale platforms and enhance trust features.
- Key restraints include fraud risks, authenticity concerns, and complex cross-border regulations, which increase compliance costs and slow adoption in some regions.
- Regionally, North America leads with a 35% market share, followed by Europe at 27%, Asia Pacific at 25%, Latin America at 8%, and the Middle East and Africa at 5%, reflecting differences in digital maturity and consumer trust.
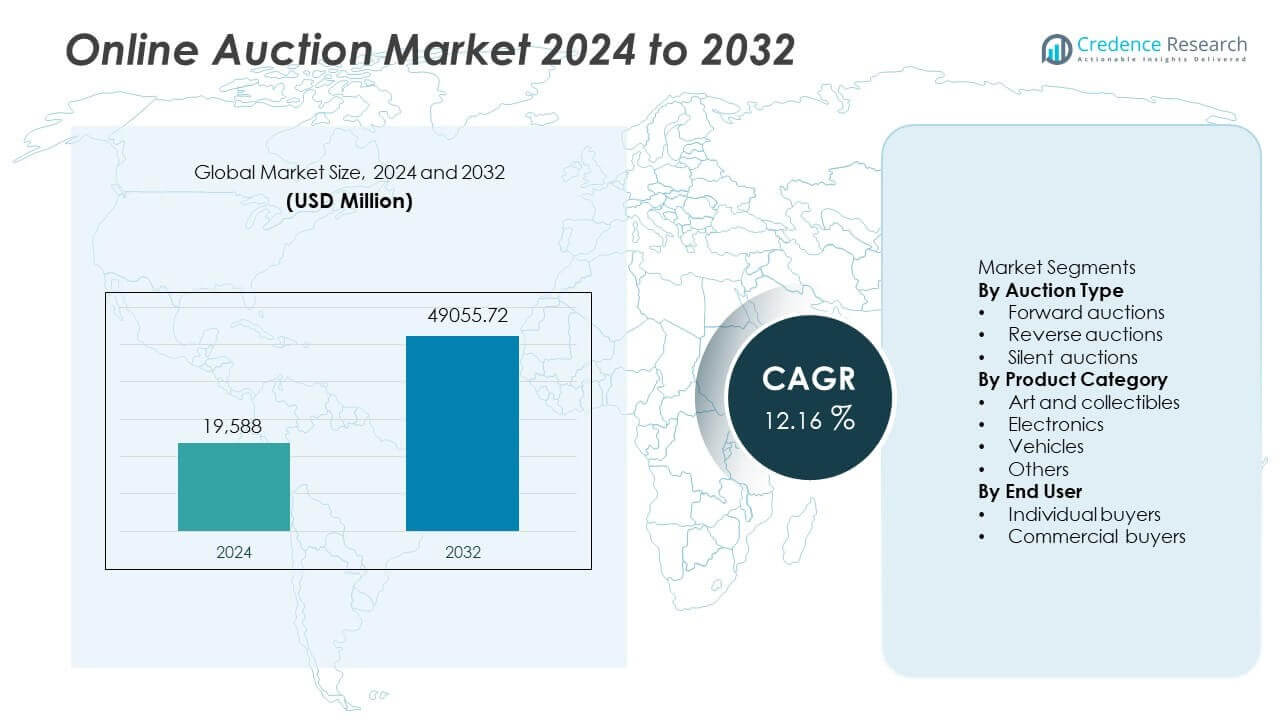
Online Auction Market Segmentation Analysis:
By Auction Type
The by auction type segment shows strong variation in buyer engagement models. Forward auctions dominated the Online Auction market, holding a 61% market share in 2024. Sellers prefer forward auctions due to price discovery benefits. Competitive bidding increases final selling value. Consumer familiarity also supports adoption. E-commerce integration strengthens forward auction visibility. Reverse auctions grow steadily in B2B procurement activities. Silent auctions remain niche, mainly in charity and closed-group events. However, forward auctions benefit from high transaction volumes. Ease of participation and transparent pricing continue driving dominance within this segment.
- For instance, eBay processes a massive volume of live listings through various sales formats, supported by its automatic bidding system and real-time settlement processes that determine winners and finalize transactions upon a sale's completion.
By Product Category
The by product category segment reflects shifting online purchasing behavior. Electronics led the segment with a 34% market share in 2024. High product turnover supports frequent auction activity. Consumers seek discounted prices on branded electronics. Rapid product upgrades create resale opportunities. Secure payment systems improve buyer confidence. Vehicles follow due to rising online vehicle resale platforms. Art and collectibles attract niche buyers with premium pricing. Other categories maintain moderate demand. Broad consumer reach and repeat purchases keep electronics as the leading product category in online auctions.
- For instance, Copart facilitated auctions for more than 4.5 million vehicles in one year using AI-powered damage assessment tools that generate condition reports from over 100 image data points per vehicle.
By End User
The by end user segment highlights demand differences between buyer groups. Individual buyers accounted for a 68% market share in 2024, making them the dominant sub-segment. Rising internet penetration supports individual participation. Mobile bidding apps improve user accessibility. Individuals seek value deals and unique items. Trust in digital platforms continues improving. Commercial buyers use auctions for bulk sourcing and liquidation. However, transaction volume remains higher among individuals. Ease of registration and lower entry barriers favor individual buyers. This user group continues driving platform traffic and revenue growth.
Key Growth Drivers
Rapid Growth of E-commerce and Digital Payments
The expansion of e-commerce strongly drives the Online Auction market. Consumers increasingly prefer digital purchasing channels for convenience and access. Secure digital payment systems improve transaction confidence. Integration with wallets and instant payments reduces friction. Higher internet penetration expands bidder participation globally. Mobile access supports real-time bidding activity. Platforms benefit from wider audience reach and higher transaction volumes. Sellers gain faster liquidation and broader demand exposure. These factors collectively accelerate platform adoption. Digital commerce maturity continues supporting sustained online auction market growth.
- For instance, Alibaba's Taobao Auctions processed a massive volume of completed transactions in a year using integrated Alipay escrow and instant settlement systems.
Rising Demand for Value-Based Purchasing
Buyers increasingly seek discounted and value-driven purchases. Online auctions enable competitive pricing through bidding dynamics. Price transparency attracts cost-conscious consumers. Inflationary pressures strengthen demand for alternative buying models. Auctions support access to premium goods at lower prices. Consumers value deal discovery and savings opportunities. Sellers benefit from demand-driven price discovery. Frequent promotional auctions increase engagement. This value-focused behavior expands repeat participation. Demand for cost efficiency remains a core growth driver.
- For instance, Heritage Auctions facilitated more than 2 million online bidder accounts, with its proprietary bidding platform processing over 6 million bids annually across collectibles and luxury asset auctions.
Increase in Asset Liquidation and Resale Activities
Businesses and individuals increasingly liquidate surplus assets online. Auctions offer efficient inventory clearance. Corporate restructuring supports bulk asset sales. Used goods resale gains popularity across categories. Sustainability awareness promotes reuse and circular economy models. Auctions reduce holding and disposal costs. Platforms support diverse asset categories. Faster turnaround times attract sellers. Growing secondary markets support transaction growth. Asset monetization trends continue driving market expansion.
Key Trends & Opportunities
Adoption of Mobile Bidding and Platform Innovation
Mobile-first auction platforms gain strong traction. Real-time notifications increase bidder engagement. App-based bidding improves participation convenience. AI tools enhance item recommendations and pricing insights. Data analytics optimize auction outcomes. Enhanced user interfaces improve retention. Live streaming auctions gain popularity. Technology upgrades support scalability. Innovation creates differentiation opportunities. Digital engagement trends strengthen platform competitiveness.
- For instance, LiveAuctioneers reported more than 3.8 million mobile app downloads, with its AI-driven recommendation engine indexing over 50 million auction lots for personalized bidding alerts.
Expansion into New Product Categories and Markets
Platforms expand beyond traditional categories. Vehicles, electronics, and refurbished goods gain traction. Emerging markets show rising adoption. Cross-border auctions increase global reach. Localization improves user experience. New seller onboarding expands listings. Partnerships support category diversification. This expansion unlocks untapped demand pools. Market penetration improves steadily. Diversification creates long-term growth opportunities.
- For instance, Sotheby’s digital auction platform supports more than 6 million registered bidders and has enabled online bidding across over 40 countries through its integrated global sales infrastructure.
Key Challenges
Trust, Fraud, and Authenticity Concerns
Trust remains a critical challenge in online auctions. Fraud risks affect buyer confidence. Authenticity verification increases operational complexity. Dispute resolution requires strong governance. Counterfeit goods damage platform reputation. Compliance costs rise with scale. Platforms invest in verification systems. User education becomes essential. Trust gaps slow adoption. Managing risk remains a persistent challenge.
Regulatory and Cross-Border Compliance Complexity
Regulatory frameworks vary across regions. Taxation rules complicate cross-border auctions. Consumer protection laws increase compliance burden. Data privacy regulations affect platform operations. Licensing requirements differ by country. Legal disputes increase operational risk. Smaller platforms face higher compliance costs. Adapting to regulations slows expansion. Compliance management demands resources. Regulatory complexity challenges sustained growth.
Regional Analysis North America
North America led the Online Auction market with a 35% market share in 2024, driven by high digital adoption and strong consumer trust in online platforms. The
United States dominates regional activity due to mature e-commerce infrastructure and widespread digital payment usage. Consumers actively participate in auctions for electronics, vehicles, and collectibles. Corporate asset liquidation through online auctions also remains strong. Advanced mobile bidding platforms enhance user engagement. High internet penetration and disposable income support frequent transactions. Established players continue investing in platform security and user experience, sustaining North America’s leadership.
Europe
Europe accounted for a 27% market share in 2024, supported by strong cross-border e-commerce activity and a well-regulated digital marketplace. Countries such as the United Kingdom, Germany, and France lead regional demand. Consumers show high interest in art, collectibles, and refurbished goods. Auction platforms benefit from transparent consumer protection laws. Growing sustainability awareness supports resale and secondary markets. Businesses use auctions for inventory clearance and asset disposal. Secure payment systems and multilingual platforms enhance accessibility. These factors maintain Europe as a key contributor to the Online Auction market.
Asia Pacific
Asia Pacific held a 25% market share in 2024, driven by rapid internet penetration and mobile-first consumer behavior. China, India, and Japan lead regional growth due to expanding digital user bases. Young consumers actively engage in online bidding through apps. Rising middle-class income supports discretionary spending. Electronics and vehicles dominate auction listings. Local platforms expand aggressively across urban areas. Digital wallets simplify transactions. Cross-border auctions also gain traction. High population density and digital adoption position Asia Pacific as a strong growth engine.
Latin America
Latin America represented an 8% market share in 2024, supported by improving internet access and growing e-commerce adoption. Brazil and Mexico lead regional participation due to large consumer bases. Online auctions attract price-sensitive buyers seeking value deals. Electronics and used vehicles see rising auction activity. Payment infrastructure continues improving across countries. Small businesses increasingly use auctions for liquidation. Platform trust remains a development focus. Economic recovery supports gradual growth. These factors contribute to steady expansion of the Online Auction market in Latin America.
Middle East and Africa
The Middle East and Africa accounted for a 5% market share in 2024, reflecting early-stage but improving adoption. Gulf countries drive regional demand through high smartphone usage and digital investments. Luxury goods and vehicles attract auction interest. Africa shows growing participation due to rising internet connectivity. Platforms focus on localized payment solutions. Trust-building measures remain critical for adoption. Cross-border auctions gain attention among niche buyers. Infrastructure development supports long-term potential. Gradual digital transformation underpins future growth in this region.
Online Auction Market Segmentations:
By Auction Type
- Forward auctions
- Reverse auctions
- Silent auctions
By Product Category
- Art and collectibles
- Electronics
- Vehicles
- Others
By End User
- Individual buyers
- Commercial buyers
By Geography
- North America
- U.S.
- Canada
- Mexico
- Europe
- Germany
- France
- U.K.
- Italy
- Spain
- Rest of Europe
- Asia Pacific
- China
- Japan
- India
- South Korea
- South-east Asia
- Rest of Asia Pacific
- Latin America
- Brazil
- Argentina
- Rest of Latin America
- Middle East & Africa
- GCC Countries
- South Africa
- Rest of the Middle East and Africa
Competitive Landscape
Competitive landscape analysis highlights a highly competitive Online Auction market led by eBay Inc., Alibaba Group, Amazon Auctions, Sotheby’s, Christie’s, Copart Inc., Heritage Auctions, LiveAuctioneers, Invaluable, and Bonhams. Market leaders focus on expanding digital reach and improving platform scalability. Companies invest in mobile bidding applications and real-time auction features. Secure payment systems and buyer protection policies strengthen user trust. Leading players diversify auction categories to increase transaction volumes. Strategic partnerships support cross-border auction activity. Data analytics enhance price discovery and user engagement. Competitive differentiation depends on platform reliability, category depth, and global reach. Continuous technology upgrades and trust-building measures remain central to sustaining competitiveness in the Online Auction market.
Key Player Analysis
- eBay Inc.
- Amazon (Amazon Auctions)
- Alibaba Group (Taobao Auctions)
- Sotheby’s
- Christie’s
- Heritage Auctions
- LiveAuctioneers
- Invaluable
- Bonhams
- Copart Inc.
Recent Developments
- In November 2025, Copart Inc. reported strong financial results for Q1 Fiscal 2026, showing growth in profit and continued online vehicle auction activity.
- In 2025, eBay Inc. continues to host online auctions for a global audience across 190 markets, but its "live bidding" strategy has largely shifted away from traditional third-party partnerships like Invaluable.
- In 2025, LiveAuctioneers continues to be a major online auction aggregator specifically for art, antiques, and luxury goods.
Report Coverage
The research report offers an in-depth analysis based on Auction Type, Product Category, End User and Geography. It details leading market players, providing an overview of their business, product offerings, investments, revenue streams, and key applications. Additionally, the report includes insights into the competitive environment, SWOT analysis, current market trends, as well as the primary drivers and constraints. Furthermore, it discusses various factors that have driven market expansion in recent years. The report also explores market dynamics, regulatory scenarios, and technological advancements that are shaping the industry. It assesses the impact of external factors and global economic changes on market growth. Lastly, it provides strategic recommendations for new entrants and established companies to navigate the complexities of the market.
Future Outlook
- Online auction platforms will continue expanding their global user base.
- Mobile bidding will remain the primary channel for user engagement.
- Trust and authentication systems will receive higher investment.
- Artificial intelligence will improve price discovery and recommendations.
- Cross-border auctions will gain stronger adoption.
- Expansion into vehicles and refurbished goods will accelerate.
- Individual buyers will remain the dominant user group.
- Strategic partnerships will support platform scalability.
- Regulatory compliance will shape platform operations.
- Emerging markets will drive long-term transaction growth.
Request a Free Sample
Fill in your details and we'll send you a free sample report.
- Sample data tables & charts
- Research methodology
Need a Custom Version of This Report?
Tailor the scope, geography, or segments to your exact requirements.
- Custom geography or segment scope
- Direct access to our analyst team
Frequently Asked Questions
What is the current market size for Online Auction market, and what is its projected size in 2032?
At what Compound Annual Growth Rate is the Online Auction market projected to grow between 2024 and 2032?
Which Online Auction market segment held the largest share in 2024?
What are the primary factors fueling the growth of the Online Auction market?
Who are the leading companies in the Online Auction market?
Which region commanded the largest share of the Online Auction market in 2024?
Table of Content
Chapter 1. Report Introduction
- 1.1 Report Description & Purpose
- 1.1.1 Report Title & Market Definition
- 1.1.2 Unique Selling Propositions (USP) & Key Differentiators
- 1.1.3 Value Proposition for Stakeholders
- 1.2 Research Objectives
- 1.2.1 Market Sizing Objectives (Volume & Revenue)
- 1.2.2 Segmentation Objectives
- 1.2.3 Competitive Intelligence Objectives
- 1.2.4 Forecast & Scenario Objectives
- 1.3 Report Scope
- 1.3.1 Online Auction Scope – Types & Subtypes Covered
- 1.3.2 Geographic Scope – Regions & Countries Covered
- 1.3.3 Historical Period, Base Year & Forecast Period (2024; forecast to 2032)
- 1.3.4 Inclusions & Exclusions
- 1.4 HS Code & Classification Framework
- 1.5 Currency, Units & Pricing Basis
- 1.6 Target Stakeholders
- 1.7 Limitations & Assumptions
Chapter 2. Executive Summary
- 2.1 Global Online Auction Market Snapshot
- 2.1.1 Market Size – Historical (2024) & Forecast (2024-2032) (2024: USD 19,588 million → 2032: USD 49,055.72 million)
- 2.1.2 Volume & Revenue – Global Totals
- 2.1.3 Key Market Highlights – Top Five Facts
- 2.2 Online Auction Market Segmentation Snapshot
- 2.2.1 Market Split by Region – 2024 vs. 2032
- 2.3 Competitive Snapshot
- 2.3.1 Top 10 Players by Revenue Share – 2024
- 2.3.2 Top 10 Players by Volume Share – 2024
- 2.3.3 Recent Strategic Developments (18-Month Summary)
- 2.4 Key Investment Highlights & Strategic Conclusions
Chapter 3. Online Auction Market Dynamics & Industry Analysis
- 3.1 Market Overview & Context
- 3.1.1 Online Auction Market Position in the Broader Automotive Value Chain
- 3.1.2 OEM vs. Replacement Market Dynamics
- 3.1.3 Market Maturity & Development Stage by Region
- 3.2 Online Auction Market Drivers
- 3.3 Online Auction Market Restraints & Challenges
- 3.4 Online Auction Market Opportunities
- 3.5 Porter's Five Forces Analysis
- 3.5.1 Threat of New Entrants
- 3.5.2 Bargaining Power of Suppliers
- 3.5.3 Bargaining Power of Buyers
- 3.5.4 Threat of Substitutes
- 3.5.5 Competitive Rivalry – Intensity Assessment
- 3.6 Online Auction Value Chain Analysis
- 3.6.1 Upstream – Raw Material/Input Suppliers
- 3.6.1.1 Raw Material/Input 1
- 3.6.1.2 Raw Material/Input 2
- 3.6.1.3 Raw Material/Input 3
- 3.6.2 Midstream – Production/Manufacturing/Service Delivery
- 3.6.2.1 Production/Process Overview
- 3.6.2.2 Key Facility Locations & Capacity by Manufacturer
- 3.6.3 Downstream – Distribution & End Consumer
- 3.6.3.1 Primary Channel – B2B/OEM
- 3.6.3.2 Secondary Channels – Dealer, Retail, Online, Direct
- 3.6.4 Value Chain Profitability Analysis
- 3.6.1 Upstream – Raw Material/Input Suppliers
- 3.7 PESTEL Analysis
- 3.7.1 Political Factors
- 3.7.2 Economic Factors
- 3.7.3 Social Factors
- 3.7.4 Technological Factors
- 3.7.5 Environmental Factors
- 3.7.6 Legal Factors
- 3.8 Online Auction Supply Chain Analysis
- 3.8.1 Raw Material/Input Supply Risk Assessment
- 3.8.2 Manufacturing Concentration Risk (Geographic Exposure)
- 3.8.3 Trade Disruption Impact Analysis
- 3.9 Regulatory & Policy Landscape
Note: The regulatory and policy landscape section covers regulations based on their applicability to the market, Online Auction category, geography, and scope of the study. Only regulatory frameworks with a material impact on operations, compliance, trade, sustainability, or market access are analyzed in detail.
Chapter 4. Key Investment Pockets & Opportunity Analysis
- 4.1 Online Auction Market Attractiveness Analysis
- 4.1.1 By Region – Investment Attractiveness Matrix (Volume × CAGR)
- 4.2 Absolute Revenue Growth Opportunity
- 4.2.1 By Region – Absolute USD Growth Through 2032
- 4.3 Incremental Volume Opportunity
- 4.3.1 By Region – Incremental Volume Through 2032
- 4.3.2 Segment – Incremental Volume
- 4.4 Emerging Submarket Opportunity Deep Dive (Subject to Applicability)
- 4.5 Emerging Market Opportunity Scorecards
- 4.5.1 United States
- 4.5.2 Europe
- 4.5.3 Asia
- 4.5.4 Middle East & Africa
Note: Emerging Market Opportunity Scorecards will be included based on relevance and strategic importance. Regions listed are indicative and may vary depending on data availability and market dynamics.
Chapter 5. Online Auction Import-Export Analysis & Trade Flows
- 5.1 Global Trade Overview
- 5.1.1 Global Export Value by Country (2024)
- 5.1.2 Global Export Volume by Country (2024)
- 5.1.3 Global Import Value by Country (2024)
- 5.1.4 Global Import Volume by Country (2024)
- 5.1.5 Net Trade Balance by Country (2024)
- 5.2 Export Analysis – Segment
- 5.2.1 Type 1 (HS Code)
- 5.2.2 Type 2 (HS Code)
- 5.2.3 Type 3 (HS Code)
- 5.2.4 Type 4 (HS Code)
- 5.2.5 Type 5 (HS Code)
- 5.3 Import Analysis – Segment
- 5.3.1 Type 1 (HS Code)
- 5.3.2 Type 2 (HS Code)
- 5.3.3 Type 3 (HS Code)
- 5.3.4 Type 4 (HS Code)
- 5.3.5 Type 5 (HS Code)
- 5.4 Average Unit Trade Prices
- 5.4.1 Average Export Price – Segment & Country
- 5.4.2 Average Import Price – Segment & Source Country
- 5.4.3 Price Trends (2024)
- 5.5 Key Trade Route Analysis
- 5.5.1 Trade Route 1
- 5.5.2 Trade Route 2
- 5.5.3 Trade Route 3
- 5.5.4 Trade Route 4
- 5.5.5 Trade Route 5
- 5.6 Trade Policy Impact Assessment
- 5.6.1 US Anti-Dumping & Section 301 Tariffs
- 5.6.2 EU Customs Union Impact
- 5.6.3 Major Free Trade Agreements
- 5.6.4 USMCA Rules of Origin
Note: Trade policy analysis will be included only where relevant to the Online Auction market.
Chapter 6. Competitive Landscape & Company Benchmarking
- 6.1 Online Auction Market Concentration & Structure
- 6.1.1 Herfindahl-Hirschman Index (HHI) – vs. 2024
- 6.1.2 Tier 1, Tier 2 & Tier 3 Market Structure
- 6.1.3 Global, Regional & Local Player Dynamics
- 6.2 Online Auction Market Share Analysis – 2024
- 6.2.1 Global Revenue Share by Company
- 6.2.2 Global Volume Share by Company
- 6.2.3 Regional Revenue Share
- 6.2.4 Market Share Evolution ( vs. 2024)
- 6.2.5 OEM Segment Share by Company
- 6.2.6 Replacement Segment Share by Company
- 6.3 Production/Delivery Capacity & Facility Analysis
- 6.3.1 Global Installed Capacity
- 6.3.2 Capacity Utilization Rates
- 6.3.3 Production/Output Volume
- 6.3.4 Facility Locations & Capacity Map
- 6.3.5 Planned Capacity Additions
- 6.4 Online Auction Competitive Benchmarking Matrix
- 6.4.1 Revenue, Volume, CAGR & Profitability Comparison
- 6.4.2 Channel Revenue Mix
- 6.4.3 Geographic Revenue Exposure
- 6.4.4 R&D Intensity
- 6.4.5 Sustainability Maturity
- 6.5 Strategic Developments in Online Auction (Last 24 Months)
- 6.5.1 Mergers, Acquisitions & Divestments
- 6.5.2 New Online Auction Launches
- 6.5.3 Facility Expansions
- 6.5.4 Strategic Alliances, Joint Ventures & Partnerships
- 6.5.5 Distribution Expansion & Market Entry
- 6.5.6 Sustainability & ESG Initiatives
- 6.6 Competitive Strategy Mapping
- 6.6.1 Leader, Challenger, Follower & Niche Classification
- 6.6.2 Pricing Strategy Comparison
- 6.6.3 Channel Strategy Matrix
Note: Strategic developments are included based on their materiality and the availability of reliable information.
Chapter 7. Global Online Auction Market – By Distribution Channel
- 7.1 Segment Overview
- 7.1.1 Volume & Revenue Split by Channel (2024 & 2032)
- 7.1.2 Channel Mix Evolution (2024-2032)
Chapter 8. Regional Market Analysis – Global Overview
- 8.1 Global Regional Overview
- 8.1.1 Regional Volume Share
- 8.1.2 Regional Revenue Share
- 8.1.3 Regional Volume by Region
- 8.1.4 Regional Revenue by Region
- 8.1.5 Regional Forecast Through 2032
- 8.2 Cross-Regional Segment Analysis
- 8.2.1 By Distribution Channel
- 8.2.2 By Brand/Price Tier
Chapter 9. North America Online Auction Market
- 9.1 United States
- 9.2 Canada
- 9.3 Mexico
Chapter 10. Europe Online Auction Market
- 10.1 Germany
- 10.2 France
- 10.3 Italy
- 10.4 United Kingdom
- 10.5 Spain
- 10.6 Poland
- 10.7 Russia
- 10.8 Netherlands
- 10.9 Belgium
- 10.10 Sweden
- 10.11 Denmark
- 10.12 Norway
- 10.13 Rest of Europe
Chapter 11. Asia Pacific Online Auction Market
- 11.1 China
- 11.2 India
- 11.3 Japan
- 11.4 South Korea
- 11.5 Thailand
- 11.6 Indonesia
- 11.7 Vietnam
- 11.8 Malaysia
- 11.9 Australia
- 11.10 Rest of Asia Pacific
Chapter 12. Latin America Online Auction Market
- 12.1 Brazil
- 12.2 Argentina
- 12.3 Colombia
- 12.4 Chile
- 12.5 Rest of Latin America
Chapter 13. Middle East Online Auction Market
- 13.1 Saudi Arabia
- 13.2 United Arab Emirates
- 13.3 Turkey
- 13.4 Israel
- 13.5 Iran
- 13.6 Rest of the Middle East
Chapter 14. Africa Online Auction Market
- 14.1 South Africa
- 14.2 Egypt
- 14.3 Nigeria
- 14.4 Morocco
- 14.5 Rest of Africa
Chapter 15. Online Auction Company Profiles
- 15.1 [Company 01]
- 15.1.1 Company Overview
- 15.1.2 Key Management Personnel
- 15.1.3 Products & Services Portfolio
- 15.1.4 Financial Performance
- 15.1.5 Key Market Focus & Geographic Presence
- 15.1.6 Recent Developments & Strategic Initiatives
Note: The company profile list is preliminary and may change based on research findings, market developments, data availability, and client requirements.
Chapter 16. Appendices
- Appendix A – List of Abbreviations & Acronyms
- Appendix B – Industry Classification Code Reference – Full Series
- Appendix C – Production & Capacity Data Tables
- Appendix D – End-Use & Demand Base Tables
- Appendix E – Consumption & Replacement Rate Assumptions
- Appendix F – ASP Reference Tables
- Appendix G – Manufacturing & Facility Database
- Appendix H – Import-Export Data Tables
- Appendix I – Regulatory Summary Tables
- Appendix J – Primary Research Participant List (Anonymized)
- Appendix K – Primary Research Questionnaire Framework
- Appendix L – Data Sources & Bibliography
- Appendix M – Market Size Divergence & Source Comparison
Chapter 17. Research Methodology
- 17.1 Research Framework & Philosophy
- 17.2 Secondary Research – Sources, Hierarchy & Data Extraction
- 17.3 Data Modeling – Bottom-Up & Top-Down Market Sizing
- 17.4 Primary Research – Stakeholder Framework, LOI & Sample Sizes
- 17.5 Forecast Methodology – Regression, Scenario & Sensitivity Analysis
- 17.6 Quality Control – Four-Layer Validation Framework
- 17.7 Limitations & Standard Assumptions
- 17.8 Disclaimer
