
New cities and coastal resorts reshape Egyptian homebuying
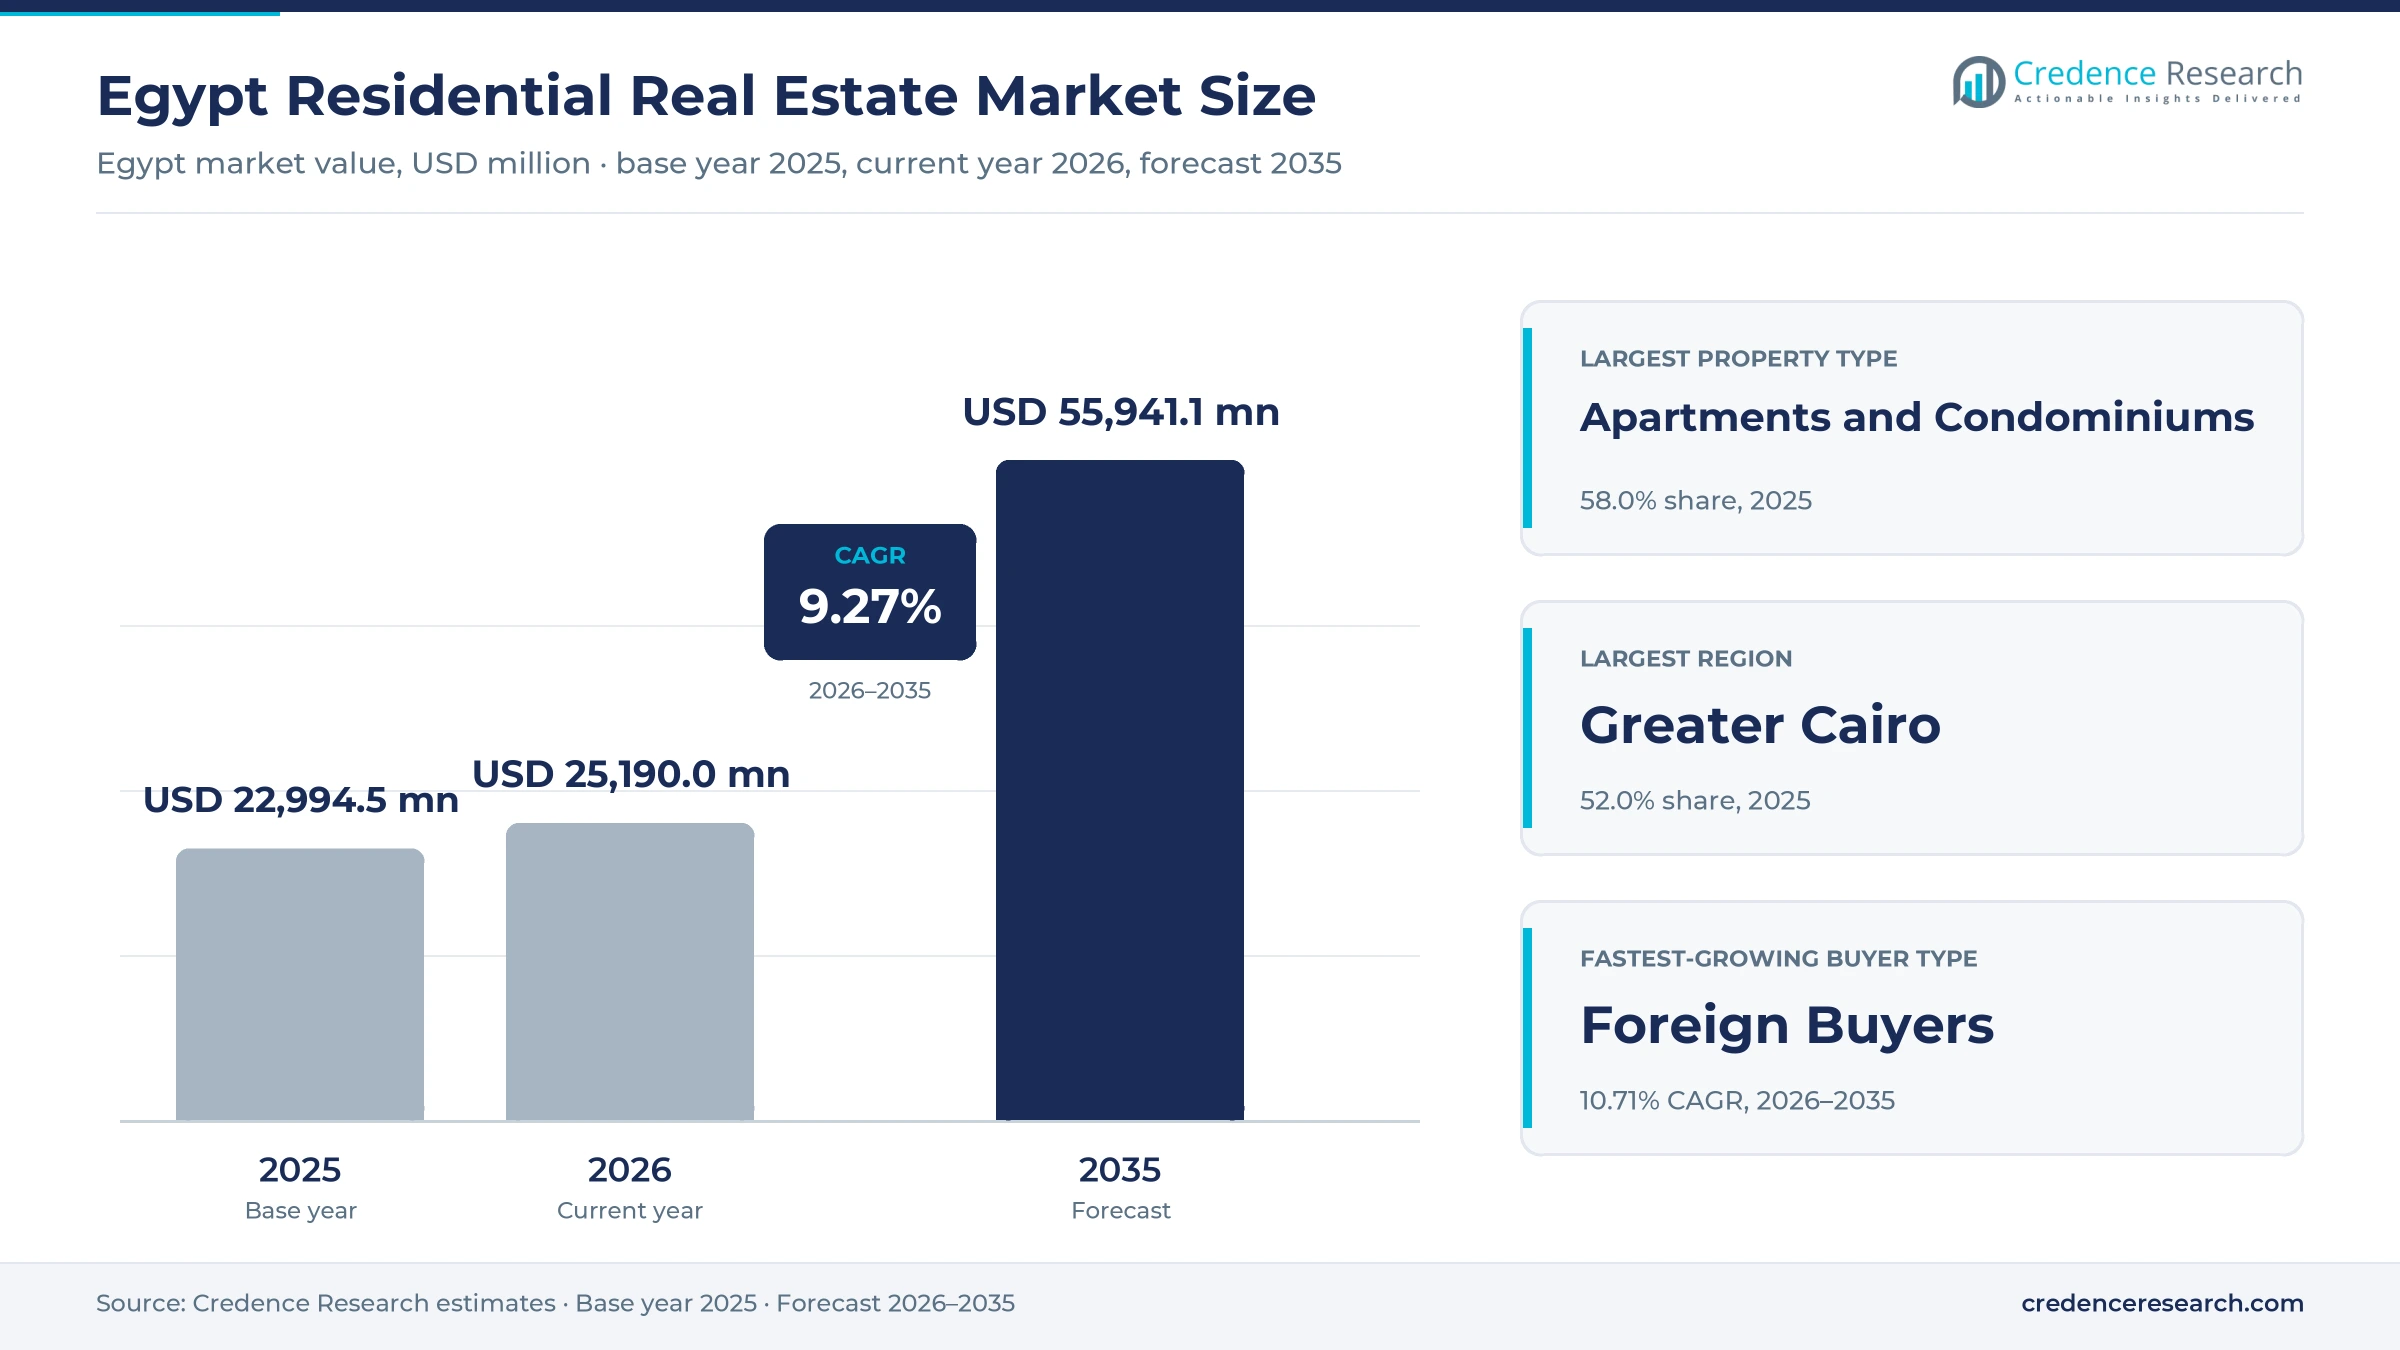
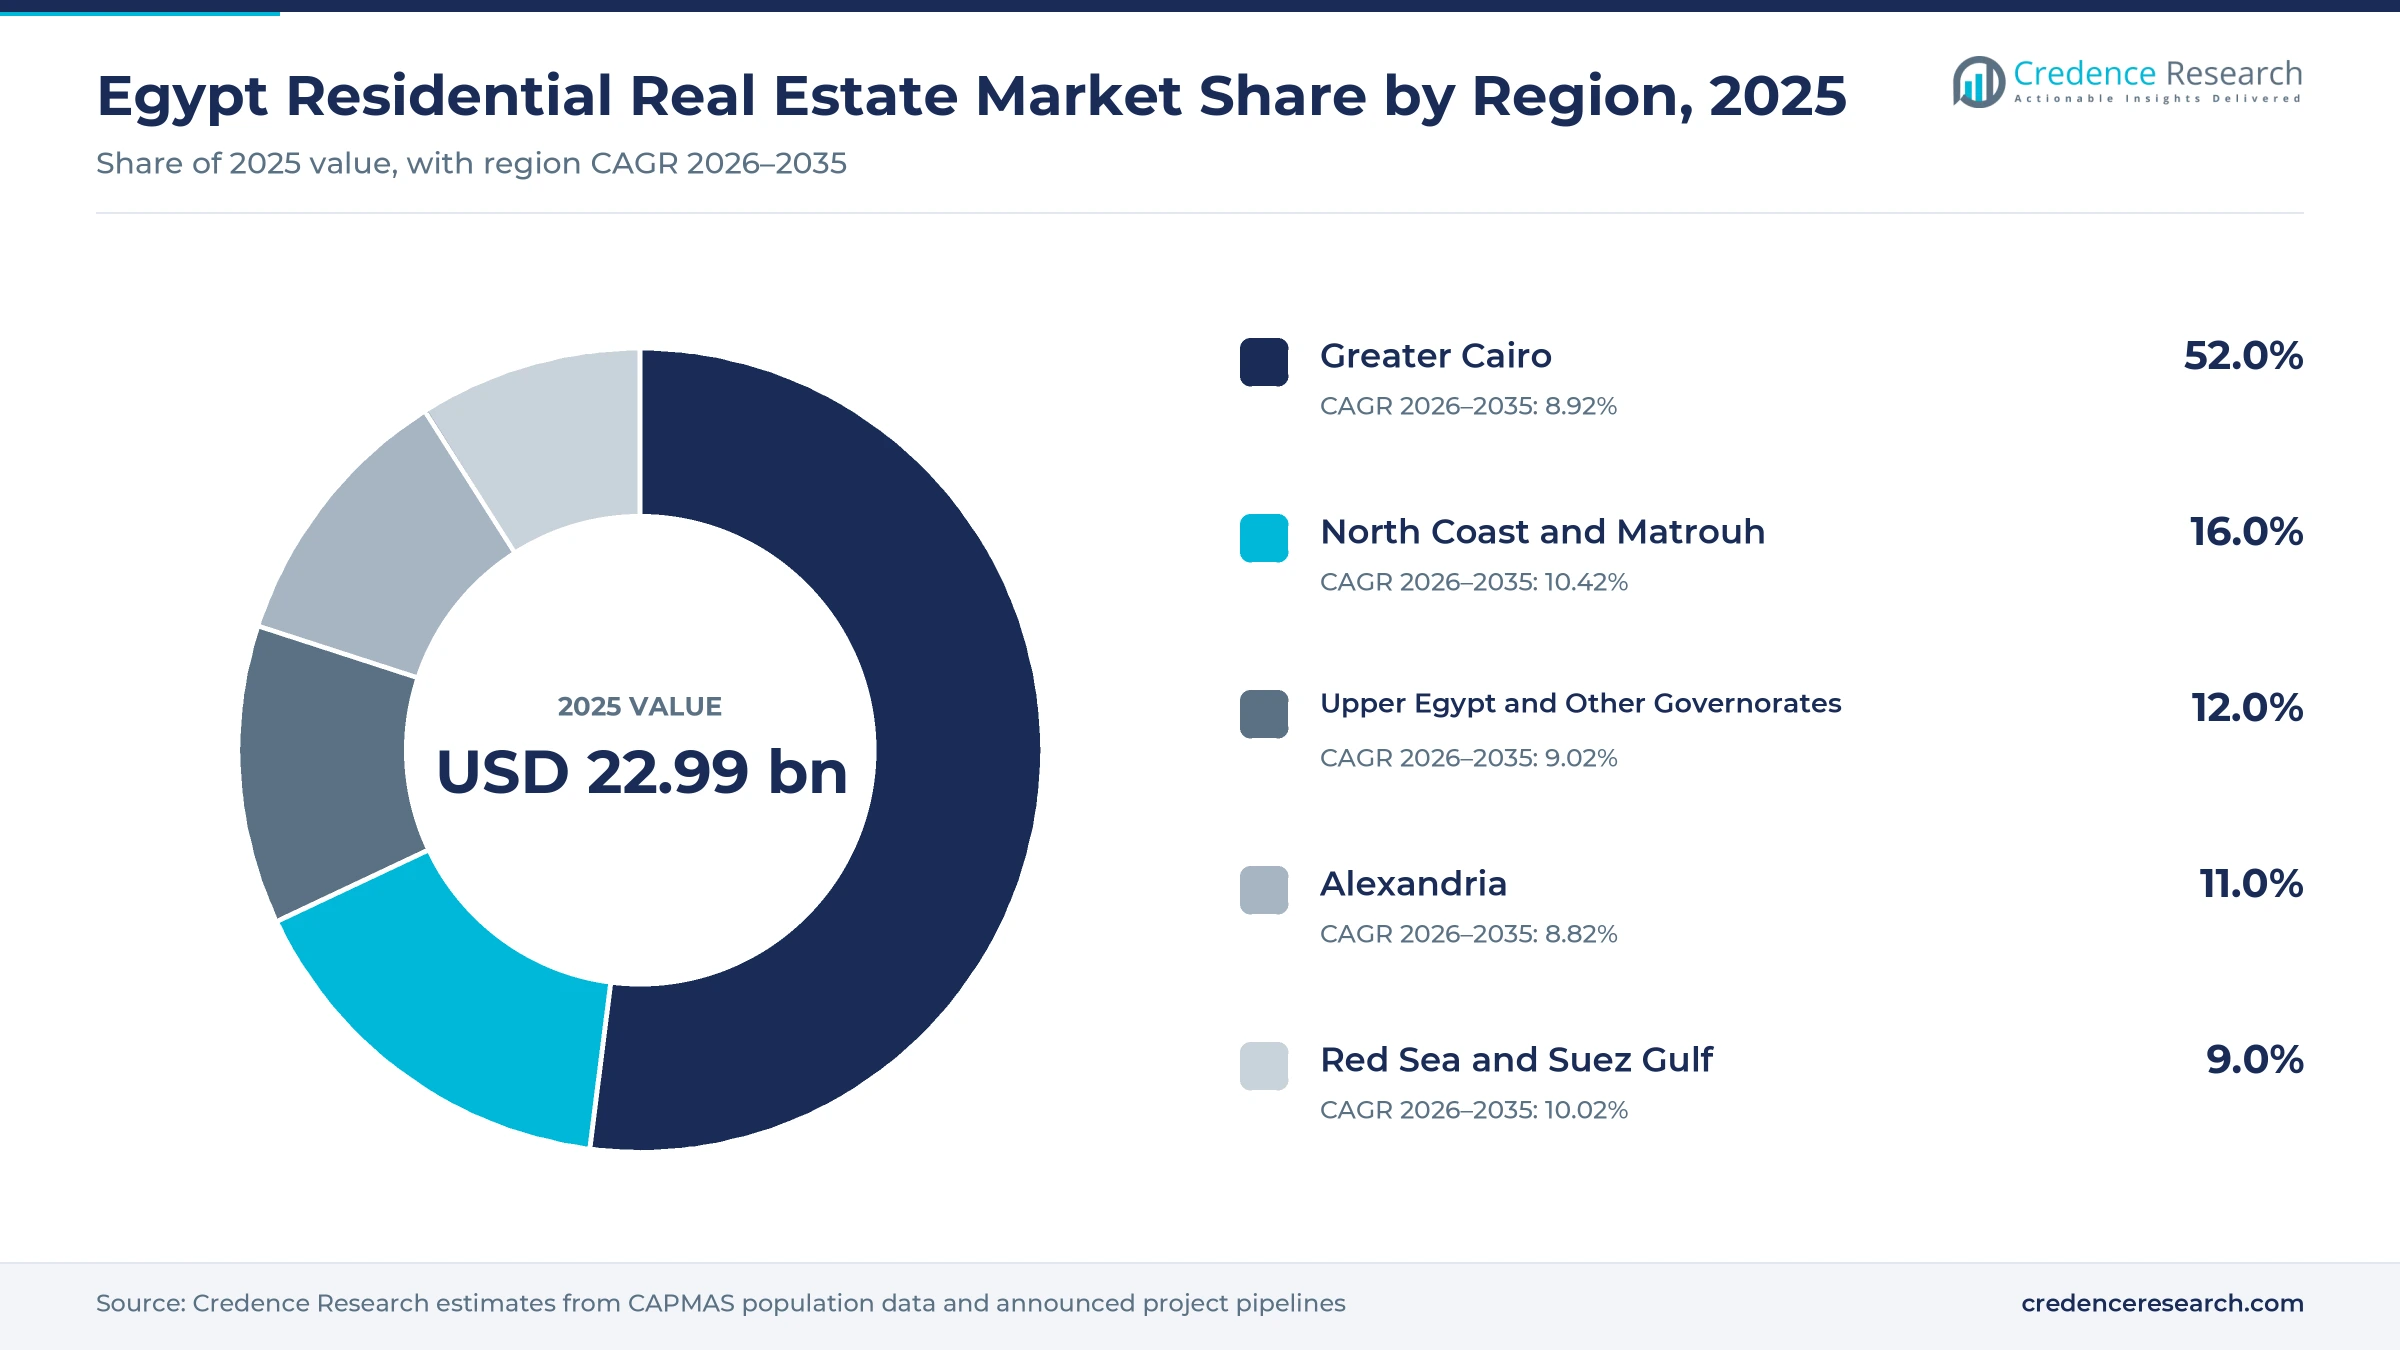
The Egypt residential real estate market was valued at USD 22.99 billion in 2025 and is projected to increase from USD 25.19 billion in 2026 to USD 55.94 billion by 2035, registering a CAGR of 9.27% during 2026–2035. Demand comes from a domestic population of about 109.5 million, young households forming in Greater Cairo, Egyptians abroad who buy homes with foreign currency and investors who use property as a hedge against inflation. Greater Cairo held the largest regional share, 52.0% in 2025, because new cities such as the New Administrative Capital, New Cairo and 6th of October absorb most first-home purchases. The North Coast and Matrouh region grows fastest at 10.42% a year, as Gulf-backed megaprojects at Ras El Hekma and Alam El Roum add second-home and year-round supply. Meanwhile, the Housing for All Egyptians program has completed more than one million low-income units, which widens mortgage-backed ownership.
What does the Egypt housing market estimate include?
The estimate measures the value of residential transactions in Egypt, covering primary sales of completed and off-plan homes, secondary resales and the annual value of long-term residential leases. It includes apartments, villas, townhouses, twin houses, duplexes and penthouses in integrated communities, standalone buildings, coastal resorts and government-supported developments. Values are stated in USD million at current prices, converted from Egyptian pounds at average annual exchange rates.
The estimate excludes commercial, office, retail and hotel space, along with land sales that are not tied to a home. It also excludes short-stay holiday rentals and construction contracts that developers award to contractors. The value chain runs from state land allocation by the New Urban Communities Authority through private and public developers, brokers and banks to households that buy, resell or lease homes.
Egypt Residential Real Estate Market Insights
- The Egypt residential real estate market was valued at USD 22.99 billion in 2025 and is projected to reach USD 55.94 billion by 2035, registering a CAGR of 9.27% during 2026–2035.
- Greater Cairo held 52.0% of 2025 value, because the capital region and its new cities hold the largest pool of first-time buyers.
- Apartments and condominiums led with 58.0% of 2025 value, since most new-city and social housing supply is built as mid-rise apartment blocks.
- A consortium led by ADQ agreed in February 2024 to pay USD 24 billion for Ras El Hekma development rights on the North Coast.
- Remittances from Egyptians abroad reached a record USD 36.5 billion in fiscal 2024/25, which supports expatriate home purchases in foreign currency.
Apartments and off-plan sales carry most housing value
Why do apartments dominate Egyptian home sales?
Based on property type, the market is categorized into apartments and condominiums, villas and landed houses, townhouses and twin houses, and duplexes and penthouses. Apartments and Condominiums led with 58.0% of 2025 value, because social housing and most new-city compounds are built as apartment blocks. Townhouses and Twin Houses grow fastest at 9.66% a year, as gated communities in East and West Cairo and on the coasts offer attached homes at lower prices than standalone villas.
Which buyer groups drive housing demand?
Based on buyer type, the market is categorized into first-time homebuyers, existing homeowners, domestic investors, expatriate Egyptians and foreign buyers. First-Time Homebuyers led with 34.0% of 2025 value, because household formation and subsidized mortgages bring many young families into ownership. Foreign Buyers grow fastest at 10.71% a year from a small base, as Gulf-backed coastal projects and dollar-priced units attract overseas purchasers.
How important are off-plan sales in Egypt?
Based on transaction type, the market is categorized into primary completed sales, primary off-plan sales, secondary resales and long-term residential leasing. Primary Off-Plan Sales led with 51.0% of 2025 value, because developers fund construction through installment plans that often run eight to ten years. Primary Completed Sales grow fastest at 9.54% a year, as buyers increasingly prefer delivered homes that qualify for mortgage finance.
| Segment Group | Leading Sub-segment | Share, 2025 | Fastest-growing Sub-segment | CAGR, 2026–2035 |
|---|---|---|---|---|
| By Property Type | Apartments and Condominiums | 58.0% | Townhouses and Twin Houses | 9.66% |
| By Buyer Type | First-Time Homebuyers | 34.0% | Foreign Buyers | 10.71% |
| By Transaction Type | Primary Off-Plan Sales | 51.0% | Primary Completed Sales | 9.54% |
Request a Free Sample
Fill in your details and we'll send you a free sample report.
- Sample data tables & charts
- Research methodology
Population, new cities and mortgages widen demand
How does a large domestic buyer base support demand?
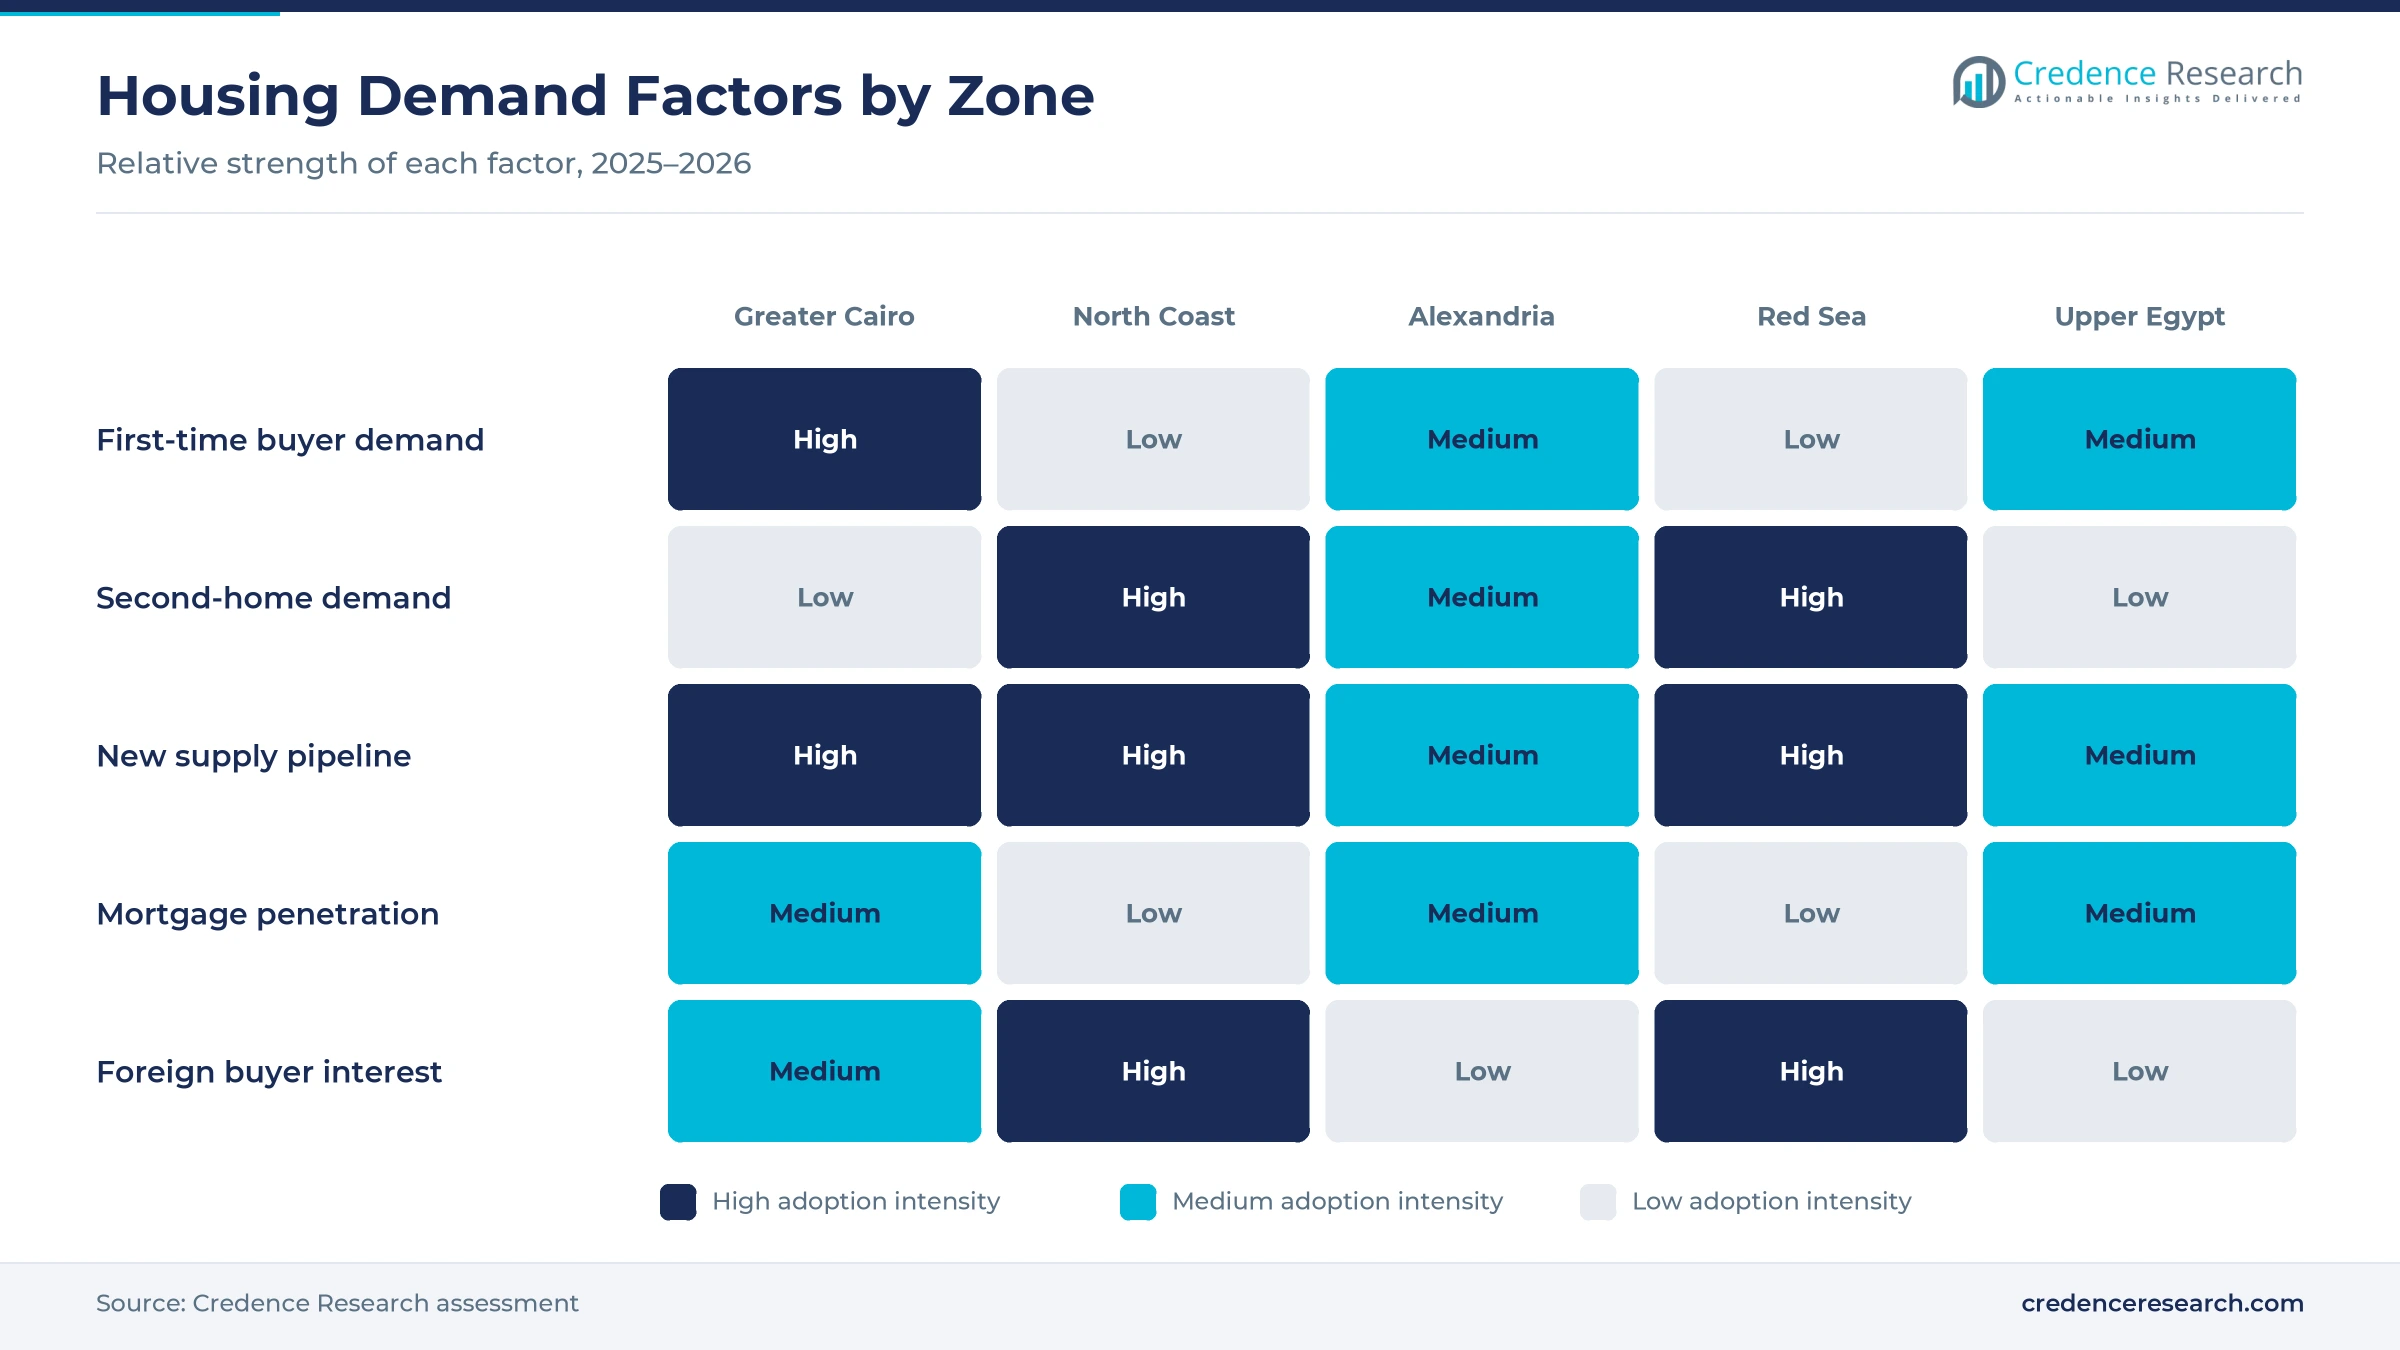
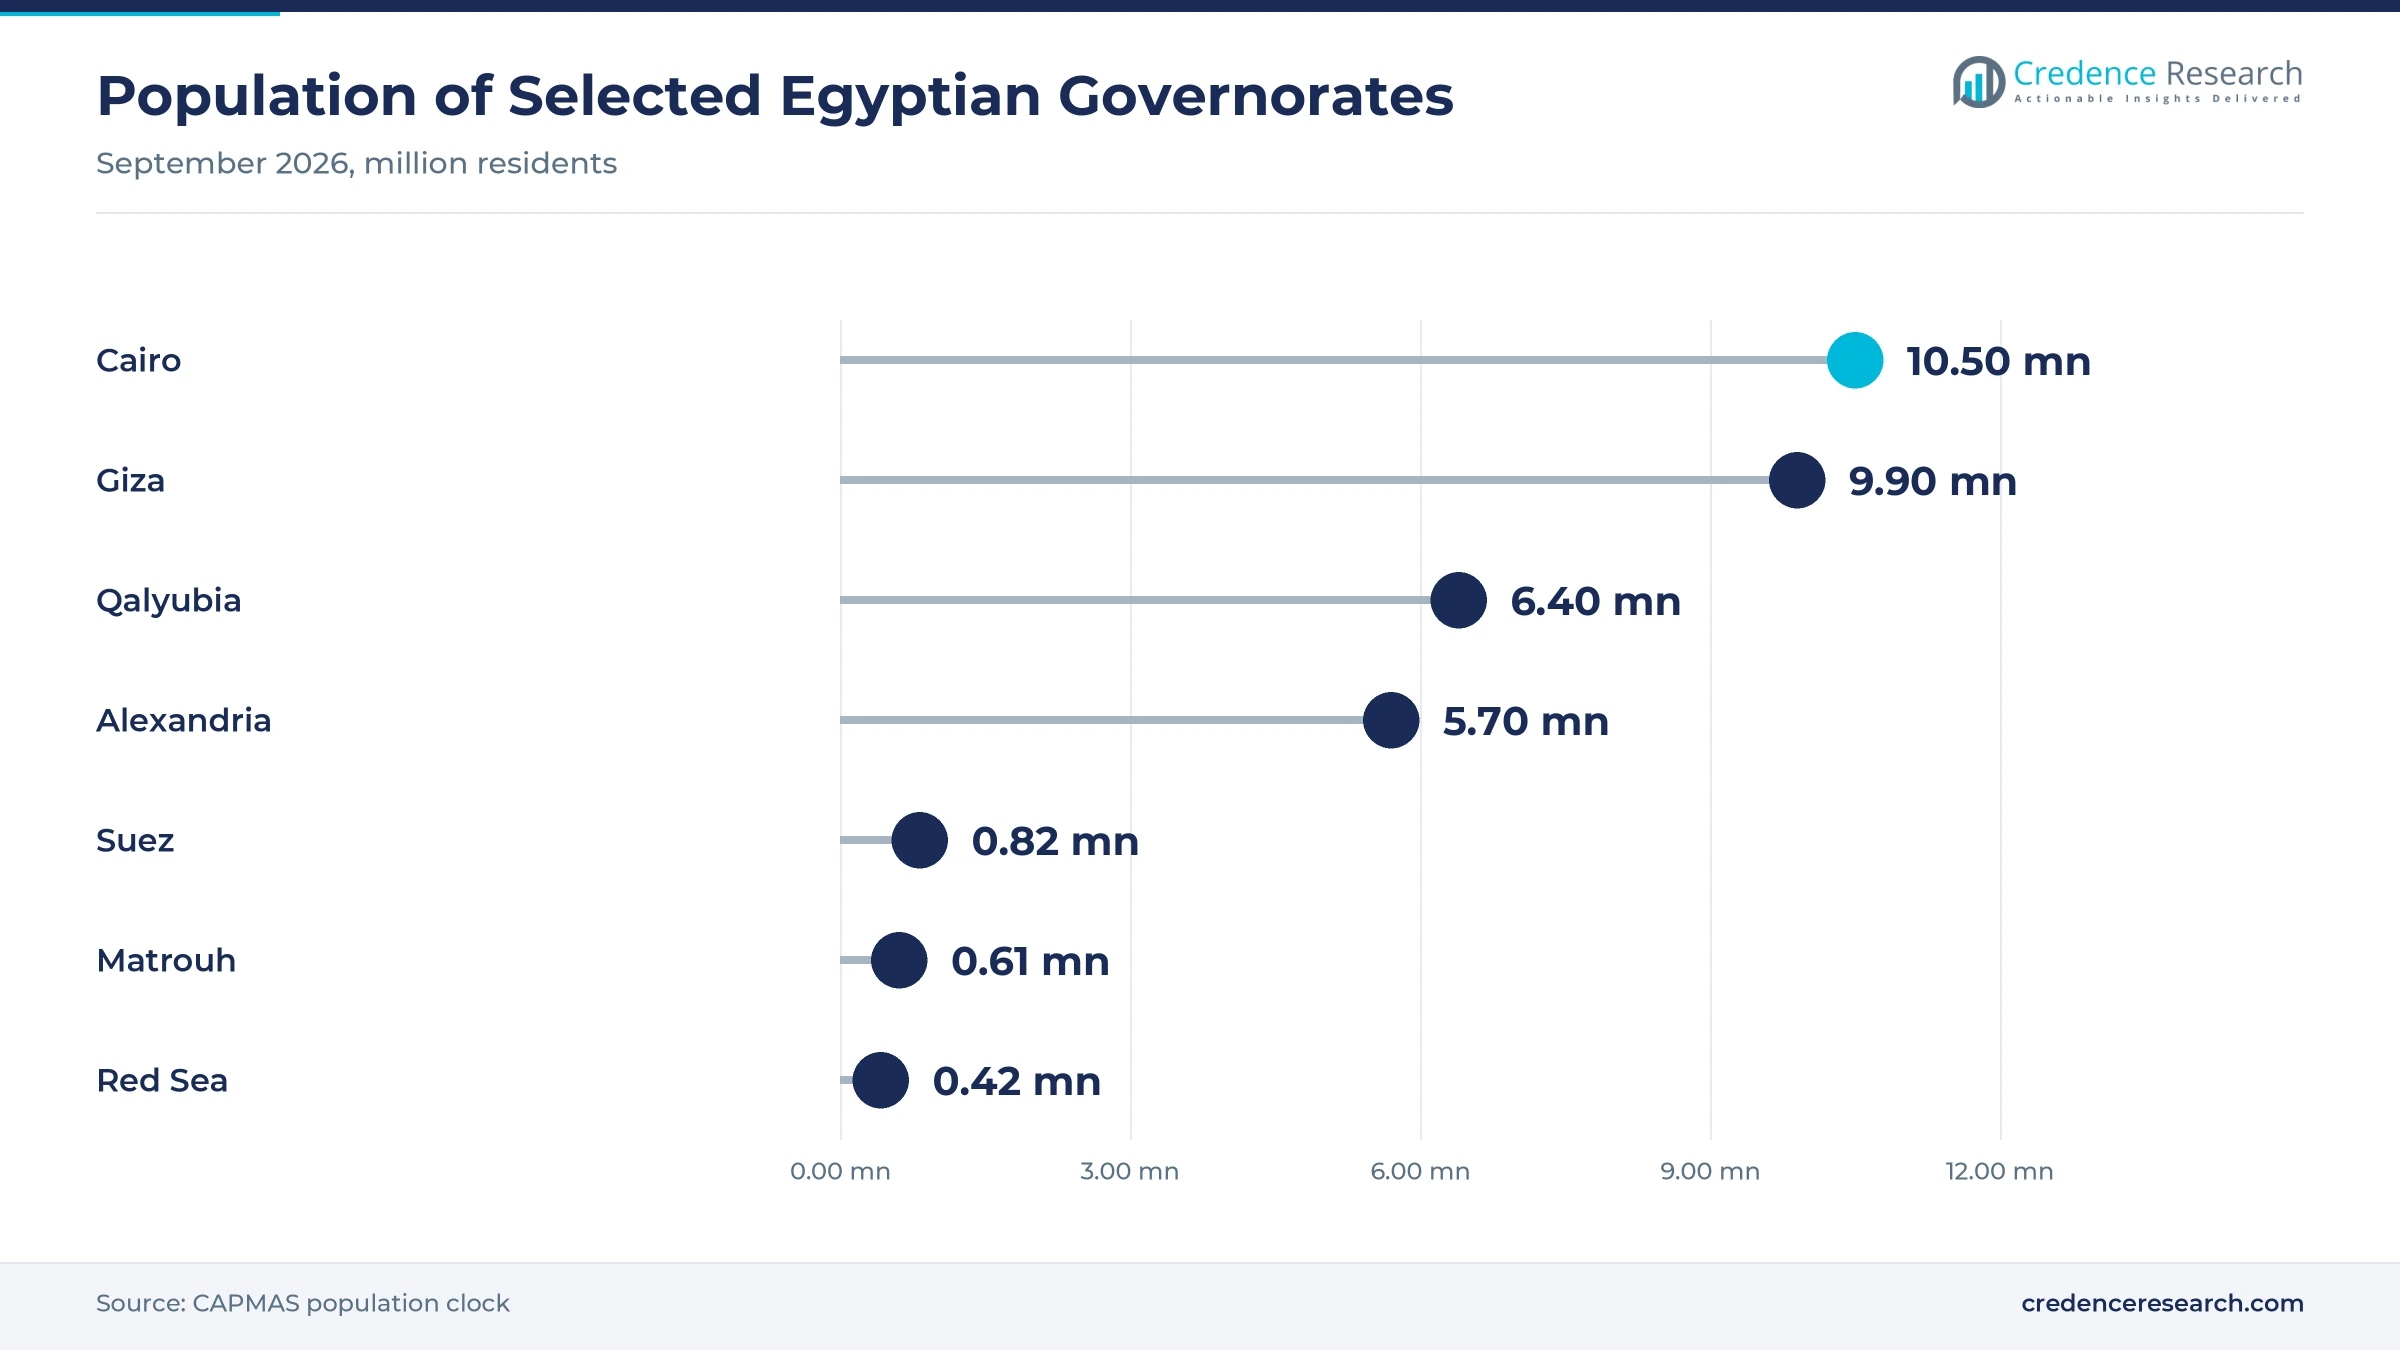
A large and growing domestic population gives the housing market a deep base of first-time buyers every year. Egypt's population inside the country reached about 109.5 million in September 2026, according to the CAPMAS population clock, up from 108 million in August 2025. Cairo alone counts about 10.5 million residents and Giza about 9.9 million, so the capital region concentrates household formation. As a result, first-time homebuyers held 34.0% of 2025 value, and young families keep demand for mid-priced apartments steady even when prices rise. This demographic base also supports resale and rental activity in older districts, where many families rent before they buy their first home.
Why do new cities and state housing expand supply?
New cities and state housing programs expand the supply of homes that buyers can finance and occupy. The government announced in September 2018 a plan for 20 fourth-generation cities across 13 governorates to house about 30 million people, including the New Administrative Capital on about 170,000 feddans. The Social Housing and Mortgage Finance Fund reported about 1,002,100 completed units by December 2025, with 54,600 units delivered under its Green Housing Program. In turn, contractors increasingly adopt prefabricated housing construction methods to deliver blocks faster, which keeps new-city supply moving and lets more buyers move into finished residential real estate within a few years.
How is broader housing finance access lifting ownership?
Broader access to housing finance turns latent demand into completed purchases, especially for low and middle-income households. Egypt's mortgage market grew from USD 132 million in 2014 to USD 2.2 billion in 2026, according to the World Bank, and 31 public and private lenders now take part. More than 693,000 low-income households have received ownership subsidies, and almost two-thirds of borrowers are first-time borrowers. The Central Bank of Egypt also cut its overnight deposit rate by 100 basis points to 20% at its final 2025 meeting, which eases installment costs for new borrowers. In turn, more households can now qualify for bank loans on delivered units.
Why do remittances from Egyptians abroad matter?
Remittances from Egyptians abroad are a major source of housing demand, because many expatriates buy homes for family use or retirement. Remittances reached a record USD 36.5 billion in fiscal 2024/25, up 66.2% from USD 21.9 billion a year earlier, according to Central Bank of Egypt data. Inflows kept rising in calendar 2025, reaching USD 37.5 billion in the first eleven months, a 42.5% increase. As a result, expatriate Egyptians grow faster than most buyer groups through 2035, and developers price more units in dollars to capture this demand. This buyer group also favors completed units that families can occupy during summer visits.
Gulf capital pulls homebuyers toward the coasts
How is Gulf capital shifting the North Coast?
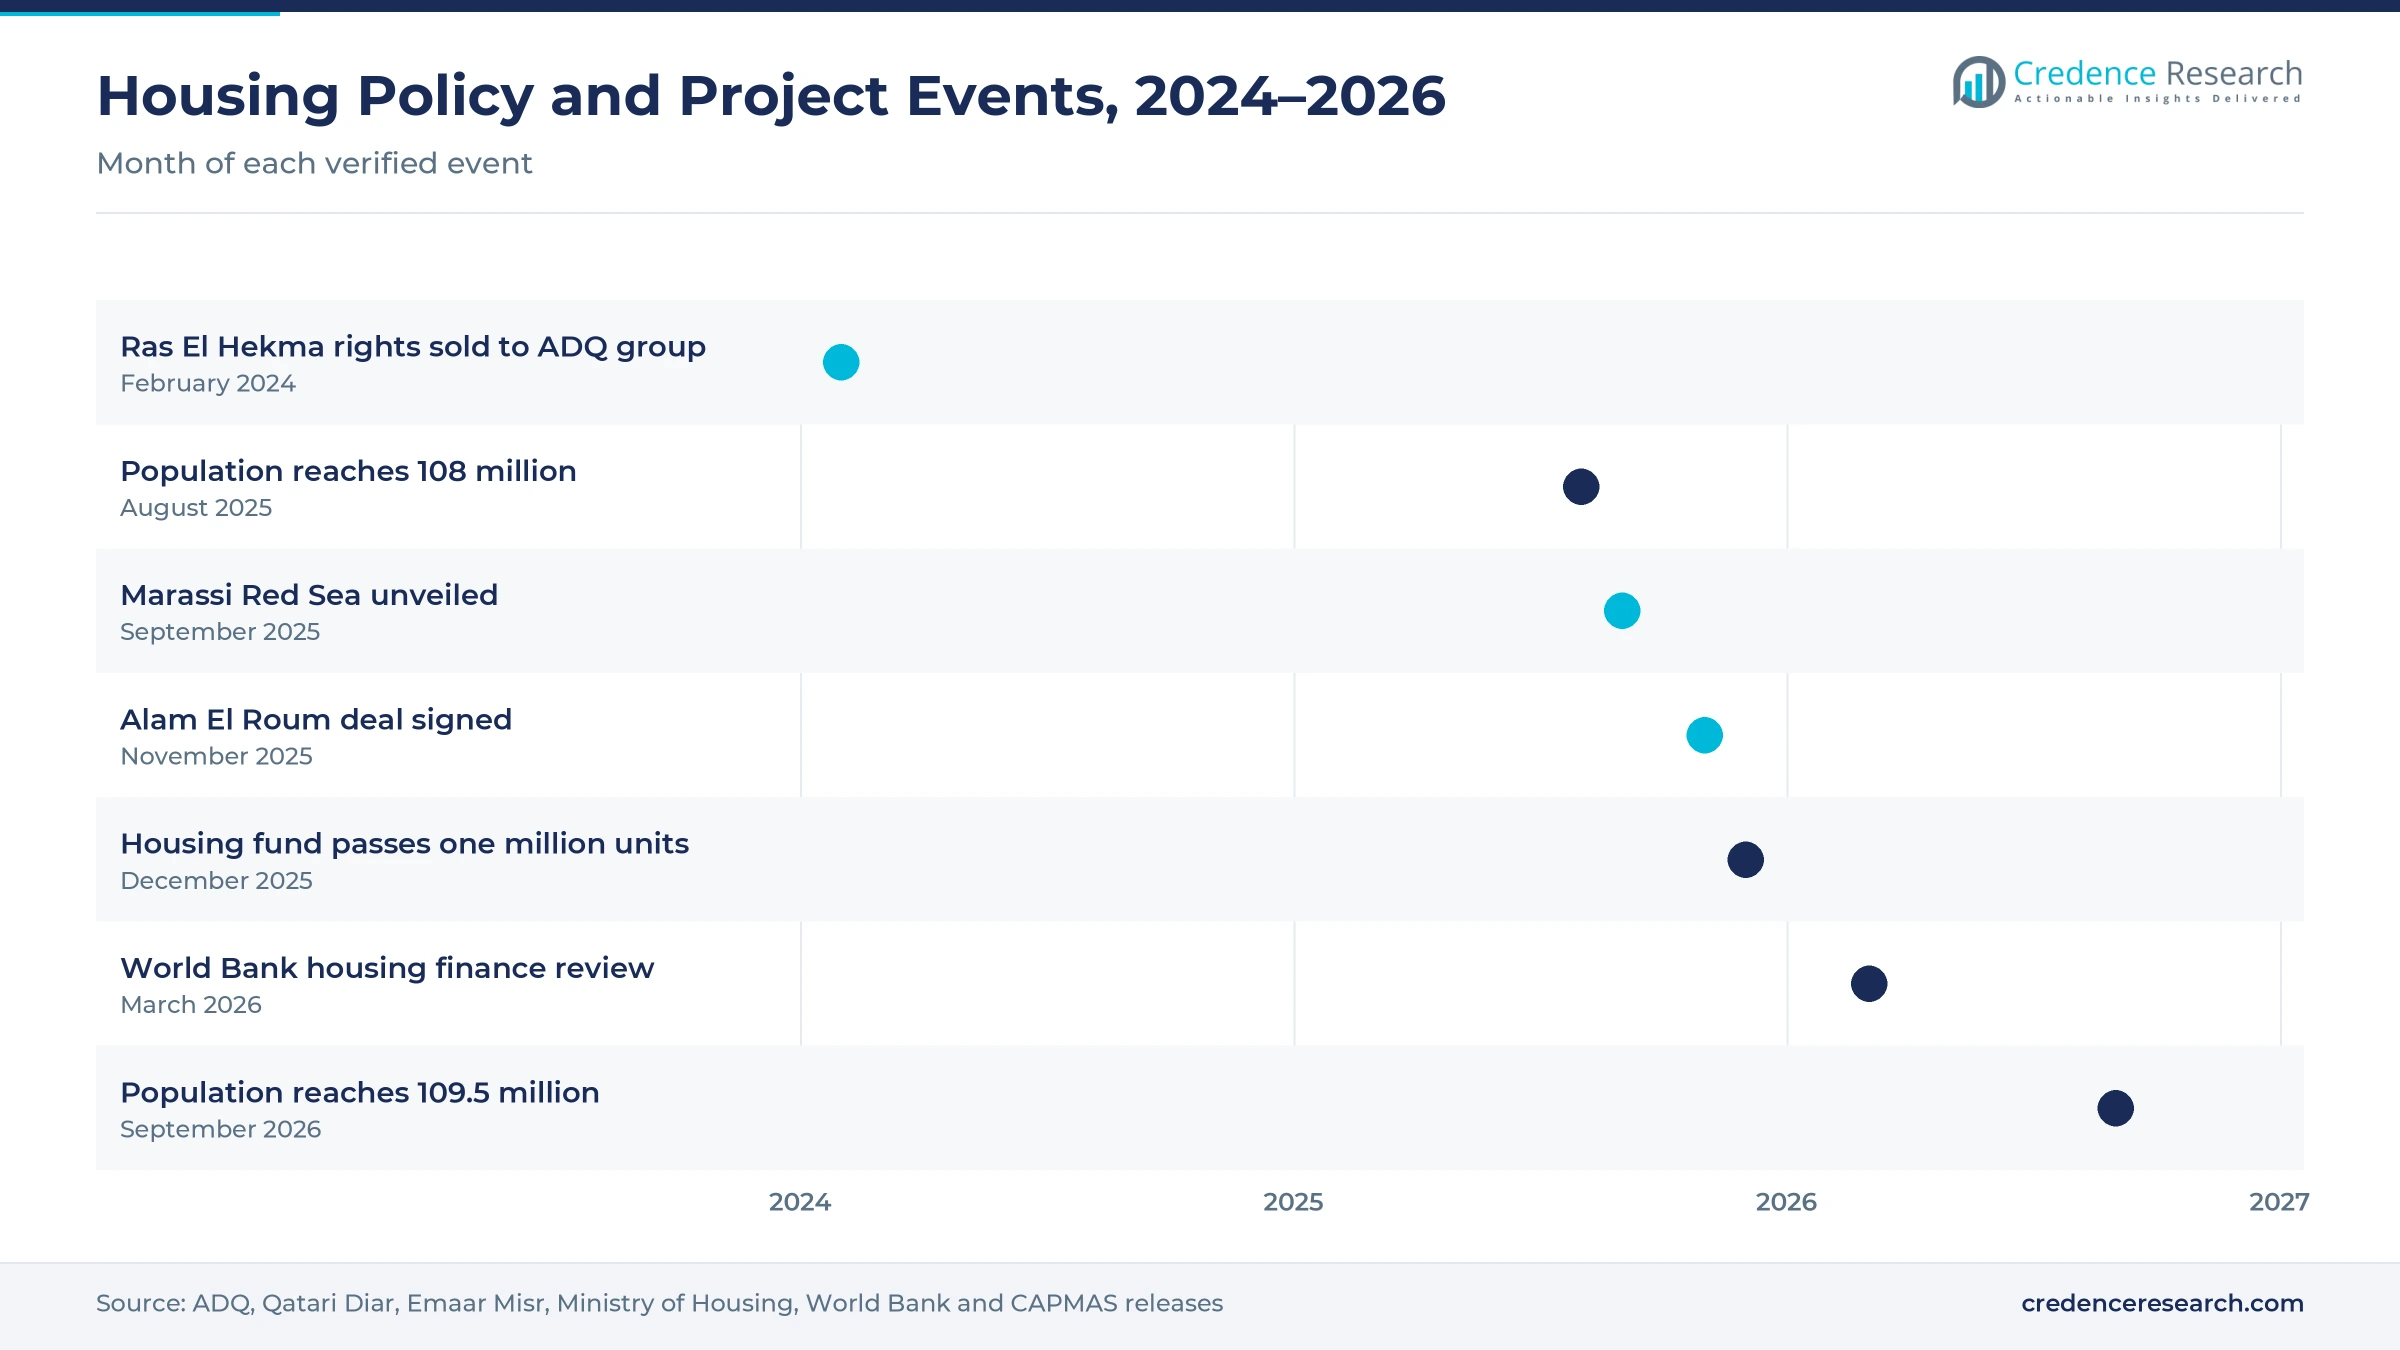
Gulf sovereign capital is shifting the North Coast from a summer resort strip toward planned year-round cities. A consortium led by ADQ agreed on Feb. 23, 2024 to pay USD 24 billion for Ras El Hekma development rights covering about 170 million square meters, according to ADQ. In November 2025, Qatari Diar signed a USD 29.7 billion deal for Alam El Roum in Matrouh, with residential land making up about 60% of the site. Palm Hills and Miran also planned a 5.65 million square meter Ras El Hekma project with sales from summer 2026. These deals explain why the North Coast region posts the fastest growth among the five zones.
Why are Red Sea homes rising as primary residences?
Red Sea homes are rising as primary residences rather than holiday units, which lengthens occupancy and supports resale values. Emaar Misr and City Stars unveiled Marassi Red Sea in September 2025, an USD 18.5 billion project on about 10 million square meters. Orascom Development reported in September 2024 that remote work led residents of El Gouna to live there year-round, with its chief executive saying second homes were becoming primary homes. In turn, the Red Sea and Suez Gulf region grows at 10.02% a year, faster than the national average. This shift also lifts demand for schools, clinics and services inside resort towns.
Can green-certified affordable units open new demand?
Green-certified affordable housing offers an opening, because buyers gain lower utility bills and lenders gain an eligible asset class. The national program targets 55,000 green-certified units and has already achieved more than 40,000, according to a March 2026 World Bank review. Women heads of household make up 25% of program participants, which brings new buyers into formal ownership. Meanwhile, more than 580,000 low-income families applied to the program in 2025, so demand still exceeds supply. Developers that adapt efficient designs for mid-market compounds could therefore win mortgage-ready buyers outside the subsidized pool. This opening is largest in new cities, where green units can be priced close to standard apartments.
Will lower interest rates open the middle-income segment?
Lower interest rates open the middle-income segment, which has relied mostly on developer installment plans rather than bank loans. The housing fund reported EGP 4 billion in middle-income mortgage finance through 10 banks and four finance companies by December 2025, a small amount compared with low-income lending. Headline inflation was projected to average about 14% in 2025, down from 28.3% in 2024, which gives the central bank room to keep easing. Therefore, primary completed sales grow at 8.92% or better in the capital, and lenders could finance more delivered units in East and West Cairo through 2035. Banks that design mortgage products for salaried middle-income families would gain from this shift.
Inflation, currency swings and delivery risk weigh on buyers
How do inflation and currency swings affect buyers?
Inflation and currency swings are the main constraint, because they raise construction costs and erode household purchasing power. Developers reprice launches several times a year when the pound weakens, which pushes many buyers toward smaller units or longer installment plans. As a result, first-time buyers face higher monthly payments, while investors buy to protect savings. Stable exchange rates and lower inflation would ease this pressure on demand.
Why does delivery risk weigh on off-plan sales?
Delivery risk weighs on off-plan sales, because buyers pay installments for years before receiving a finished home. Rising material and labor costs can strain developers that sold units at fixed prices, which sometimes delays handovers in new cities. In turn, buyers increasingly favor developers with large land banks and delivery records, which concentrates sales among listed companies. Escrow rules and phased launches help reduce this risk for households.
How does the mortgage gap limit middle-income demand?
The mortgage gap limits middle-income demand, because bank lending still covers only a small share of home purchases outside the subsidized program. High policy rates in 2023 and 2024 made market-rate loans expensive, so most buyers relied on developer credit. Consequently, developers carry long receivables on their balance sheets, which limits how many new projects they can launch. Deeper bank lending would shift this burden away from developers.
Will vacant units in new cities slow absorption?
Vacant units in new cities slow absorption, because many buyers purchase homes as savings and leave them empty for years. Low occupancy reduces demand for local shops, schools and transport, which makes some districts less attractive to families. Therefore, resale prices in these areas may lag newer compounds with services already running. Better transport links and leasing incentives could lift occupancy and support secondary sales.
Greater Cairo leads while the North Coast grows fastest
| Region | Value, 2025 (USD billion) | Share, 2025 | CAGR, 2026–2035 |
|---|---|---|---|
| Greater Cairo | 11.96 | 52.0% | 8.92% |
| North Coast and Matrouh | 3.68 | 16.0% | 10.42% |
| Upper Egypt and Other Governorates | 2.76 | 12.0% | 9.02% |
| Alexandria | 2.53 | 11.0% | 8.82% |
| Red Sea and Suez Gulf | 2.07 | 9.0% | 10.02% |
Why does Greater Cairo account for half of housing value?
Greater Cairo held 52.0% of 2025 value and grows at 8.92% a year, because Cairo, Giza and Qalyubia are home to about 26.8 million people. New Cairo, the New Administrative Capital, 6th of October and Sheikh Zayed host most gated compounds, and mixed-use districts there combine homes with commercial property such as offices and malls. Madinet Masr's 5.5 million square meter Sarai project near the New Administrative Capital shows how large these compounds have become. Mortgage access and job growth keep demand broad across price tiers.
How fast is the North Coast and Matrouh region growing?
The North Coast and Matrouh region held 16.0% of 2025 value and grows fastest at 10.42% a year, because Ras El Hekma, Alam El Roum and New Alamein are adding large planned communities. Matrouh has only about 606,600 residents, so most buyers come from Cairo, Alexandria and the Gulf. City Edge Developments launched the 848-unit Beachfront Towers in New Alamein in 2024, which reflects a shift toward high-rise homes that can be used year-round. Qatari Diar's Alam El Roum project, signed for USD 29.7 billion according to Gulf Times, adds further supply.
What role does Alexandria play in housing demand?
Alexandria held 11.0% of 2025 value and grows at 8.82% a year, because the city of about 5.7 million people has a large stock of older apartments and an active resale market. Limited land inside the city pushes new supply toward the desert road and the western coast. As a result, secondary resales and long-term leasing form a larger part of local value than in the new cities, and buyers often trade up to North Coast compounds.
Why is the Red Sea and Suez Gulf region gaining share?
The Red Sea and Suez Gulf region held 9.0% of 2025 value and grows at 10.02% a year, because Hurghada, El Gouna, Sahl Hasheesh and Ain Sokhna attract both holiday and permanent buyers. Foreign purchasers from Europe and the Gulf are more common here than elsewhere in Egypt. New launches such as Marassi Red Sea and the Galala and Sokhna corridor near Cairo are widening supply for weekend and retirement homes.
How do Upper Egypt and other governorates contribute?
Upper Egypt and other governorates held 12.0% of 2025 value and grow at 9.02% a year, because Delta and Upper Egypt governorates such as Sharqia, Dakahlia, Minya and Sohag hold large populations but lower prices. Social housing and new cities such as New Mansoura and New Minya add affordable apartments. However, lower incomes and informal ownership keep average transaction values below the capital.
Megaproject deals and housing milestones of 2024 to 2026
| Development | Status and market relevance |
|---|---|
| In February 2024, an ADQ-led consortium agreed to invest USD 35 billion in Egypt, including USD 24 billion for Ras El Hekma development rights. | The Egyptian government keeps a 35% stake; works were planned to start in early 2025 |
| In September 2025, Emaar Misr and City Stars unveiled Marassi Red Sea, an USD 18.5 billion project on about 10 million square meters. | Adds a large coastal community on the Red Sea, led by an Emaar Misr affiliate |
| In November 2025, Egypt and Qatari Diar signed a USD 29.7 billion agreement to develop Alam El Roum on the North Coast. | About 60% of the 4,900-acre site is residential, with a 7.2 km Mediterranean waterfront |
| In December 2025, the Social Housing and Mortgage Finance Fund reported about 1,002,100 completed units and EGP 90 billion in low-income mortgage finance. | Confirms the scale of state-backed ownership for low-income households |
| In March 2026, the World Bank reported that Egypt's mortgage market reached USD 2.2 billion and more than 693,000 households received subsidies. | Shows deeper housing finance under the Inclusive Housing Finance Program |
Digital sales, green units and tall towers change delivery
- Online sales platforms let developers launch phases, take reservations and manage installment schedules digitally, which widens reach to Egyptians abroad.
- Green building standards such as the certified units in the national program cut energy and water use, which lowers running costs for low-income owners.
- High-rise construction in New Alamein and the New Administrative Capital depends on modern lifts, and elevator modernization programs keep older towers in Cairo and Alexandria competitive.
- Digital community management tools handle service charges, maintenance requests and access control inside gated compounds, which supports resale values.
Need a Custom Version of This Report?
Tailor the scope, geography, or segments to your exact requirements.
- Custom geography or segment scope
- Direct access to our analyst team
Listed developers compete on land banks and payment plans
Competition in Egyptian residential real estate is led by listed and Gulf-backed developers that hold large land banks in East and West Cairo and on the coasts. Talaat Moustafa Group is a partner in the Ras El Hekma development alongside ADQ and Modon, while Emaar Misr leads Marassi Red Sea through an affiliate. Palm Hills Developments and SODIC, which is backed by Aldar, compete for upper-mid and premium buyers in West Cairo and on the North Coast. Madinet Masr targets East Cairo near the New Administrative Capital, and City Edge Developments builds towers in New Alamein. Developers compete on location, payment plans that often run eight to ten years, delivery records and community services. Firms with professional property management teams also win repeat buyers.
Companies profiled and their roles in this market
| Company | Type | Role in the market |
|---|---|---|
| Talaat Moustafa Group Holding | Listed developer | Partner in the Ras El Hekma development with ADQ and Modon; operates large gated cities in East Cairo |
| Emaar Misr | Listed developer | Leads Marassi Red Sea through an affiliate and develops coastal and Cairo communities |
| Palm Hills Developments | Listed developer | Planning a 5.65 million square meter Ras El Hekma project with Miran, with sales from summer 2026 |
| SODIC | Developer backed by Aldar | Holds a 440-acre North Coast project and plans Nobu residences in West Cairo |
| Madinet Masr | Listed developer | Develops Sarai, a 5.5 million square meter community near the New Administrative Capital |
| City Edge Developments | Developer | Launched the 848-unit Beachfront Towers in New Alamein in 2024 |
| Orascom Development Egypt | Listed developer | Develops El Gouna and Makadi Heights on the Red Sea, where homes are becoming primary residences |
| Mountain View | Developer | Runs iCity communities in New Cairo and 6th of October and a Ras El Hekma project |
Credence Research view on coastal supply and mortgages
Credence Research's view is that demand for Egyptian residential real estate will stay strong through 2035, but growth will rely more on mortgages and coastal supply than on investor buying alone. Greater Cairo remains the core market, yet Gulf-funded projects at Ras El Hekma and Alam El Roum will lift the North Coast faster. If inflation keeps falling and banks lend more to middle-income buyers, completed sales could grow faster than this base case. However, another currency shock would push buyers back toward off-plan units priced as inflation hedges.
How the housing transaction estimate was built
The report uses 2025 as the base year, with values in USD million at current prices. Market values come from the Credence Research model, which combines new housing supply, resale activity and lease values with average prices by zone. Regional shares for the five zones are Credence Research estimates built from CAPMAS population data and announced project pipelines, because the source list gives zone names without shares. Segment splits by property, buyer and transaction type are also Credence Research estimates. Sources used are government housing statistics, central bank releases, World Bank reports, company announcements and news reports, and no interviews or surveys were used.
Mortgage depth and coastal launches set the 2035 path
The market is expected to reach USD 55.94 billion by 2035, a 9.27% CAGR during 2026–2035, as household formation, new cities and coastal megaprojects keep supply and demand rising. Growth should be strongest on the North Coast and Red Sea through the early 2030s, while Greater Cairo adds the largest absolute value. Deeper mortgage lending and lower inflation would favor completed sales and first-time buyers. In contrast, currency weakness or construction delays would slow handovers and shift demand back toward off-plan units.
Frequently Asked Questions
How big is the Egypt residential real estate market?
Which region leads Egyptian housing demand?
Which region is growing fastest?
Which property type holds the largest share?
How do mortgages support Egyptian homebuying?
Why are remittances important for the housing market?
Who are the leading residential developers in Egypt?
What are the main risks to the forecast?
Table of Content
Chapter 1 Market Segmentation
- 1.1 Segmentation Framework
- 1.1.1 Product and Service Classification
- 1.1.2 Application and End-Use Classification
- 1.1.3 Technology and Solution Classification
- 1.1.4 Customer and Distribution Channel Classification
- 1.1.5 Geographic Segmentation
- 1.1.6 Market Segment Definitions and Boundaries
- 1.2 By Property Type
- 1.2.1 Apartments and Condominiums
- 1.2.2 Villas and Landed Houses
- 1.2.3 Townhouses and Twin Houses
- 1.2.4 Duplexes and Penthouses
- 1.3 By Buyer Type
- 1.3.1 First-Time Homebuyers
- 1.3.2 Domestic Investors
- 1.3.3 Existing Homeowners
- 1.3.4 Expatriate Egyptians
- 1.3.5 Foreign Buyers
- 1.4 By Transaction Type
- 1.4.1 Primary Off-Plan Sales
- 1.4.2 Secondary Resales
- 1.4.3 Primary Completed Sales
- 1.4.4 Long-Term Residential Leasing
Chapter 2 Introduction
- 2.1 Report Objectives and Scope
- 2.2 Product Definition and Industry Terminology
- 2.3 Market Inclusions and Exclusions
- 2.4 Research Process
- 2.4.1 Primary Research and Expert Interviews
- 2.4.2 Secondary Research and Source Review
- 2.4.3 Top-Down and Bottom-Up Estimation
- 2.4.4 Data Triangulation and Verification
- 2.5 Market Size Measurement Basis
- 2.5.1 2025: USD 22.99 billion → 2035: USD 55.94 billion
- 2.6 Historical and Forecast Reference Periods
- 2.6.1 Historical Period: 2018-2025
- 2.6.2 Base Year: 2025
- 2.6.3 Forecast Period: 2025-2035
- 2.7 Research Assumptions and Limitations
Chapter 3 Executive Summary
- 3.1 Market Snapshot and Key Findings
- 3.2 Base-Year Market Size, 2025
- 3.3 Forecast Market Size, 2035
- 3.4 Revenue and Volume Growth Outlook
- 3.5 Key Demand and Supply Indicators
- 3.6 Leading Market Segments
- 3.7 Fastest-Growing Market Opportunities
- 3.8 Regional Performance Highlights
- 3.9 Technology and Industry Transformation
- 3.10 Competitive Landscape Summary
- 3.11 Analyst View and Strategic Implications
Chapter 4 Egypt Residential Real Estate Market Trends and Developments
- 4.1 Historical Industry Development, 2018-2025
- 4.2 Recent Market Trends and Developments
- 4.3 Demand and Customer Behavior Trends
- 4.4 Technology and Product Innovation
- 4.5 Artificial Intelligence, Automation and Digitalization
- 4.6 Local Manufacturing and Supply Chain Realignment
- 4.7 Industry Partnerships, Mergers and Acquisitions
- 4.8 Sustainability and Circular Economy Developments
- 4.9 Government and Private Sector Investment Trends
- 4.10 Emerging Business Models and Commercialization
- 4.11 Industry Developments and Announcements
Chapter 5 Egypt Residential Real Estate Market Production, Supply and Demand Analysis
- 5.1 Demand Trend and Consumption Analysis, 2018-2025
- 5.2 Demand Forecast, 2025-2035
- 5.3 Production and Output Trend, 2018-2025
- 5.4 Production and Output Forecast, 2025-2035
- 5.5 Installed Capacity and Capacity Utilization
- 5.6 Company-Wise Production Plants and Statistics
- 5.6.1 Installed Production Capacity
- 5.6.2 Actual Production
- 5.6.3 Planned Capacity and Expansion Targets
- 5.7 Supply Chain Structure and Procurement Trends
- 5.8 Supply-Demand Gap and Bottlenecks
- 5.9 Import Dependence and Sourcing Structure
- 5.10 Contract Manufacturing and Outsourcing
- 5.11 Regional Supply and Demand Concentration
Chapter 6 Egypt Residential Real Estate Market Pricing Analysis
- 6.1 Pricing Structure and Measurement
- 6.2 Historical Pricing Trends, 2018-2025
- 6.3 Pricing Outlook, 2025-2035
- 6.4 Average Selling Price and Unit Economics
- 6.5 Pricing by Product and Market Segment
- 6.6 Geographic Pricing Differences
- 6.7 Key Input, Energy, Labor and Logistics Costs
- 6.8 Contract Pricing and Purchasing Models
- 6.9 Pricing Sensitivity and Competitive Positioning
- 6.10 Price, Margin and Profitability Implications
Chapter 7 Egypt Residential Real Estate Market Dynamics
- 7.1 Market Growth Drivers
- 7.1.1 Demand-Side Drivers
- 7.1.2 Technology and Innovation Drivers
- 7.1.3 Infrastructure and Investment Drivers
- 7.1.4 Regulatory and Policy Drivers
- 7.2 Market Restraints
- 7.2.1 Cost and Affordability Constraints
- 7.2.2 Technology and Adoption Barriers
- 7.2.3 Supply Chain and Operational Constraints
- 7.3 Market Challenges
- 7.3.1 Competitive Pressure and Margin Erosion
- 7.3.2 Skills, Infrastructure and Implementation Gaps
- 7.4 Emerging Market Opportunities
- 7.5 Market Dynamics Impact and Time-Horizon Assessment
Chapter 8 Egypt Residential Real Estate Value Chain Analysis
- 8.1 Industry Value Chain Overview
- 8.2 Upstream Suppliers and Critical Inputs
- 8.3 Technology and Component Providers
- 8.4 Manufacturing or Service Delivery
- 8.5 Distribution, Channel Partners and Integrators
- 8.6 Downstream Applications and End Users
- 8.7 Value Addition and Profit Pools
- 8.8 Vertical Integration and Outsourcing
- 8.9 Supplier Concentration and Risk
- 8.10 Supply Chain Localization and Resilience
Chapter 9 Egypt Residential Real Estate Market Regulations and Policies
- 9.1 Relevant Laws, Standards and Compliance Frameworks
- 9.2 Product, Service, Safety and Quality Requirements
- 9.3 Government Policies, Incentives and Subsidies
- 9.4 Imports, Exports and Trade Barriers
- 9.5 Public Procurement and Local Content Requirements
- 9.6 Environmental and Sustainability Compliance
- 9.7 Upcoming Policy Changes and Market Implications
Chapter 10 Egypt Residential Real Estate Market Hotspots and Opportunities
- 10.1 Market Opportunity Mapping and Growth Hotspots
- 10.2 High-Growth Applications and Customer Groups
- 10.3 Underserved Markets and White-Space Opportunities
- 10.4 Emerging Technology and Product Opportunities
- 10.5 New Capacity and Investment Hotspots
- 10.6 Market Entry and Expansion Opportunities
- 10.7 Distribution and Partnership Opportunities
- 10.8 Near-Term and Long-Term Commercial Potential
- 10.9 Opportunity Attractiveness and Execution Risks
Chapter 11 Egypt Residential Real Estate Market Outlook, 2025-2035
- 11.1 Market Size and Analysis
- 11.1.1 Revenue (Market Measurement: 2025: USD 22.99 billion → 2035: USD 55.94 billion)
- 11.1.2 Market Volume and Quantity Sold
- 11.1.3 Historical Market Size, 2018-2025
- 11.1.4 Base-Year Market Size, 2025
- 11.2 Market Forecast, 2025-2035
- 11.2.1 Revenue Forecast to 2035
- 11.2.2 Volume Forecast to 2035
- 11.2.3 CAGR and Year-on-Year Growth
- 11.2.4 Incremental Revenue Opportunity
- 11.3 Forecast Assumptions and Scenario Analysis
- 11.3.1 Base-Case Forecast
- 11.3.2 Optimistic and Conservative Scenarios
- 11.3.3 Technology, Pricing and Policy Sensitivities
- 11.4 Market Attractiveness and Growth Outlook
Chapter 12 Egypt Residential Real Estate Market Segmentation and Outlook
- 12.1 Segmentation Summary and Market Shares, 2025
- 12.2 Largest and Fastest-Growing Segments
- 12.3 By Property Type - Market Size and Forecast, 2025-2035
- 12.3.1 Segment Definition and Scope
- 12.3.2 Historical Market Size, 2018-2025
- 12.3.3 Revenue Forecast, 2025-2035
- 12.3.4 Volume Forecast, 2025-2035
- 12.3.5 Base-Year Market Share, 2025
- 12.3.6 Segment CAGR and Growth Drivers
- 12.3.7 Subsegment Market Size and Forecast
- 12.3.7.1 Apartments and Condominiums
- 12.3.7.2 Villas and Landed Houses
- 12.3.7.3 Townhouses and Twin Houses
- 12.3.7.4 Duplexes and Penthouses
- 12.3.8 Subsegment Pricing and Adoption Trends
- 12.3.9 Leading Suppliers and Competition
- 12.3.10 Regional Demand and Opportunities
- 12.4 By Buyer Type - Market Size and Forecast, 2025-2035
- 12.4.1 Segment Definition and Scope
- 12.4.2 Historical Market Size, 2018-2025
- 12.4.3 Revenue Forecast, 2025-2035
- 12.4.4 Volume Forecast, 2025-2035
- 12.4.5 Base-Year Market Share, 2025
- 12.4.6 Segment CAGR and Growth Drivers
- 12.4.7 Subsegment Market Size and Forecast
- 12.4.7.1 First-Time Homebuyers
- 12.4.7.2 Domestic Investors
- 12.4.7.3 Existing Homeowners
- 12.4.7.4 Expatriate Egyptians
- 12.4.7.5 Foreign Buyers
- 12.4.8 Subsegment Pricing and Adoption Trends
- 12.4.9 Leading Suppliers and Competition
- 12.4.10 Regional Demand and Opportunities
- 12.5 By Transaction Type - Market Size and Forecast, 2025-2035
- 12.5.1 Segment Definition and Scope
- 12.5.2 Historical Market Size, 2018-2025
- 12.5.3 Revenue Forecast, 2025-2035
- 12.5.4 Volume Forecast, 2025-2035
- 12.5.5 Base-Year Market Share, 2025
- 12.5.6 Segment CAGR and Growth Drivers
- 12.5.7 Subsegment Market Size and Forecast
- 12.5.7.1 Primary Off-Plan Sales
- 12.5.7.2 Secondary Resales
- 12.5.7.3 Primary Completed Sales
- 12.5.7.4 Long-Term Residential Leasing
- 12.5.8 Subsegment Pricing and Adoption Trends
- 12.5.9 Leading Suppliers and Competition
- 12.5.10 Regional Demand and Opportunities
- 12.6 Segment Growth Comparison
- 12.7 Segment Attractiveness and Priority Matrix
Chapter 13 Egypt Residential Real Estate Geographic Market Outlook, 2025-2035
- 13.1 Regional Market Size and Country-Level Shares, 2025
- 13.2 Country Market Size Comparison, 2025
- 13.3 Country Market Forecasts, 2025-2035
- 13.4 Subregional Industrial and Demand Clusters
- 13.5 Intra-Regional Pricing and Cost Differences
- 13.6 Cross-Border Trade and Supply Networks
- 13.7 Regional Supply and Demand Balances
- 13.8 Country Opportunity Comparison and Prioritization
Note: Every listed country is covered on the structure shown under the first country.
Chapter 14 Egypt Residential Real Estate Technology, Innovation and Sustainability Outlook
- 14.1 Technology Landscape and Maturity
- 14.2 Product, Process and Service Innovation
- 14.3 AI, Automation and Digital Tools in the Industry
- 14.4 Technology Adoption and Performance Benchmarking
- 14.5 Innovation Pipeline and R&D Investment
- 14.6 Patent and Intellectual Property Trends
- 14.7 Energy Efficiency and Resource Management
- 14.8 Sustainability, Recycling and Circularity
- 14.9 Technology Roadmap, 2025-2035
- 14.10 Risks of Obsolescence and Technology Substitution
Chapter 15 Egypt Residential Real Estate Market Key Strategic Imperatives
- 15.1 Growth and Market Entry Priorities
- 15.2 High-Return Products and Segments
- 15.3 Pricing, Profitability and Cost Optimization
- 15.4 Technology Investment and Product Differentiation
- 15.5 Supply Chain Localization and Resilience
- 15.6 Distribution and Customer Acquisition
- 15.7 Partnership, Acquisition and Capacity Strategy
- 15.8 Regional Expansion Priorities
- 15.9 Short-, Medium- and Long-Term Actions
Chapter 16 Competition Outlook
- 16.1 Industry Competition Characteristics
- 16.2 Market Structure and Concentration
- 16.3 Market Share and Competitive Positioning, 2025
- 16.4 Company-Wise Revenue and Product Benchmarking
- 16.5 Production and Service Capacity Benchmarking
- 16.6 Technology, Pricing and Differentiation
- 16.7 Regional Footprint and Distribution Strength
- 16.8 Mergers, Acquisitions and Strategic Alliances
- 16.9 New Entrants and Competitive Threats
- 16.10 Porter's Five Forces and Industry Attractiveness
- 16.11 Competitive Outlook, 2025-2035
Chapter 17 Company Profiles
- 17.1 Company Coverage and Selection Criteria
- 17.2 Talaat Moustafa Group Holding
- 17.2.1 Business Description
- 17.2.2 Company Ownership and Geographic Presence
- 17.2.3 Product and Service Portfolio
- 17.2.4 Manufacturing and Operating Footprint
- 17.2.5 Production Capacity and Expansion Plans
- 17.2.6 Financial Performance and Investment
- 17.2.7 Market Share and Competitive Position
- 17.2.8 Technology and Innovation Capabilities
- 17.2.9 Strategic Alliances or Partnerships
- 17.2.10 Recent Developments
- 17.2.11 Growth Strategy and Outlook
- 17.3 Palm Hills Developments
- 17.4 SODIC
- 17.5 Emaar Misr
- 17.6 Madinet Masr
- 17.7 Orascom Development Egypt
- 17.8 City Edge Developments
- 17.9 Al Ahly Sabbour Developments
- 17.10 Misr Italia Properties
- 17.11 Mountain View
- 17.12 Other Relevant Market Participants
Note: Every listed company is profiled on the structure shown under the first company. The company list is preliminary and may change based on research findings, market developments, data availability and client requirements.
Chapter 18 Disclaimer
- 18.1 Research and Forecast Disclaimer
- 18.2 Data Source and Estimation Limitations
Note: The depth of individual sections depends on data availability for this market. Volume, capacity, trade and other unit-based metrics are included where applicable.

