
Market Overview
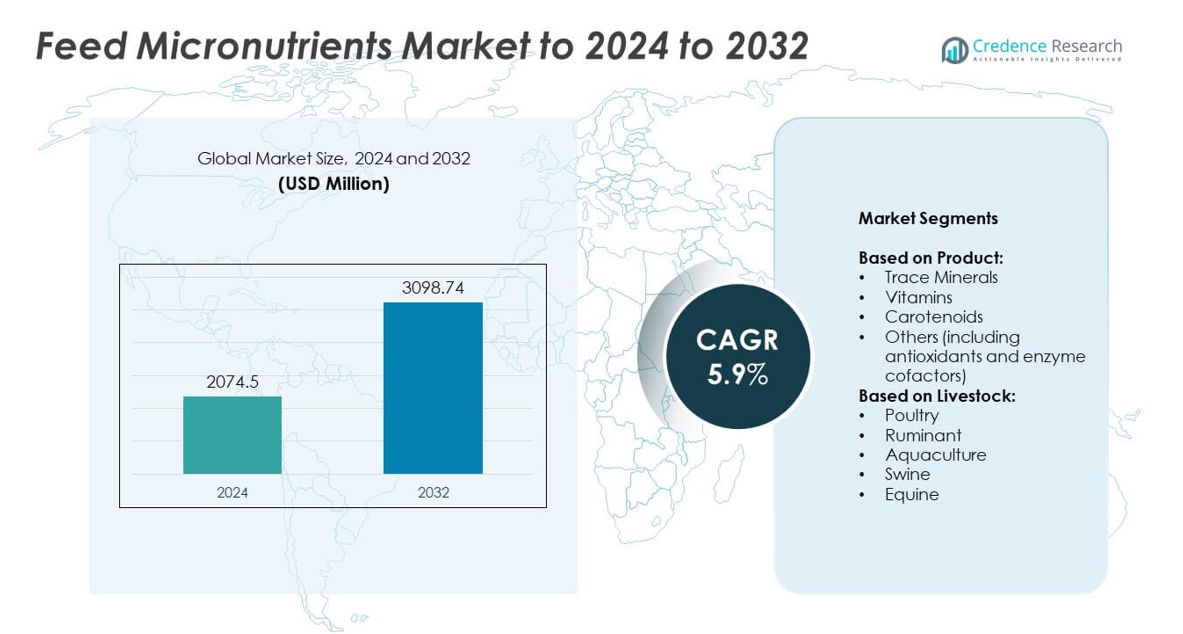
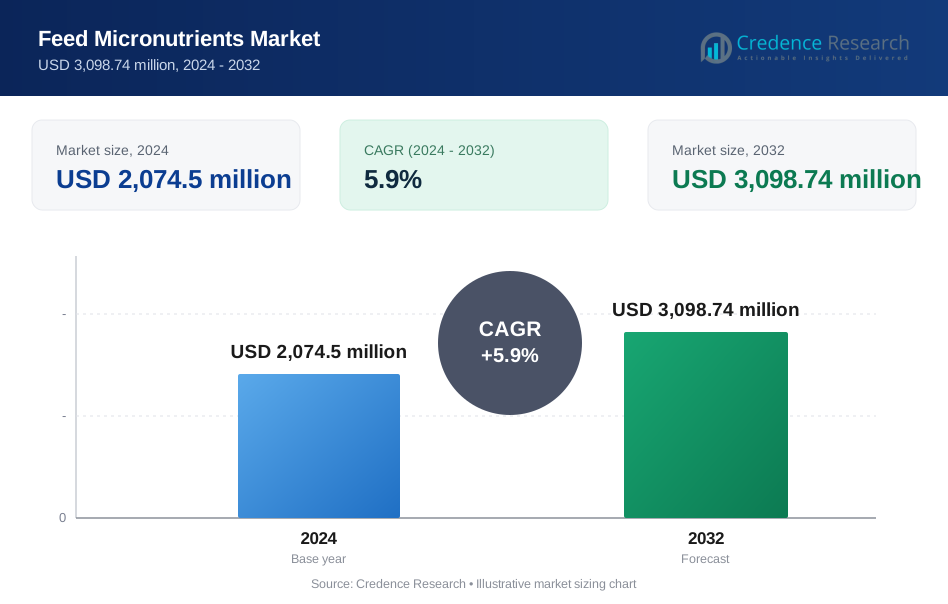
Feed Micronutrients Market size was valued at USD 2,074.5 Million in 2024 and is anticipated to reach USD 3,098.74 Million by 2032, at a CAGR of 5.9% during the forecast period.
| REPORT ATTRIBUTE | DETAILS |
|---|---|
| Historical Period | 2020-2023 |
| Base Year | 2024 |
| Forecast Period | 2025-2032 |
| Feed Micronutrients Market Size 2024 | USD 2,074.5 Million |
| Feed Micronutrients Market, CAGR | 5.9% |
| Feed Micronutrients Market Size 2032 | USD 3,098.74 Million |
The feed micronutrients market is led by prominent players including Alltech, Cargill, Royal DSM, Nutreco N.V., Zinpro Corporation, Kemin Industries Inc., and Novus International Inc., who focus on advanced formulations, sustainable sourcing, and tailored premixes to strengthen animal nutrition. These companies emphasize innovation in bioavailable trace minerals, vitamins, and carotenoids to enhance livestock health and productivity. Regionally, Asia Pacific emerged as the leading market in 2024, commanding 30% share, driven by large-scale poultry and aquaculture production. North America followed with 32% share, supported by advanced feed technologies, while Europe held 27%, reflecting strong regulatory standards and sustainability-focused practices.
Market Insights
- The feed micronutrients market was valued at USD 2,074.5 million in 2024 and is expected to reach USD 3,098.74 million by 2032, growing at a CAGR of 5.9% between 2025 and 2032.
- Rising demand for animal protein and the need for improved livestock productivity are key drivers, with trace minerals accounting for over 40% share in 2024 due to their role in immunity and growth.
- Trends highlight a growing shift toward organic and bioavailable micronutrients, alongside technological advances in precision nutrition and fortified premixes tailored for poultry, ruminants, and aquaculture.
- The competitive landscape features leading global companies investing in research, sustainability, and partnerships, with strong emphasis on cost-effective and regulatory-compliant solutions to maintain market positioning.
- Regional analysis shows Asia Pacific holding 30% share in 2024, followed by North America at 32% and Europe at 27%, while Latin America and the Middle East & Africa together contributed around 11%.
Market Segmentation Analysis:
By Product
Trace minerals held the dominant share of the feed micronutrients market in 2024, accounting for over 40% of global demand. Their role in enhancing immunity, growth rate, and reproductive performance makes them vital in animal nutrition. Zinc, iron, copper, and manganese are widely used to address mineral deficiencies in livestock diets. The demand is supported by rising incidences of mineral-related disorders in poultry and ruminants. Increasing use of organic trace minerals with higher bioavailability further accelerates adoption, while vitamins and carotenoids are growing in niche applications such as improving feed efficiency and pigmentation.
- For instance, Zinpro cut broiler skin lesions from 42.7% to 9.6% in an Auburn study.
By Livestock
Poultry emerged as the leading livestock segment in 2024, capturing nearly 45% of the feed micronutrients market share. This dominance is driven by high global poultry meat and egg production, requiring nutrient-dense feed for faster growth and improved feed conversion ratios. Micronutrients like zinc, selenium, and vitamin premixes play a critical role in disease resistance and skeletal health in broilers and layers. Growing consumption of protein-rich diets and rising commercial poultry farming in Asia-Pacific and North America continue to boost demand, while aquaculture and swine segments are steadily expanding with targeted nutritional solutions.
- For instance, Novus showed chelates lifted top-grade footpads to 40.0% vs 24.5% with inorganics.
Key Growth Drivers
Rising Demand for Enhanced Livestock Productivity
The growing focus on improving livestock health and productivity is a key driver of the feed micronutrients market. Farmers increasingly rely on trace minerals, vitamins, and carotenoids to support growth, reproduction, and immunity in animals. Rising meat, egg, and dairy consumption worldwide boosts the need for nutrient-rich feed formulations. For instance, zinc and selenium supplements are essential in enhancing feed conversion efficiency and reducing mortality rates. This demand ensures consistent growth for feed micronutrient manufacturers across poultry, ruminant, and swine production systems.
- For instance, according to Alltech's 2025 Agri-Food Outlook, 1.396 billion metric tons of feed were produced globally in 2024, representing a 1.2% increase from the previous year.
Expansion of Commercial Poultry and Aquaculture Sectors
The rapid expansion of commercial poultry and aquaculture farms has accelerated demand for feed micronutrients globally. Poultry farming dominates due to large-scale broiler and layer production, while aquaculture has seen strong growth in Asia-Pacific. These sectors require balanced micronutrient inputs to ensure high yields and maintain animal health under intensive production. Micronutrients like carotenoids also enhance pigmentation in aquaculture species, increasing market value. Growing protein consumption and increasing global exports of poultry meat and aquaculture products continue to drive the adoption of specialized micronutrient blends.
- For instance, Skretting reports around 2.5 million tonnes annual aquafeed production for 2024, according to their their Company facts.
Rising Focus on Disease Prevention and Animal Health
Heightened concerns over animal health and disease prevention significantly drive the market. The use of vitamins, antioxidants, and mineral blends strengthens immune systems and reduces susceptibility to infections. Feed micronutrients are increasingly recognized as preventive solutions, reducing the need for antibiotics. This trend aligns with strict global regulations promoting reduced antibiotic use in animal feed. The rising awareness of zoonotic diseases and consumer demand for safe, residue-free meat and dairy products further stimulates adoption of tailored micronutrient formulations in livestock nutrition.
Key Trends & Opportunities
Shift Toward Organic and Bioavailable Micronutrients
A key trend shaping the market is the shift toward organic and highly bioavailable feed micronutrients. Livestock producers increasingly prefer chelated minerals and natural vitamin sources due to their higher absorption rates and reduced environmental impact. This transition supports better animal health outcomes and addresses sustainability concerns in feed formulations. Companies are investing in research to develop eco-friendly micronutrient solutions that meet both regulatory standards and consumer preferences. This shift creates opportunities for innovation and premium product offerings within the feed industry.
- For instance, based on liver copper levels, its RBV was estimated at 196% more than copper sulfate, while based on plasma copper levels, its RBV was 132% more available.
Technological Advancements in Feed Formulation
Technological innovations in feed formulation and precision nutrition present strong opportunities for the market. Digital tools, automated mixing systems, and AI-driven feed optimization are improving micronutrient utilization in livestock diets. These advancements ensure accurate dosing, minimize wastage, and enhance feed efficiency. Growing adoption of fortified premixes tailored to specific livestock species supports targeted nutrition strategies. The integration of advanced feed formulation technologies positions companies to deliver customized, performance-enhancing micronutrient solutions, catering to the diverse needs of poultry, ruminants, aquaculture, and swine producers.
- For instance, Evonik AMINONIR analyzes 60+ feed ingredients using NIR for quick predictions.
Key Challenges
High Cost of Specialized Micronutrient Blends
A major challenge for the market is the high cost of specialized micronutrient blends. Organic trace minerals, natural carotenoids, and advanced vitamin formulations are more expensive compared to conventional additives. These costs often burden small-scale farmers and producers in emerging economies, limiting adoption. Price sensitivity among livestock producers may lead to reduced investments in premium micronutrient solutions. The need for balancing affordability with innovation remains a significant barrier, requiring industry players to optimize production costs while ensuring consistent nutritional benefits.
Stringent Regulatory Frameworks and Compliance Issues
The feed micronutrients market also faces challenges due to stringent regulatory frameworks. Variations in feed additive approvals across regions complicate product development and distribution for multinational players. For example, restrictions on certain synthetic additives and limitations on maximum inclusion levels of trace minerals create compliance hurdles. Companies must invest heavily in testing, certifications, and documentation to meet standards such as FDA, EFSA, and FSSAI regulations. These complex regulatory landscapes slow down product launches and increase operational costs, affecting overall market growth.
Regional Analysis
North America
North America accounted for 32% of the feed micronutrients market share in 2024, driven by strong poultry and swine production across the United States and Canada. The region benefits from high adoption of advanced feed formulations, regulatory emphasis on reducing antibiotic use, and rising consumer demand for high-quality meat and dairy products. Commercial farming operations widely integrate trace minerals, vitamins, and carotenoids to improve productivity and animal health. Continuous innovations in feed premixes and the presence of key global feed manufacturers strengthen the market position of North America, ensuring steady growth through 2032.
Europe
Europe held 27% of the feed micronutrients market share in 2024, supported by strict regulatory frameworks emphasizing animal health, food safety, and sustainable farming. Countries such as Germany, France, and the Netherlands have advanced livestock industries with high focus on disease prevention and nutritional balance. The adoption of organic and bioavailable micronutrients is rising due to environmental concerns and consumer preference for residue-free products. Expanding dairy and swine production in Eastern Europe adds to demand, while innovations in feed premixes and fortified diets sustain growth across the region.
Asia Pacific
Asia Pacific dominated with 30% of the feed micronutrients market share in 2024, driven by large-scale poultry and aquaculture industries in China, India, and Southeast Asia. Rising meat and seafood consumption, coupled with rapid expansion of commercial farming, fuels strong demand for trace minerals and vitamins. Government initiatives to improve livestock productivity and reduce disease outbreaks encourage the use of fortified feeds. The region benefits from cost-effective feed manufacturing and growing exports of poultry and aquaculture products. Asia Pacific remains the fastest-growing regional market due to its expanding livestock population.
Latin America
Latin America represented 7% of the feed micronutrients market share in 2024, supported by its expanding poultry and beef production industries. Brazil and Mexico lead the regional demand, driven by rising domestic meat consumption and significant export activity. Feed micronutrients play a vital role in improving feed efficiency and maintaining herd health, particularly in intensive farming systems. Growing adoption of advanced nutritional supplements and fortified premixes among large-scale producers boosts market growth. However, cost challenges among small farmers limit penetration of premium products across several parts of the region.
Middle East and Africa
The Middle East and Africa accounted for 4% of the feed micronutrients market share in 2024, with growth primarily supported by expanding poultry and ruminant farming. Countries such as South Africa, Saudi Arabia, and Egypt are investing in feed fortification to meet rising domestic demand for animal protein. The region increasingly adopts trace minerals and vitamins to address nutrient deficiencies and improve livestock productivity under challenging climatic conditions. Limited access to advanced formulations and price-sensitive markets restrict wider adoption, but rising investment in modern farming practices supports gradual growth.
Market Segmentations:
By Product:
- Trace Minerals
- Vitamins
- Carotenoids
- Others (including antioxidants and enzyme cofactors)
By Livestock:
- Poultry
- Ruminant
- Aquaculture
- Swine
- Equine
By Geography
- North America
- U.S.
- Canada
- Mexico
- Europe
- Germany
- France
- U.K.
- Italy
- Spain
- Rest of Europe
- Asia Pacific
- China
- Japan
- India
- South Korea
- South-east Asia
- Rest of Asia Pacific
- Latin America
- Brazil
- Argentina
- Rest of Latin America
- Middle East & Africa
- GCC Countries
- South Africa
- Rest of the Middle East and Africa
Competitive Landscape
The competitive landscape of the feed micronutrients market is shaped by leading players such as Alltech, Inc., QualiTech Corp., Vamso Biotec Pvt. Ltd., Mercer Milling Company Inc., Cargill, Davidsons Animal Feeds, Royal DSM, Phibro Animal Health Corporation, Nutreco N.V., Kemin Industries Inc., Zinpro Corporation, U.S. Rare Earth Minerals Inc., Biochem, Novus International Inc., Tanke Biosciences Corporation, Archer Daniels Midland Company, and Ridley Inc. The market is highly consolidated, with established companies focusing on product innovation, sustainable formulations, and expanding their geographic presence. Strong investment in research and development supports the introduction of bioavailable trace minerals, vitamins, and carotenoids, meeting the demand for advanced livestock nutrition solutions. Strategic mergers, acquisitions, and partnerships enhance supply chain efficiency and strengthen market penetration across diverse regions. Competitive differentiation increasingly depends on providing customized feed premixes, ensuring regulatory compliance, and offering cost-effective solutions that address the rising focus on animal health, productivity, and disease prevention.
Key Player Analysis
- Alltech, Inc.
- QualiTech Corp.
- Vamso Biotec Pvt. Ltd.
- Mercer Milling Company Inc.
- Cargill
- Davidsons Animal Feeds
- Royal DSM
- Phibro Animal Health Corporation
- Nutreco N.V.
- Kemin Industries Inc.
- Zinpro Corporation
- S. Rare Earth Minerals Inc.
- Biochem
- Novus International Inc.
- Tanke Biosciences Corporation
- Archer Daniels Midland Company
- Ridley Inc
Recent Developments
- In 2025, ADM focuses on the economic sustainability of farmers, providing nutritional solutions to minimize losses and help animals , In animal nutrition.
- In 2023, DSM completed its merger with Firmenich to create DSM-Firmenich, a leader in nutrition, health, and beauty.
- In 2023, Zinpro launched the Zinpro Global Poultry Mineral Guide. This guide was designed to help poultry operations more precisely and productively manage their trace mineral requirements.
Report Coverage
The research report offers an in-depth analysis based on Product, Livestock and Geography. It details leading market players, providing an overview of their business, product offerings, investments, revenue streams, and key applications. Additionally, the report includes insights into the competitive environment, SWOT analysis, current market trends, as well as the primary drivers and constraints. Furthermore, it discusses various factors that have driven market expansion in recent years. The report also explores market dynamics, regulatory scenarios, and technological advancements that are shaping the industry. It assesses the impact of external factors and global economic changes on market growth. Lastly, it provides strategic recommendations for new entrants and established companies to navigate the complexities of the market.
Future Outlook
- The feed micronutrients market will expand steadily with rising global protein consumption.
- Poultry and aquaculture sectors will remain the largest consumers of micronutrient-based feed.
- Demand for organic and bioavailable trace minerals will accelerate across developed regions.
- Asia Pacific will continue as the fastest-growing regional market with strong livestock output.
- Technological advances in feed formulation will drive precision nutrition adoption.
- Regulations limiting antibiotic use will boost reliance on micronutrient-based health solutions.
- Carotenoids will gain traction in aquaculture for pigmentation and product value enhancement.
- Cost challenges may restrict premium product adoption in emerging economies.
- Strategic partnerships between feed producers and nutrition companies will strengthen market presence.
- Sustainability-driven innovations in micronutrient formulations will shape future product portfolios.
Request a Free Sample
Fill in your details and we'll send you a free sample report.
- Sample data tables & charts
- Research methodology
Need a Custom Version of This Report?
Tailor the scope, geography, or segments to your exact requirements.
- Custom geography or segment scope
- Direct access to our analyst team
Frequently Asked Questions
What is the current market size for Feed Micronutrients Market, and what is its projected size in 2032?
At what Compound Annual Growth Rate is the Feed Micronutrients Market projected to grow between 2025 and 2032?
Which Feed Micronutrients Market segment held the largest share in 2024?
What are the primary factors fueling the growth of the Feed Micronutrients Market?
Table of Content
Chapter 1. Report Introduction
- 1.1 Report Description & Purpose
- 1.1.1 Report Title & Market Definition
- 1.1.2 Unique Selling Propositions (USP) & Key Differentiators
- 1.1.3 Value Proposition for Stakeholders
- 1.2 Research Objectives
- 1.2.1 Market Sizing Objectives (Volume & Revenue)
- 1.2.2 Segmentation Objectives
- 1.2.3 Competitive Intelligence Objectives
- 1.2.4 Forecast & Scenario Objectives
- 1.3 Report Scope
- 1.3.1 Feed Micronutrients Scope – Types & Subtypes Covered
- 1.3.2 Geographic Scope – Regions & Countries Covered
- 1.3.3 Historical Period, Base Year & Forecast Period (2024; forecast to 2032)
- 1.3.4 Inclusions & Exclusions
- 1.4 HS Code & Classification Framework
- 1.5 Currency, Units & Pricing Basis
- 1.6 Target Stakeholders
- 1.7 Limitations & Assumptions
Chapter 2. Executive Summary
- 2.1 Global Feed Micronutrients Market Snapshot
- 2.1.1 Market Size – Historical (2024) & Forecast (2024-2032) (2024: USD 2,074.5 million → 2032: USD 3,098.74 million)
- 2.1.2 Volume & Revenue – Global Totals
- 2.1.3 Key Market Highlights – Top Five Facts
- 2.2 Feed Micronutrients Market Segmentation Snapshot
- 2.2.1 Market Split by Region – 2024 vs. 2032
- 2.3 Competitive Snapshot
- 2.3.1 Top 10 Players by Revenue Share – 2024
- 2.3.2 Top 10 Players by Volume Share – 2024
- 2.3.3 Recent Strategic Developments (18-Month Summary)
- 2.4 Key Investment Highlights & Strategic Conclusions
Chapter 3. Feed Micronutrients Market Dynamics & Industry Analysis
- 3.1 Market Overview & Context
- 3.1.1 Feed Micronutrients Market Position in the Broader Automotive Value Chain
- 3.1.2 OEM vs. Replacement Market Dynamics
- 3.1.3 Market Maturity & Development Stage by Region
- 3.2 Feed Micronutrients Market Drivers
- 3.3 Feed Micronutrients Market Restraints & Challenges
- 3.4 Feed Micronutrients Market Opportunities
- 3.5 Porter's Five Forces Analysis
- 3.5.1 Threat of New Entrants
- 3.5.2 Bargaining Power of Suppliers
- 3.5.3 Bargaining Power of Buyers
- 3.5.4 Threat of Substitutes
- 3.5.5 Competitive Rivalry – Intensity Assessment
- 3.6 Feed Micronutrients Value Chain Analysis
- 3.6.1 Upstream – Raw Material/Input Suppliers
- 3.6.1.1 Raw Material/Input 1
- 3.6.1.2 Raw Material/Input 2
- 3.6.1.3 Raw Material/Input 3
- 3.6.2 Midstream – Production/Manufacturing/Service Delivery
- 3.6.2.1 Production/Process Overview
- 3.6.2.2 Key Facility Locations & Capacity by Manufacturer
- 3.6.3 Downstream – Distribution & End Consumer
- 3.6.3.1 Primary Channel – B2B/OEM
- 3.6.3.2 Secondary Channels – Dealer, Retail, Online, Direct
- 3.6.4 Value Chain Profitability Analysis
- 3.6.1 Upstream – Raw Material/Input Suppliers
- 3.7 PESTEL Analysis
- 3.7.1 Political Factors
- 3.7.2 Economic Factors
- 3.7.3 Social Factors
- 3.7.4 Technological Factors
- 3.7.5 Environmental Factors
- 3.7.6 Legal Factors
- 3.8 Feed Micronutrients Supply Chain Analysis
- 3.8.1 Raw Material/Input Supply Risk Assessment
- 3.8.2 Manufacturing Concentration Risk (Geographic Exposure)
- 3.8.3 Trade Disruption Impact Analysis
- 3.9 Regulatory & Policy Landscape
Note: The regulatory and policy landscape section covers regulations based on their applicability to the market, Feed Micronutrients category, geography, and scope of the study. Only regulatory frameworks with a material impact on operations, compliance, trade, sustainability, or market access are analyzed in detail.
Chapter 4. Key Investment Pockets & Opportunity Analysis
- 4.1 Feed Micronutrients Market Attractiveness Analysis
- 4.1.1 By Region – Investment Attractiveness Matrix (Volume × CAGR)
- 4.2 Absolute Revenue Growth Opportunity
- 4.2.1 By Region – Absolute USD Growth Through 2032
- 4.3 Incremental Volume Opportunity
- 4.3.1 By Region – Incremental Volume Through 2032
- 4.3.2 Segment – Incremental Volume
- 4.4 Emerging Submarket Opportunity Deep Dive (Subject to Applicability)
- 4.5 Emerging Market Opportunity Scorecards
- 4.5.1 United States
- 4.5.2 Europe
- 4.5.3 Asia
- 4.5.4 Middle East & Africa
Note: Emerging Market Opportunity Scorecards will be included based on relevance and strategic importance. Regions listed are indicative and may vary depending on data availability and market dynamics.
Chapter 5. Feed Micronutrients Import-Export Analysis & Trade Flows
- 5.1 Global Trade Overview
- 5.1.1 Global Export Value by Country (2024)
- 5.1.2 Global Export Volume by Country (2024)
- 5.1.3 Global Import Value by Country (2024)
- 5.1.4 Global Import Volume by Country (2024)
- 5.1.5 Net Trade Balance by Country (2024)
- 5.2 Export Analysis – Segment
- 5.2.1 Type 1 (HS Code)
- 5.2.2 Type 2 (HS Code)
- 5.2.3 Type 3 (HS Code)
- 5.2.4 Type 4 (HS Code)
- 5.2.5 Type 5 (HS Code)
- 5.3 Import Analysis – Segment
- 5.3.1 Type 1 (HS Code)
- 5.3.2 Type 2 (HS Code)
- 5.3.3 Type 3 (HS Code)
- 5.3.4 Type 4 (HS Code)
- 5.3.5 Type 5 (HS Code)
- 5.4 Average Unit Trade Prices
- 5.4.1 Average Export Price – Segment & Country
- 5.4.2 Average Import Price – Segment & Source Country
- 5.4.3 Price Trends (2024)
- 5.5 Key Trade Route Analysis
- 5.5.1 Trade Route 1
- 5.5.2 Trade Route 2
- 5.5.3 Trade Route 3
- 5.5.4 Trade Route 4
- 5.5.5 Trade Route 5
- 5.6 Trade Policy Impact Assessment
- 5.6.1 US Anti-Dumping & Section 301 Tariffs
- 5.6.2 EU Customs Union Impact
- 5.6.3 Major Free Trade Agreements
- 5.6.4 USMCA Rules of Origin
Note: Trade policy analysis will be included only where relevant to the Feed Micronutrients market.
Chapter 6. Competitive Landscape & Company Benchmarking
- 6.1 Feed Micronutrients Market Concentration & Structure
- 6.1.1 Herfindahl-Hirschman Index (HHI) – vs. 2024
- 6.1.2 Tier 1, Tier 2 & Tier 3 Market Structure
- 6.1.3 Global, Regional & Local Player Dynamics
- 6.2 Feed Micronutrients Market Share Analysis – 2024
- 6.2.1 Global Revenue Share by Company
- 6.2.2 Global Volume Share by Company
- 6.2.3 Regional Revenue Share
- 6.2.4 Market Share Evolution ( vs. 2024)
- 6.2.5 OEM Segment Share by Company
- 6.2.6 Replacement Segment Share by Company
- 6.3 Production/Delivery Capacity & Facility Analysis
- 6.3.1 Global Installed Capacity
- 6.3.2 Capacity Utilization Rates
- 6.3.3 Production/Output Volume
- 6.3.4 Facility Locations & Capacity Map
- 6.3.5 Planned Capacity Additions
- 6.4 Feed Micronutrients Competitive Benchmarking Matrix
- 6.4.1 Revenue, Volume, CAGR & Profitability Comparison
- 6.4.2 Channel Revenue Mix
- 6.4.3 Geographic Revenue Exposure
- 6.4.4 R&D Intensity
- 6.4.5 Sustainability Maturity
- 6.5 Strategic Developments in Feed Micronutrients (Last 24 Months)
- 6.5.1 Mergers, Acquisitions & Divestments
- 6.5.2 New Feed Micronutrients Launches
- 6.5.3 Facility Expansions
- 6.5.4 Strategic Alliances, Joint Ventures & Partnerships
- 6.5.5 Distribution Expansion & Market Entry
- 6.5.6 Sustainability & ESG Initiatives
- 6.6 Competitive Strategy Mapping
- 6.6.1 Leader, Challenger, Follower & Niche Classification
- 6.6.2 Pricing Strategy Comparison
- 6.6.3 Channel Strategy Matrix
Note: Strategic developments are included based on their materiality and the availability of reliable information.
Chapter 7. Global Feed Micronutrients Market – By Distribution Channel
- 7.1 Segment Overview
- 7.1.1 Volume & Revenue Split by Channel (2024 & 2032)
- 7.1.2 Channel Mix Evolution (2024-2032)
Chapter 8. Regional Market Analysis – Global Overview
- 8.1 Global Regional Overview
- 8.1.1 Regional Volume Share
- 8.1.2 Regional Revenue Share
- 8.1.3 Regional Volume by Region
- 8.1.4 Regional Revenue by Region
- 8.1.5 Regional Forecast Through 2032
- 8.2 Cross-Regional Segment Analysis
- 8.2.1 By Distribution Channel
- 8.2.2 By Brand/Price Tier
Chapter 9. North America Feed Micronutrients Market
- 9.1 United States
- 9.2 Canada
- 9.3 Mexico
Chapter 10. Europe Feed Micronutrients Market
- 10.1 Germany
- 10.2 France
- 10.3 Italy
- 10.4 United Kingdom
- 10.5 Spain
- 10.6 Poland
- 10.7 Russia
- 10.8 Netherlands
- 10.9 Belgium
- 10.10 Sweden
- 10.11 Denmark
- 10.12 Norway
- 10.13 Rest of Europe
Chapter 11. Asia Pacific Feed Micronutrients Market
- 11.1 China
- 11.2 India
- 11.3 Japan
- 11.4 South Korea
- 11.5 Thailand
- 11.6 Indonesia
- 11.7 Vietnam
- 11.8 Malaysia
- 11.9 Australia
- 11.10 Rest of Asia Pacific
Chapter 12. Latin America Feed Micronutrients Market
- 12.1 Brazil
- 12.2 Argentina
- 12.3 Colombia
- 12.4 Chile
- 12.5 Rest of Latin America
Chapter 13. Middle East Feed Micronutrients Market
- 13.1 Saudi Arabia
- 13.2 United Arab Emirates
- 13.3 Turkey
- 13.4 Israel
- 13.5 Iran
- 13.6 Rest of the Middle East
Chapter 14. Africa Feed Micronutrients Market
- 14.1 South Africa
- 14.2 Egypt
- 14.3 Nigeria
- 14.4 Morocco
- 14.5 Rest of Africa
Chapter 15. Feed Micronutrients Company Profiles
- 15.1 [Company 01]
- 15.1.1 Company Overview
- 15.1.2 Key Management Personnel
- 15.1.3 Products & Services Portfolio
- 15.1.4 Financial Performance
- 15.1.5 Key Market Focus & Geographic Presence
- 15.1.6 Recent Developments & Strategic Initiatives
Note: The company profile list is preliminary and may change based on research findings, market developments, data availability, and client requirements.
Chapter 16. Appendices
- Appendix A – List of Abbreviations & Acronyms
- Appendix B – Industry Classification Code Reference – Full Series
- Appendix C – Production & Capacity Data Tables
- Appendix D – End-Use & Demand Base Tables
- Appendix E – Consumption & Replacement Rate Assumptions
- Appendix F – ASP Reference Tables
- Appendix G – Manufacturing & Facility Database
- Appendix H – Import-Export Data Tables
- Appendix I – Regulatory Summary Tables
- Appendix J – Primary Research Participant List (Anonymized)
- Appendix K – Primary Research Questionnaire Framework
- Appendix L – Data Sources & Bibliography
- Appendix M – Market Size Divergence & Source Comparison
Chapter 17. Research Methodology
- 17.1 Research Framework & Philosophy
- 17.2 Secondary Research – Sources, Hierarchy & Data Extraction
- 17.3 Data Modeling – Bottom-Up & Top-Down Market Sizing
- 17.4 Primary Research – Stakeholder Framework, LOI & Sample Sizes
- 17.5 Forecast Methodology – Regression, Scenario & Sensitivity Analysis
- 17.6 Quality Control – Four-Layer Validation Framework
- 17.7 Limitations & Standard Assumptions
- 17.8 Disclaimer
