Listeria rules turn live cultures into a safety tool
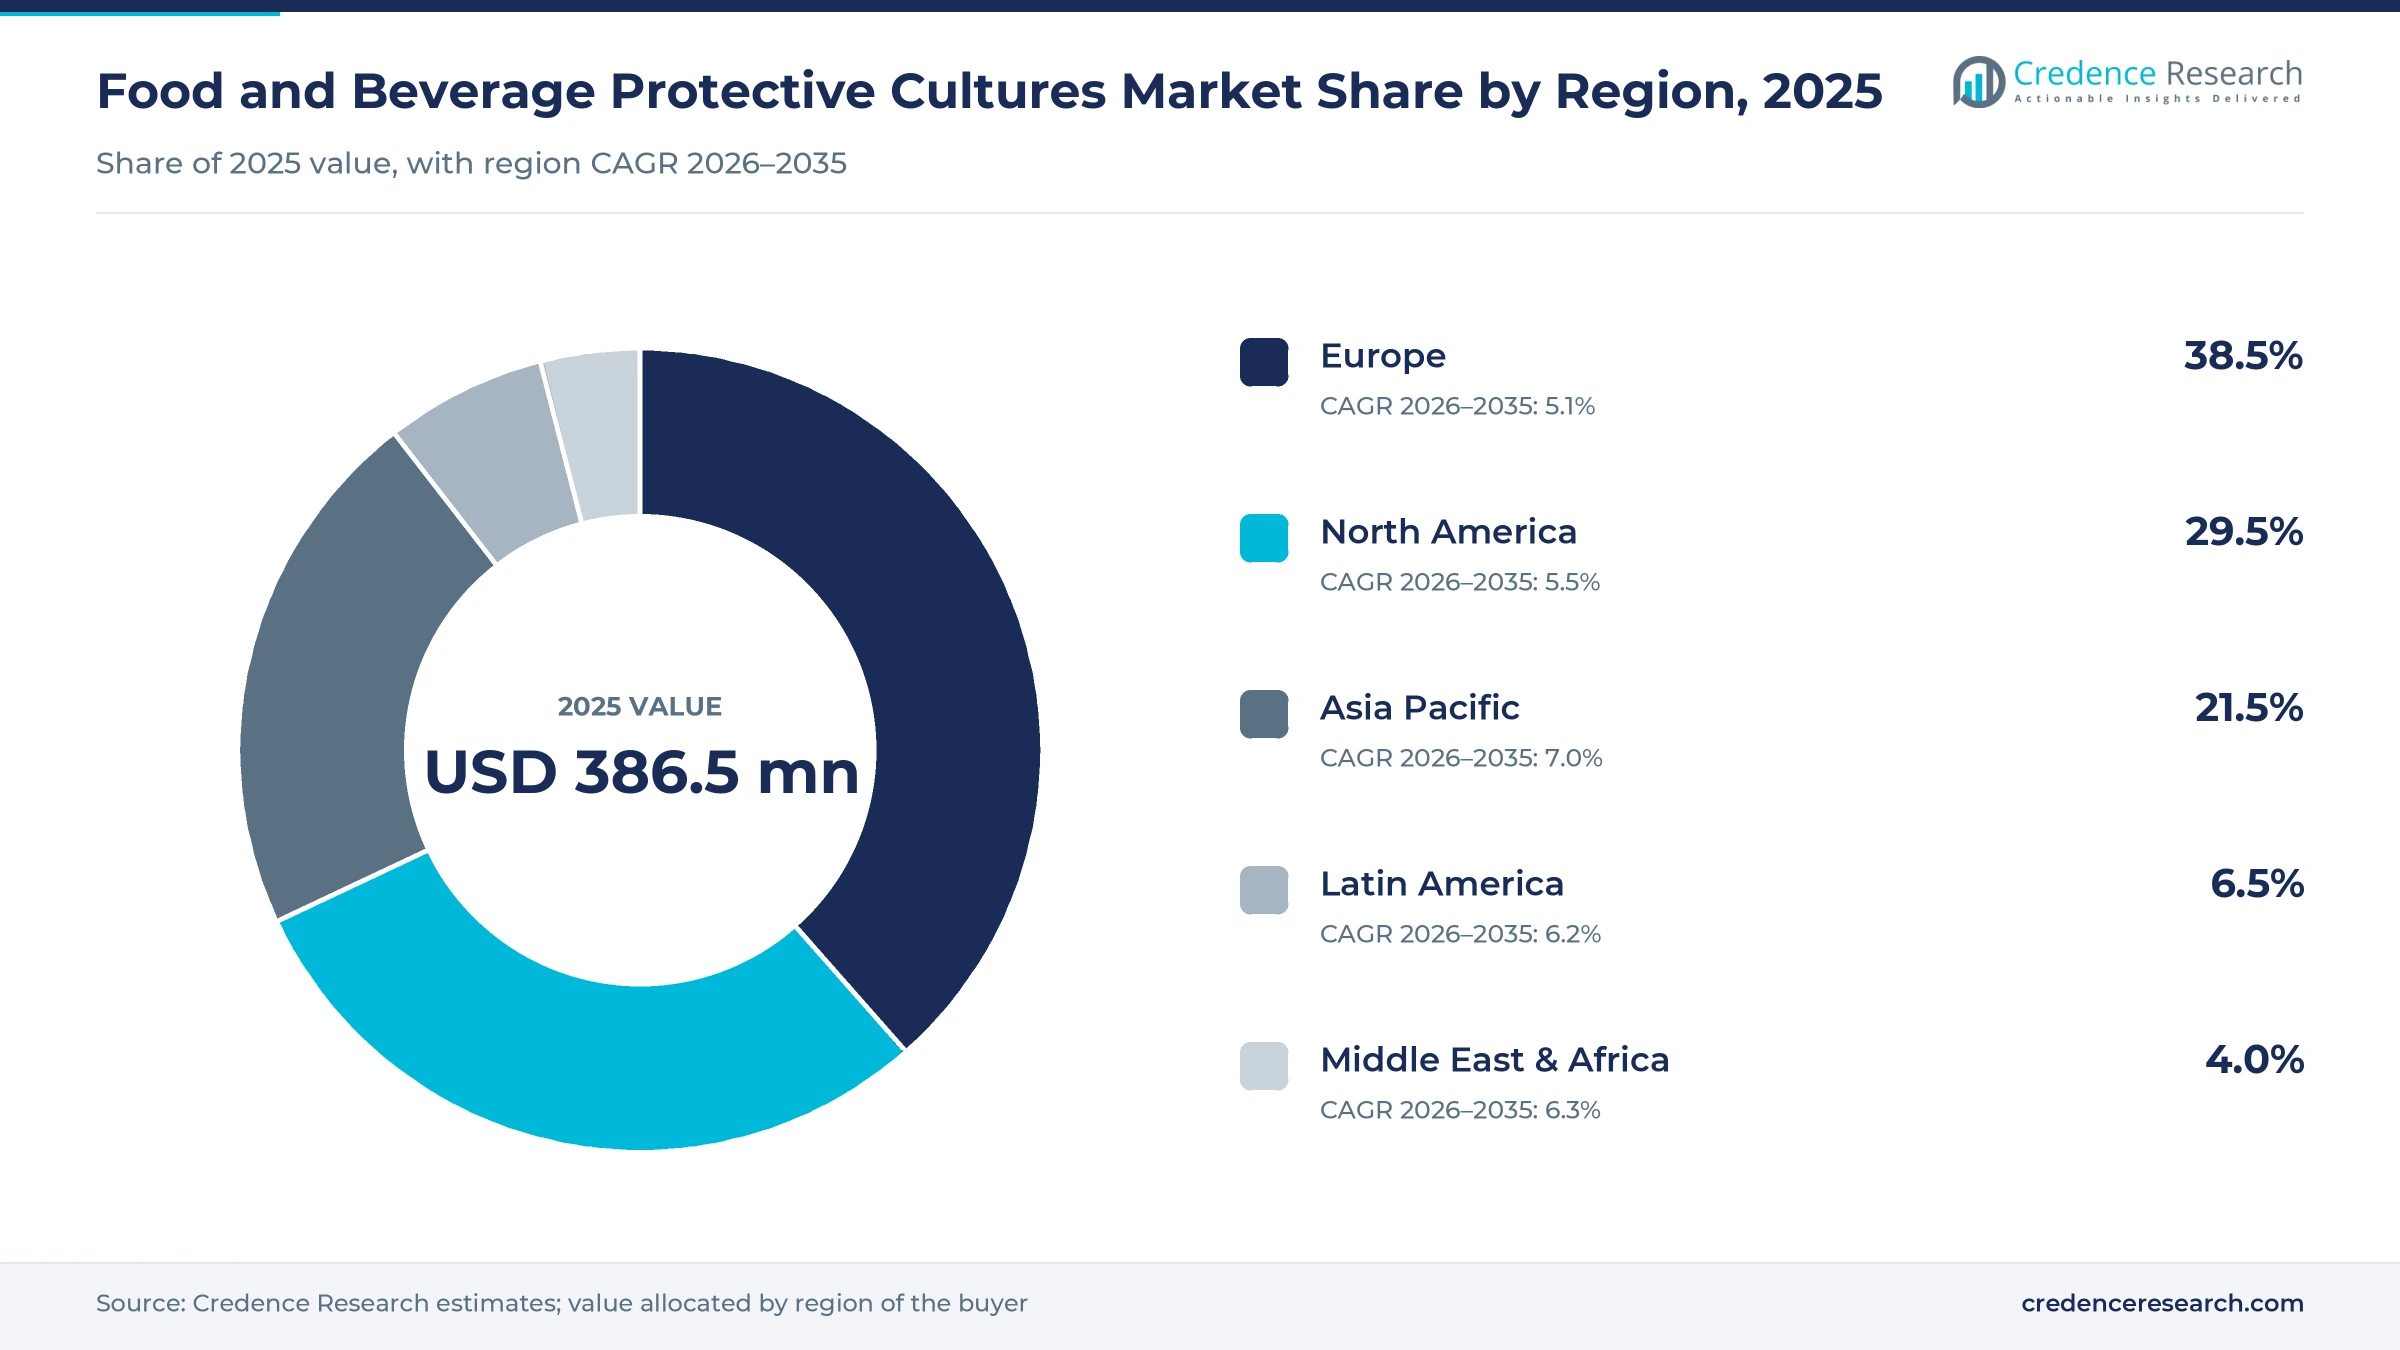
The global food and beverage protective cultures market was valued at USD 386.5 million in 2025 and is projected to increase from USD 408.9 million in 2026 to USD 679.2 million by 2035, registering a CAGR of 5.80% during 2026–2035. Demand comes from cheese makers, yogurt and fermented milk plants, and producers of cooked, cured and smoked meat and fish that add live lactic acid bacteria to hold back yeasts, molds, Listeria and gas-forming spoilage bacteria. Europe held the largest regional share, 38.5% in 2025, because it makes more cheese than any other region and regulates Listeria in ready-to-eat food most closely. Asia Pacific is the fastest-growing region at 7.0% a year as industrial dairy processing expands in India and Oceania. A European rule that applies the Listeria limit across the whole shelf life from July 2026 is changing how processors justify their best-before dates. Buyers spend little per kilogram of food, so they choose strains on proven inhibition, flavor neutrality and supplier application support.
Which cultures and food uses does this estimate count?
The estimate counts live bacterial cultures sold mainly to protect food against spoilage organisms or pathogens, including anti yeast and mold strains, anti Listeria strains and anti Clostridia strains, valued at the price the culture supplier receives. Cultures that both acidify and protect, sold as one rotation, are counted for their protective function.
Starter cultures sold only for acidification, probiotic strains, purified bacteriocins such as nisin and chemical preservatives sit outside the estimate. Large dairies and meat processors buy frozen or freeze-dried direct vat cultures on annual supply contracts, while smaller cheese makers and butchers buy small packs through distributors and online shops.
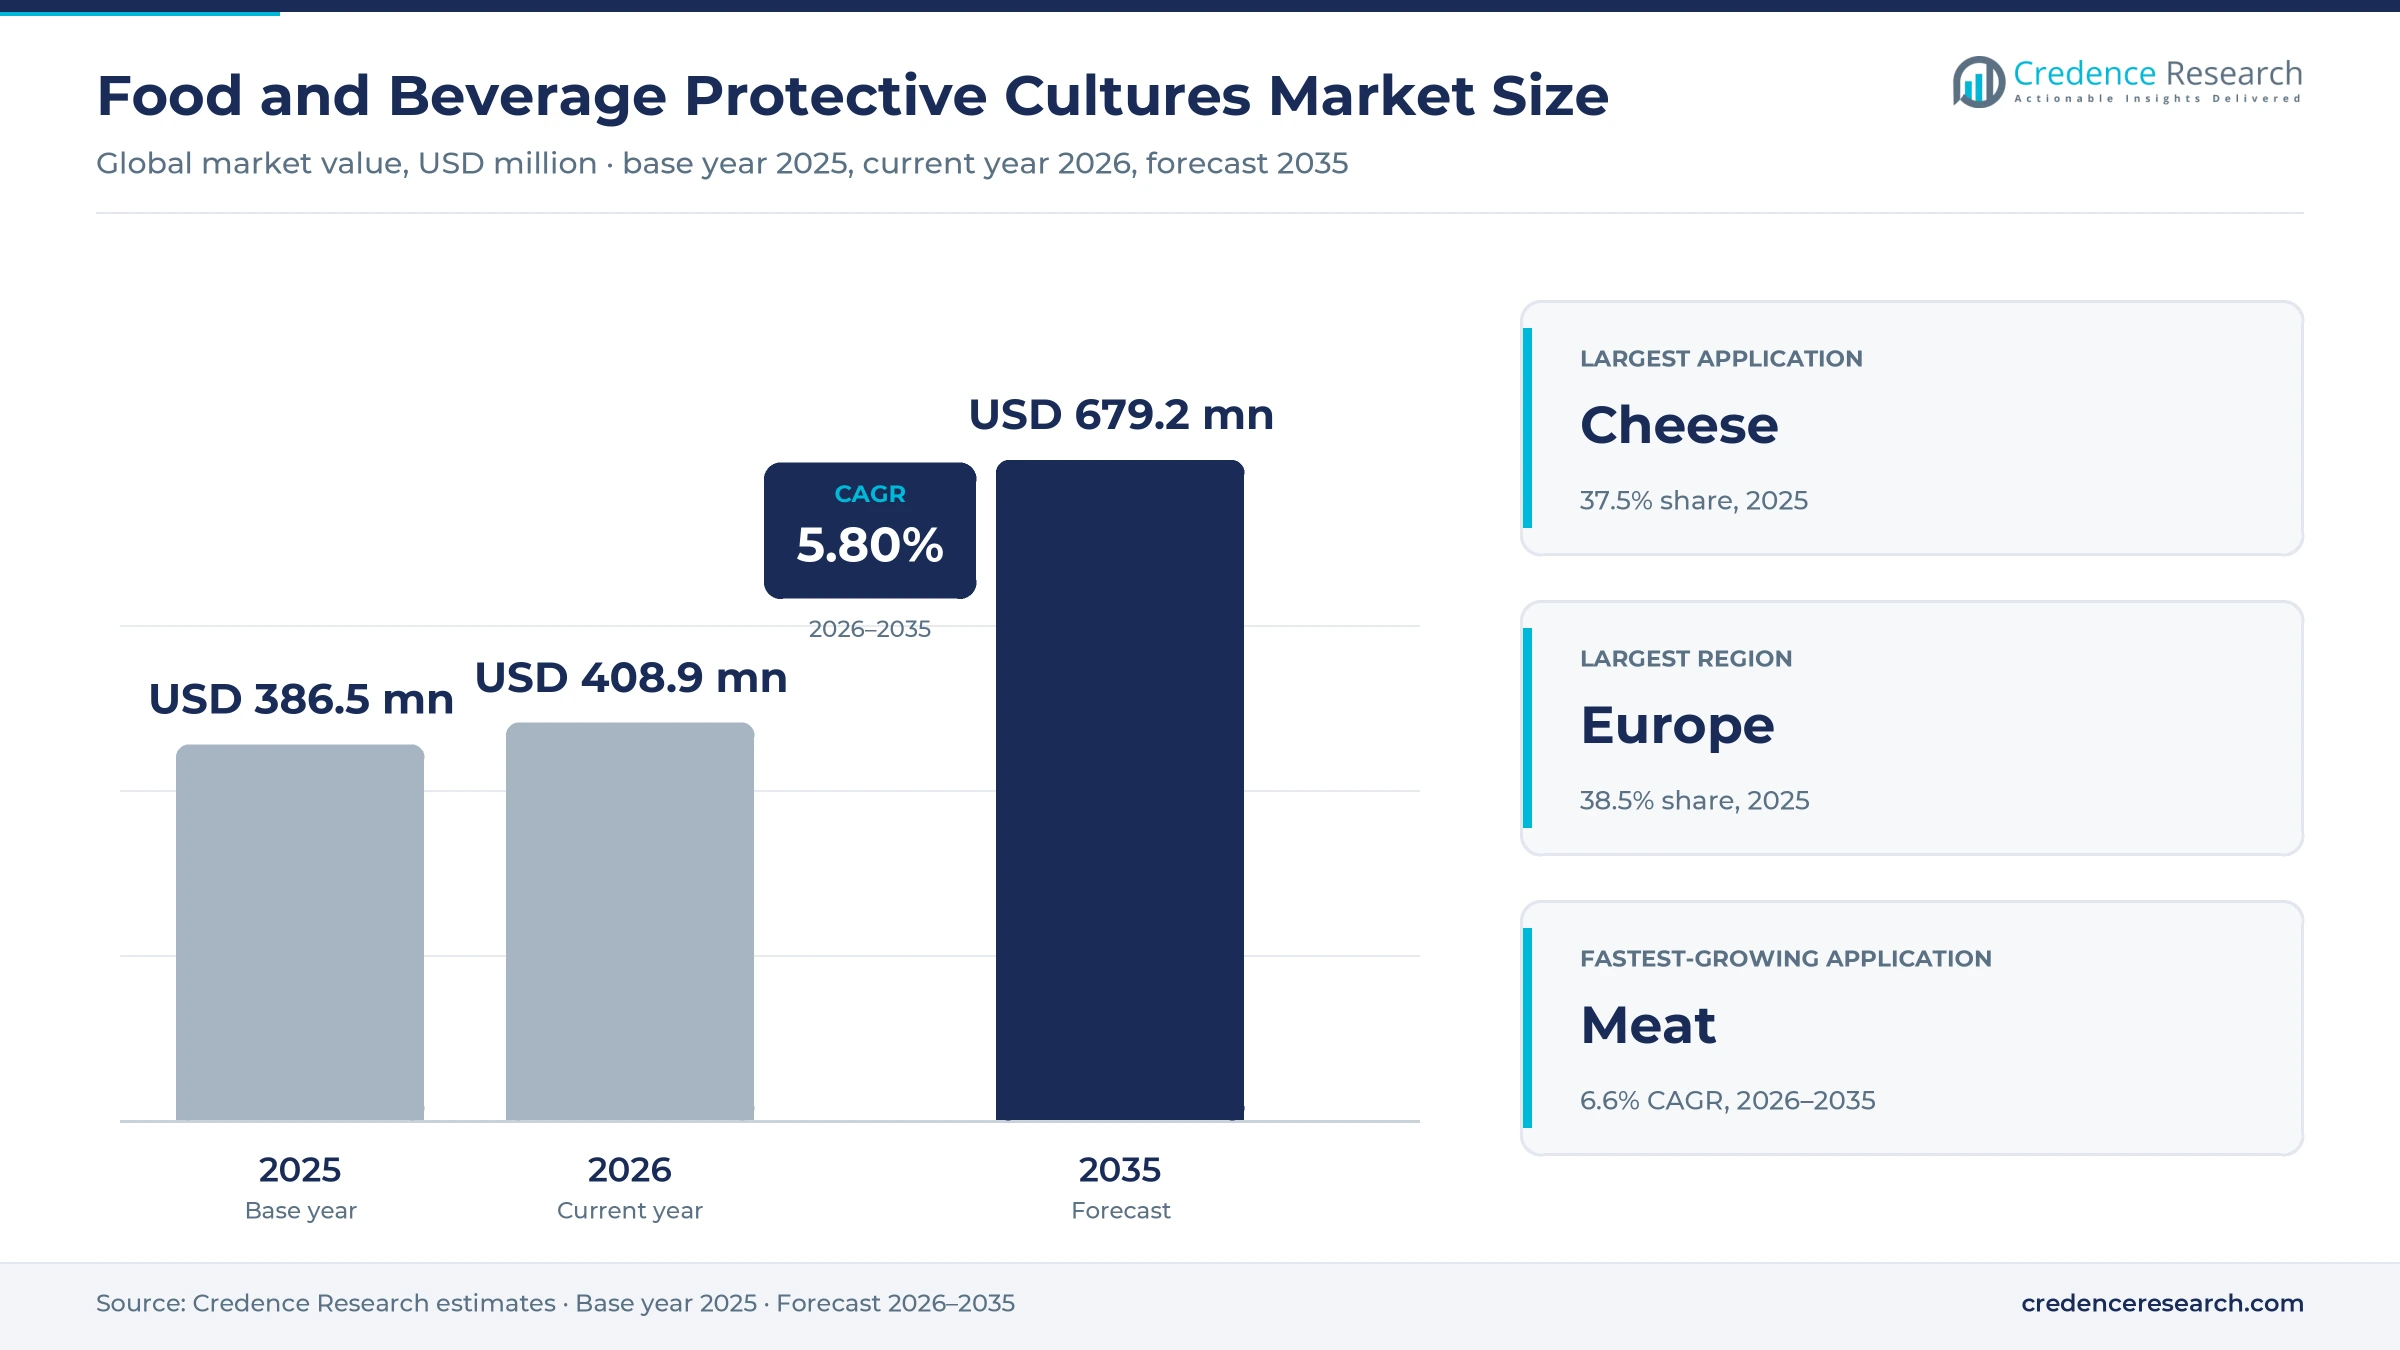
Food and Beverage Protective Cultures Market Insights
- The market is valued at USD 386.5 million in 2025 and is projected to reach USD 679.2 million by 2035, growing at a 5.80% CAGR as processors replace chemical hurdles with live cultures.
- Europe led with 38.5% of 2025 value, as the region produced 10.8 million metric tons of cheese in 2024, according to Eurostat.
- Cheese held 37.5% of 2025 value, because late blowing and surface mold threaten long-ripened stock worth more per kilogram than fresh dairy.
- The EU Listeria limit for ready-to-eat foods that support growth applies throughout shelf life from July 1, 2026, raising demand for documented inhibition.
- Lallemand completed its purchase of the IFF meat cultures portfolio in October 2026, narrowing the field of meat culture suppliers.
Cheese leads while meat applications grow fastest
Why does cheese lead while meat grows fastest?
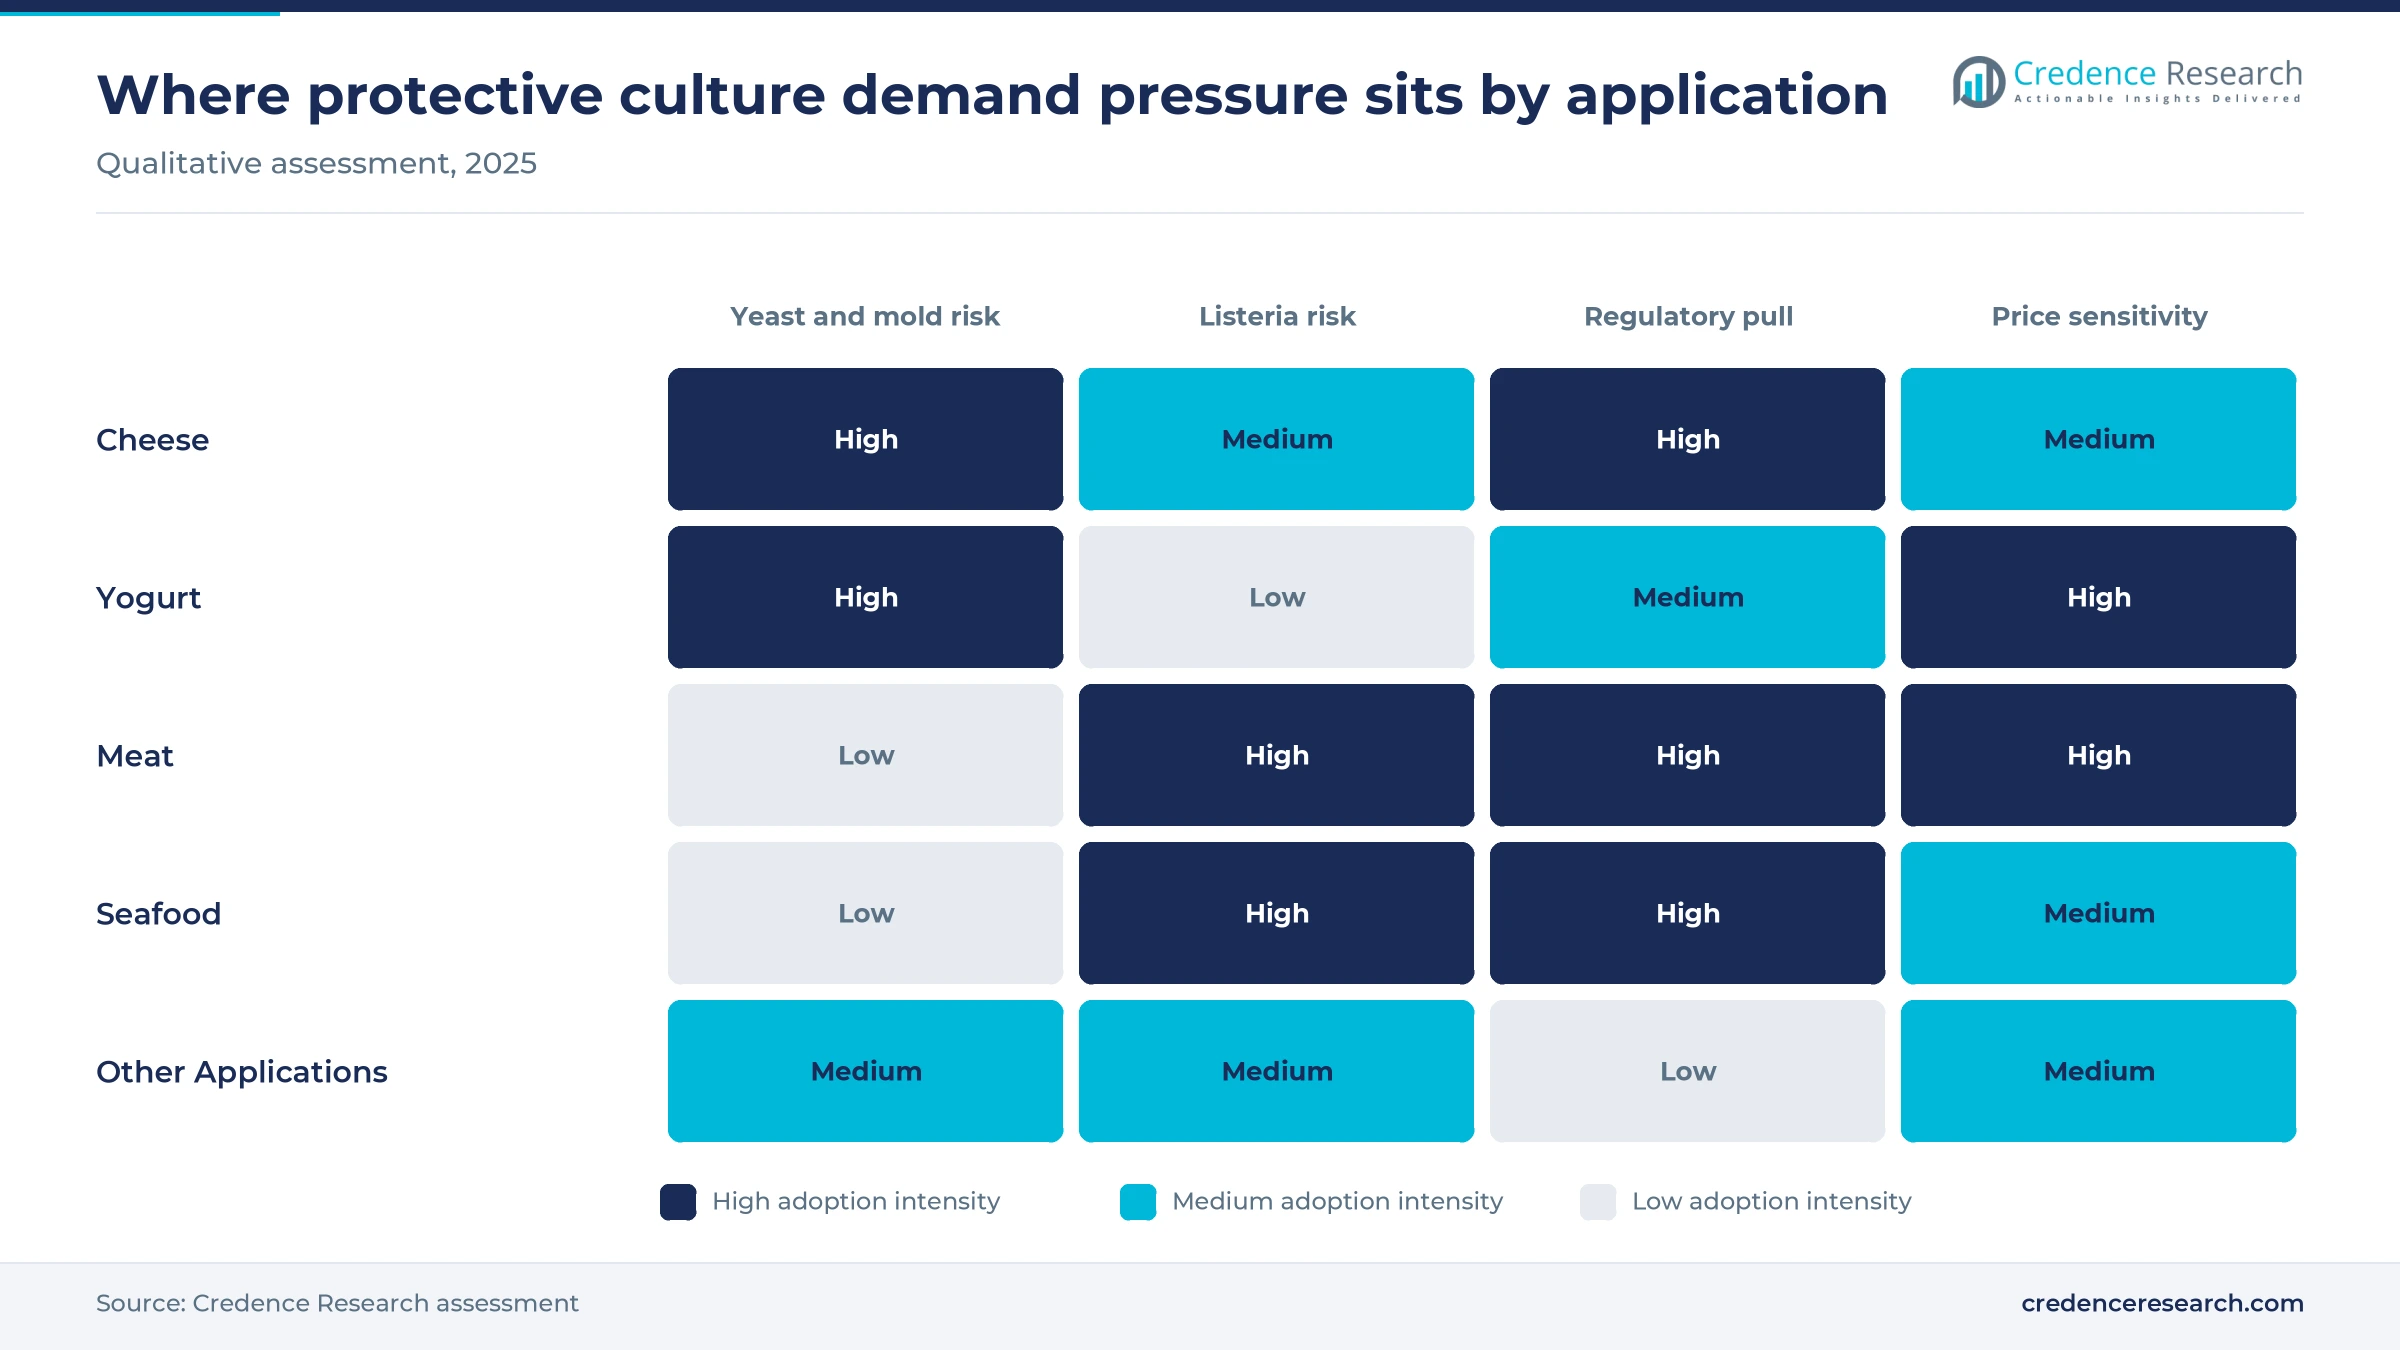
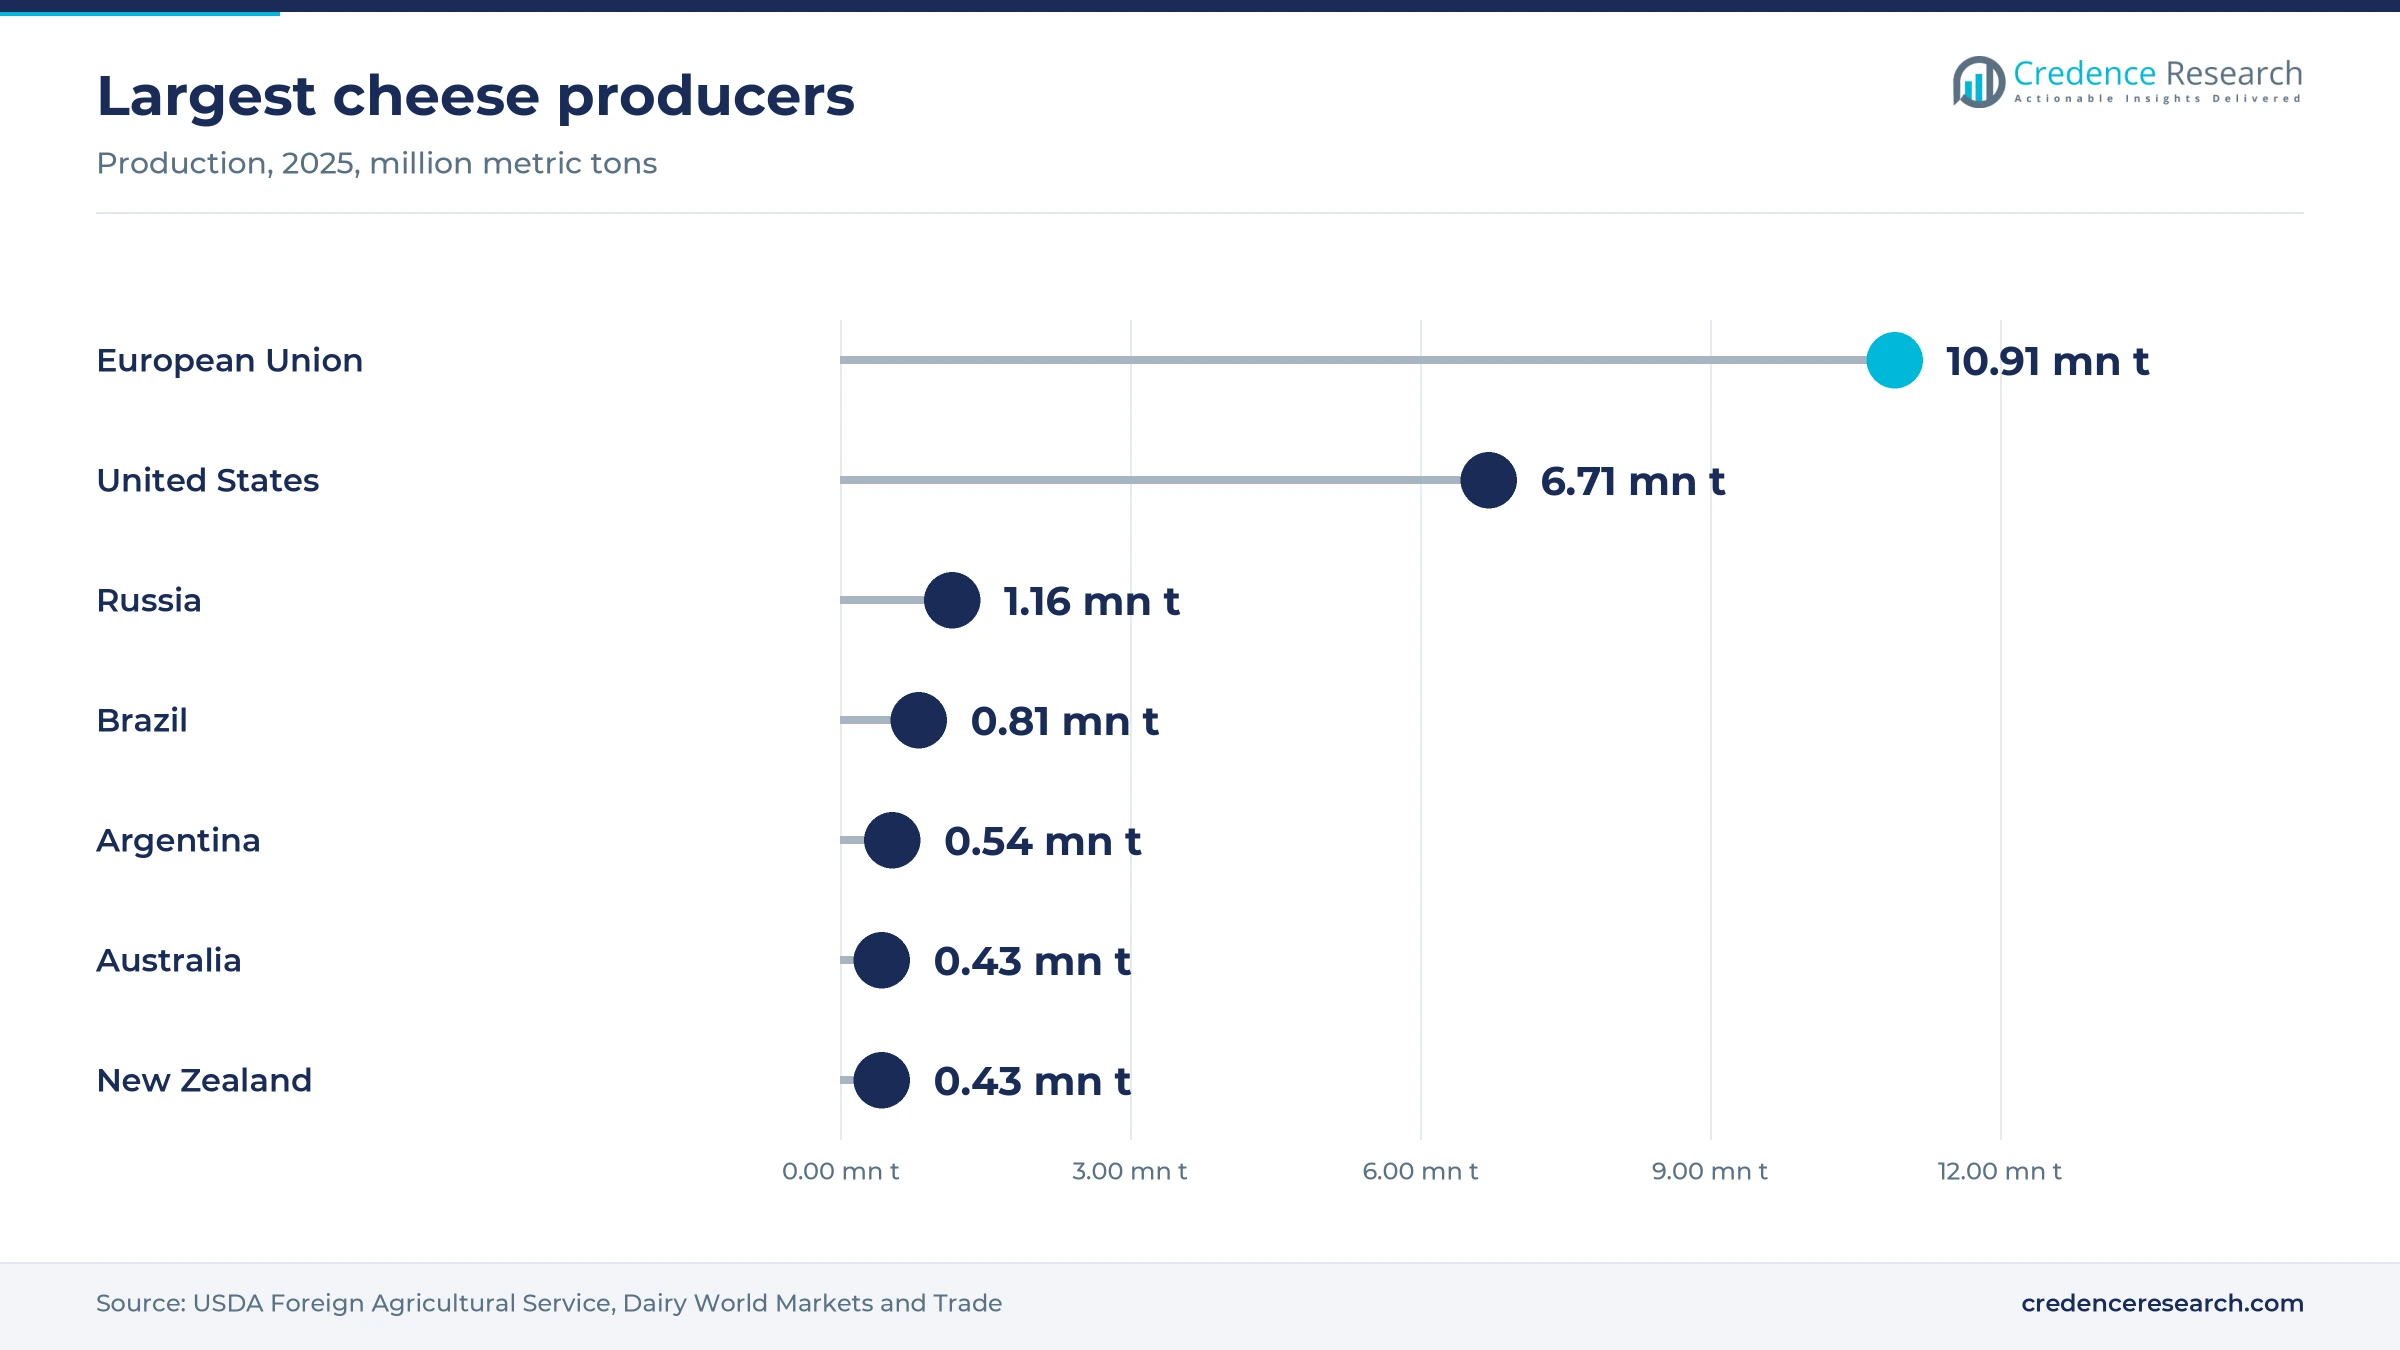
Based on application, the market is categorized into cheese, yogurt, meat, seafood and other applications. Cheese led with 37.5% of global value in 2025, because ripened cheese ties up stock for months and a single late-blowing defect can ruin a whole vat. The European Union, United States and five other large producers made 20.98 million metric tons of cheese in 2025, according to USDA Foreign Agricultural Service data. Meat grows fastest at 6.6% a year as tighter Listeria enforcement and lower nitrite limits push cooked and cured meat makers toward anti Listeria strains, though dose costs weigh more on low-margin sausages.
Why do anti yeast and mold strains lead?
Based on target microorganism, the market is categorized into yeast and mold, Listeria and pathogenic bacteria, and Clostridia and other spoilage bacteria. Yeast and Mold strains led with 46.0% of global value in 2025, because visible mold drives most consumer returns of yogurt and fresh cheese. Lallemand says Penicillium accounts for 91% of molds found on spoiled hard, semi-hard and soft cheeses. Listeria and Pathogenic Bacteria strains grow fastest at 6.9% a year as regulators in Europe and the United States require shelf-life evidence, although such strains need costly challenge testing before launch.
Why do conventional cultures dominate while organic grows?
Based on type, the market is categorized into conventional and organic protective cultures. Conventional cultures led with 86.0% of global value in 2025, because most cheese, yogurt and meat volume is made outside organic schemes and buys standard freeze-dried or frozen grades. Organic cultures grow fastest at 6.6% a year as organic dairy brands replace synthetic preservatives with clean label ingredients that their schemes allow. Supplier dsm-firmenich says its Dairy Safe rotations launched in September 2025 support organic claims, which widens supply for organic cheese makers, although organic-compliant growth media raise production costs.
| Segment Group | Leading Sub-segment | Share, 2025 | Fastest-growing Sub-segment | CAGR, 2026–2035 |
|---|---|---|---|---|
| By Application | Cheese | 37.5% | Meat | 6.6% |
| By Target Microorganism | Yeast and Mold | 46.0% | Listeria and Pathogenic Bacteria | 6.9% |
| By Type | Conventional | 86.0% | Organic | 6.6% |
Dose cost per kilogram sets protective culture pricing
Protective cultures are priced per pack of activity units, and buyers judge them by cost per liter of milk or per kilogram of meat rather than by pack price. A European retailer lists a pack of an anti yeast and mold culture at EUR 16, enough for 500 to 2,000 liters of brined cheese milk at the label dose. Industrial buyers pay far less per unit on annual contracts, so dose cost stays at a few cents or less per kilogram of finished food, by Credence Research estimates. Suppliers therefore compete on proven inhibition and support, which protects margins on patented strains, while generic anti mold strains face price pressure from regional culture houses.
| Product or reference | Typical price or fee | Basis |
|---|---|---|
| HOLDBAC YM-B anti yeast and mold culture, 100 DCU | EUR 16, dose 5–20 DCU per 100 L milk | Saksa Vorst online list price, November 2026 |
| HOLDBAC LC culture for aged cheese, 100 DCU pouch | USD 25.97, treats about 132–520 gallons of milk | The Cheesemaker list price, November 2026 |
| Bactoferm SafePro F-LC meat culture with Listeria protection | USD 23.99 per pack, dose 25 g per 100 kg | The Sausage Maker list price, November 2026 |
| Industrial direct vat cultures, annual contract | About USD 0.02–0.03 per DCU | Credence Research estimate from retail list prices and contract discounts |
Request a Free Sample
Fill in your details and we'll send you a free sample report.
- Sample data tables & charts
- Research methodology
Shelf-life Listeria rules and dairy waste lift demand
Shelf-life Listeria limits in Europe reward proven strains
Europe has moved the Listeria test from the factory gate to the end of shelf life, which makes protective cultures a compliance tool rather than a quality option. Under Regulation (EU) 2024/2895, Listeria monocytogenes must not be detected in 25 grams of ready-to-eat food that supports its growth throughout shelf life, unless the producer shows levels stay below 100 colony-forming units per gram. The rule applies from July 1, 2026, and the Food Safety Authority of Ireland tells operators to hold shelf-life studies before an incident occurs. Lallemand launched LALCULT Protect LC1, an anti Listeria culture for cheese built on a patented Carnobacterium strain, in June 2022. Soft cheese and cooked meat makers with long chilled shelf lives gain most from strains that come with challenge data.
U.S. Listeria enforcement pushes ready-to-eat meat plants
Federal meat inspectors in the United States are scrutinizing ready-to-eat plants that rely on sanitation alone, which raises the value of growth inhibitors such as anti Listeria cultures. The 2024 Boar's Head outbreak caused 61 illnesses, 60 hospitalizations and 10 deaths in 19 states and led to a recall of more than seven million pounds of product, Meat+Poultry reported. The Food Safety and Inspection Service announced on Dec. 17, 2024 that its fiscal 2025 food safety assessments would prioritize such sanitation-only facilities. USDA said in July 2025 that it had tested more than 23,000 samples in 2025, triple the 2024 volume, and completed 440 assessments. Deli meat and hot dog processors that add a post-lethality inhibitor gain an easier path through inspection.
Dairy waste costs make longer yogurt life worth paying for
Spoilage losses in chilled dairy give processors and retailers a direct financial reason to pay for protective strains. The UN Environment Programme estimated that 1.05 billion metric tons of food, 19% of food available to consumers, were wasted in 2022. In Europe, about 20% of dairy products, or 29 million metric tons, are lost or wasted each year, dsm-firmenich said in March 2022, citing FAO data, when it added four DelvoGuard yogurt cultures. IFF says one extra week of shelf life can cut yogurt waste by up to 30%, and that its newest HOLDBAC cultures add seven days of freshness on average. Yogurt brands supplying distant retailers gain the most from these strains.
Lower nitrite and salt limits shift cured meat recipes
Cured meat makers are cutting nitrite and salt, two traditional hurdles against pathogens, which leaves a safety gap that protective cultures help fill. New EU maximum levels for nitrites and nitrates in meat and fishery products under Regulation (EU) 2023/2108 have applied since Oct. 9, 2025, with older stock allowed until its use-by date. Novonesis markets SafePro Trifecta, a strain blend that controls Listeria monocytogenes in cured meat while letting producers reduce salt and fat. Consumer pressure points the same way, since 67% of European consumers avoid foods with unfamiliar ingredients, according to the EIT Food Consumer Observatory 2024. Makers of ham, bacon and other processed meat reformulating for clean labels are the most likely buyers.
Fewer culture houses and all-in-one strain rotations
Culture supply is consolidating into fewer, larger houses
The supply of protective cultures is consolidating, which gives large food groups fewer suppliers to negotiate with but deeper strain libraries. Novozymes and Chr Hansen completed their combination on Jan. 29, 2024, creating Novonesis, which now sells the FreshQ dairy and SafePro meat bioprotection ranges. Lallemand bought the IFF meat cultures portfolio in October 2026, adding Texel starter, surface and bioprotective cultures to Lallemand Specialty Cultures. Lallemand operates in more than 45 countries with over 50 production plants, which gives the acquired range wider manufacturing backup. IFF keeps its HOLDBAC dairy cultures, so it stays in dairy while leaving meat. Mid-sized meat processors may face fewer bids, while multinationals gain global supply from a single qualified source.
All-in-one rotations are shifting protection into starters
Culture houses are shifting toward single rotations that acidify, flavor and protect at once, which removes a separate dosing step for cheese and yogurt plants. Supplier dsm-firmenich launched four Dairy Safe rotations on Sept. 4, 2025, pairing nisin-producing Lactococcus lactis strains with nisin-immune starters to stop late blowing by Clostridia tyrobutyricum in semi-hard and hard cheese. CSK Food Enrichment presents its cheese range as one system covering taste, texture, bioprotection, ripening and color. Lallemand extended the approach to plant-based analogues with LALCULT Protect MC1, an anti yeast and mold culture launched in May 2023. Plants that buy one rotation simplify inventory, while stand-alone protective strains must prove extra value.
Cold-smoked fish and vacuum-packed seafood are an underserved opening
Seafood is an underserved opening, because cold-smoked and cured fish are eaten without cooking and spend weeks in vacuum packs where Listeria can grow. Lallemand launched LALCULT Protect CM-02, a bioprotective culture for cured salmon and fresh fish, on Oct. 28, 2022. Sacco says its 4Protection line suits meat and fish as well as dairy, and its meat range includes a Carnobacterium culture, Lyoflora FP-18, that works through bacteriocin production. A 2016 FoodIngredientsFirst article on these Sacco cultures noted that they grow at temperatures as low as 2 degrees Celsius, which matches chilled seafood distribution. Smoked salmon processors exporting to Europe gain a documented hurdle under the shelf-life Listeria rule.
New dairy capacity in India and the Gulf opens fresh demand
New industrial dairy capacity in India and the Gulf opens demand, because packaged yogurt and laban must survive hot climates and long distribution routes. India produced 239.30 million metric tons of milk in 2023-24 and has processing capacity of 66 million liters a day, with a goal of 100 million liters by 2028-29, the Press Information Bureau said in November 2025. Gulf dairies ship yogurt and laban across borders in high heat, which favors strains that hold back yeasts and molds. Middle East & Africa demand for protective cultures grows at 6.3% a year from a small base. Culture houses with local application labs can win dairies building new lines.
GRAS review, proof burden and weak Chinese dairy
U.S. GRAS review creates regulatory uncertainty for new strains
Many protective strains reach U.S. buyers through generally recognized as safe determinations, and that route is under review. The secretary of Health and Human Services directed the FDA on March 10, 2025 to explore rulemaking that would eliminate the self-affirmed GRAS pathway. The FDA evaluates an average of 75 GRAS notices a year, so a shift to mandatory notification could slow strain launches. Smaller culture suppliers without regulatory teams are most exposed, while houses with filed notices keep an edge.
Proof of efficacy is strain-specific and costly to generate
Protective cultures work differently by strain and recipe, so each new application needs its own evidence. Samuel Alcaine of Cornell University wrote in Dairy Foods in February 2018 that bioprotective cultures are costly, suit only low-level contamination and are no substitute for hygiene, and he advised challenge studies. Small cheese makers and regional meat processors are most exposed, because they cannot fund the trials, which keeps adoption concentrated among large plants that test with suppliers.
Post-acidification and flavor trade-offs limit fresh dairy use
Some protective strains keep acidifying yogurt in the cold chain, which sours flavor and limits their use in mild products. Chr Hansen launched a FreshQ generation in April 2021 to cut post-acidification at higher temperatures, and dsm-firmenich designed two DelvoGuard cultures in 2022 for lower post-acidification. These launches show that earlier strains changed taste in some recipes. Brands selling mild or low-sugar yogurt are most exposed until they find a strain that matches their flavor profile.
Falling Chinese dairy output slows Asia's largest outlet
Shrinking dairy output in China slows sales of protective cultures to the largest dairy market in Asia. Liquid milk production fell 2.8% to 27.4 million tons in 2024, according to the China Dairy Industry Association, and output of dairy products from designated-size producers fell 1.9%, the National Bureau of Statistics said. Yogurt makers facing falling volumes tend to cut launches and promotions, so suppliers selling into China face slower orders and tougher price talks.
Europe leads on cheese volume and stricter food law
| Region | Value, 2025 (USD million) | Share, 2025 | CAGR, 2026–2035 |
|---|---|---|---|
| Europe | 148.8 | 38.5% | 5.1% |
| North America | 114.0 | 29.5% | 5.5% |
| Asia Pacific | 83.1 | 21.5% | 7.0% |
| Latin America | 25.1 | 6.5% | 6.2% |
| Middle East & Africa | 15.5 | 4.0% | 6.3% |
Europe leads on cheese output and strict Listeria rules
Europe held 38.5% of 2025 value and grows at 5.1% a year, the slowest rate among regions because adoption is already high. The European Union produced 10.8 million metric tons of cheese in 2024, with Germany making 22.5% and France 17.8%, Eurostat data show, and Germany also led output of acidified milk products such as yogurt. The shelf-life Listeria rule and the lower nitrite limits described above add demand from soft cheese and cured meat. Demand for protective cultures in Europe therefore rests on long-ripened cheese and on chilled ready-to-eat meat. The main culture houses are based in Denmark, the Netherlands, France and Italy, close to these customers.
North America grows on ready-to-eat meat compliance
North America held 29.5% of 2025 value and grows at 5.5% a year. The United States made 6.71 million metric tons of cheese in 2025, up from 6.46 million in 2024, according to USDA Foreign Agricultural Service data, which keeps anti mold and anti Clostridia demand high. The tougher Listeria inspection regime noted above adds ready-to-eat meat demand. Demand for anti Listeria strains in the region should rise with the 2025 inspection volumes, while pending GRAS changes remain the main uncertainty for launches.
Asia Pacific grows fastest as industrial dairy expands
Asia Pacific held 21.5% of 2025 value and grows fastest at 7.0% a year. China's National Health Commission finalized its amended list of bacterial cultures usable in food on Aug. 25, 2022, with 38 entries and a two-year grace period for renamed strains, which sets the range of strains culture houses can sell there. Australia and New Zealand made 430,000 and 425,000 metric tons of cheese in 2025, USDA data show, a combined 855,000 tons that keeps anti mold culture use high in export cheese plants. India's new dairy capacity drives growth, while weak Chinese output tempers it.
Latin America builds on rising cheese output in the southern cone
Latin America held 6.5% of 2025 value and grows at 6.2% a year. Brazil produced 805,000 metric tons of cheese in 2025 and Argentina 540,000 tons, both higher than in 2024, according to USDA Foreign Agricultural Service data. Warm climates and long distribution routes lift demand for yeast and mold control across that 805,000-ton Brazilian cheese base and regional yogurt. Most cultures arrive through local subsidiaries of the large culture houses or through distributors.
Middle East & Africa follows Gulf dairy and laban exports
Middle East & Africa held 4.0% of 2025 value and grows at 6.3% a year from the smallest base. Demand sits mainly with a small number of large Gulf dairies that make yogurt, laban and fresh cheese for regional markets, so a few supply contracts decide much of it. No official statistic tracks culture use in the region, so this share is a Credence Research estimate with a wider margin of error. High temperatures and cross-border laban shipments favor strains that protect fresh dairy over long routes.
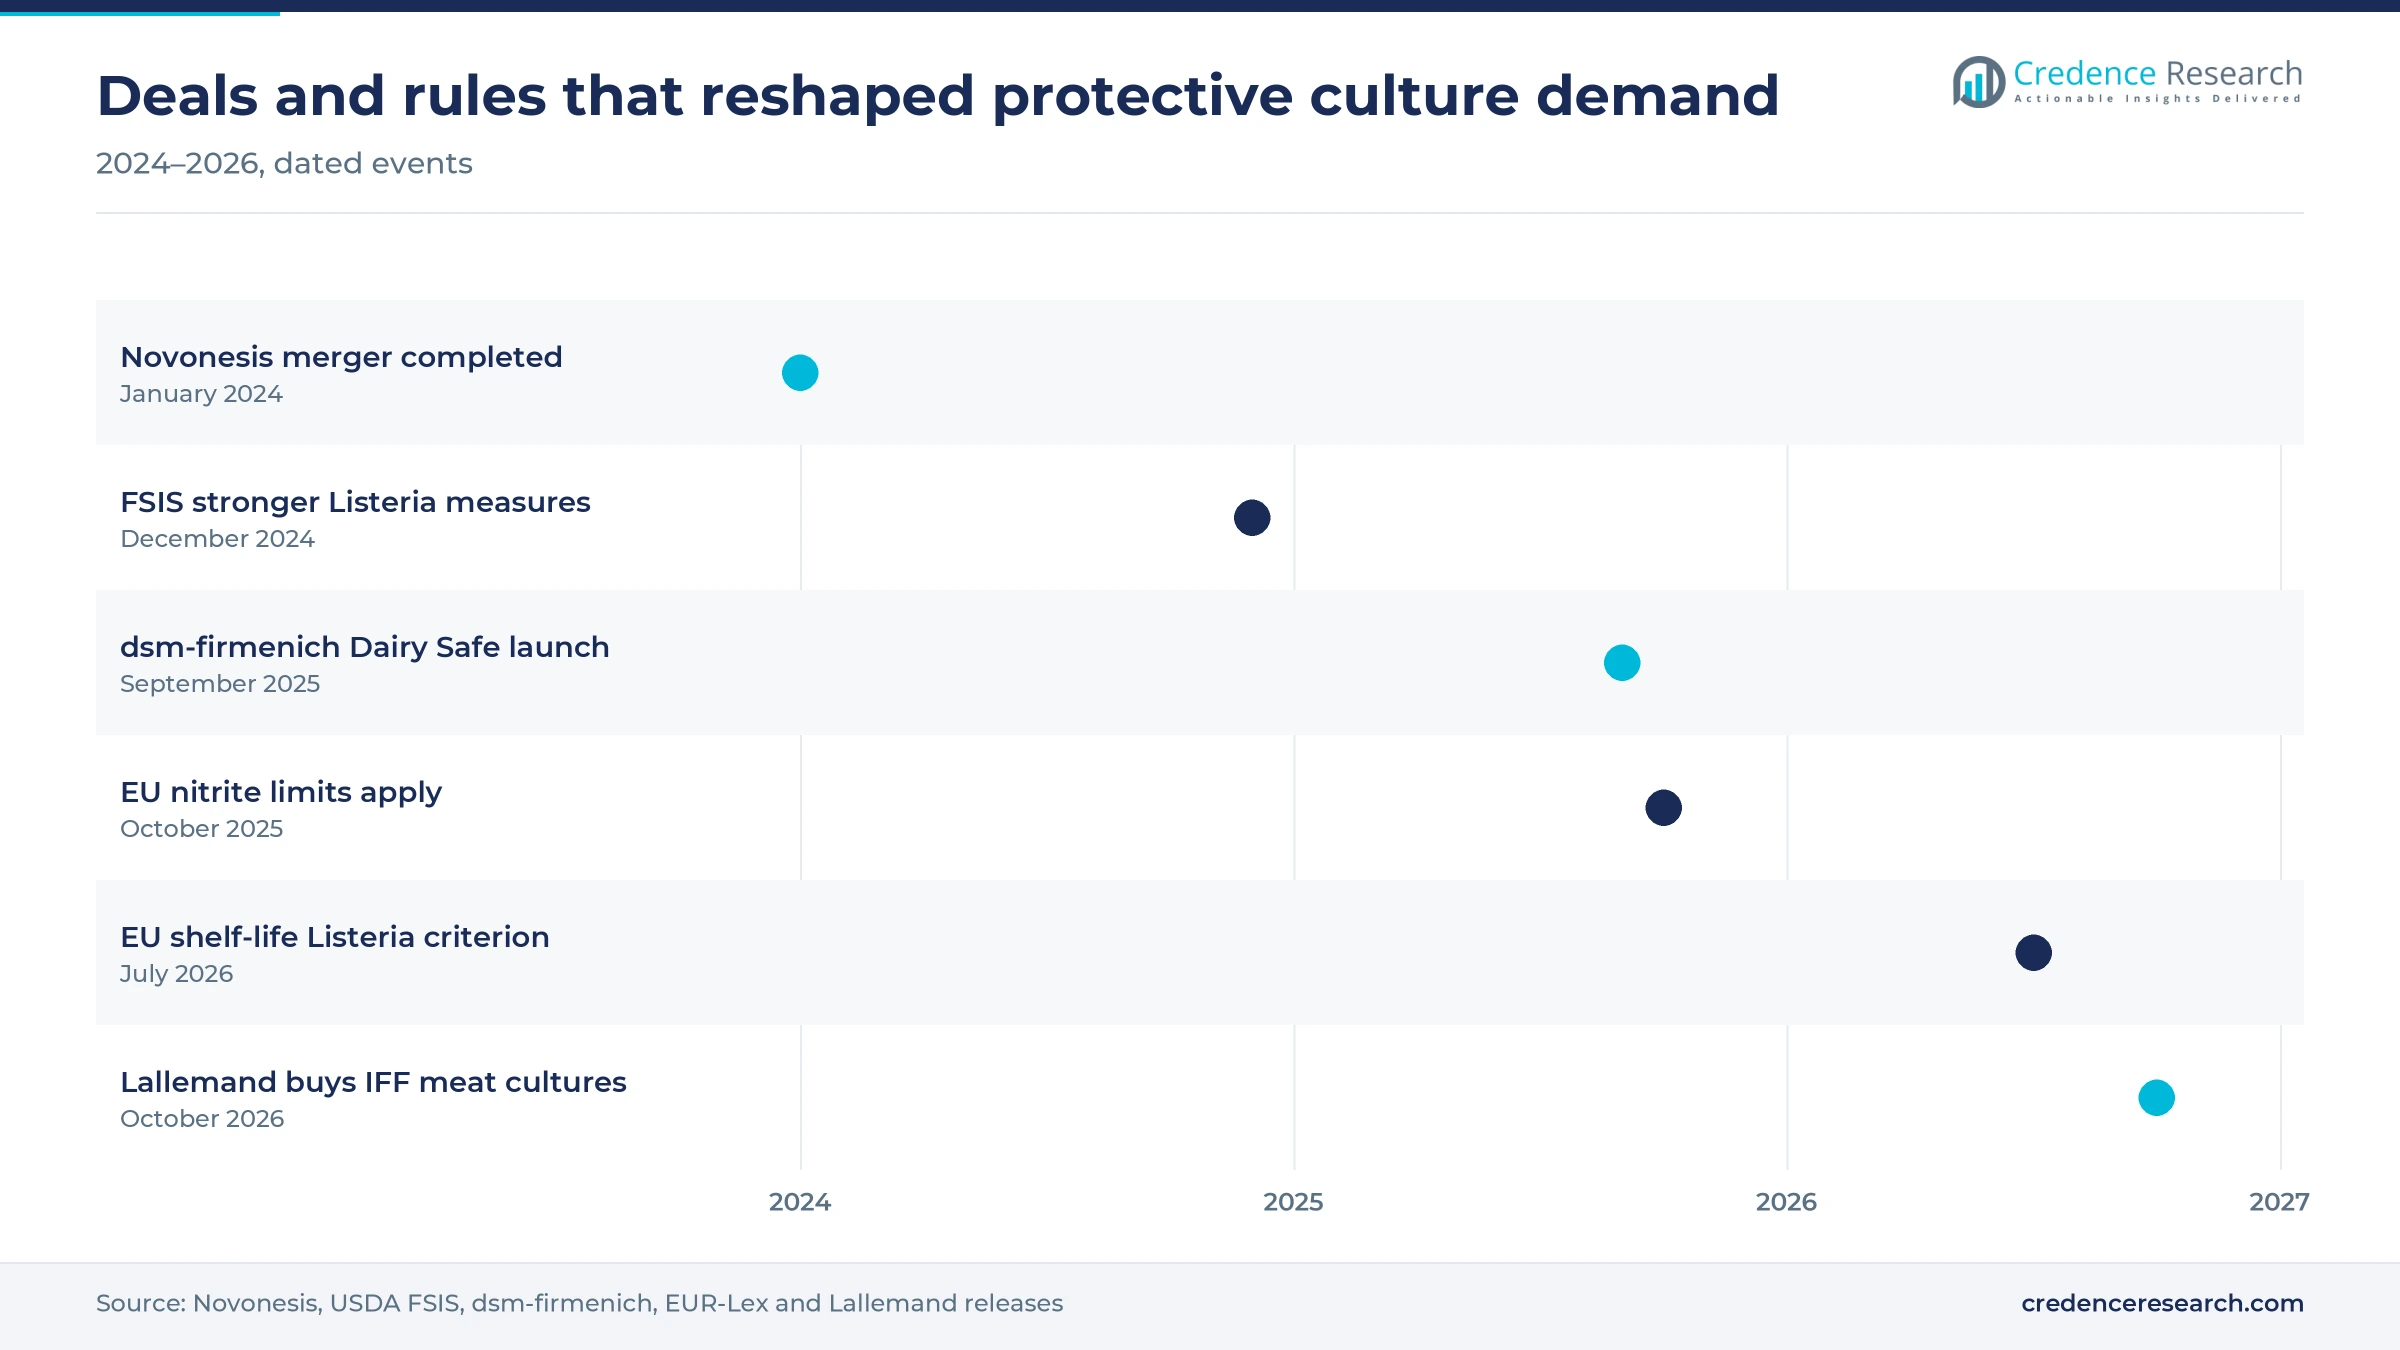
Mergers and food safety rules reshaped supply
| Development | Status and market relevance |
|---|---|
| In January 2024, Novozymes and Chr Hansen completed their combination, creating Novonesis. | Completed merger; the FreshQ and SafePro bioprotection ranges now sit inside one biosolutions group. |
| In December 2024, the USDA Food Safety and Inspection Service announced stronger Listeria measures, including broader Listeria species testing from January 2025. | Policy announced and in force; ready-to-eat plants that rely only on sanitation face priority assessments. |
| In September 2025, dsm-firmenich launched four Dairy Safe culture rotations that combine nisin-producing strains with starters for semi-hard and hard cheese. | Commercial launch; cheese makers can buy protection and acidification in one rotation. |
| In October 2025, lower EU maximum levels for nitrites in meat and fishery products under Regulation (EU) 2023/2108 began to apply. | Regulation in force; cured meat makers need other hurdles such as protective cultures. |
| In October 2026, Lallemand acquired the IFF meat cultures portfolio, including Texel starter, surface and bioprotective cultures. | Completed acquisition; meat customers move to Lallemand Specialty Cultures during a transition period. |
Competitive exclusion and bacteriocins do the work
- Competitive exclusion lets harmless lactic acid bacteria take up space and nutrients before yeasts, molds or Listeria can grow, the main mode of FreshQ cultures.
- Bacteriocin production uses strains such as nisin-producing Lactococcus lactis or Carnobacterium that release antimicrobial peptides against Listeria and Clostridia.
- Direct vat freeze-dried formats let plants add measured activity units straight into milk or meat batter without propagating cultures on site.
- Strain rotations swap phage-unrelated strains between production days, so bacteriophage attacks do not stop acidification and protection in cheese vats.
Need a Custom Version of This Report?
Tailor the scope, geography, or segments to your exact requirements.
- Custom geography or segment scope
- Direct access to our analyst team
Strain libraries and application labs decide wins
Competition turns on strain performance, application support and regulatory files rather than on pack price. Novonesis sells FreshQ cultures for fermented milk and SafePro cultures for meat, built on the former Chr Hansen library. dsm-firmenich sells DelvoGuard for yogurt and Dairy Safe rotations for cheese. IFF keeps HOLDBAC for cheese and fresh dairy after selling its meat cultures to Lallemand, which also sells LALCULT Protect strains for cheese, dairy and fish. Sacco competes with its 4Protection line, CSK Food Enrichment with cheese systems that include bioprotection, and Bioprox with cultures for fresh dairy and cheese. Suppliers that sell to yogurt brands win on flavor neutrality as much as on mold control. The eight companies profiled below cover the global houses and the main specialists in the food and beverage protective cultures market.
How concentrated is the supply of protective strains?
Supply is concentrated in a few European culture houses that own large strain libraries, freeze-drying plants and application labs. Novonesis, dsm-firmenich, IFF and Lallemand cover most global dairy and meat accounts, while Sacco, CSK Food Enrichment and Bioprox compete with strong regional cheese and fermented milk customer bases. Specialists such as M Food Group sell protective cultures with spices and additives to meat processors. Entry barriers are high, because each strain needs safety files, challenge data and food approvals in every market. Margins sit with patented anti Listeria and anti mold strains, while generic acidifying cultures earn thinner spreads.
Companies profiled and their roles in this market
| Company | Type | Role in the market |
|---|---|---|
| Novonesis A/S (Novozymes and Chr. Hansen) | Full-line culture supplier | Sells FreshQ dairy and SafePro meat bioprotective cultures worldwide |
| dsm-firmenich | Full-line culture supplier | Sells DelvoGuard yogurt cultures and Dairy Safe protective cheese rotations |
| International Flavors & Fragrances Inc. (IFF) | Dairy culture supplier | Sells HOLDBAC protective cultures for cheese, fresh dairy and alternatives |
| Lallemand Inc. (Lallemand Specialty Cultures) | Culture supplier | Sells LALCULT Protect strains and the former IFF meat culture range |
| Sacco S.r.l. (Sacco System) | Specialist | Sells the 4Protection line against yeasts, molds, Listeria and Clostridia |
| CSK Food Enrichment B.V. | Cheese culture specialist | Sells cheese culture systems that include bioprotection |
| Bioprox | Specialist | French culture maker selling bioprotection for butter, cheese and yogurt |
| M Food Group GmbH (Meat Cracks) | Meat specialist | Sells protective and starter cultures with additives to meat processors |
Shelf-life evidence now sells protective strains
Credence Research's view is that shelf-life evidence, rather than the clean label story, now sells protective strains in the food and beverage protective cultures market. The EU criterion that applies through shelf life and tougher U.S. inspection both ask processors to show how Listeria stays under control, and a culture with challenge data answers that question at a low cost per kilogram. Dairy remains the volume base, but meat and seafood will add most new demand. Buyers should qualify a second strain source now, since consolidation has reduced the number of suppliers in meat cultures.
Old estimate replaced by a dose and volume build
The report uses 2025 as the base year and forecasts to 2035. The earlier Credence Research estimate was tested against a dose and volume build that multiplies cheese, fermented milk and meat output by the share treated, the label dose and typical culture prices, and the 2025 value was reset to that estimate. Regional and segment shares are Credence Research estimates based on dairy and meat output, regulation and the location of culture plants. Sources include regulators, statistics offices, industry associations, company product data, retail price lists and trade press. No public statistic separates protective from starter culture sales, so the split rests on dose and volume assumptions. No interviews or surveys were conducted for this update of the estimate.
Meat safety and cheese volume carry growth to 2035
Growth of the food and beverage protective cultures market to 2035 depends on how strictly Listeria rules are enforced and on dairy volume in Asia. The base case assumes steady enforcement in Europe and the United States, modest growth in cheese output and continued nitrite reduction in cured meat. Meat applications and anti Listeria strains should gain share, while cheese stays the largest outlet. Consolidated culture houses will push all-in-one rotations, and specialists will compete in regional cheese and seafood niches with documented strains.
Enforcement pace and dairy volume set the range
The range of outcomes depends mainly on how strictly European and U.S. authorities enforce shelf-life Listeria control, and on whether processors treat cultures as their main hurdle or a secondary one. Dairy volume in China and the pace of new capacity in India add a second swing factor. A tighter U.S. GRAS route would slow new strain launches, while documented challenge data would speed adoption in meat and seafood.
| Scenario | CAGR, 2026–2035 | Value, 2035 | What has to hold |
|---|---|---|---|
| Downside | 4.3% | USD 597.3 million | GRAS changes slow U.S. launches and Chinese dairy volumes keep falling through 2028 |
| Base | 5.80% | USD 679.2 million | EU and U.S. Listeria rules are enforced steadily and dairy output grows modestly |
| Upside | 7.1% | USD 758.1 million | Meat and seafood processors adopt cultures widely to meet shelf-life Listeria limits |
Frequently Asked Questions
How big is the food and beverage protective cultures market?
What are protective cultures in food?
How do protective cultures differ from other microbial food cultures?
Which application uses the most protective cultures?
How large is the U.S. protective cultures market?
Which region leads the protective cultures market?
Who are the main protective culture suppliers?
What restrains the protective cultures market?
Table of Content
Chapter 1 Market Segmentation
- 1.1 Segmentation Framework
- 1.1.1 Product and Service Classification
- 1.1.2 Application and End-Use Classification
- 1.1.3 Technology and Solution Classification
- 1.1.4 Customer and Distribution Channel Classification
- 1.1.5 Geographic Segmentation
- 1.1.6 Market Segment Definitions and Boundaries
- 1.2 By Application
- 1.2.1 Cheese
- 1.2.2 Yogurt
- 1.2.3 Meat
- 1.2.4 Seafood
- 1.2.5 Other Applications
- 1.3 By Target Microorganism
- 1.3.1 Yeast and Mold
- 1.3.2 Listeria and Pathogenic Bacteria
- 1.3.3 Clostridia and Other Spoilage Bacteria
- 1.4 By Type
- 1.4.1 Conventional
- 1.4.2 Organic
Chapter 2 Introduction
- 2.1 Report Objectives and Scope
- 2.2 Product Definition and Industry Terminology
- 2.3 Market Inclusions and Exclusions
- 2.4 Research Process
- 2.4.1 Primary Research and Expert Interviews
- 2.4.2 Secondary Research and Source Review
- 2.4.3 Top-Down and Bottom-Up Estimation
- 2.4.4 Data Triangulation and Verification
- 2.5 Market Size Measurement Basis
- 2.5.1 2025: USD 386.5 million → 2035: USD 679.2 million
- 2.6 Historical and Forecast Reference Periods
- 2.6.1 Historical Period: 2018-2025
- 2.6.2 Base Year: 2025
- 2.6.3 Forecast Period: 2025-2035
- 2.7 Research Assumptions and Limitations
Chapter 3 Executive Summary
- 3.1 Market Snapshot and Key Findings
- 3.2 Base-Year Market Size, 2025
- 3.3 Forecast Market Size, 2035
- 3.4 Revenue and Volume Growth Outlook
- 3.5 Key Demand and Supply Indicators
- 3.6 Leading Market Segments
- 3.7 Fastest-Growing Market Opportunities
- 3.8 Regional Performance Highlights
- 3.9 Technology and Industry Transformation
- 3.10 Competitive Landscape Summary
- 3.11 Analyst View and Strategic Implications
Chapter 4 Global Food and Beverage Protective Cultures Market Trends and Developments
- 4.1 Historical Industry Development, 2018-2025
- 4.2 Recent Market Trends and Developments
- 4.3 Demand and Customer Behavior Trends
- 4.4 Technology and Product Innovation
- 4.5 Artificial Intelligence, Automation and Digitalization
- 4.6 Local Manufacturing and Supply Chain Realignment
- 4.7 Industry Partnerships, Mergers and Acquisitions
- 4.8 Sustainability and Circular Economy Developments
- 4.9 Government and Private Sector Investment Trends
- 4.10 Emerging Business Models and Commercialization
- 4.11 Industry Developments and Announcements
Chapter 5 Global Food and Beverage Protective Cultures Market Production, Supply and Demand Analysis
- 5.1 Demand Trend and Consumption Analysis, 2018-2025
- 5.2 Demand Forecast, 2025-2035
- 5.3 Production and Output Trend, 2018-2025
- 5.4 Production and Output Forecast, 2025-2035
- 5.5 Installed Capacity and Capacity Utilization
- 5.6 Company-Wise Production Plants and Statistics
- 5.6.1 Installed Production Capacity
- 5.6.2 Actual Production
- 5.6.3 Planned Capacity and Expansion Targets
- 5.7 Supply Chain Structure and Procurement Trends
- 5.8 Supply-Demand Gap and Bottlenecks
- 5.9 Import Dependence and Sourcing Structure
- 5.10 Contract Manufacturing and Outsourcing
- 5.11 Regional Supply and Demand Concentration
Chapter 6 Global Food and Beverage Protective Cultures Market Pricing Analysis
- 6.1 Pricing Structure and Measurement
- 6.2 Historical Pricing Trends, 2018-2025
- 6.3 Pricing Outlook, 2025-2035
- 6.4 Average Selling Price and Unit Economics
- 6.5 Pricing by Product and Market Segment
- 6.6 Geographic Pricing Differences
- 6.7 Key Input, Energy, Labor and Logistics Costs
- 6.8 Contract Pricing and Purchasing Models
- 6.9 Pricing Sensitivity and Competitive Positioning
- 6.10 Price, Margin and Profitability Implications
Chapter 7 Global Food and Beverage Protective Cultures Market Dynamics
- 7.1 Market Growth Drivers
- 7.1.1 Demand-Side Drivers
- 7.1.2 Technology and Innovation Drivers
- 7.1.3 Infrastructure and Investment Drivers
- 7.1.4 Regulatory and Policy Drivers
- 7.2 Market Restraints
- 7.2.1 Cost and Affordability Constraints
- 7.2.2 Technology and Adoption Barriers
- 7.2.3 Supply Chain and Operational Constraints
- 7.3 Market Challenges
- 7.3.1 Competitive Pressure and Margin Erosion
- 7.3.2 Skills, Infrastructure and Implementation Gaps
- 7.4 Emerging Market Opportunities
- 7.5 Market Dynamics Impact and Time-Horizon Assessment
Chapter 8 Global Food and Beverage Protective Cultures Value Chain Analysis
- 8.1 Industry Value Chain Overview
- 8.2 Upstream Suppliers and Critical Inputs
- 8.3 Technology and Component Providers
- 8.4 Manufacturing or Service Delivery
- 8.5 Distribution, Channel Partners and Integrators
- 8.6 Downstream Applications and End Users
- 8.7 Value Addition and Profit Pools
- 8.8 Vertical Integration and Outsourcing
- 8.9 Supplier Concentration and Risk
- 8.10 Supply Chain Localization and Resilience
Chapter 9 Global Food and Beverage Protective Cultures Market Regulations and Policies
- 9.1 Relevant Laws, Standards and Compliance Frameworks
- 9.2 Product, Service, Safety and Quality Requirements
- 9.3 Government Policies, Incentives and Subsidies
- 9.4 Imports, Exports and Trade Barriers
- 9.5 Public Procurement and Local Content Requirements
- 9.6 Environmental and Sustainability Compliance
- 9.7 Upcoming Policy Changes and Market Implications
Chapter 10 Global Food and Beverage Protective Cultures Market Hotspots and Opportunities
- 10.1 Market Opportunity Mapping and Growth Hotspots
- 10.2 High-Growth Applications and Customer Groups
- 10.3 Underserved Markets and White-Space Opportunities
- 10.4 Emerging Technology and Product Opportunities
- 10.5 New Capacity and Investment Hotspots
- 10.6 Market Entry and Expansion Opportunities
- 10.7 Distribution and Partnership Opportunities
- 10.8 Near-Term and Long-Term Commercial Potential
- 10.9 Opportunity Attractiveness and Execution Risks
Chapter 11 Global Food and Beverage Protective Cultures Market Outlook, 2025-2035
- 11.1 Market Size and Analysis
- 11.1.1 Revenue (Market Measurement: 2025: USD 386.5 million → 2035: USD 679.2 million)
- 11.1.2 Market Volume and Quantity Sold
- 11.1.3 Historical Market Size, 2018-2025
- 11.1.4 Base-Year Market Size, 2025
- 11.2 Market Forecast, 2025-2035
- 11.2.1 Revenue Forecast to 2035
- 11.2.2 Volume Forecast to 2035
- 11.2.3 CAGR and Year-on-Year Growth
- 11.2.4 Incremental Revenue Opportunity
- 11.3 Forecast Assumptions and Scenario Analysis
- 11.3.1 Base-Case Forecast
- 11.3.2 Optimistic and Conservative Scenarios
- 11.3.3 Technology, Pricing and Policy Sensitivities
- 11.4 Market Attractiveness and Growth Outlook
Chapter 12 Global Food and Beverage Protective Cultures Market Segmentation and Outlook
- 12.1 Segmentation Summary and Market Shares, 2025
- 12.2 Largest and Fastest-Growing Segments
- 12.3 By Application - Market Size and Forecast, 2025-2035
- 12.3.1 Segment Definition and Scope
- 12.3.2 Historical Market Size, 2018-2025
- 12.3.3 Revenue Forecast, 2025-2035
- 12.3.4 Volume Forecast, 2025-2035
- 12.3.5 Base-Year Market Share, 2025
- 12.3.6 Segment CAGR and Growth Drivers
- 12.3.7 Subsegment Market Size and Forecast
- 12.3.7.1 Cheese
- 12.3.7.2 Yogurt
- 12.3.7.3 Meat
- 12.3.7.4 Seafood
- 12.3.7.5 Other Applications
- 12.3.8 Subsegment Pricing and Adoption Trends
- 12.3.9 Leading Suppliers and Competition
- 12.3.10 Regional Demand and Opportunities
- 12.4 By Target Microorganism - Market Size and Forecast, 2025-2035
- 12.4.1 Segment Definition and Scope
- 12.4.2 Historical Market Size, 2018-2025
- 12.4.3 Revenue Forecast, 2025-2035
- 12.4.4 Volume Forecast, 2025-2035
- 12.4.5 Base-Year Market Share, 2025
- 12.4.6 Segment CAGR and Growth Drivers
- 12.4.7 Subsegment Market Size and Forecast
- 12.4.7.1 Yeast and Mold
- 12.4.7.2 Listeria and Pathogenic Bacteria
- 12.4.7.3 Clostridia and Other Spoilage Bacteria
- 12.4.8 Subsegment Pricing and Adoption Trends
- 12.4.9 Leading Suppliers and Competition
- 12.4.10 Regional Demand and Opportunities
- 12.5 By Type - Market Size and Forecast, 2025-2035
- 12.5.1 Segment Definition and Scope
- 12.5.2 Historical Market Size, 2018-2025
- 12.5.3 Revenue Forecast, 2025-2035
- 12.5.4 Volume Forecast, 2025-2035
- 12.5.5 Base-Year Market Share, 2025
- 12.5.6 Segment CAGR and Growth Drivers
- 12.5.7 Subsegment Market Size and Forecast
- 12.5.7.1 Conventional
- 12.5.7.2 Organic
- 12.5.8 Subsegment Pricing and Adoption Trends
- 12.5.9 Leading Suppliers and Competition
- 12.5.10 Regional Demand and Opportunities
- 12.6 Segment Growth Comparison
- 12.7 Segment Attractiveness and Priority Matrix
Chapter 13 Global Food and Beverage Protective Cultures End-Use and Application Market Outlook
- 13.1 End-Use Industry and Customer Demand Structure
- 13.2 Leading Applications and Customer Groups
- 13.3 End-Use Market Size, Share and Forecast
- 13.4 Major End-Use Industry Deep Dives
- 13.4.1 Customer Requirements and Use Cases
- 13.4.2 Demand and Replacement Cycles
- 13.4.3 Technical and Regulatory Considerations
- 13.4.4 Purchasing and Procurement Models
- 13.4.5 Leading Vendors and Distribution Channels
- 13.4.6 Forecast and Commercial Opportunities
- 13.5 Emerging Applications and Cross-Segment Demand
- 13.6 End-Use Industry Investment Priorities
Chapter 14 Global Food and Beverage Protective Cultures Geographic Market Outlook, 2025-2035
- 14.1 Regional Market Size and Share, 2025
- 14.2 Regional Market Forecast, 2025-2035
- 14.3 Regional Pricing, Production and Demand Differences
- 14.4 North America
- 14.4.1 United States
- 14.4.2 Canada
- 14.4.3 Mexico
- 14.5 Europe
- 14.5.1 Germany
- 14.5.2 France
- 14.5.3 Italy
- 14.5.4 United Kingdom
- 14.5.5 Spain
- 14.5.6 Poland
- 14.5.7 Russia
- 14.5.8 Netherlands
- 14.5.9 Belgium
- 14.5.10 Sweden
- 14.5.11 Denmark
- 14.5.12 Norway
- 14.5.13 Rest of Europe
- 14.6 Asia Pacific
- 14.6.1 China
- 14.6.2 India
- 14.6.3 Japan
- 14.6.4 South Korea
- 14.6.5 Thailand
- 14.6.6 Indonesia
- 14.6.7 Vietnam
- 14.6.8 Malaysia
- 14.6.9 Australia
- 14.6.10 Rest of Asia Pacific
- 14.7 Latin America
- 14.7.1 Brazil
- 14.7.2 Argentina
- 14.7.3 Colombia
- 14.7.4 Chile
- 14.7.5 Rest of Latin America
- 14.8 Middle East
- 14.8.1 Saudi Arabia
- 14.8.2 United Arab Emirates
- 14.8.3 Turkey
- 14.8.4 Israel
- 14.8.5 Iran
- 14.8.6 Rest of the Middle East
- 14.9 Africa
- 14.9.1 South Africa
- 14.9.2 Egypt
- 14.9.3 Nigeria
- 14.9.4 Morocco
- 14.9.5 Rest of Africa
- 14.10 Regional Investment, Policy and Supply Chain Differences
- 14.11 Regional Competitive Landscape
- 14.12 Geographic Growth Hotspots
Chapter 15 Global Food and Beverage Protective Cultures Technology, Innovation and Sustainability Outlook
- 15.1 Technology Landscape and Maturity
- 15.2 Product, Process and Service Innovation
- 15.3 AI, Automation and Digital Tools in the Industry
- 15.4 Technology Adoption and Performance Benchmarking
- 15.5 Innovation Pipeline and R&D Investment
- 15.6 Patent and Intellectual Property Trends
- 15.7 Energy Efficiency and Resource Management
- 15.8 Sustainability, Recycling and Circularity
- 15.9 Technology Roadmap, 2025-2035
- 15.10 Risks of Obsolescence and Technology Substitution
Chapter 16 Global Food and Beverage Protective Cultures Market Key Strategic Imperatives
- 16.1 Growth and Market Entry Priorities
- 16.2 High-Return Products and Segments
- 16.3 Pricing, Profitability and Cost Optimization
- 16.4 Technology Investment and Product Differentiation
- 16.5 Supply Chain Localization and Resilience
- 16.6 Distribution and Customer Acquisition
- 16.7 Partnership, Acquisition and Capacity Strategy
- 16.8 Regional Expansion Priorities
- 16.9 Short-, Medium- and Long-Term Actions
Chapter 17 Competition Outlook
- 17.1 Industry Competition Characteristics
- 17.2 Market Structure and Concentration
- 17.3 Market Share and Competitive Positioning, 2025
- 17.4 Company-Wise Revenue and Product Benchmarking
- 17.5 Production and Service Capacity Benchmarking
- 17.6 Technology, Pricing and Differentiation
- 17.7 Regional Footprint and Distribution Strength
- 17.8 Mergers, Acquisitions and Strategic Alliances
- 17.9 New Entrants and Competitive Threats
- 17.10 Porter's Five Forces and Industry Attractiveness
- 17.11 Competitive Outlook, 2025-2035
Chapter 18 Company Profiles
- 18.1 Company Coverage and Selection Criteria
- 18.2 Novonesis A/S (Novozymes and Chr. Hansen)
- 18.2.1 Business Description
- 18.2.2 Company Ownership and Geographic Presence
- 18.2.3 Product and Service Portfolio
- 18.2.4 Manufacturing and Operating Footprint
- 18.2.5 Production Capacity and Expansion Plans
- 18.2.6 Financial Performance and Investment
- 18.2.7 Market Share and Competitive Position
- 18.2.8 Technology and Innovation Capabilities
- 18.2.9 Strategic Alliances or Partnerships
- 18.2.10 Recent Developments
- 18.2.11 Growth Strategy and Outlook
- 18.3 dsm-firmenich
- 18.4 International Flavors & Fragrances Inc. (IFF)
- 18.5 Lallemand Inc. (Lallemand Specialty Cultures)
- 18.6 Sacco S.r.l. (Sacco System)
- 18.7 CSK Food Enrichment B.V.
- 18.8 Bioprox
- 18.9 M Food Group GmbH (Meat Cracks)
- 18.10 Other Relevant Market Participants
Note: Every listed company is profiled on the structure shown under the first company. The company list is preliminary and may change based on research findings, market developments, data availability and client requirements.
Chapter 19 Disclaimer
- 19.1 Research and Forecast Disclaimer
- 19.2 Data Source and Estimation Limitations
Note: The depth of individual sections depends on data availability for this market. Volume, capacity, trade and other unit-based metrics are included where applicable.