
Tall housing and metro work set crane hire demand
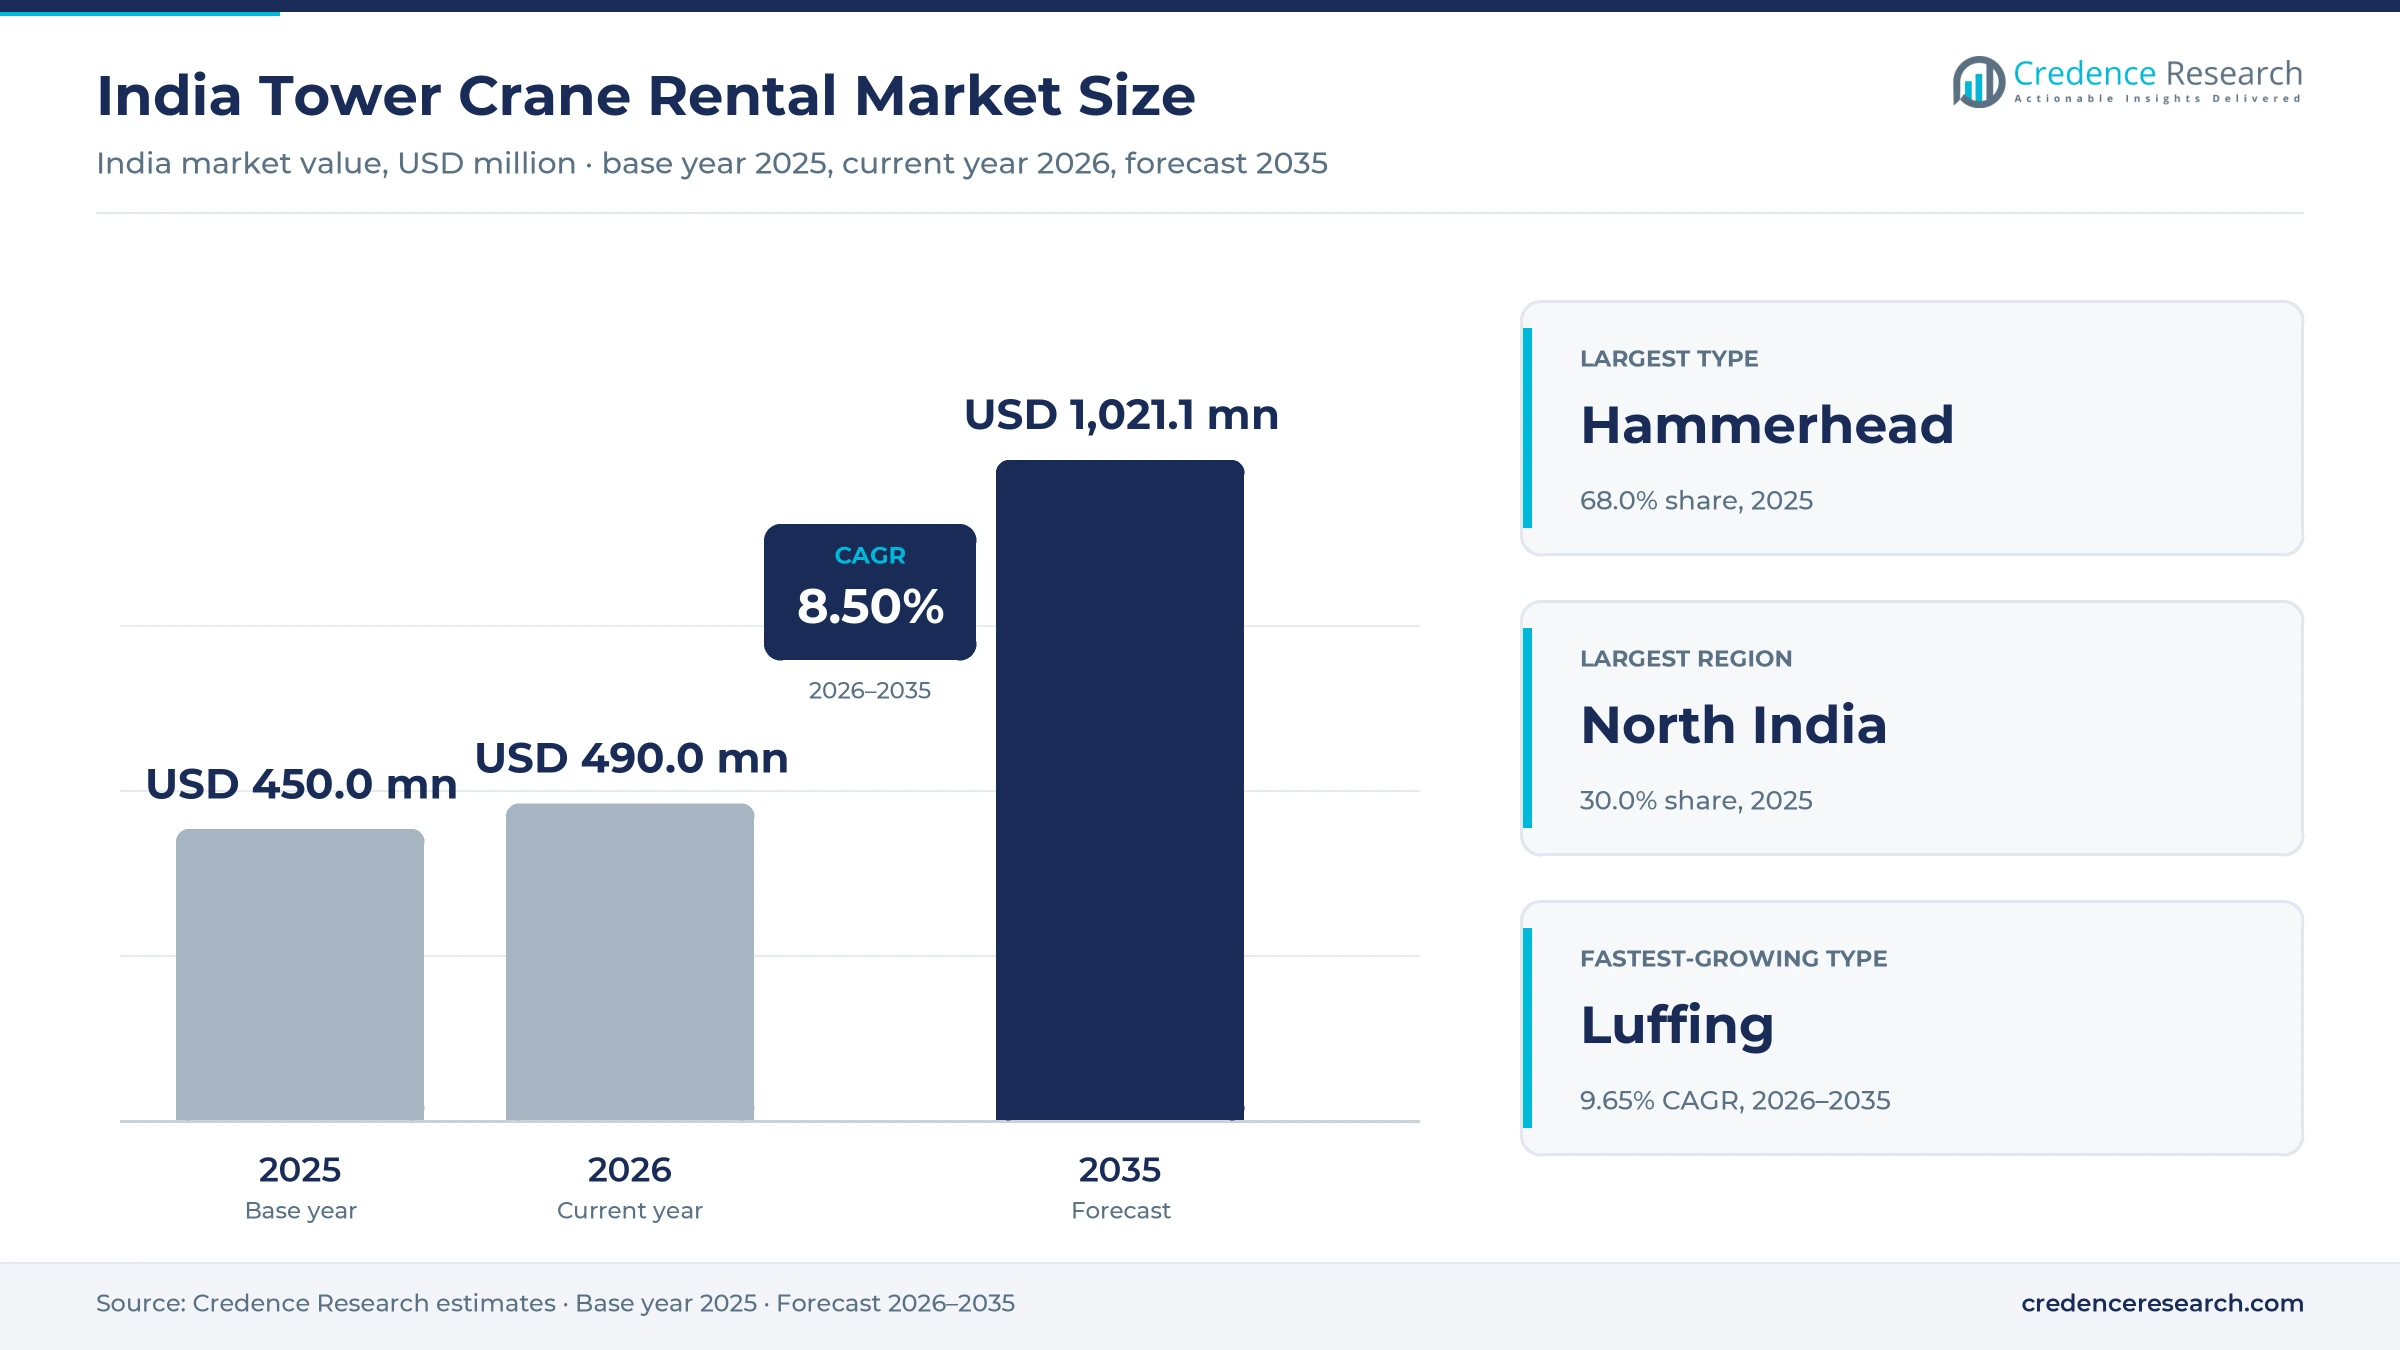
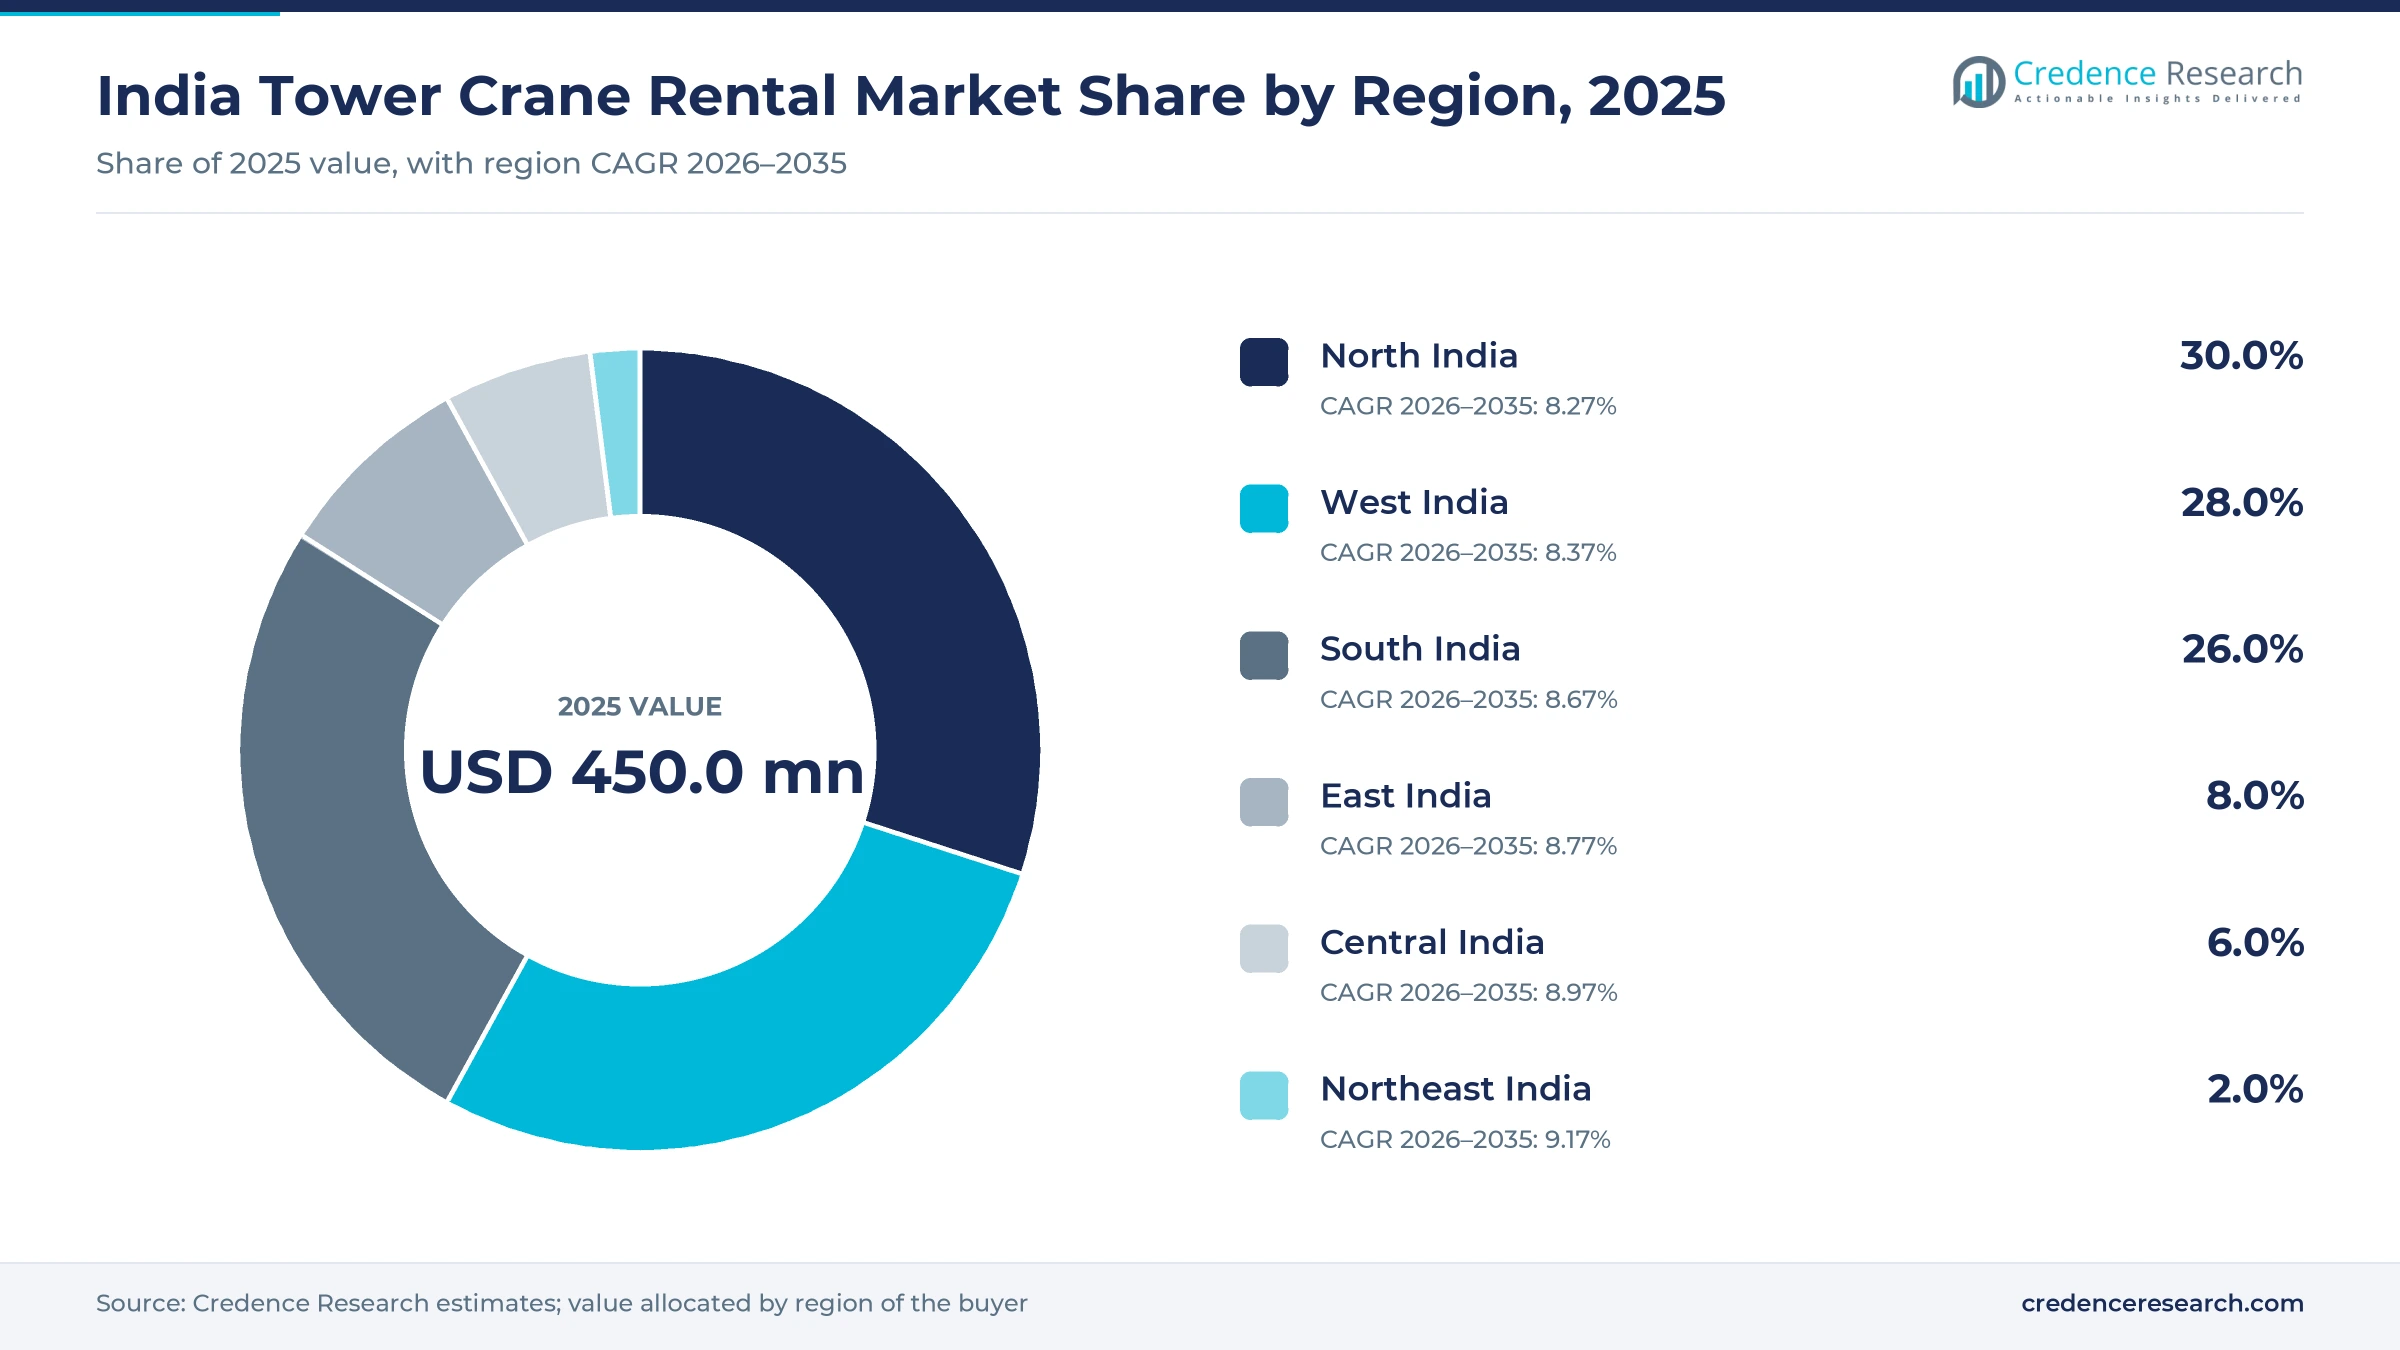
The India tower crane rental market was valued at USD 450.0 million in 2025 and is projected to increase from USD 490.0 million in 2026 to USD 1.02 billion by 2035, registering a CAGR of 8.50% during 2026–2035. Demand comes from tall residential towers, metro corridors and airport and industrial projects whose contractors prefer monthly hire to crane ownership. North India held the largest regional share, 30.0% in 2025, helped by Gurugram towers and Noida International Airport, while West India followed at 28.0% on Mumbai region towers and luffing work. Northeast India is the fastest-growing region at 9.17% a year from a small base. Hammerhead cranes hold 68.0% of value, yet luffing units are growing fastest because tight plots limit jib swing. A major commercial change is India-built supply, with Manitowoc building the 5-ton Potain MCT 105 H5 in Pune and ACE evaluating a new automated tower crane factory.
Which hire charges and site services count toward crane rental value?
Tower crane rental covers the monthly or contract hire of hammerhead, luffing and self-erecting cranes for buildings, infrastructure and metro works. Value counts hire charges and the erection, operator and maintenance services billed with them. Buyers are developers, contractors and engineering firms that want cranes without tying up capital.
The estimate excludes outright crane sales, mobile, crawler and truck crane hire, and spare parts sold separately. Cranes owned by contractors for their own sites are also excluded. The value chain runs from crane makers and dealers through rental fleets to site contractors.
India Tower Crane Rental Market Insights
- India tower crane rental grows from USD 450.0 million in 2025 to USD 1.02 billion by 2035, an 8.50% CAGR across 2026–2035, on tall towers and metro work.
- North India led with 30.0% of 2025 value, ahead of West India at 28.0%, as Gurugram and Mumbai region towers kept cranes on hire.
- High-Rise Housing led end uses with 62.0% of 2025 value, supported by premium homes making up about half of 2025 sales in eight cities.
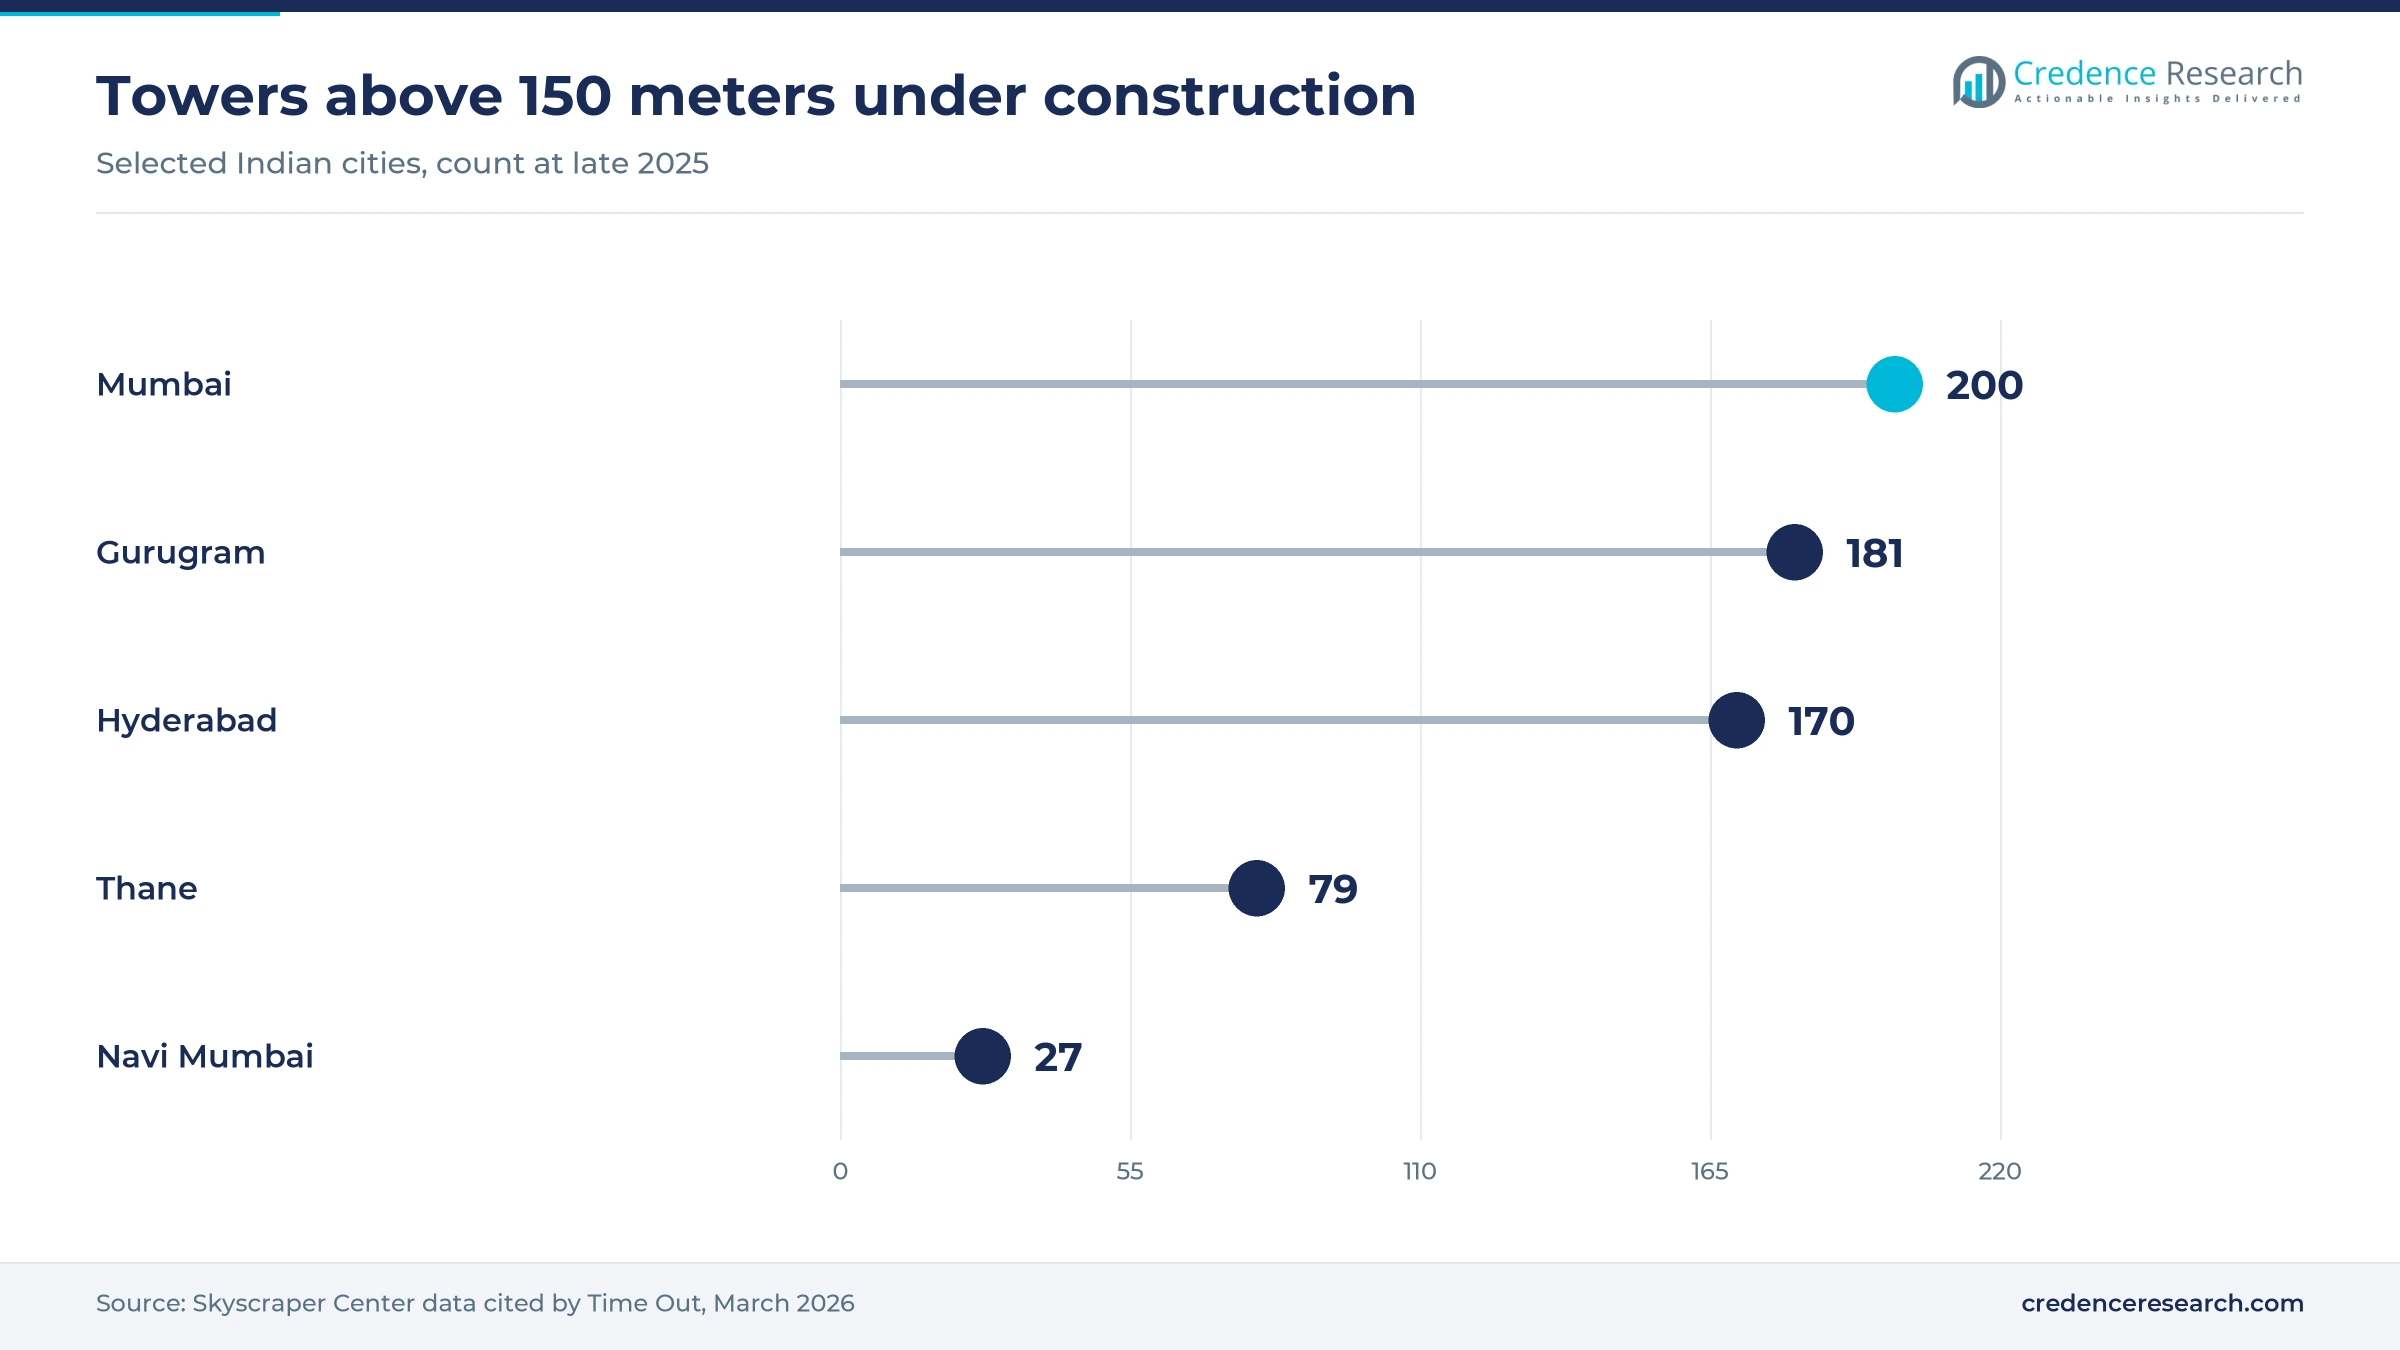
- Mumbai had more than 200 towers above 150 meters under construction at late 2025, and metro lines under construction reached about 998 kilometers by October 2026.
- ACE reported 63% of fixed tower cranes in December 2025, Manitowoc builds Potain units in Pune, and rental fleets compete on capacity and service.
Hammerhead, sub-8-ton and housing work anchor rental value
Why hammerhead cranes lead while luffing units grow fastest
Based on type, the market is categorized into hammerhead, luffing and self-erecting cranes. Hammerhead units led with 68.0% of 2025 value because open housing and infrastructure sites suit long fixed jibs. ACE told Autocar Pro in December 2025 that it holds 63% of fixed tower cranes and supplies many of them. Luffing cranes grow fastest at 9.65% a year as tight urban plots limit jib swing. Crane Briefing reported in January 2024 that a Potain MCH 175 luffer was headed to Shapoorji Pallonji, while Liebherr India showed a 12-metric-ton NC-LH 1255.
Why cranes below 8 tons hold most of the rental base
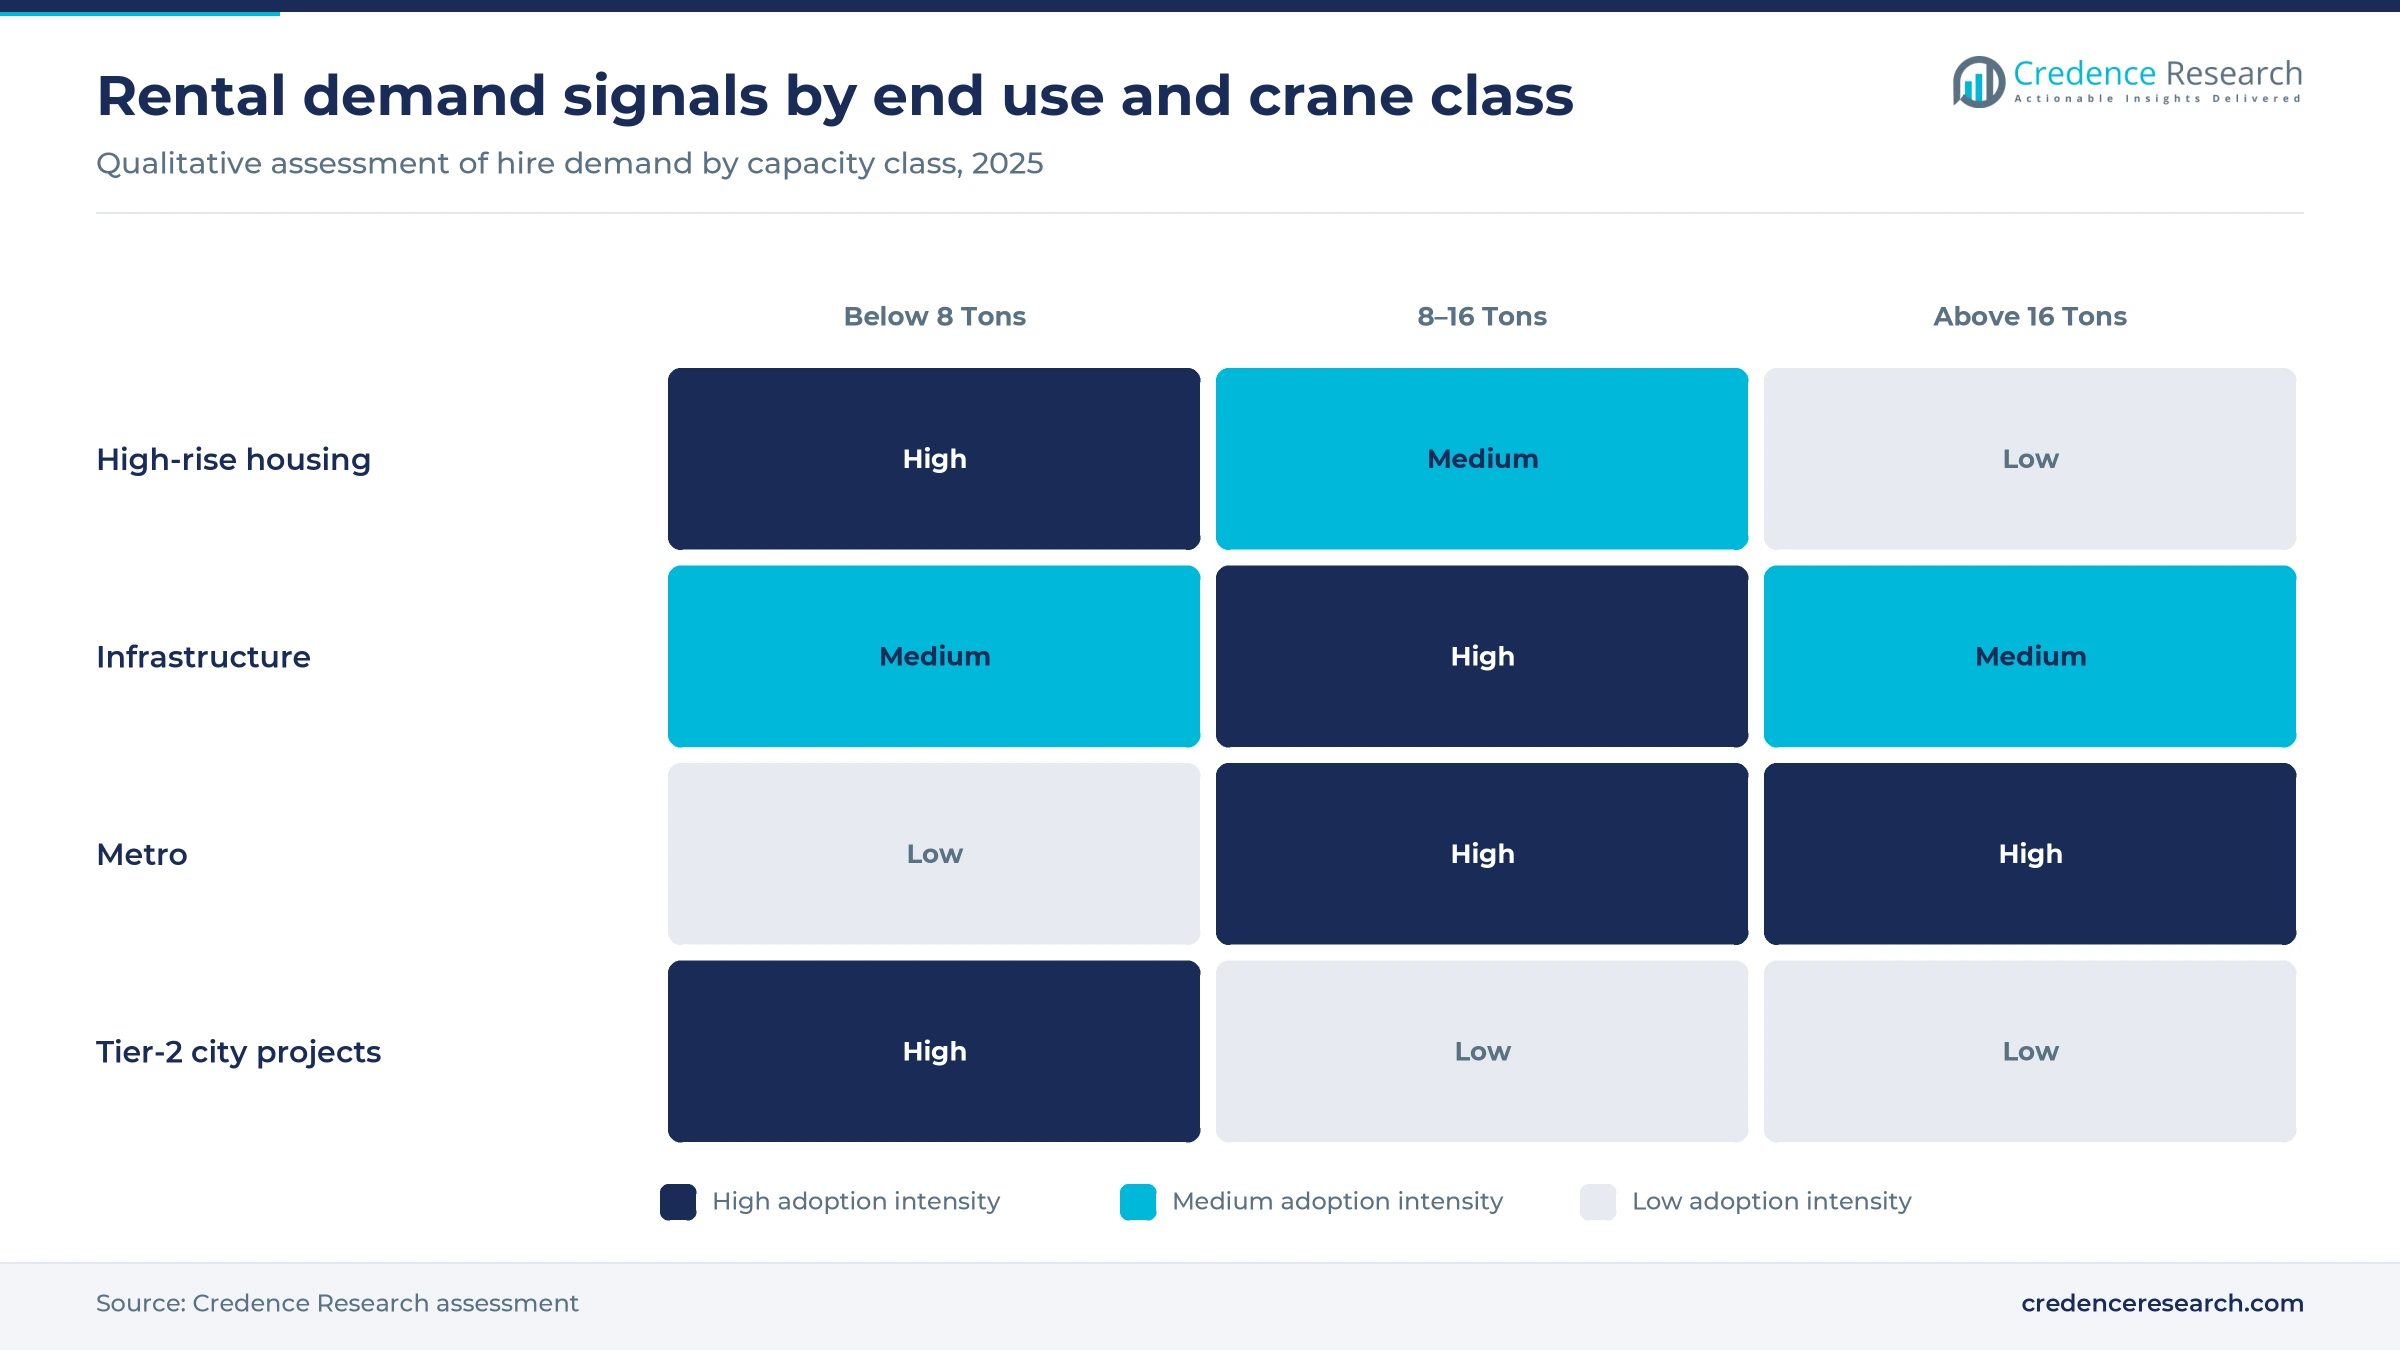
Based on capacity, the market is categorized into below 8 tons, 8–16 tons and above 16 tons. Below 8 Tons cranes led with 58.0% of 2025 value because residential floors need modest hook loads, and five of the nine models in the ACE Rentals table are rated at 6 metric tons or less. Above 16 Tons cranes grow fastest at 9.97% a year as heavy terminal lifts spread. Construction Equipment Guide reported in February 2024 that Tata Projects took Potain MCT 565 A cranes rated at 27.5 tons for Noida International Airport, and ACE Rentals lists a 20-metric-ton TC-7059.
Why high-rise housing leads and metro work grows fastest
Based on end use, the market is categorized into high-rise housing, infrastructure and metro. High-Rise Housing led with 62.0% of 2025 value because premium towers set the pace of crane hire, and Knight Frank India counted 175,091 premium homes sold across eight cities in 2025, about half of all sales. Metro work grows fastest at 9.92% a year as about 998 kilometers of lines were under construction in October 2026, according to Minister of State Tokhan Sahu. Infrastructure keeps a steady base, with Union Budget 2026-27 capital spending set at Rs 12.2 lakh crore.
| Segment Group | Leading Sub-segment | Share, 2025 | Fastest-growing Sub-segment | CAGR, 2026–2035 |
|---|---|---|---|---|
| By Type | Hammerhead | 68.0% | Luffing | 9.65% |
| By Capacity | Below 8 Tons | 58.0% | Above 16 Tons | 9.97% |
| By End Use | High-Rise Housing | 62.0% | Metro | 9.92% |
Request a Free Sample
Fill in your details and we'll send you a free sample report.
- Sample data tables & charts
- Research methodology
Tall projects and asset-light contractors lift hire
Urban high-rise construction raises crane deployment
Tall towers keep a crane on site through most of the structural cycle, so each added project lifts rental days as well as unit count. Skyscraper Center data cited by Time Out in March 2026 put Mumbai first worldwide, with more than 200 buildings above 150 meters under construction at late 2025, followed by Gurugram at 181 and Hyderabad at 170. Thane added more than 79 such towers and Navi Mumbai 27, which widens demand beyond the island city. Anarock data reported by Realty+ in December 2025 showed 126,140 homes launched in the Mumbai region that year. In the Credence Research model this adds about 3.57 percentage points to annual growth to 2035.
Asset-light contractors lean on third-party rental
Contractors that protect working capital leave crane ownership to specialists, which moves spending from purchase to monthly hire. ACE Rentals promotes no capital expenditure or financial liability for customers, along with free site surveys, trained technicians and 24-hour spare parts. Noida International Airport shows the model at scale, since Construction Equipment Guide reported in February 2024 that Tata Projects bought two Potain cranes and rented three more. ACE management said on its Q4 FY26 earnings call that rental companies and end users split its cranes and construction equipment sales about evenly. In the Credence Research model this adds about 2.21 percentage points to annual growth to 2035.
Larger cranes and maintenance packages lift revenue
Billing per crane rises when fleets move above the 5-ton and 6-ton classes and when hire contracts bundle service. ACE Rentals lists 10-, 12-, 16- and 20-metric-ton models with reach to 70 meters, against a 2.5-metric-ton mobile unit at the entry level. Crane Briefing reported in January 2024 that ACE planned upgraded 10-to-16-ton flat-tops and a 25-ton design. ACE Rentals also bundles site planning and single-window operation and maintenance support, which raises billing without adding units. Above 16 Tons cranes grow at 9.97% a year, ahead of the overall market over the same period. In the Credence Research model this adds about 1.45 percentage points to annual growth to 2035.
Public capital spending widens long-duration crane hire
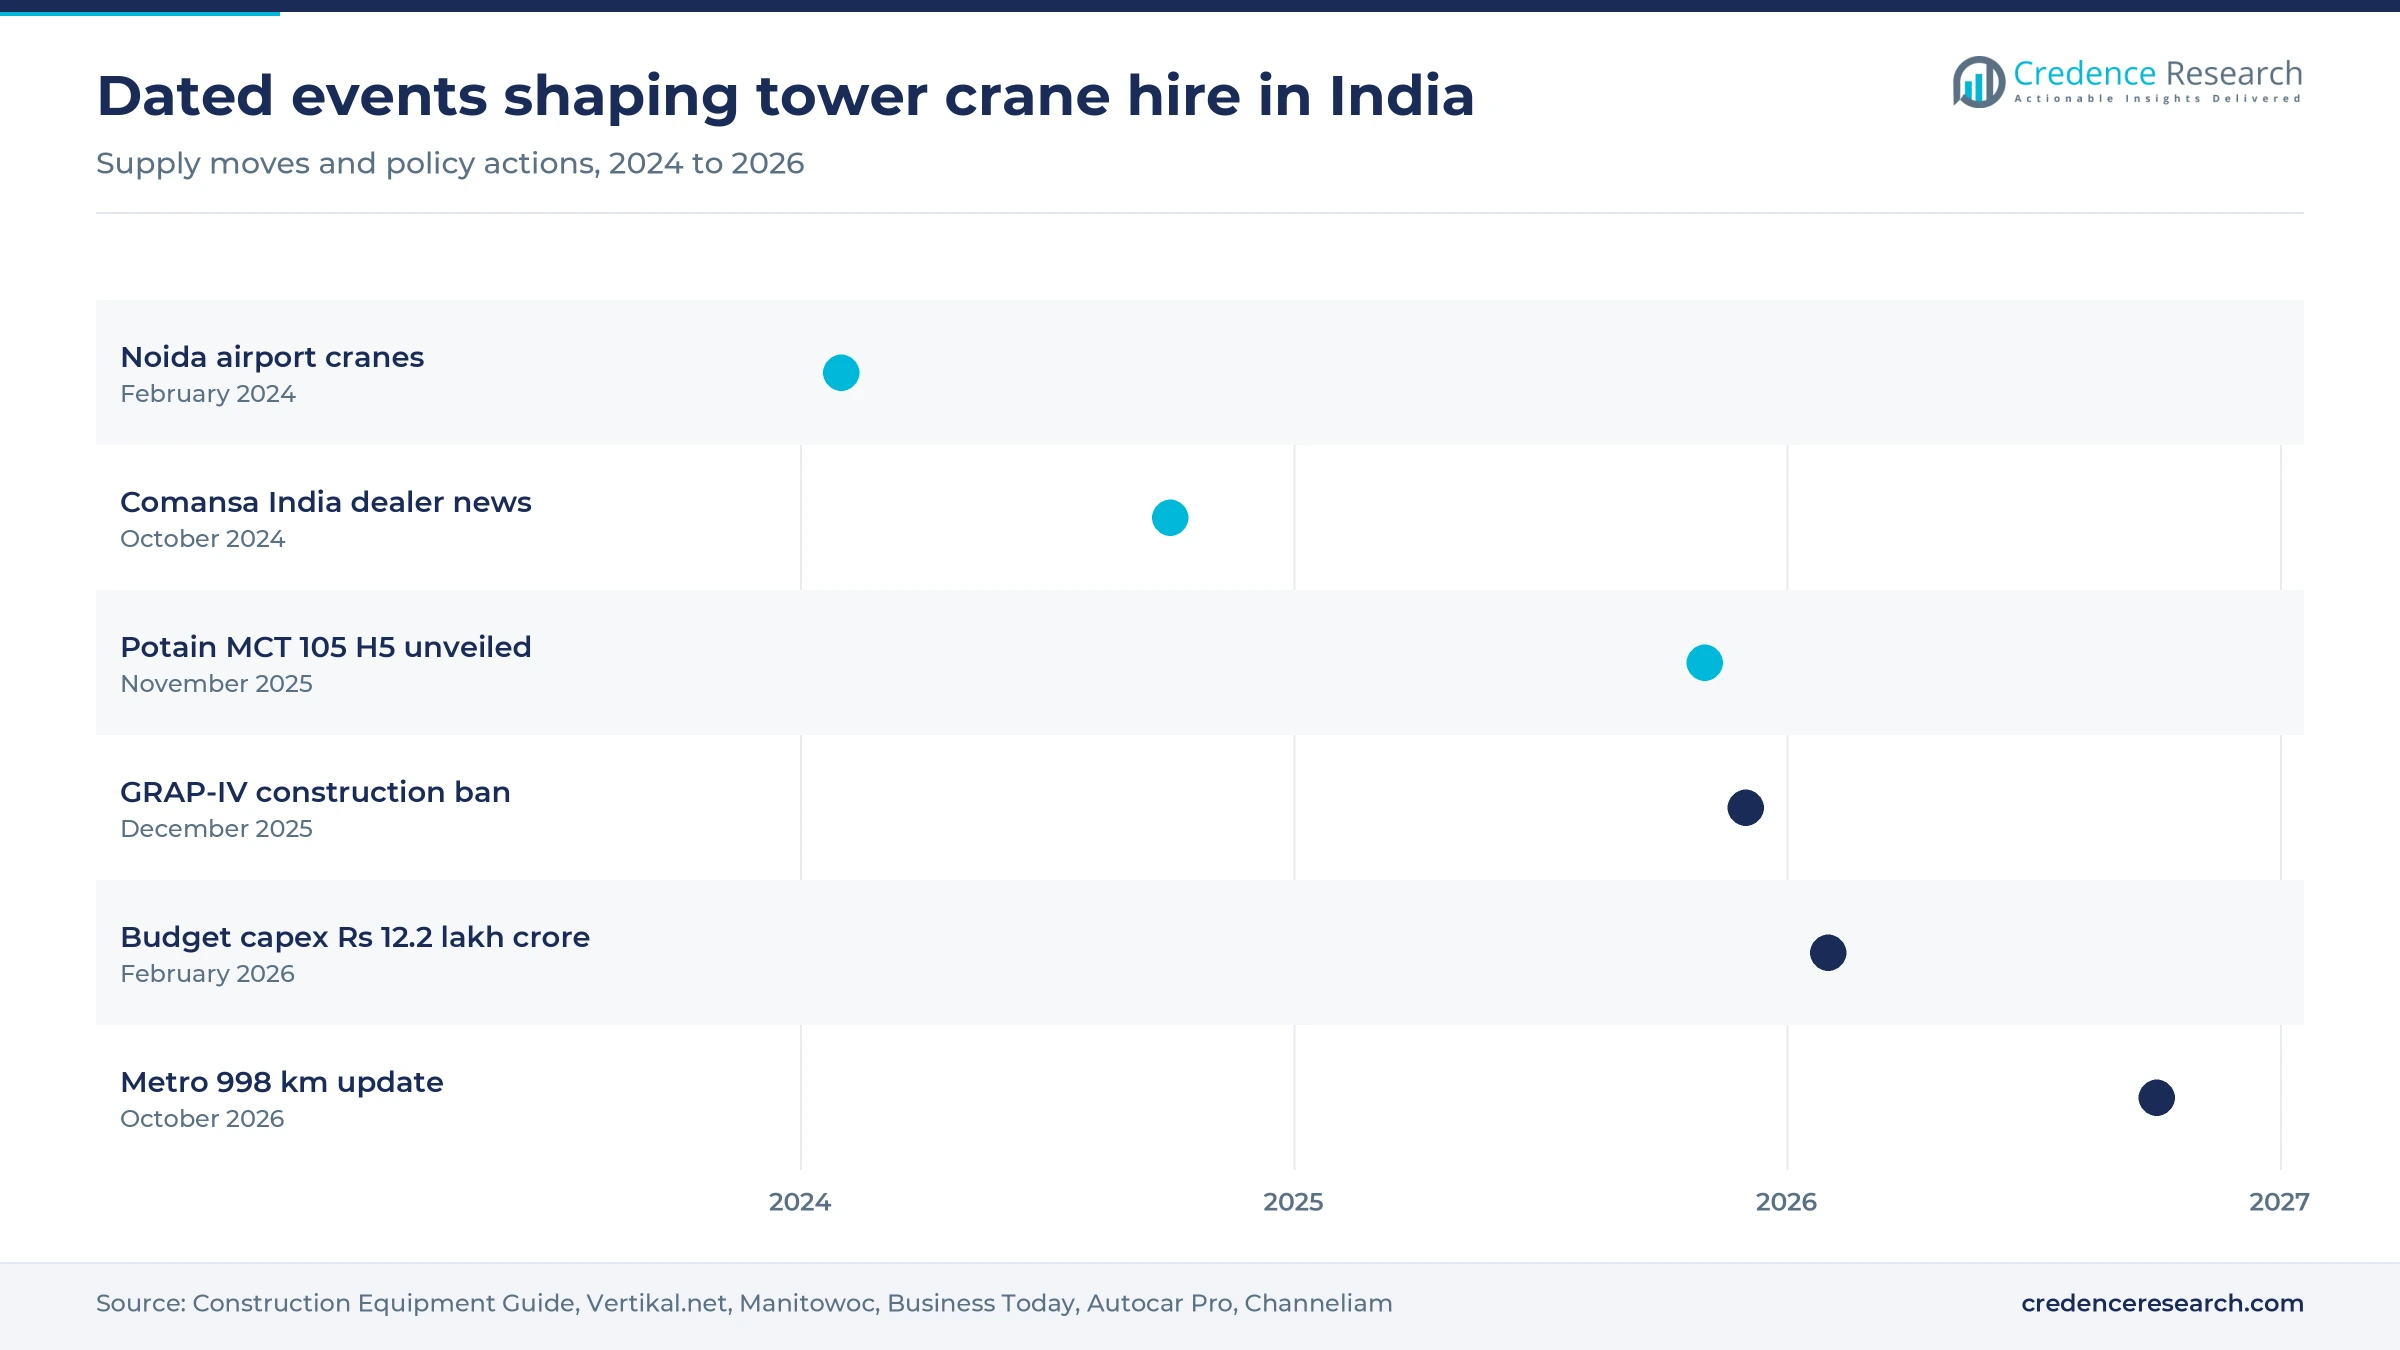
Public works give rental fleets a second demand base that does not depend on housing launches. Union Budget 2026-27 raised capital spending 9% to Rs 12.2 lakh crore, according to Autocar Pro in February 2026, and the metro network passed 1,185 kilometers across 26 cities in October 2026 while about 998 kilometers remained under construction. India's Ministry of Statistics estimated 9.4% real construction growth in 2024-25 in a release that shows the scale of site activity behind crane demand. Sanctions under PMAY-U 2.0 also passed 20 lakh houses in October 2026, according to News On Air. Because stations, terminals and depots run for years, they support long contracts that steady fleet utilization.
Luffing cranes and local supply reshape rental fleets
Shift toward flat-top and luffing cranes on tight sites
Tight plots and neighboring towers are pulling fleet additions toward designs that swing less over adjacent buildings. Crane Briefing reported in January 2024 that Manitowoc secured orders for 15 Potain tower cranes at Excon 2023, with Larsen & Toubro, Tata Projects and Patel Engineering showing interest in its MCH 175 luffer. Liebherr India showed a 12-metric-ton NC-LH 1255 at the same event. ACE then displayed a 60-meter FT 6040 flat-top at Excon 2025, according to Autocar Pro in December 2025. Equipment India has separately reported that luffing cranes are used mainly in Mumbai, and the wider west zone depends on that work. Luffing cranes therefore grow at 9.65% a year to 2035.
Rising local manufacturing reshapes rental fleet supply
Local production gives rental firms a wider choice of machines built close to their sites, and that matters for parts and service. Manitowoc said in November 2025 that its 5-ton Potain MCT 105 H5, with a 60-meter jib, is built in Pune. ACE management said on its Q4 FY26 call that it is evaluating a highly automated tower crane factory costing over Rs 400 crore. ACE also reported on its August 2025 call that quarterly tower crane sales rose from 144 to 167 units. Vertikal.net reported in October 2024 that Mtandt would become exclusive Comansa sales and rental partner for India, Nepal and Bhutan from January 2025, which adds another fleet source.
Opportunity in tier-2 cities through compact crane hire
Smaller cities offer rental firms an opening for compact machines on projects too small to justify a large fixed crane. Autocar Pro reported in February 2026 that the Union Budget allocated Rs 5,000 crore per city economic region over five years, linked to tier-2 and tier-3 cities. ACE told the same publication in December 2025 that it holds 75% to 80% of self-erecting tower cranes. Its 2.5-metric-ton MTC-3625 reaches 36 meters, and ACE told B2B Purchase in February 2017 that this class suits projects of up to 10 to 12 floors, with strong tier-2 demand. Bhopal also opened its first 7.5-kilometer metro section on Dec. 21, 2025, according to UrbanRail.Net.
Opening for heavy cranes in precast and infrastructure
Precast yards and heavy structures give rental firms an opening above 10 tons, a class that the ACE Rentals table extends to 20 metric tons. NBM&CW reported in its Excon 2023 coverage that ACE is upgrading its 10-to-16-ton flat-tops specifically for infrastructure, precast and pre-engineered buildings. Equipment India reported that metro works using precast and special formwork need 10-to-25-metric-ton cranes, and those sites also draw on scaffolding and formwork packages. Autocar Pro said the 2026-27 budget plans seven high-speed rail corridors. Construction Equipment Guide reported in August 2023 that Afcons purchased four Potain MCT 385 cranes for the Pune-Mumbai Missing Link, which shows how much heavy lifting contractors still own and could hire.
Safety, pollution curbs and pricing test fleet returns
Site safety incidents raise compliance costs for fleets
Repeated collapses have put rental fleets and their site crews under closer scrutiny. Free Press Journal reported that a crane being dismantled at a MHADA building in Nagpur fell on Oct. 30, 2026, killing two workers. Prop News Time reported a fatal tower crane fall at Mira Road in July 2026, while Devdiscourse reported one death at the AM/NS India Hazira site on Sept. 29, 2025. Police inquiries can stop work and hold machines on site. As a result, fleet owners must fund inspections, trained erection crews and insurance to keep contracts.
Air quality curbs idle cranes across Delhi and the NCR
Winter pollution rules can stop hired cranes without warning in the largest regional market. Business Today reported that Stage IV of the Graded Response Action Plan was imposed across the NCR on Dec. 13, 2025, bringing a complete construction and demolition ban in Delhi. North India is the largest zone by value, so such halts hurt many fleets at once. Rental firms can respond with clearer standby clauses and by moving uncommitted cranes to other zones.
Softer housing volumes weigh on fleet utilization
Housing supports most rental days, so slower sales can delay new starts. Anarock data reported by Realty+ in December 2025 showed sales across seven cities falling 14% to 395,625 homes, although launches rose 2%. Knight Frank India also counted 509,815 unsold homes at the end of 2025 across eight cities. Developers with stock on hand can slow tower phasing, which lengthens idle periods. Fleets offset this by spreading machines across real estate and public works.
Import pricing and weak equipment sales pressure rates
Cheaper imported machines make it easier for new fleets to enter and undercut hire rates. ACE management said on its August 2025 call that it faces Chinese competition in tower cranes. Autocar Pro reported on Dec. 29, 2025, that proposed anti-dumping duties of about 35% to 40% named truck and crawler cranes, leaving tower cranes unnamed. NBM&CW reported in May 2026 that material handling equipment sales fell about 10% to 15,290 units in FY26. Established fleets can defend pricing by offering newer machines and stronger site service.
North and West India lead as smaller zones grow faster
| Region | Value, 2025 (USD million) | Share, 2025 | CAGR, 2026–2035 |
|---|---|---|---|
| North India | 135.0 | 30.0% | 8.27% |
| West India | 126.0 | 28.0% | 8.37% |
| South India | 117.0 | 26.0% | 8.67% |
| East India | 36.0 | 8.0% | 8.77% |
| Central India | 27.0 | 6.0% | 8.97% |
| Northeast India | 9.0 | 2.0% | 9.17% |
North India leads on Gurugram towers and airport work
North India held 30.0% of 2025 value and grows at 8.27% a year. Gurugram had 181 towers above 150 meters under construction at late 2025, according to Skyscraper Center data, which places it second among the cities listed. Noida International Airport added heavy demand, with Tata Projects renting three Potain MCT 385 A cranes for the terminal. ACE also has its registered base at Palwal in Haryana. However, the zone grows slightly below the national rate because winter pollution bans interrupt site work.
West India relies on Mumbai region towers and luffers
West India held 28.0% of 2025 value and grows at 8.37% a year. Mumbai had more than 200 towers above 150 meters under construction at late 2025, while Thane had more than 79 and Navi Mumbai 27. Anarock data show 126,140 homes launched in the Mumbai region and 67,955 in Pune during 2025. Dense plots favor luffing cranes across much of this zone. Manitowoc and Liebherr both build tower cranes around Pune, which keeps service support close to these fleets.
South India grows on Hyderabad towers and metro phases
South India held 26.0% of 2025 value and grows at 8.67% a year. Hyderabad had 170 towers above 150 meters under construction at late 2025. Anarock data show Bengaluru launches up 5% to 74,260 homes in 2025 and Chennai launches up 30%. Metro work adds steady hire, since a December 2025 Lok Sabha reply cited by Metro Rail Today listed 121.16 kilometers under construction in Karnataka and 119 kilometers in Tamil Nadu. These public jobs help balance the swings seen in housing launches.
East India builds on Kolkata launches and metro bids
East India held 8.0% of 2025 value and grows at 8.77% a year from a smaller base. Anarock data show Kolkata launches up 31% in 2025, although the city sold only 16,125 homes against 127,875 in the Mumbai region. Global Mass Transit reported in August 2026 that Rail Vikas Nigam was inviting bids for 10 elevated stations and a viaduct on the Kolkata Metro expansion. That work suits contract hire because stations and viaducts run in long, planned phases.
Central India gains from new metro and tier-2 work
Central India held 6.0% of 2025 value and grows at 8.97% a year. Bhopal opened its first 7.5-kilometer Orange Line section on Dec. 21, 2025, according to UrbanRail.Net, and its planned network has six lines. Compact and self-erecting machines fit this zone because many projects sit well below the tall towers of the major metros. Mobilization cost and distance from fleet depots therefore shape what contractors pay on these smaller jobs.
Northeast India grows from a small project base
Northeast India held 2.0% of 2025 value and is the fastest-growing zone at 9.17% a year. The base is small and depends more on projects than on residential towers. The Assam Industrial Development Corporation floated a Rs 2,000 crore tender in December 2020 for twin towers with about 3 million square feet at Guwahati. Cement work also uses these machines, as Cranepedia reported a tower crane accident at the Dalmia Cement Umrangso site in August 2024. These isolated jobs mean that hired cranes must often travel long distances to reach sites.
Recent launches and contracts changed crane supply
| Development | Status and market relevance |
|---|---|
| In December 2025, ACE displayed its FT 6040 flat-top tower crane with a 60-meter jib at Excon 2025 in Bengaluru, according to Autocar Pro. | Launched; widens the flat-top choice open to rental buyers |
| In November 2025, Manitowoc said it would show the 5-ton Potain MCT 105 H5, built in Pune with a 60-meter jib, at Excon 2025. | Showcased; adds a locally built topless option |
| In October 2024, Vertikal.net reported that Mtandt would become exclusive Comansa sales and rental partner for India, Nepal and Bhutan from January 2025. | In effect; adds a dealer-backed rental source |
| In February 2024, Construction Equipment Guide reported that Tata Projects bought two and rented three Potain cranes for Noida International Airport. | Reported deployment; shows mixed ownership and hire on a large site |
Crane design shifts widen what fleets can offer
- Topless flat-top cranes suit both large and compact job sites, Manitowoc says of its Pune-built Potain MCT 105 H5, while ACE offers the FT 6040.
- Luffing jibs raise the boom instead of swinging over neighbors, which is why Liebherr India developed the 12-metric-ton NC-LH 1255 for high-rise clusters.
- Inner-climbing cranes rise with the building core, and ACE told B2B Purchase in February 2017 that its 5-ton inner-climbing model reaches 200 meters.
- Variable frequency drive controls appear on heavier machines, and Equipment India reported that Schwing Stetter offers them on its 16-metric-ton model.
Need a Custom Version of This Report?
Tailor the scope, geography, or segments to your exact requirements.
- Custom geography or segment scope
- Direct access to our analyst team
ACE leads as global makers and local fleets compete
Competition combines crane makers that also rent, global brands selling through dealers, and regional hire firms that buy from both. ACE describes itself as the largest tower crane rental company in India and reports 63% of fixed cranes, which gives it both fleet reach and factory supply. Manitowoc builds Potain cranes in Pune and sells to fleets, as it did when rental firm Sai Infraaequipments took the 1,001st Pune-built crane in March 2014. Schwing Stetter focuses on special applications of 10 tons and above, according to Equipment India, while Liebherr India builds from 5-ton units up to a 12-metric-ton luffer. Mtandt added Comansa to its sales and rental offer from January 2025. Tower crane hire also sits beside wider construction equipment hire networks, which compete for the same contractor budgets. Firms compete mainly on machine age, capacity, erection speed and service coverage, while regional fleets can win on local pricing.
Companies profiled and their roles in this market
| Company | Type | Role in the market |
|---|---|---|
| ACE (Action Construction Equipment) | Maker and rental fleet | Rents tower cranes up to 20 metric tons and reports 63% of fixed cranes |
| Potain (Manitowoc) | Maker | Builds tower cranes in Pune and supplies owned and rented units on large projects |
| Schwing Stetter | Maker | Sells Schwing-XCMG tower cranes, including a 16-metric-ton model |
| Liebherr India | Maker | Builds tower cranes in Pune, including the 12-metric-ton NC-LH 1255 luffer |
| Mtandt Group | Dealer and rental partner | Exclusive Comansa sales and rental partner for India, Nepal and Bhutan from January 2025 |
| Sai Infraaequipments | Rental fleet | Indian rental firm that held 11 Potain tower cranes in March 2014 |
Heavier cranes matter more than extra unit count
Credence Research's view is that capacity mix matters more to this market than crane count. A rental firm adding 5-ton machines competes on price with many regional fleets, whereas a firm adding 10-ton and larger cranes competes on engineering and availability. Metro and terminal work also fits long contracts better than phased housing. The firms best placed by 2035 should combine newer machines, safer erection crews and depots in both major and tier-2 cities. Buyers should compare total site cost, including mobilization and standby terms, rather than comparing the monthly rent alone.
Model, estimates and sources behind the hire figures
The report uses 2025 as the base year and 2035 as the forecast year, with growth measured over 2026–2035. Market values come from the Credence Research model for this report. Regional and segment splits and CAGR tilts are Credence Research estimates. Evidence comes from official statistics, ministry statements, company pages, earnings call summaries and trade publications opened during preparation. No interviews or surveys were conducted for this edition of the report.
Metro and tall-tower work shape rental growth to 2035
Rental value is projected to reach USD 1.02 billion by 2035 from USD 490.0 million in 2026, an 8.50% CAGR across 2026–2035. High-rise housing stays the largest source of hire days, although metro and heavier infrastructure jobs should gain share as projects under construction reach structural stages. Compact cranes should spread through tier-2 cities, while luffing machines remain concentrated in dense metros. Tall towers will also lift related demand for elevators and escalators. Rate discipline and safety compliance are the main variables that will decide how much of this growth becomes fleet profit.
Frequently Asked Questions
How big is the India tower crane rental market?
Which region leads India tower crane rental?
Which crane type holds the largest rental share?
Which capacity class grows fastest?
Why do contractors rent tower cranes in India?
How does metro construction affect crane rental demand?
What are the main challenges for rental fleets?
Who are the main companies in this market?
Table of Content
Chapter 1 Market Segmentation
- 1.1 Segmentation Framework
- 1.1.1 Product and Service Classification
- 1.1.2 Application and End-Use Classification
- 1.1.3 Technology and Solution Classification
- 1.1.4 Customer and Distribution Channel Classification
- 1.1.5 Geographic Segmentation
- 1.1.6 Market Segment Definitions and Boundaries
- 1.2 By Type
- 1.2.1 Hammerhead
- 1.2.2 Luffing
- 1.2.3 Self-Erecting
- 1.3 By Capacity
- 1.3.1 Below 8 Tons
- 1.3.2 8–16 Tons
- 1.3.3 Above 16 Tons
- 1.4 By End Use
- 1.4.1 High-Rise Housing
- 1.4.2 Infrastructure
- 1.4.3 Metro
Chapter 2 Introduction
- 2.1 Report Objectives and Scope
- 2.2 Product Definition and Industry Terminology
- 2.3 Market Inclusions and Exclusions
- 2.4 Research Process
- 2.4.1 Primary Research and Expert Interviews
- 2.4.2 Secondary Research and Source Review
- 2.4.3 Top-Down and Bottom-Up Estimation
- 2.4.4 Data Triangulation and Verification
- 2.5 Market Size Measurement Basis
- 2.5.1 2025: USD 450.0 million → 2035: USD 1.02 billion
- 2.6 Historical and Forecast Reference Periods
- 2.6.1 Historical Period: 2018-2025
- 2.6.2 Base Year: 2025
- 2.6.3 Forecast Period: 2025-2035
- 2.7 Research Assumptions and Limitations
Chapter 3 Executive Summary
- 3.1 Market Snapshot and Key Findings
- 3.2 Base-Year Market Size, 2025
- 3.3 Forecast Market Size, 2035
- 3.4 Revenue and Volume Growth Outlook
- 3.5 Key Demand and Supply Indicators
- 3.6 Leading Market Segments
- 3.7 Fastest-Growing Market Opportunities
- 3.8 Regional Performance Highlights
- 3.9 Technology and Industry Transformation
- 3.10 Competitive Landscape Summary
- 3.11 Analyst View and Strategic Implications
Chapter 4 India Tower Crane Rental Market Trends and Developments
- 4.1 Historical Industry Development, 2018-2025
- 4.2 Recent Market Trends and Developments
- 4.3 Demand and Customer Behavior Trends
- 4.4 Technology and Product Innovation
- 4.5 Artificial Intelligence, Automation and Digitalization
- 4.6 Local Manufacturing and Supply Chain Realignment
- 4.7 Industry Partnerships, Mergers and Acquisitions
- 4.8 Sustainability and Circular Economy Developments
- 4.9 Government and Private Sector Investment Trends
- 4.10 Emerging Business Models and Commercialization
- 4.11 Industry Developments and Announcements
Chapter 5 India Tower Crane Rental Market Production, Supply and Demand Analysis
- 5.1 Demand Trend and Consumption Analysis, 2018-2025
- 5.2 Demand Forecast, 2025-2035
- 5.3 Production and Output Trend, 2018-2025
- 5.4 Production and Output Forecast, 2025-2035
- 5.5 Installed Capacity and Capacity Utilization
- 5.6 Company-Wise Production Plants and Statistics
- 5.6.1 Installed Production Capacity
- 5.6.2 Actual Production
- 5.6.3 Planned Capacity and Expansion Targets
- 5.7 Supply Chain Structure and Procurement Trends
- 5.8 Supply-Demand Gap and Bottlenecks
- 5.9 Import Dependence and Sourcing Structure
- 5.10 Contract Manufacturing and Outsourcing
- 5.11 Regional Supply and Demand Concentration
Chapter 6 India Tower Crane Rental Market Pricing Analysis
- 6.1 Pricing Structure and Measurement
- 6.2 Historical Pricing Trends, 2018-2025
- 6.3 Pricing Outlook, 2025-2035
- 6.4 Average Selling Price and Unit Economics
- 6.5 Pricing by Product and Market Segment
- 6.6 Geographic Pricing Differences
- 6.7 Key Input, Energy, Labor and Logistics Costs
- 6.8 Contract Pricing and Purchasing Models
- 6.9 Pricing Sensitivity and Competitive Positioning
- 6.10 Price, Margin and Profitability Implications
Chapter 7 India Tower Crane Rental Market Dynamics
- 7.1 Market Growth Drivers
- 7.1.1 Demand-Side Drivers
- 7.1.2 Technology and Innovation Drivers
- 7.1.3 Infrastructure and Investment Drivers
- 7.1.4 Regulatory and Policy Drivers
- 7.2 Market Restraints
- 7.2.1 Cost and Affordability Constraints
- 7.2.2 Technology and Adoption Barriers
- 7.2.3 Supply Chain and Operational Constraints
- 7.3 Market Challenges
- 7.3.1 Competitive Pressure and Margin Erosion
- 7.3.2 Skills, Infrastructure and Implementation Gaps
- 7.4 Emerging Market Opportunities
- 7.5 Market Dynamics Impact and Time-Horizon Assessment
Chapter 8 India Tower Crane Rental Value Chain Analysis
- 8.1 Industry Value Chain Overview
- 8.2 Upstream Suppliers and Critical Inputs
- 8.3 Technology and Component Providers
- 8.4 Manufacturing or Service Delivery
- 8.5 Distribution, Channel Partners and Integrators
- 8.6 Downstream Applications and End Users
- 8.7 Value Addition and Profit Pools
- 8.8 Vertical Integration and Outsourcing
- 8.9 Supplier Concentration and Risk
- 8.10 Supply Chain Localization and Resilience
Chapter 9 India Tower Crane Rental Market Regulations and Policies
- 9.1 Relevant Laws, Standards and Compliance Frameworks
- 9.2 Product, Service, Safety and Quality Requirements
- 9.3 Government Policies, Incentives and Subsidies
- 9.4 Imports, Exports and Trade Barriers
- 9.5 Public Procurement and Local Content Requirements
- 9.6 Environmental and Sustainability Compliance
- 9.7 Upcoming Policy Changes and Market Implications
Chapter 10 India Tower Crane Rental Market Hotspots and Opportunities
- 10.1 Market Opportunity Mapping and Growth Hotspots
- 10.2 High-Growth Applications and Customer Groups
- 10.3 Underserved Markets and White-Space Opportunities
- 10.4 Emerging Technology and Product Opportunities
- 10.5 New Capacity and Investment Hotspots
- 10.6 Market Entry and Expansion Opportunities
- 10.7 Distribution and Partnership Opportunities
- 10.8 Near-Term and Long-Term Commercial Potential
- 10.9 Opportunity Attractiveness and Execution Risks
Chapter 11 India Tower Crane Rental Market Outlook, 2025-2035
- 11.1 Market Size and Analysis
- 11.1.1 Revenue (Market Measurement: 2025: USD 450.0 million → 2035: USD 1.02 billion)
- 11.1.2 Market Volume and Quantity Sold
- 11.1.3 Historical Market Size, 2018-2025
- 11.1.4 Base-Year Market Size, 2025
- 11.2 Market Forecast, 2025-2035
- 11.2.1 Revenue Forecast to 2035
- 11.2.2 Volume Forecast to 2035
- 11.2.3 CAGR and Year-on-Year Growth
- 11.2.4 Incremental Revenue Opportunity
- 11.3 Forecast Assumptions and Scenario Analysis
- 11.3.1 Base-Case Forecast
- 11.3.2 Optimistic and Conservative Scenarios
- 11.3.3 Technology, Pricing and Policy Sensitivities
- 11.4 Market Attractiveness and Growth Outlook
Chapter 12 India Tower Crane Rental Market Segmentation and Outlook
- 12.1 Segmentation Summary and Market Shares, 2025
- 12.2 Largest and Fastest-Growing Segments
- 12.3 By Type - Market Size and Forecast, 2025-2035
- 12.3.1 Segment Definition and Scope
- 12.3.2 Historical Market Size, 2018-2025
- 12.3.3 Revenue Forecast, 2025-2035
- 12.3.4 Volume Forecast, 2025-2035
- 12.3.5 Base-Year Market Share, 2025
- 12.3.6 Segment CAGR and Growth Drivers
- 12.3.7 Subsegment Market Size and Forecast
- 12.3.7.1 Hammerhead
- 12.3.7.2 Luffing
- 12.3.7.3 Self-Erecting
- 12.3.8 Subsegment Pricing and Adoption Trends
- 12.3.9 Leading Suppliers and Competition
- 12.3.10 Regional Demand and Opportunities
- 12.4 By Capacity - Market Size and Forecast, 2025-2035
- 12.4.1 Segment Definition and Scope
- 12.4.2 Historical Market Size, 2018-2025
- 12.4.3 Revenue Forecast, 2025-2035
- 12.4.4 Volume Forecast, 2025-2035
- 12.4.5 Base-Year Market Share, 2025
- 12.4.6 Segment CAGR and Growth Drivers
- 12.4.7 Subsegment Market Size and Forecast
- 12.4.7.1 Below 8 Tons
- 12.4.7.2 8–16 Tons
- 12.4.7.3 Above 16 Tons
- 12.4.8 Subsegment Pricing and Adoption Trends
- 12.4.9 Leading Suppliers and Competition
- 12.4.10 Regional Demand and Opportunities
- 12.5 By End Use - Market Size and Forecast, 2025-2035
- 12.5.1 Segment Definition and Scope
- 12.5.2 Historical Market Size, 2018-2025
- 12.5.3 Revenue Forecast, 2025-2035
- 12.5.4 Volume Forecast, 2025-2035
- 12.5.5 Base-Year Market Share, 2025
- 12.5.6 Segment CAGR and Growth Drivers
- 12.5.7 Subsegment Market Size and Forecast
- 12.5.7.1 High-Rise Housing
- 12.5.7.2 Infrastructure
- 12.5.7.3 Metro
- 12.5.8 Subsegment Pricing and Adoption Trends
- 12.5.9 Leading Suppliers and Competition
- 12.5.10 Regional Demand and Opportunities
- 12.6 Segment Growth Comparison
- 12.7 Segment Attractiveness and Priority Matrix
Chapter 13 India Tower Crane Rental End-Use and Application Market Outlook
- 13.1 End-Use Industry and Customer Demand Structure
- 13.2 Leading Applications and Customer Groups
- 13.3 End-Use Market Size, Share and Forecast
- 13.4 Major End-Use Industry Deep Dives
- 13.4.1 Customer Requirements and Use Cases
- 13.4.2 Demand and Replacement Cycles
- 13.4.3 Technical and Regulatory Considerations
- 13.4.4 Purchasing and Procurement Models
- 13.4.5 Leading Vendors and Distribution Channels
- 13.4.6 Forecast and Commercial Opportunities
- 13.5 Emerging Applications and Cross-Segment Demand
- 13.6 End-Use Industry Investment Priorities
Chapter 14 India Tower Crane Rental Geographic Market Outlook, 2025-2035
- 14.1 Domestic Market Distribution and Demand Clusters
- 14.2 State- or Province-Wise Market Size and Forecast, 2025-2035
- 14.3 City and Metropolitan Market Outlook
- 14.4 Industrial, Manufacturing and Commercial Clusters
- 14.5 Geographic Concentration of Key End Users
- 14.6 Local Pricing and Purchasing Differences
- 14.7 Domestic Production Facilities and Capacity Map
- 14.8 Local Infrastructure and Project Pipeline
- 14.9 State-Level Policy and Incentive Differences
- 14.10 Subnational Investment Hotspots and Opportunities
- 14.11 Distribution and Logistics Networks
- 14.12 Domestic Competitive Footprint
Chapter 15 India Tower Crane Rental Technology, Innovation and Sustainability Outlook
- 15.1 Technology Landscape and Maturity
- 15.2 Product, Process and Service Innovation
- 15.3 AI, Automation and Digital Tools in the Industry
- 15.4 Technology Adoption and Performance Benchmarking
- 15.5 Innovation Pipeline and R&D Investment
- 15.6 Patent and Intellectual Property Trends
- 15.7 Energy Efficiency and Resource Management
- 15.8 Sustainability, Recycling and Circularity
- 15.9 Technology Roadmap, 2025-2035
- 15.10 Risks of Obsolescence and Technology Substitution
Chapter 16 India Tower Crane Rental Market Key Strategic Imperatives
- 16.1 Growth and Market Entry Priorities
- 16.2 High-Return Products and Segments
- 16.3 Pricing, Profitability and Cost Optimization
- 16.4 Technology Investment and Product Differentiation
- 16.5 Supply Chain Localization and Resilience
- 16.6 Distribution and Customer Acquisition
- 16.7 Partnership, Acquisition and Capacity Strategy
- 16.8 Regional Expansion Priorities
- 16.9 Short-, Medium- and Long-Term Actions
Chapter 17 Competition Outlook
- 17.1 Industry Competition Characteristics
- 17.2 Market Structure and Concentration
- 17.3 Market Share and Competitive Positioning, 2025
- 17.4 Company-Wise Revenue and Product Benchmarking
- 17.5 Production and Service Capacity Benchmarking
- 17.6 Technology, Pricing and Differentiation
- 17.7 Regional Footprint and Distribution Strength
- 17.8 Mergers, Acquisitions and Strategic Alliances
- 17.9 New Entrants and Competitive Threats
- 17.10 Porter's Five Forces and Industry Attractiveness
- 17.11 Competitive Outlook, 2025-2035
Chapter 18 Company Profiles
- 18.1 Company Coverage and Selection Criteria
- 18.2 ACE (Action Construction Equipment)
- 18.2.1 Business Description
- 18.2.2 Company Ownership and Geographic Presence
- 18.2.3 Product and Service Portfolio
- 18.2.4 Manufacturing and Operating Footprint
- 18.2.5 Production Capacity and Expansion Plans
- 18.2.6 Financial Performance and Investment
- 18.2.7 Market Share and Competitive Position
- 18.2.8 Technology and Innovation Capabilities
- 18.2.9 Strategic Alliances or Partnerships
- 18.2.10 Recent Developments
- 18.2.11 Growth Strategy and Outlook
- 18.3 Potain (Manitowoc)
- 18.4 Schwing Stetter
- 18.5 Liebherr India
- 18.6 Mtandt Group
- 18.7 Sai Infraaequipments
- 18.8 Regional rental firms
- 18.9 Other Relevant Market Participants
Note: Every listed company is profiled on the structure shown under the first company. The company list is preliminary and may change based on research findings, market developments, data availability and client requirements.
Chapter 19 Disclaimer
- 19.1 Research and Forecast Disclaimer
- 19.2 Data Source and Estimation Limitations
Note: The depth of individual sections depends on data availability for this market. Volume, capacity, trade and other unit-based metrics are included where applicable.

