Claim costs push payers toward remote nurse case work
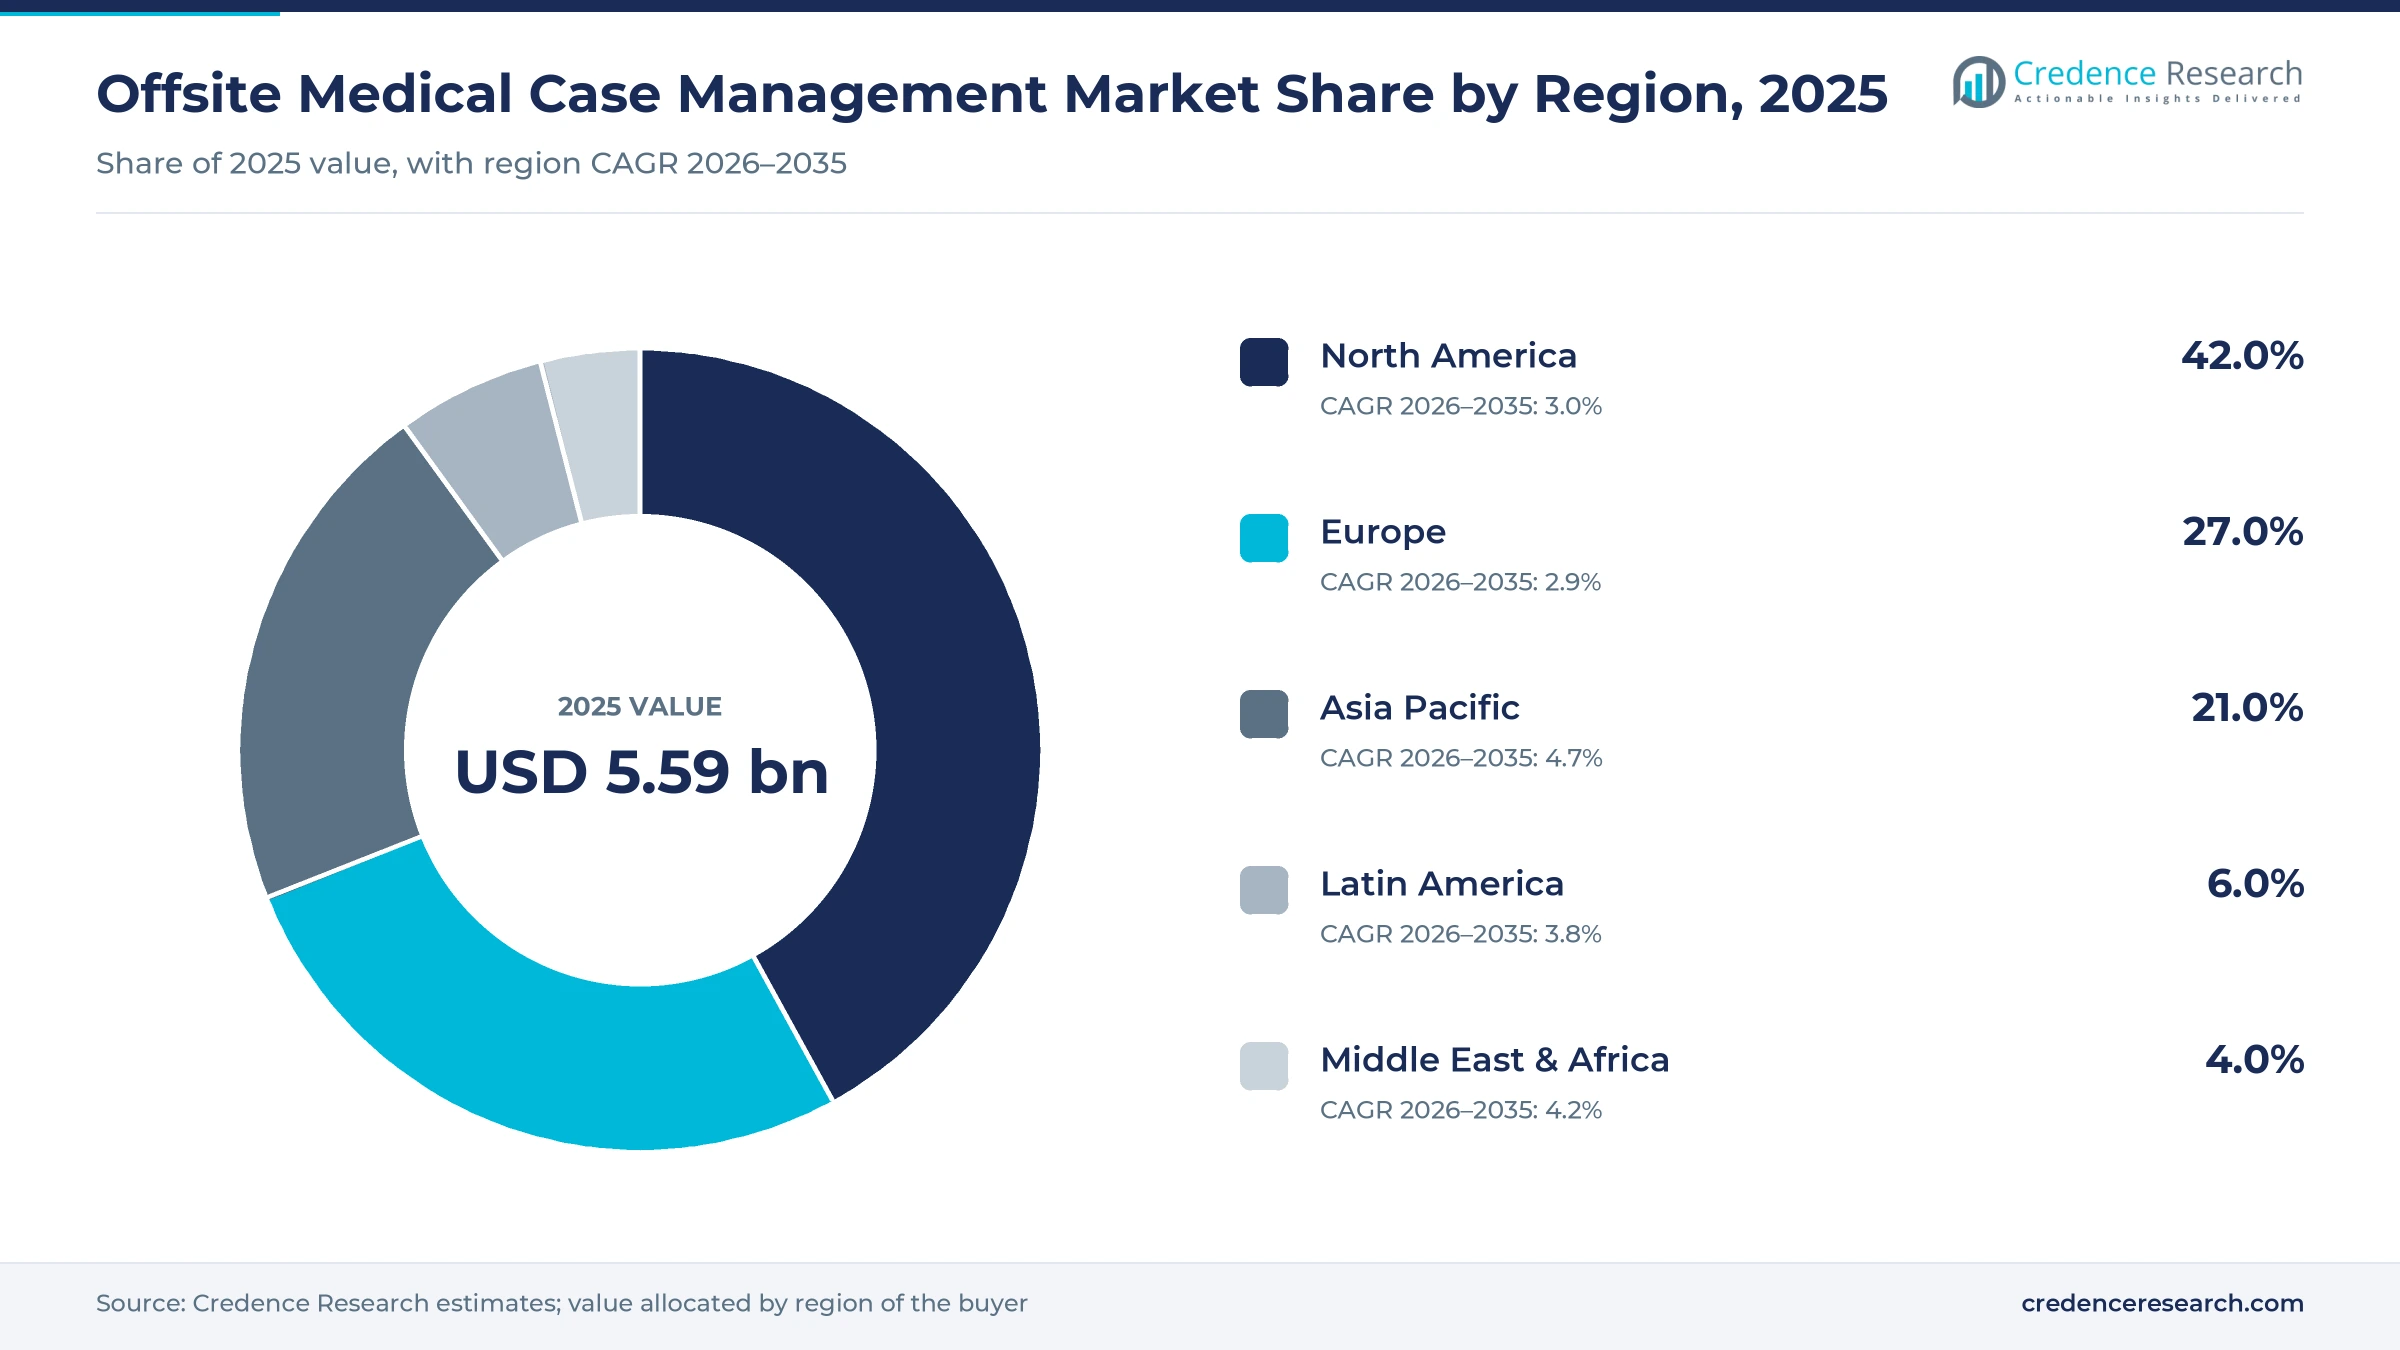
The global offsite medical case management market was valued at USD 5.59 billion in 2025 and is projected to increase from USD 5.79 billion in 2026 to USD 7.83 billion by 2035, registering a CAGR of 3.42% during 2026–2035. Demand comes from workers compensation carriers, third-party administrators, disability insurers and self-insured employers that pay registered nurses and rehabilitation specialists to coordinate treatment and return to work by telephone and secure web portals instead of in-person field visits. North America held the largest regional share, 42.0% in 2025, because U.S. injury and disability programs buy remote nurse case work at scale. Asia Pacific is the fastest-growing region at 4.7% a year, as aging populations in Japan and longer mental health claims in Australia widen the need for remote coordination. The main commercial change is AI triage built into claims platforms, which lets vendors route only high-risk claims to nurses, while the limited supply of credentialed case managers caps how fast providers can add capacity.
Which services make up offsite medical case work?
The estimate counts fees paid for telephonic nurse case management, web-based case management delivered through portals and secure messaging, and remote coordination of catastrophic, disability and chronic pain claims. Buyers usually purchase these services by the hour, per referral or under a program fee bundled with bill review and utilization review.
Field case management with in-person visits, claims administration fees, standalone software licenses and treatment costs are excluded. The value chain runs from payers and employers that refer claims, through vendors that employ nurses and vocational specialists, to treating clinicians whose care plans the case manager coordinates.

Offsite Medical Case Management Market Insights
- The market is valued at USD 5.59 billion in 2025 and should reach USD 7.83 billion by 2035 at a 3.42% CAGR as payers move nurse work to phone and web.
- North America held 42.0% of 2025 value because U.S. workers compensation and disability programs are the largest buyers of telephonic nurse case management.
- Telephonic Case Management Services led service types with 58.0% in 2025, as carriers still buy early-intervention nurse time by the hour.
- In April 2026, CorVel launched CorVel Connected inside its CareMC platform, showing how AI triage is moving into everyday claim and case workflows.
- Paradigm signed a definitive agreement in February 2026 to be acquired by Patient Square Capital, pointing to continued investor interest in complex care management.
Telephonic work and catastrophic cases hold most value
Why does telephonic work still lead service types?
Based on service type, the market is categorized into telephonic case management services and web-based case management services. Telephonic Case Management Services led with 58.0% of 2025 value because carriers and administrators still buy early-intervention nurse calls as a defined program, and Enlyte says its telephonic program reduces disability durations by 39%. Web-Based Case Management Services grow fastest at 4.3% a year as claims platforms add AI summaries and predictive routing, which CorVel built into CareMC with CorVel Connected in April 2026. Portal-based work lowers cost per case, although injured workers with complex needs still expect a nurse on the phone.
Catastrophic claims carry the highest value per case
Based on case type, the market is categorized into catastrophic case management, long-term disability, short-term disability, chronic pain management and others. Catastrophic Case Management led with 30.0% of 2025 value because brain, spinal and burn injury claims can run for years and need specialist coordination, and HCML moved 40 specialist case managers into its U.K. business when it acquired ILS in April 2025. Short-Term Disability grows fastest at 4.3% a year as employers formalize leave, and Sedgwick predicted in January 2026 that mandatory paid family and medical leave could reach 17 U.S. states within two years.
Carriers and administrators control most referrals
Based on end user, the market is categorized into insurance carriers and TPAs, self-insured employers, healthcare providers and home care, and government programs and others. Insurance Carriers and TPAs led with 48.0% of 2025 value because insurers decide which claims get a nurse, and NASI data show private insurers paid 55.6% of U.S. workers compensation benefits in 2023. Healthcare Providers and Home Care grow fastest at 4.4% a year as Medicare pays for remote care coordination, and CMS added three optional add-on codes to advanced primary care management from Jan. 1, 2026. Practices that already run remote patient monitoring add this work most easily.
| Segment Group | Leading Sub-segment | Share, 2025 | Fastest-growing Sub-segment | CAGR, 2026–2035 |
|---|---|---|---|---|
| By Service Type | Telephonic Case Management Services | 58.0% | Web-Based Case Management Services | 4.3% |
| By Case Type | Catastrophic Case Management | 30.0% | Short-Term Disability | 4.3% |
| By End User | Insurance Carriers and TPAs | 48.0% | Healthcare Providers and Home Care | 4.4% |
Hourly nurse rates set the price floor for remote case work
Most payers buy offsite case work by the nurse hour, so labor cost sets the price floor and vendors compete on how many hours a case needs rather than on the rate itself. North Carolina pays the same hourly rate for telephonic and field work, which means remote delivery saves travel time and mileage rather than unit price. Provider-side care management follows Medicare monthly codes instead, which cap what clinics can spend on outsourced coordinators. Vendors that cut hours per case through AI triage keep more margin per hour billed, while buyers gain leverage when outcome data let them compare programs directly.
| Service or code | Typical price or fee | Basis |
|---|---|---|
| Telephonic nurse case management, North Carolina state program | USD 88-91 per hour | North Carolina OSHR vendor pricing, effective July 2026 |
| Field nurse case management, same program | USD 88-91 per hour | North Carolina OSHR vendor pricing, effective July 2026 |
| Medicare chronic care management, CPT 99490 | About USD 66 per patient per month | ThoroughCare summary of 2026 national averages |
| Medicare complex chronic care management, CPT 99487 | About USD 144 per patient per month | ThoroughCare summary of 2026 national averages |
Request a Free Sample
Fill in your details and we'll send you a free sample report.
- Sample data tables & charts
- Research methodology
Medical severity and long absences lift referrals
Rising medical severity makes nurse oversight pay back
Payers refer more claims to remote nurses when medical costs per claim climb faster than prices, because utilization is the part of cost a case manager can influence. According to the National Council on Compensation Insurance State of the Line report of May 2026, as summarized by Lockton, medical severity rose 4% for accident year 2025 against a 1.8% rise in its medical price index, and NCCI attributed the gap mainly to higher utilization. The same report put the private carrier accident-year combined ratio at 97, up from 92 a year earlier. California approved a 6.6% pure premium increase effective Sept. 1, 2026. Carriers facing those numbers favor programs that cut treatment days, which benefits vendors with proven early-referral models.
A large U.S. benefit pool keeps referrals steady
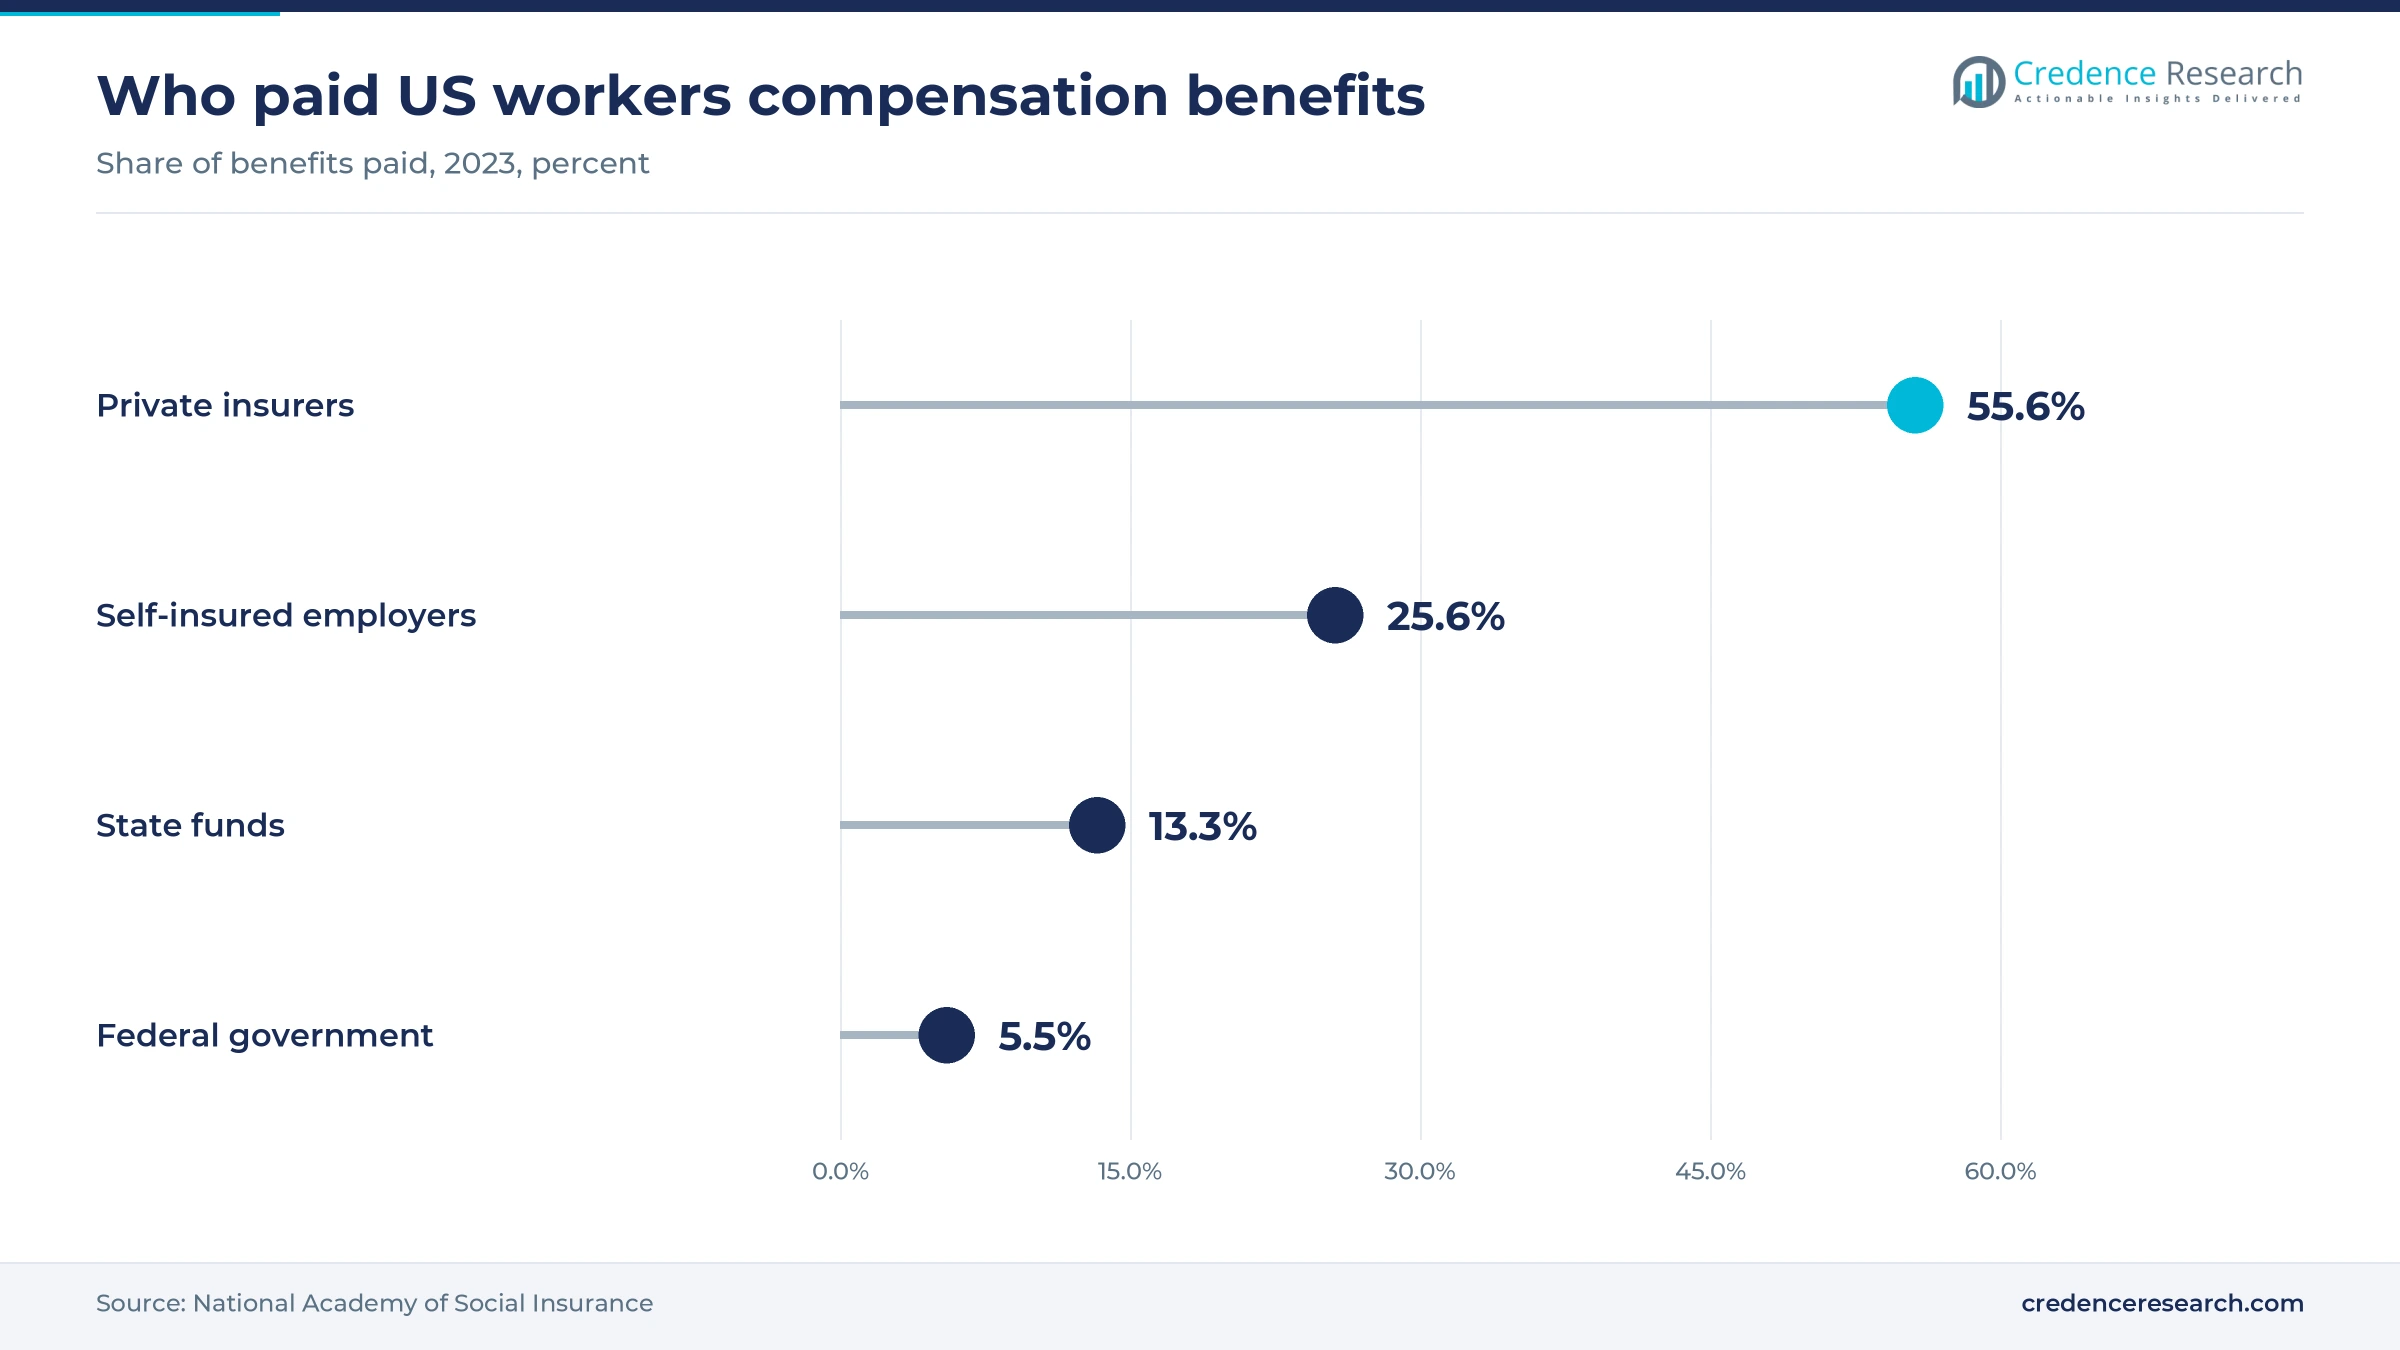
The size of U.S. injury spending gives offsite programs a deep, recurring referral base that few other countries match. The National Academy of Social Insurance reported in August 2026 that U.S. workers compensation paid $64.1 billion in benefits in 2023, with medical care accounting for more than 47% of the total. Those programs covered nearly 150 million jobs, so even a small referral rate produces steady case volume for telephonic vendors. Self-insured employers paid 25.6% of those benefits, a share large enough to support direct vendor contracts and steady demand. Buyers with large self-administered programs gain scale discounts, while vendors depend heavily on a single country and its state-level rules.
Mental health absences stretch claim durations
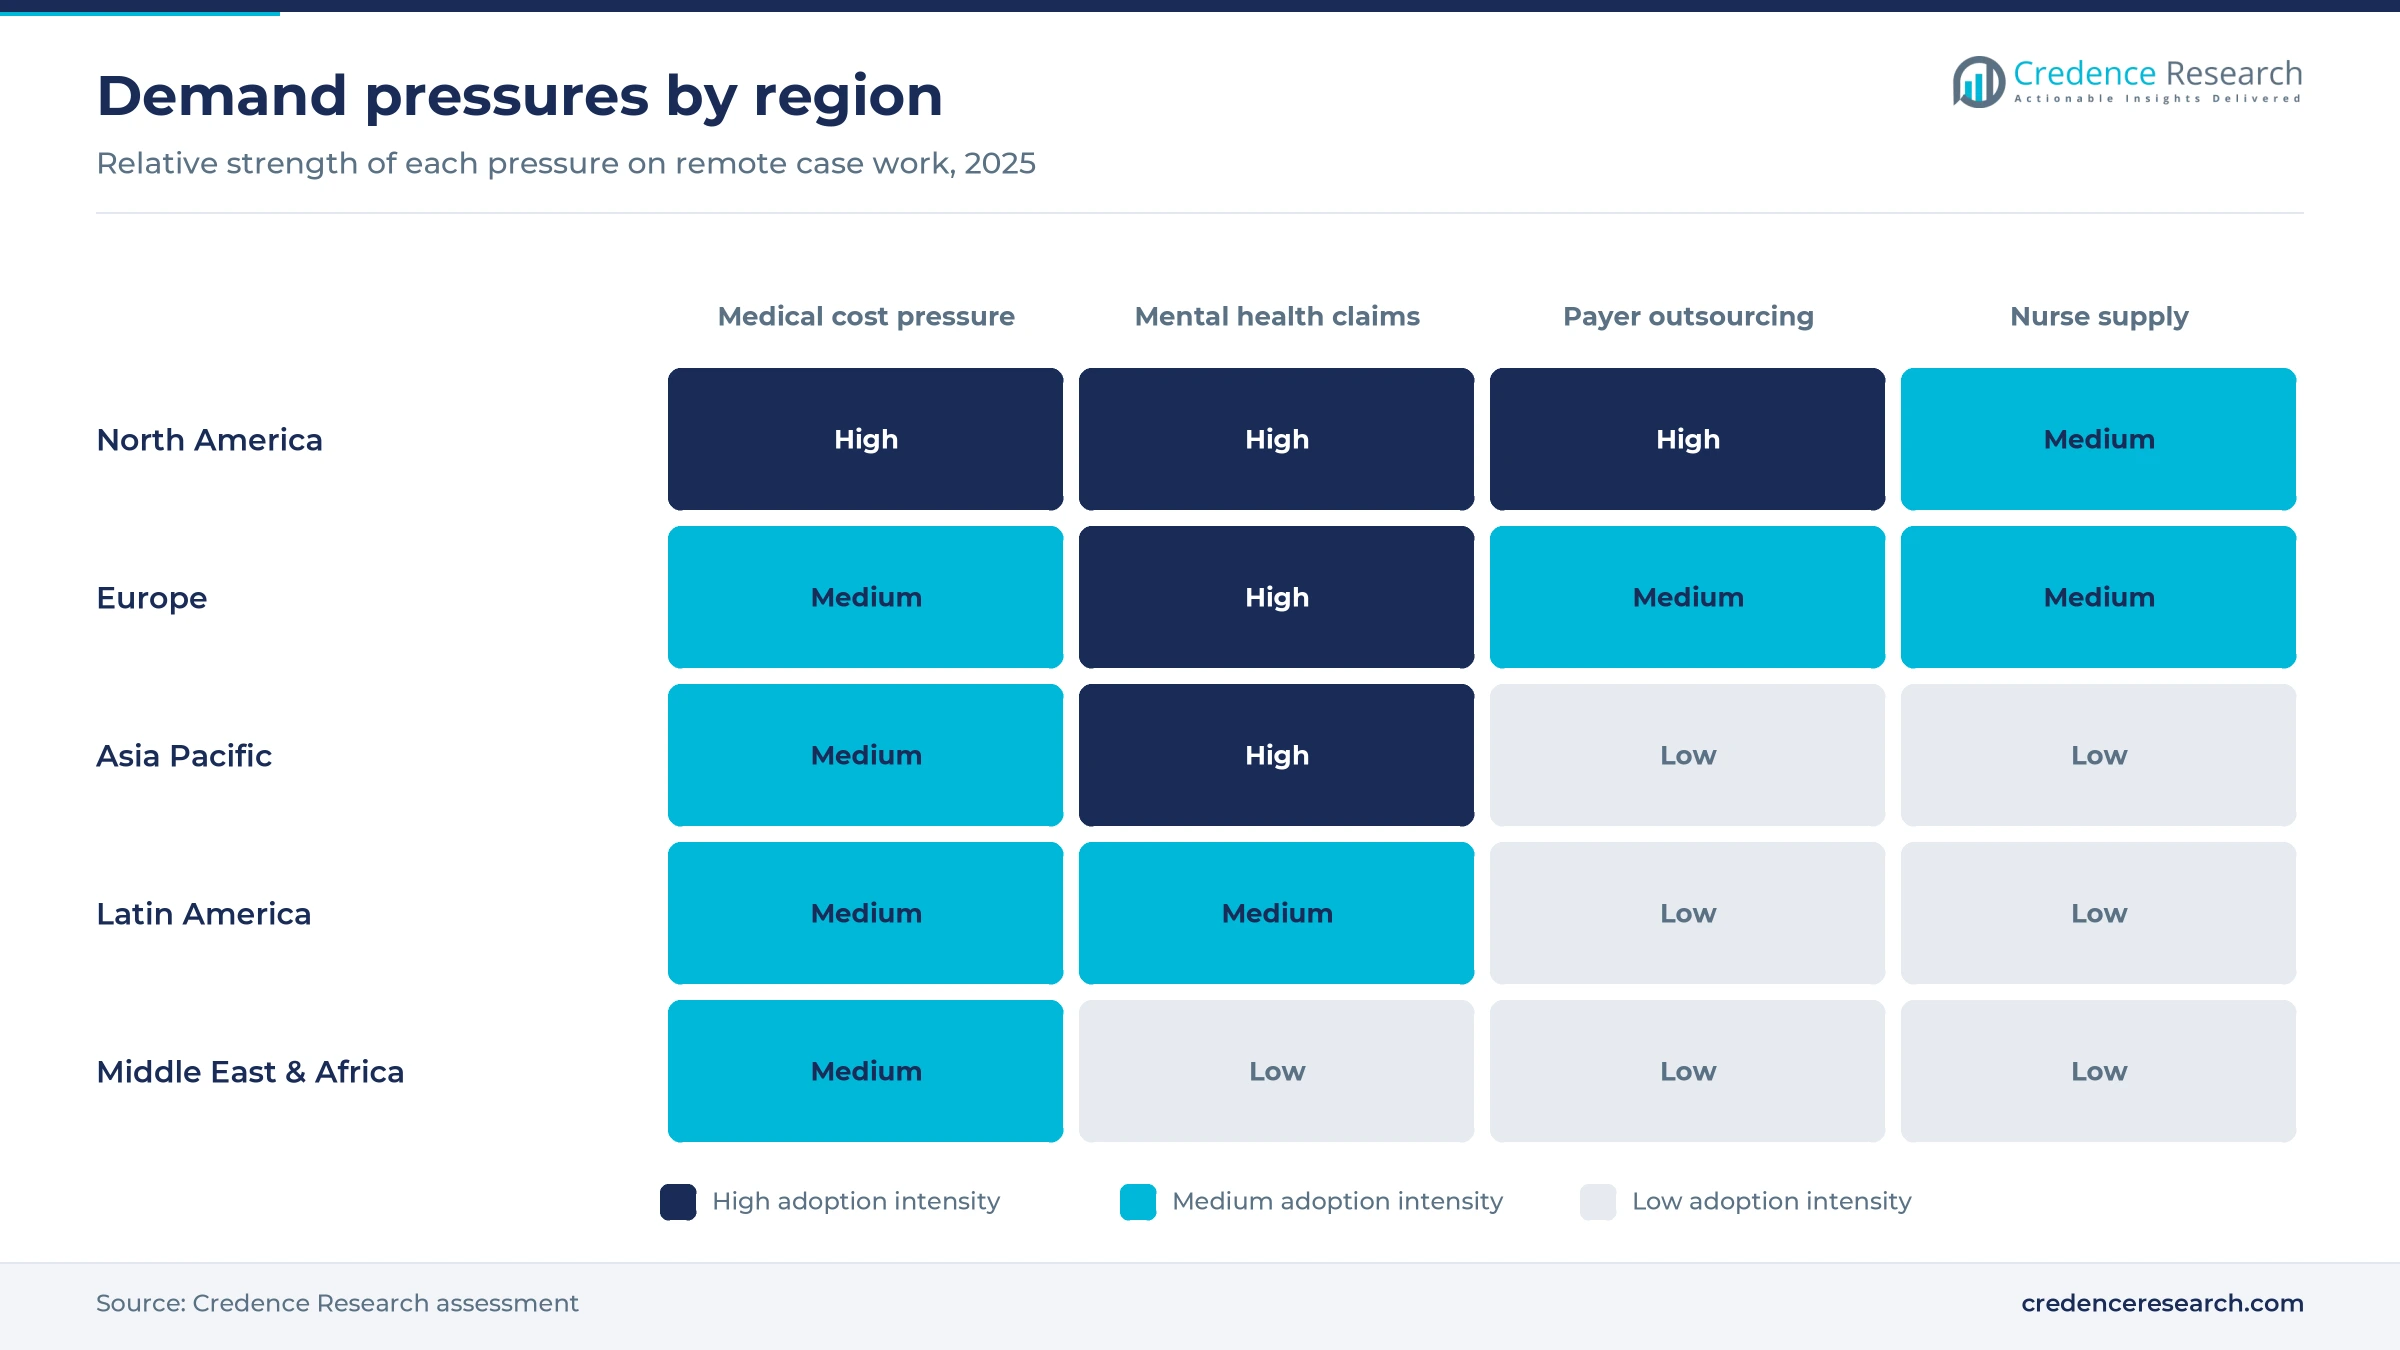
Longer psychological claims raise the value of continuous remote coordination, often through telehealth visits, because they need frequent contact rather than one-off physical assessments. Safe Work Australia reported 146,700 serious workers compensation claims in 2023-24, with mental health conditions making up 12% and rising 14.7% in a year, while their median time lost was almost five times longer than for other claims. GRiD data for 2025 show that 48% of U.K. insurer health interventions addressed mental illness. Sedgwick said in its January 2026 absence and disability trends report that mental health had become a leading driver of employee absence. Vendors with behavioral health nurses gain, while generalist telephonic programs face longer and costlier files.
European statutory rehabilitation spending keeps rising
European accident insurers spend more on treatment and rehabilitation even as accident counts fall, which raises case intensity and favors managed coordination. Germany's DGUV reported in August 2025 that spending on medical treatment and rehabilitation reached 5.9 billion euros in 2024, up 3.7%, while reportable workplace accidents fell 3.8% to 712,257. U.K. group risk insurers paid a record £2.69 billion in claims in 2025, according to GRiD, which lifts insurer interest in early return-to-work support. Vendors that work inside statutory schemes and group income protection contracts gain, because those buyers already pay for coordinated rehabilitation, while firms selling only U.S.-style programs struggle to win panel places.
AI triage and platform deals reshape service delivery
AI triage is shifting nurse time to high-risk claims
Vendors are shifting toward AI triage so that nurses spend their hours on the claims most likely to escalate. Enlyte says its GenexEngage tool uses predictive and demonstrated risk modeling to flag high-risk claims early from claims, medical and pharmacy data. The company also says its program records an 18% lower litigation rate than a WCRI benchmark and saves an average of 57 days, and it highlights results for claims referred within 90 days of injury. CorVel launched CorVel Connected in April 2026 with claim summaries, recommended next actions and reserve predictions. In the CY 2026 physician fee schedule, CMS also sought comment on paying for software as a service, including AI algorithms. Vendors that own the claims platform gain an edge, while nurse-only shops must license tools or partner to keep pace.
Platform consolidation is tying case work to claims data
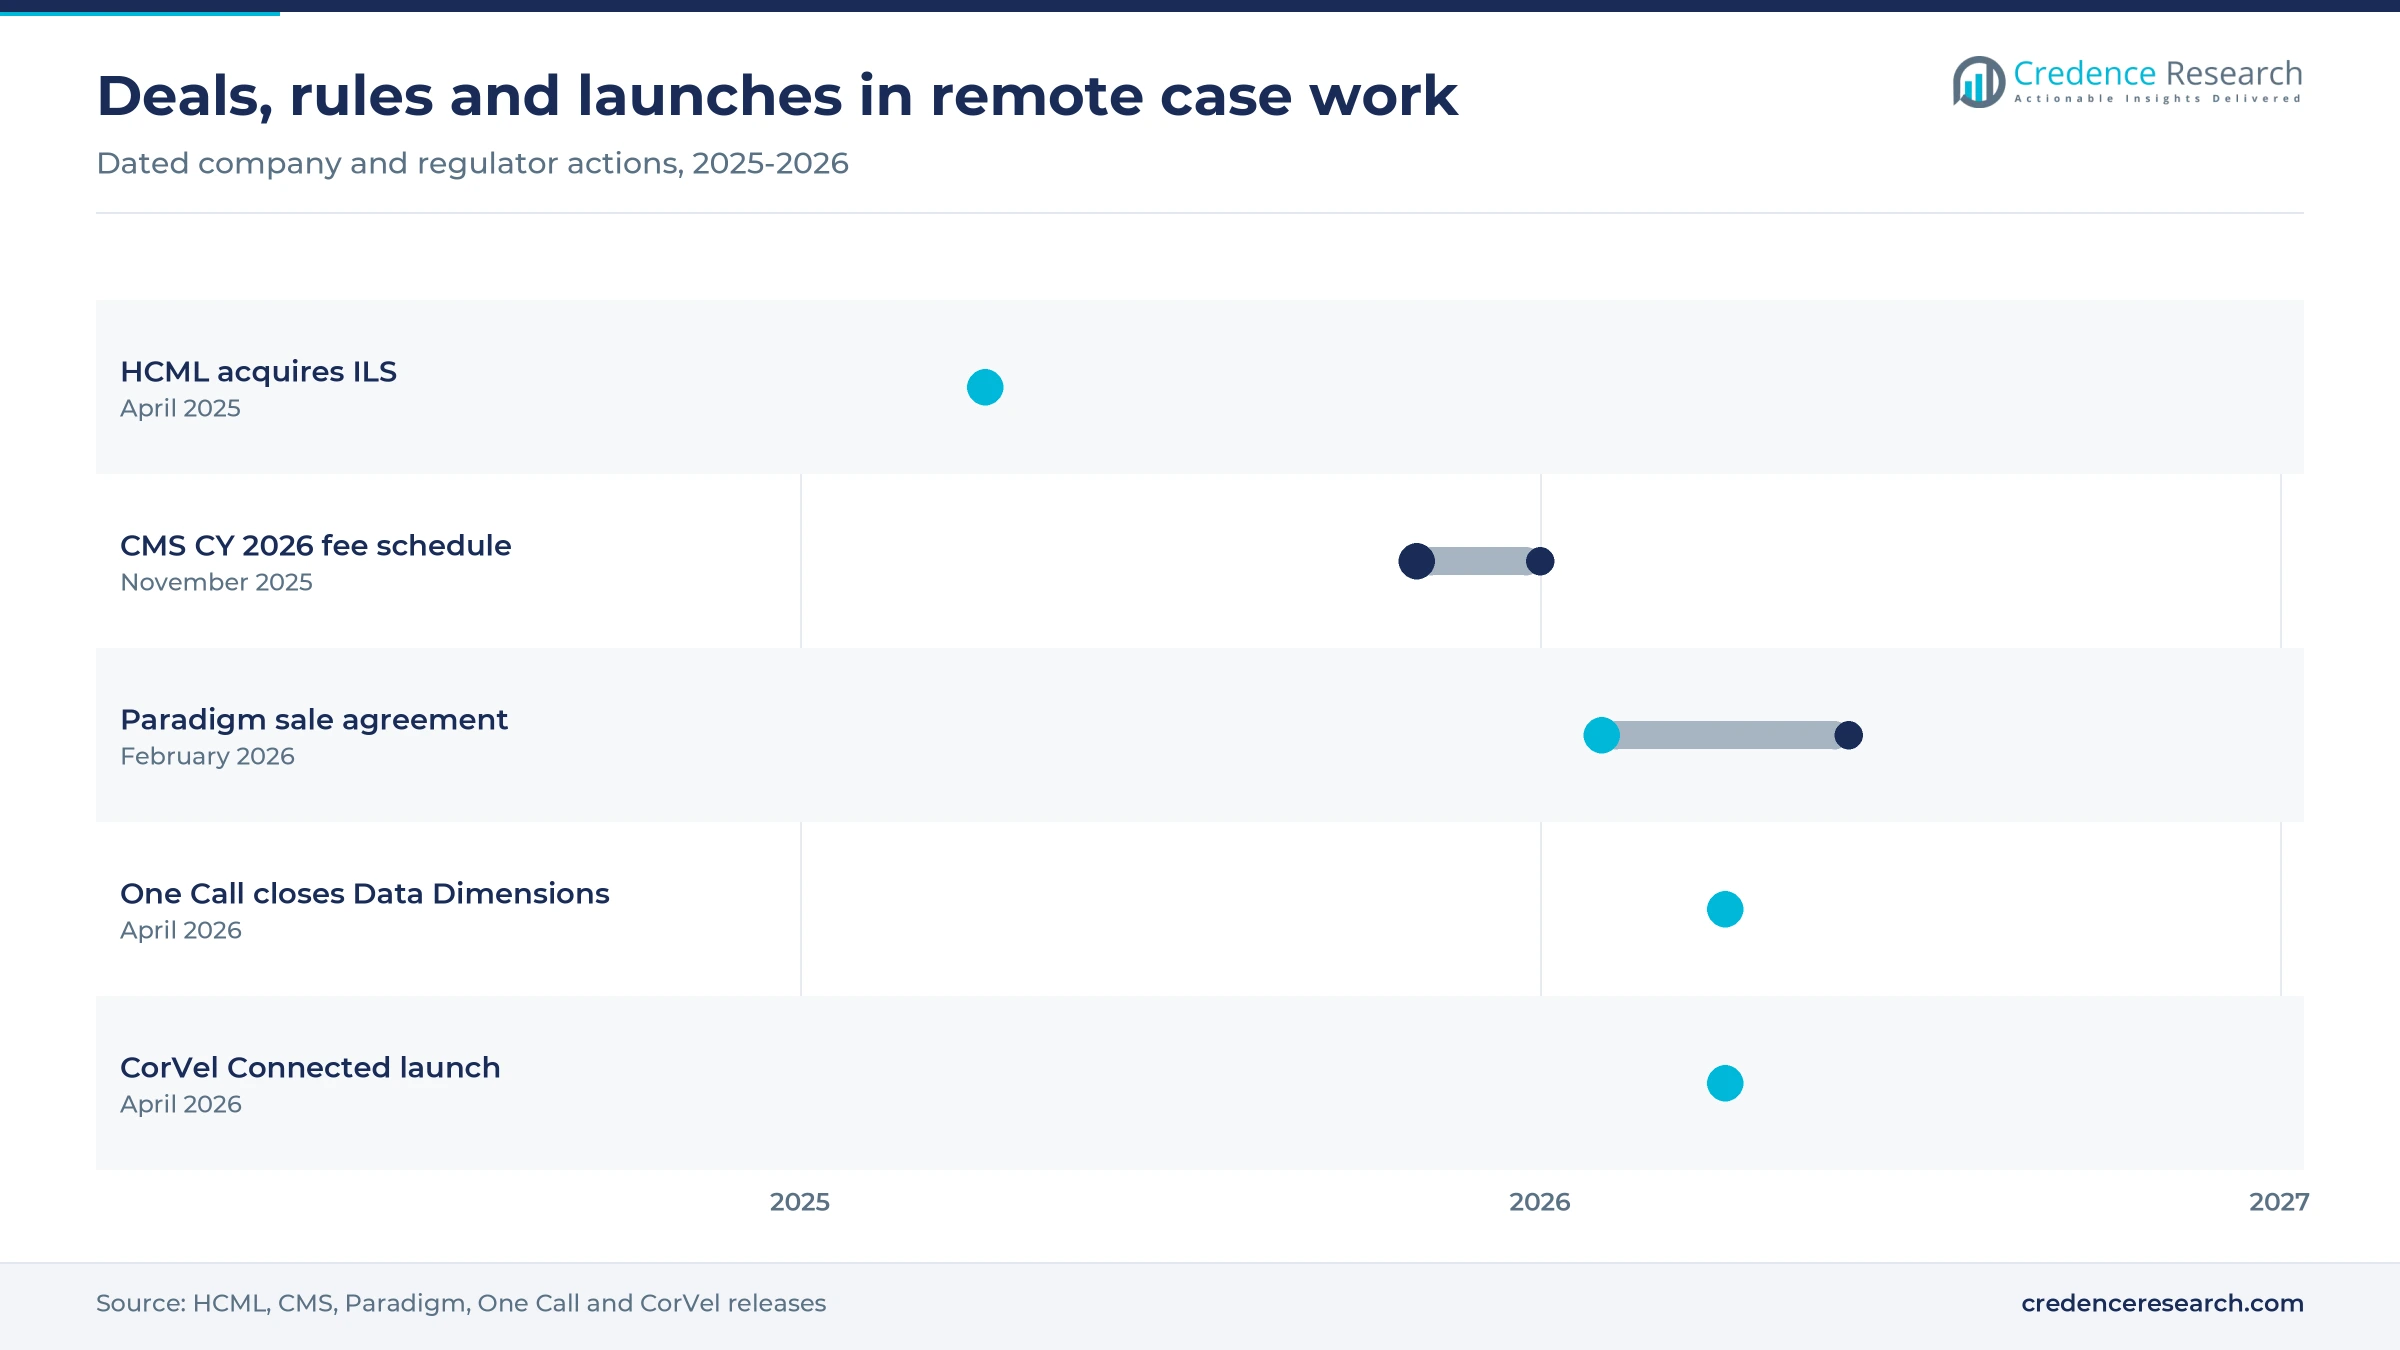
Owners are consolidating case management with data exchange and specialty networks to sell one integrated program to carriers. One Call completed its acquisition of Data Dimensions in April 2026, adding electronic data interchange and clearinghouse capabilities to its care coordination platform. Paradigm said in February 2026 that it had signed a definitive agreement to be acquired by Patient Square Capital, with closing expected in the first half of 2026. HCML added 40 specialist case managers through its ILS purchase, as noted above and Sedgwick also sells its managed care services separately from claims administration. The pattern matters most in catastrophic work, which held 30.0% of 2025 value, and for insurance carriers and TPAs, which held 48.0% and favor single contracts. Larger integrated vendors win carrier-wide contracts, while regional nurse firms risk becoming subcontractors.
Japan long-term care creates an opening for remote coordination
Japan offers an opening for remote coordination because its long-term care system already relies on care managers who track millions of older people at home. Nippon.com, citing the Ministry of Health, Labor and Welfare, reported in October 2026 that about 7.6 million people were certified as needing care or support in April 2026, a caseload that care offices must follow up between visits. Outsourcing of this follow-up to private remote vendors is not yet documented, which is an evidence gap. Vendors that offer telephonic follow-up and portal reporting to care management offices can reduce home visits and work alongside home healthcare agencies, although local language and certification rules limit foreign entrants.
Corporate health plans in Brazil and the Gulf open new buyers
Employer-funded health plans in Brazil and Saudi Arabia create a new buyer group for telephonic case programs sold through administrators. Brazil's ANS reported 53.2 million medical plan beneficiaries in December 2025, and ANS data show corporate plans held about 38.3 million of them. Saudi Arabia's Council of Health Insurance put private health insurance beneficiaries above 13 million in 2025, according to Argaam. Latin America held 6.0% and Middle East & Africa 4.0% of 2025 value in Credence Research estimates, so demand is small but open. Plan operators gain a lower-cost way to manage chronic and post-surgical members, while vendors must adapt to local medical councils and data rules.
Nurse supply, rate cuts and thin outcome evidence
A limited pool of credentialed case managers
Capacity depends on experienced nurses, and the pool is small relative to referral volume. The Commission for Case Manager Certification reported in March 2022, in the latest published count, that just over 50,000 people held its board-certified case manager credential. Smaller vendors that cannot match carrier wage scales are most exposed, because staff turnover lengthens files and erodes outcome data. AI triage and licensed practical nurse support can stretch existing staff, but they do not replace clinical judgment on complex claims.
Falling premium rates squeeze vendor fees
Rate cuts in large states reduce the budget carriers allocate to managed care services. Lockton reported that New York approved a 22% premium rate reduction effective Oct. 1, 2026, and that NCCI recommended an average 7.4% decrease in Florida for Jan. 1, 2027. Carriers in those states press vendors to hold hourly rates or cap hours per file. Independent nurse firms without bundled bill review are most exposed, while integrated vendors can offset fee pressure with other services.
Lower claim frequency limits new referrals
Fewer workplace injuries mean fewer files entering case management programs, even as each file grows more complex. NCCI estimated that lost-time claim frequency fell 2% for accident year 2025, and DGUV recorded 168,648 reportable commuting accidents in Germany in 2024, down from the year before. Vendors paid per referral face flat volumes, so growth must come from deeper work on each claim. Buyers that pay by outcome gain leverage as volumes flatten, which favors vendors with strong return-to-work records.
Vendor-reported outcomes are hard to compare
Buyers struggle to compare programs because most outcome claims come from vendors without published methods. Enlyte's claimed 39% cut in disability durations and its other savings figures are published without a sample size or comparison group. This evidence gap leaves procurement teams relying on price and relationships rather than verified results. Vendors that publish audited outcomes or join independent studies could win share, while buyers face the risk of paying for savings that would have occurred anyway.
U.S. injury programs anchor demand as Asia Pacific gains
| Region | Value, 2025 (USD billion) | Share, 2025 | CAGR, 2026–2035 |
|---|---|---|---|
| North America | 2.35 | 42.0% | 3.0% |
| Europe | 1.51 | 27.0% | 2.9% |
| Asia Pacific | 1.17 | 21.0% | 4.7% |
| Latin America | 0.34 | 6.0% | 3.8% |
| Middle East & Africa | 0.22 | 4.0% | 4.2% |
North America leads on U.S. workers compensation volume
North America held 42.0% of 2025 value and grows at 3.0% a year, because the U.S. medical case management market is built on state workers compensation systems and group disability contracts. Pressure on carrier results is acute in California, where the WCIRB projected a 2025 combined ratio of 129, its highest in more than 20 years, according to Lockton. That pressure pushes carriers toward early nurse intervention on claims with long expected durations. Canada adds smaller provincial board programs, and the region's large administrators keep most contracts.
Europe grows through U.K. group risk and statutory schemes
Europe held 27.0% of 2025 value and grows at 2.9% a year, led by the U.K., Germany and other statutory insurance systems such as those in France and Spain. U.K. insurers helped 5,590 absent employees return to work by the end of 2025, and 3,920 of them returned before making a claim, according to GRiD. That early-intervention model favors telephonic nurses and vocational specialists who can reach employees within weeks of absence. Growth is slower than in Asia Pacific because statutory insurers often keep case work in-house.
Asia Pacific is the fastest-growing region
Asia Pacific held 21.0% of 2025 value and grows fastest at 4.7% a year, led by Australia's state injury schemes. Safe Work Australia data show mental health claims rose 161% over 10 years, which extends claim durations and favors continuous remote support, and Australian schemes outsource much rehabilitation work to private providers. Japan's aging care system adds a second, less documented source of demand because it still relies on public care managers. India and Southeast Asia remain small because few employers fund disability programs.
Latin America builds on Brazilian corporate plans
Latin America held 6.0% of 2025 value and grows at 3.8% a year, with Brazil providing most South American demand for medical case management. ANS data show medical plan membership rose by about 1.17 million, or 1.9%, from December 2024 to December 2025, which widens the employer-funded base that buys care coordination. Mexico, Chile and Colombia add smaller insurer and employer programs that buy remote coordination. Currency swings and local nursing rules keep most work with domestic operators rather than U.S. vendors.
Middle East & Africa depends on mandatory insurance
Middle East & Africa held 4.0% of 2025 value and grows at 4.2% a year, led by Gulf states with mandatory employer health insurance. Saudi data reported by Argaam show more than 8.6 million non-Saudi private insurance beneficiaries, a group whose plans are funded by employers. Gulf insurers and administrators are adding remote care programs for chronic and post-surgical members. Africa outside South Africa remains small because few employers fund disability or injury cover.
Deals and AI launches from 2025 to 2026
| Development | Status and market relevance |
|---|---|
| In April 2025, HCML acquired ILS, a U.K. specialist in rehabilitation case management for catastrophically injured children and adults. | Completed acquisition; it deepens HCML's catastrophic case capacity in the U.K. personal injury market. |
| In November 2025, CMS finalized the CY 2026 Medicare physician fee schedule, adding three optional add-on codes to advanced primary care management from Jan. 1, 2026. | Final rule in effect; it widens paid remote care coordination for physician practices and clinics. |
| In February 2026, Paradigm signed a definitive agreement to be acquired by Patient Square Capital from OMERS Private Equity, with closing expected in the first half of 2026. | Definitive agreement; completion was not confirmed in the sources reviewed, and the deal signals investor demand for complex care platforms. |
| In April 2026, One Call completed its acquisition of Data Dimensions, adding electronic data interchange and clearinghouse capabilities to its workers compensation care coordination platform. | Completed acquisition; it links care coordination with billing and claims data for payers. |
| In April 2026, CorVel launched CorVel Connected, an AI-powered claims intelligence layer embedded in its CareMC platform. | Commercial launch; it brings claim summaries, next-action prompts and reserve predictions into claim and case workflows. |
Risk scoring and data exchange decide vendor choice
- Predictive risk scoring ranks new claims by likely cost and duration so that nurses receive the files where early contact changes the outcome.
- Generative AI summaries condense medical records and claim histories, which cuts the hours a nurse spends reading before the first call.
- Electronic data interchange links case notes with bills and authorizations, so payers see treatment, cost and case status in one record.
- Secure portals and messaging let injured workers, employers and clinicians share updates without phone tag, which supports lower-cost web-based programs.
Need a Custom Version of This Report?
Tailor the scope, geography, or segments to your exact requirements.
- Custom geography or segment scope
- Direct access to our analyst team
Claims administrators and specialists compete on outcomes
Competition splits between claims administrators that sell case management as part of a bundled program and specialists that focus on complex or catastrophic files. Enlyte, through Genex, CorVel, Sedgwick and Crawford & Company through Broadspire hold carrier and employer relationships in the U.S. and win when buyers want one contract for claims, bill review and nurse work. Paradigm and One Call compete on complex care and coordination networks, and both have changed ownership or added data capabilities since 2025. EK Health serves workers compensation payers in the western U.S. with case management and utilization review. HCML leads U.K. catastrophic and rehabilitation case work through acquisitions. Buyers choose on outcome records, nurse availability and data integration more than on hourly rate, because state programs already pay similar rates.
How concentrated is the supply side?
Supply is moderately concentrated in the U.S., where a handful of claims administrators and managed care vendors run telephonic nurse programs alongside bill review and networks, and fragmented elsewhere, where local rehabilitation firms hold most contracts. Entry barriers come from nurse licensing in each state or country, carrier panel approval and integration with claims systems. Margins sit with vendors that bundle case work with bill review and networks, because nurse hours alone earn a thin spread over wages. Private equity ownership is common, which drives roll-ups of regional specialists.
Companies profiled and their roles in this market
| Company | Type | Role in the market |
|---|---|---|
| Enlyte (Genex) | Integrated managed care vendor | Telephonic and field case management with GenexEngage risk modeling |
| CorVel Corporation | Claims and managed care vendor | Case management and claims services on the CareMC platform |
| Sedgwick | Claims administrator | Managed care services including nurse triage and case management |
| Crawford & Company (Broadspire) | Claims administrator | Telephonic case management for workers compensation and disability clients |
| Paradigm | Complex care specialist | Catastrophic and complex case management with specialty networks |
| One Call | Care coordination specialist | Workers compensation care coordination platform with data exchange |
| EK Health | Specialist | Case management and utilization review for workers compensation payers |
| HCML | Specialist | U.K. rehabilitation and catastrophic injury case management |
Early referral, not headcount, will set vendor growth
Credence Research's view is that the market will grow through earlier referral of the right claims rather than through more nurse headcount. Medical severity is rising faster than prices, mental health claims last longer, and carriers want proof that nurse time shortens disability. Vendors that pair AI triage with audited return-to-work results should take share from nurse-only firms. The main risk is that rate cuts push buyers to cap hours per file before outcome evidence matures. Brazil, with 53.2 million medical plan members, and the Gulf offer the clearest new demand from employer-funded plans. Europe, with 27.0% of 2025 value, grows mainly through U.K. group risk and statutory rehabilitation schemes, although local licensing slows foreign entrants.
Benefit statistics and vendor rates anchor the estimate
The report uses 2025 as the base year and forecasts to 2035. Market values come from the Credence Research model, which starts from the previous edition of this report and checks the result against public benefit statistics, state vendor rates and Medicare care management codes. Regional, service, case and end-user splits are Credence Research estimates. Sources include government agencies and statutory insurers, industry bodies, company releases and specialist trade press. No interviews or surveys were conducted for this edition of the report.
Steady payer outsourcing carries growth to 2035
The market is expected to grow from USD 5.79 billion in 2026 to USD 7.83 billion by 2035, at a 3.42% CAGR over 2026–2035. Telephonic case management services, which held 58.0% of 2025 value, will keep the largest share as carriers buy nurse hours, while web-based services and AI triage take a growing part of routine work. North America remains the largest region on U.S. workers compensation volume, and Asia Pacific grows fastest. Consolidation among administrators and complex care specialists is likely to continue, and buyers will increasingly ask for audited outcomes. The forecast depends on stable referral rates, because premium cuts in large states could slow spending.
Referral rates decide the range of outcomes to 2035
The spread between cases depends on how many claims payers refer to remote nurses and how much AI triage cuts the hours each file needs. A downside case follows if premium rate cuts spread and carriers trim managed care budgets. The upside follows if mental health and long-term care programs in Asia Pacific and Europe adopt telephonic coordination at scale, and if buyers start paying for verified outcomes.
| Scenario | CAGR, 2026–2035 | Value, 2035 | What has to hold |
|---|---|---|---|
| Downside | 2.2% | USD 7.05 billion | Rate cuts spread across large states and carriers cap nurse hours per claim |
| Base | 3.42% | USD 7.83 billion | Referral rates hold and AI triage offsets slower claim frequency |
| Upside | 4.7% | USD 8.76 billion | Asia Pacific care systems and European insurers adopt remote case work at scale |
Frequently Asked Questions
How big is the offsite medical case management market?
What does offsite medical case management include?
Which region leads the market?
Which region grows fastest?
How large is the South America medical case management market?
How much do payers pay for telephonic nurse case management?
Which companies lead the market?
What is the main challenge for vendors?
Table of Content
Chapter 1 Market Segmentation
- 1.1 Segmentation Framework
- 1.1.1 Product and Service Classification
- 1.1.2 Application and End-Use Classification
- 1.1.3 Technology and Solution Classification
- 1.1.4 Customer and Distribution Channel Classification
- 1.1.5 Geographic Segmentation
- 1.1.6 Market Segment Definitions and Boundaries
- 1.2 By Service Type
- 1.2.1 Telephonic Case Management Services
- 1.2.2 Web-Based Case Management Services
- 1.3 By Case Type
- 1.3.1 Catastrophic Case Management
- 1.3.2 Long-Term Disability
- 1.3.3 Short-Term Disability
- 1.3.4 Chronic Pain Management
- 1.3.5 Others
- 1.4 By End User
- 1.4.1 Insurance Carriers and TPAs
- 1.4.2 Self-Insured Employers
- 1.4.3 Healthcare Providers and Home Care
- 1.4.4 Government Programs and Others
Chapter 2 Introduction
- 2.1 Report Objectives and Scope
- 2.2 Product Definition and Industry Terminology
- 2.3 Market Inclusions and Exclusions
- 2.4 Research Process
- 2.4.1 Primary Research and Expert Interviews
- 2.4.2 Secondary Research and Source Review
- 2.4.3 Top-Down and Bottom-Up Estimation
- 2.4.4 Data Triangulation and Verification
- 2.5 Market Size Measurement Basis
- 2.5.1 2025: USD 5.59 billion → 2035: USD 7.83 billion
- 2.6 Historical and Forecast Reference Periods
- 2.6.1 Historical Period: 2018-2025
- 2.6.2 Base Year: 2025
- 2.6.3 Forecast Period: 2025-2035
- 2.7 Research Assumptions and Limitations
Chapter 3 Executive Summary
- 3.1 Market Snapshot and Key Findings
- 3.2 Base-Year Market Size, 2025
- 3.3 Forecast Market Size, 2035
- 3.4 Revenue and Volume Growth Outlook
- 3.5 Key Demand and Supply Indicators
- 3.6 Leading Market Segments
- 3.7 Fastest-Growing Market Opportunities
- 3.8 Regional Performance Highlights
- 3.9 Technology and Industry Transformation
- 3.10 Competitive Landscape Summary
- 3.11 Analyst View and Strategic Implications
Chapter 4 Global Offsite Medical Case Management Market Trends and Developments
- 4.1 Historical Industry Development, 2018-2025
- 4.2 Recent Market Trends and Developments
- 4.3 Demand and Customer Behavior Trends
- 4.4 Technology and Product Innovation
- 4.5 Artificial Intelligence, Automation and Digitalization
- 4.6 Local Manufacturing and Supply Chain Realignment
- 4.7 Industry Partnerships, Mergers and Acquisitions
- 4.8 Sustainability and Circular Economy Developments
- 4.9 Government and Private Sector Investment Trends
- 4.10 Emerging Business Models and Commercialization
- 4.11 Industry Developments and Announcements
Chapter 5 Global Offsite Medical Case Management Market Production, Supply and Demand Analysis
- 5.1 Demand Trend and Consumption Analysis, 2018-2025
- 5.2 Demand Forecast, 2025-2035
- 5.3 Production and Output Trend, 2018-2025
- 5.4 Production and Output Forecast, 2025-2035
- 5.5 Installed Capacity and Capacity Utilization
- 5.6 Company-Wise Production Plants and Statistics
- 5.6.1 Installed Production Capacity
- 5.6.2 Actual Production
- 5.6.3 Planned Capacity and Expansion Targets
- 5.7 Supply Chain Structure and Procurement Trends
- 5.8 Supply-Demand Gap and Bottlenecks
- 5.9 Import Dependence and Sourcing Structure
- 5.10 Contract Manufacturing and Outsourcing
- 5.11 Regional Supply and Demand Concentration
Chapter 6 Global Offsite Medical Case Management Market Pricing Analysis
- 6.1 Pricing Structure and Measurement
- 6.2 Historical Pricing Trends, 2018-2025
- 6.3 Pricing Outlook, 2025-2035
- 6.4 Average Selling Price and Unit Economics
- 6.5 Pricing by Product and Market Segment
- 6.6 Geographic Pricing Differences
- 6.7 Key Input, Energy, Labor and Logistics Costs
- 6.8 Contract Pricing and Purchasing Models
- 6.9 Pricing Sensitivity and Competitive Positioning
- 6.10 Price, Margin and Profitability Implications
Chapter 7 Global Offsite Medical Case Management Market Dynamics
- 7.1 Market Growth Drivers
- 7.1.1 Demand-Side Drivers
- 7.1.2 Technology and Innovation Drivers
- 7.1.3 Infrastructure and Investment Drivers
- 7.1.4 Regulatory and Policy Drivers
- 7.2 Market Restraints
- 7.2.1 Cost and Affordability Constraints
- 7.2.2 Technology and Adoption Barriers
- 7.2.3 Supply Chain and Operational Constraints
- 7.3 Market Challenges
- 7.3.1 Competitive Pressure and Margin Erosion
- 7.3.2 Skills, Infrastructure and Implementation Gaps
- 7.4 Emerging Market Opportunities
- 7.5 Market Dynamics Impact and Time-Horizon Assessment
Chapter 8 Global Offsite Medical Case Management Value Chain Analysis
- 8.1 Industry Value Chain Overview
- 8.2 Upstream Suppliers and Critical Inputs
- 8.3 Technology and Component Providers
- 8.4 Manufacturing or Service Delivery
- 8.5 Distribution, Channel Partners and Integrators
- 8.6 Downstream Applications and End Users
- 8.7 Value Addition and Profit Pools
- 8.8 Vertical Integration and Outsourcing
- 8.9 Supplier Concentration and Risk
- 8.10 Supply Chain Localization and Resilience
Chapter 9 Global Offsite Medical Case Management Market Regulations and Policies
- 9.1 Relevant Laws, Standards and Compliance Frameworks
- 9.2 Product, Service, Safety and Quality Requirements
- 9.3 Government Policies, Incentives and Subsidies
- 9.4 Imports, Exports and Trade Barriers
- 9.5 Public Procurement and Local Content Requirements
- 9.6 Environmental and Sustainability Compliance
- 9.7 Upcoming Policy Changes and Market Implications
Chapter 10 Global Offsite Medical Case Management Market Hotspots and Opportunities
- 10.1 Market Opportunity Mapping and Growth Hotspots
- 10.2 High-Growth Applications and Customer Groups
- 10.3 Underserved Markets and White-Space Opportunities
- 10.4 Emerging Technology and Product Opportunities
- 10.5 New Capacity and Investment Hotspots
- 10.6 Market Entry and Expansion Opportunities
- 10.7 Distribution and Partnership Opportunities
- 10.8 Near-Term and Long-Term Commercial Potential
- 10.9 Opportunity Attractiveness and Execution Risks
Chapter 11 Global Offsite Medical Case Management Market Outlook, 2025-2035
- 11.1 Market Size and Analysis
- 11.1.1 Revenue (Market Measurement: 2025: USD 5.59 billion → 2035: USD 7.83 billion)
- 11.1.2 Market Volume and Quantity Sold
- 11.1.3 Historical Market Size, 2018-2025
- 11.1.4 Base-Year Market Size, 2025
- 11.2 Market Forecast, 2025-2035
- 11.2.1 Revenue Forecast to 2035
- 11.2.2 Volume Forecast to 2035
- 11.2.3 CAGR and Year-on-Year Growth
- 11.2.4 Incremental Revenue Opportunity
- 11.3 Forecast Assumptions and Scenario Analysis
- 11.3.1 Base-Case Forecast
- 11.3.2 Optimistic and Conservative Scenarios
- 11.3.3 Technology, Pricing and Policy Sensitivities
- 11.4 Market Attractiveness and Growth Outlook
Chapter 12 Global Offsite Medical Case Management Market Segmentation and Outlook
- 12.1 Segmentation Summary and Market Shares, 2025
- 12.2 Largest and Fastest-Growing Segments
- 12.3 By Service Type - Market Size and Forecast, 2025-2035
- 12.3.1 Segment Definition and Scope
- 12.3.2 Historical Market Size, 2018-2025
- 12.3.3 Revenue Forecast, 2025-2035
- 12.3.4 Volume Forecast, 2025-2035
- 12.3.5 Base-Year Market Share, 2025
- 12.3.6 Segment CAGR and Growth Drivers
- 12.3.7 Subsegment Market Size and Forecast
- 12.3.7.1 Telephonic Case Management Services
- 12.3.7.2 Web-Based Case Management Services
- 12.3.8 Subsegment Pricing and Adoption Trends
- 12.3.9 Leading Suppliers and Competition
- 12.3.10 Regional Demand and Opportunities
- 12.4 By Case Type - Market Size and Forecast, 2025-2035
- 12.4.1 Segment Definition and Scope
- 12.4.2 Historical Market Size, 2018-2025
- 12.4.3 Revenue Forecast, 2025-2035
- 12.4.4 Volume Forecast, 2025-2035
- 12.4.5 Base-Year Market Share, 2025
- 12.4.6 Segment CAGR and Growth Drivers
- 12.4.7 Subsegment Market Size and Forecast
- 12.4.7.1 Catastrophic Case Management
- 12.4.7.2 Long-Term Disability
- 12.4.7.3 Short-Term Disability
- 12.4.7.4 Chronic Pain Management
- 12.4.7.5 Others
- 12.4.8 Subsegment Pricing and Adoption Trends
- 12.4.9 Leading Suppliers and Competition
- 12.4.10 Regional Demand and Opportunities
- 12.5 By End User - Market Size and Forecast, 2025-2035
- 12.5.1 Segment Definition and Scope
- 12.5.2 Historical Market Size, 2018-2025
- 12.5.3 Revenue Forecast, 2025-2035
- 12.5.4 Volume Forecast, 2025-2035
- 12.5.5 Base-Year Market Share, 2025
- 12.5.6 Segment CAGR and Growth Drivers
- 12.5.7 Subsegment Market Size and Forecast
- 12.5.7.1 Insurance Carriers and TPAs
- 12.5.7.2 Self-Insured Employers
- 12.5.7.3 Healthcare Providers and Home Care
- 12.5.7.4 Government Programs and Others
- 12.5.8 Subsegment Pricing and Adoption Trends
- 12.5.9 Leading Suppliers and Competition
- 12.5.10 Regional Demand and Opportunities
- 12.6 Segment Growth Comparison
- 12.7 Segment Attractiveness and Priority Matrix
Chapter 13 Global Offsite Medical Case Management End-Use and Application Market Outlook
- 13.1 End-Use Industry and Customer Demand Structure
- 13.2 Leading Applications and Customer Groups
- 13.3 End-Use Market Size, Share and Forecast
- 13.4 Major End-Use Industry Deep Dives
- 13.4.1 Customer Requirements and Use Cases
- 13.4.2 Demand and Replacement Cycles
- 13.4.3 Technical and Regulatory Considerations
- 13.4.4 Purchasing and Procurement Models
- 13.4.5 Leading Vendors and Distribution Channels
- 13.4.6 Forecast and Commercial Opportunities
- 13.5 Emerging Applications and Cross-Segment Demand
- 13.6 End-Use Industry Investment Priorities
Chapter 14 Global Offsite Medical Case Management Geographic Market Outlook, 2025-2035
- 14.1 Regional Market Size and Share, 2025
- 14.2 Regional Market Forecast, 2025-2035
- 14.3 Regional Pricing, Production and Demand Differences
- 14.4 North America
- 14.4.1 United States
- 14.4.2 Canada
- 14.4.3 Mexico
- 14.5 Europe
- 14.5.1 Germany
- 14.5.2 France
- 14.5.3 Italy
- 14.5.4 United Kingdom
- 14.5.5 Spain
- 14.5.6 Poland
- 14.5.7 Russia
- 14.5.8 Netherlands
- 14.5.9 Belgium
- 14.5.10 Sweden
- 14.5.11 Denmark
- 14.5.12 Norway
- 14.5.13 Rest of Europe
- 14.6 Asia Pacific
- 14.6.1 China
- 14.6.2 India
- 14.6.3 Japan
- 14.6.4 South Korea
- 14.6.5 Thailand
- 14.6.6 Indonesia
- 14.6.7 Vietnam
- 14.6.8 Malaysia
- 14.6.9 Australia
- 14.6.10 Rest of Asia Pacific
- 14.7 Latin America
- 14.7.1 Brazil
- 14.7.2 Argentina
- 14.7.3 Colombia
- 14.7.4 Chile
- 14.7.5 Rest of Latin America
- 14.8 Middle East
- 14.8.1 Saudi Arabia
- 14.8.2 United Arab Emirates
- 14.8.3 Turkey
- 14.8.4 Israel
- 14.8.5 Iran
- 14.8.6 Rest of the Middle East
- 14.9 Africa
- 14.9.1 South Africa
- 14.9.2 Egypt
- 14.9.3 Nigeria
- 14.9.4 Morocco
- 14.9.5 Rest of Africa
- 14.10 Regional Investment, Policy and Supply Chain Differences
- 14.11 Regional Competitive Landscape
- 14.12 Geographic Growth Hotspots
Chapter 15 Global Offsite Medical Case Management Technology, Innovation and Sustainability Outlook
- 15.1 Technology Landscape and Maturity
- 15.2 Product, Process and Service Innovation
- 15.3 AI, Automation and Digital Tools in the Industry
- 15.4 Technology Adoption and Performance Benchmarking
- 15.5 Innovation Pipeline and R&D Investment
- 15.6 Patent and Intellectual Property Trends
- 15.7 Energy Efficiency and Resource Management
- 15.8 Sustainability, Recycling and Circularity
- 15.9 Technology Roadmap, 2025-2035
- 15.10 Risks of Obsolescence and Technology Substitution
Chapter 16 Global Offsite Medical Case Management Market Key Strategic Imperatives
- 16.1 Growth and Market Entry Priorities
- 16.2 High-Return Products and Segments
- 16.3 Pricing, Profitability and Cost Optimization
- 16.4 Technology Investment and Product Differentiation
- 16.5 Supply Chain Localization and Resilience
- 16.6 Distribution and Customer Acquisition
- 16.7 Partnership, Acquisition and Capacity Strategy
- 16.8 Regional Expansion Priorities
- 16.9 Short-, Medium- and Long-Term Actions
Chapter 17 Competition Outlook
- 17.1 Industry Competition Characteristics
- 17.2 Market Structure and Concentration
- 17.3 Market Share and Competitive Positioning, 2025
- 17.4 Company-Wise Revenue and Product Benchmarking
- 17.5 Production and Service Capacity Benchmarking
- 17.6 Technology, Pricing and Differentiation
- 17.7 Regional Footprint and Distribution Strength
- 17.8 Mergers, Acquisitions and Strategic Alliances
- 17.9 New Entrants and Competitive Threats
- 17.10 Porter's Five Forces and Industry Attractiveness
- 17.11 Competitive Outlook, 2025-2035
Chapter 18 Company Profiles
- 18.1 Company Coverage and Selection Criteria
- 18.2 Enlyte (Genex)
- 18.2.1 Business Description
- 18.2.2 Company Ownership and Geographic Presence
- 18.2.3 Product and Service Portfolio
- 18.2.4 Manufacturing and Operating Footprint
- 18.2.5 Production Capacity and Expansion Plans
- 18.2.6 Financial Performance and Investment
- 18.2.7 Market Share and Competitive Position
- 18.2.8 Technology and Innovation Capabilities
- 18.2.9 Strategic Alliances or Partnerships
- 18.2.10 Recent Developments
- 18.2.11 Growth Strategy and Outlook
- 18.3 CorVel Corporation
- 18.4 Sedgwick
- 18.5 Crawford & Company (Broadspire)
- 18.6 Paradigm
- 18.7 One Call
- 18.8 EK Health
- 18.9 HCML
- 18.10 Other Relevant Market Participants
Note: Every listed company is profiled on the structure shown under the first company. The company list is preliminary and may change based on research findings, market developments, data availability and client requirements.
Chapter 19 Disclaimer
- 19.1 Research and Forecast Disclaimer
- 19.2 Data Source and Estimation Limitations
Note: The depth of individual sections depends on data availability for this market. Volume, capacity, trade and other unit-based metrics are included where applicable.