Untreated decay and tooth loss keep U.S. chairs busy
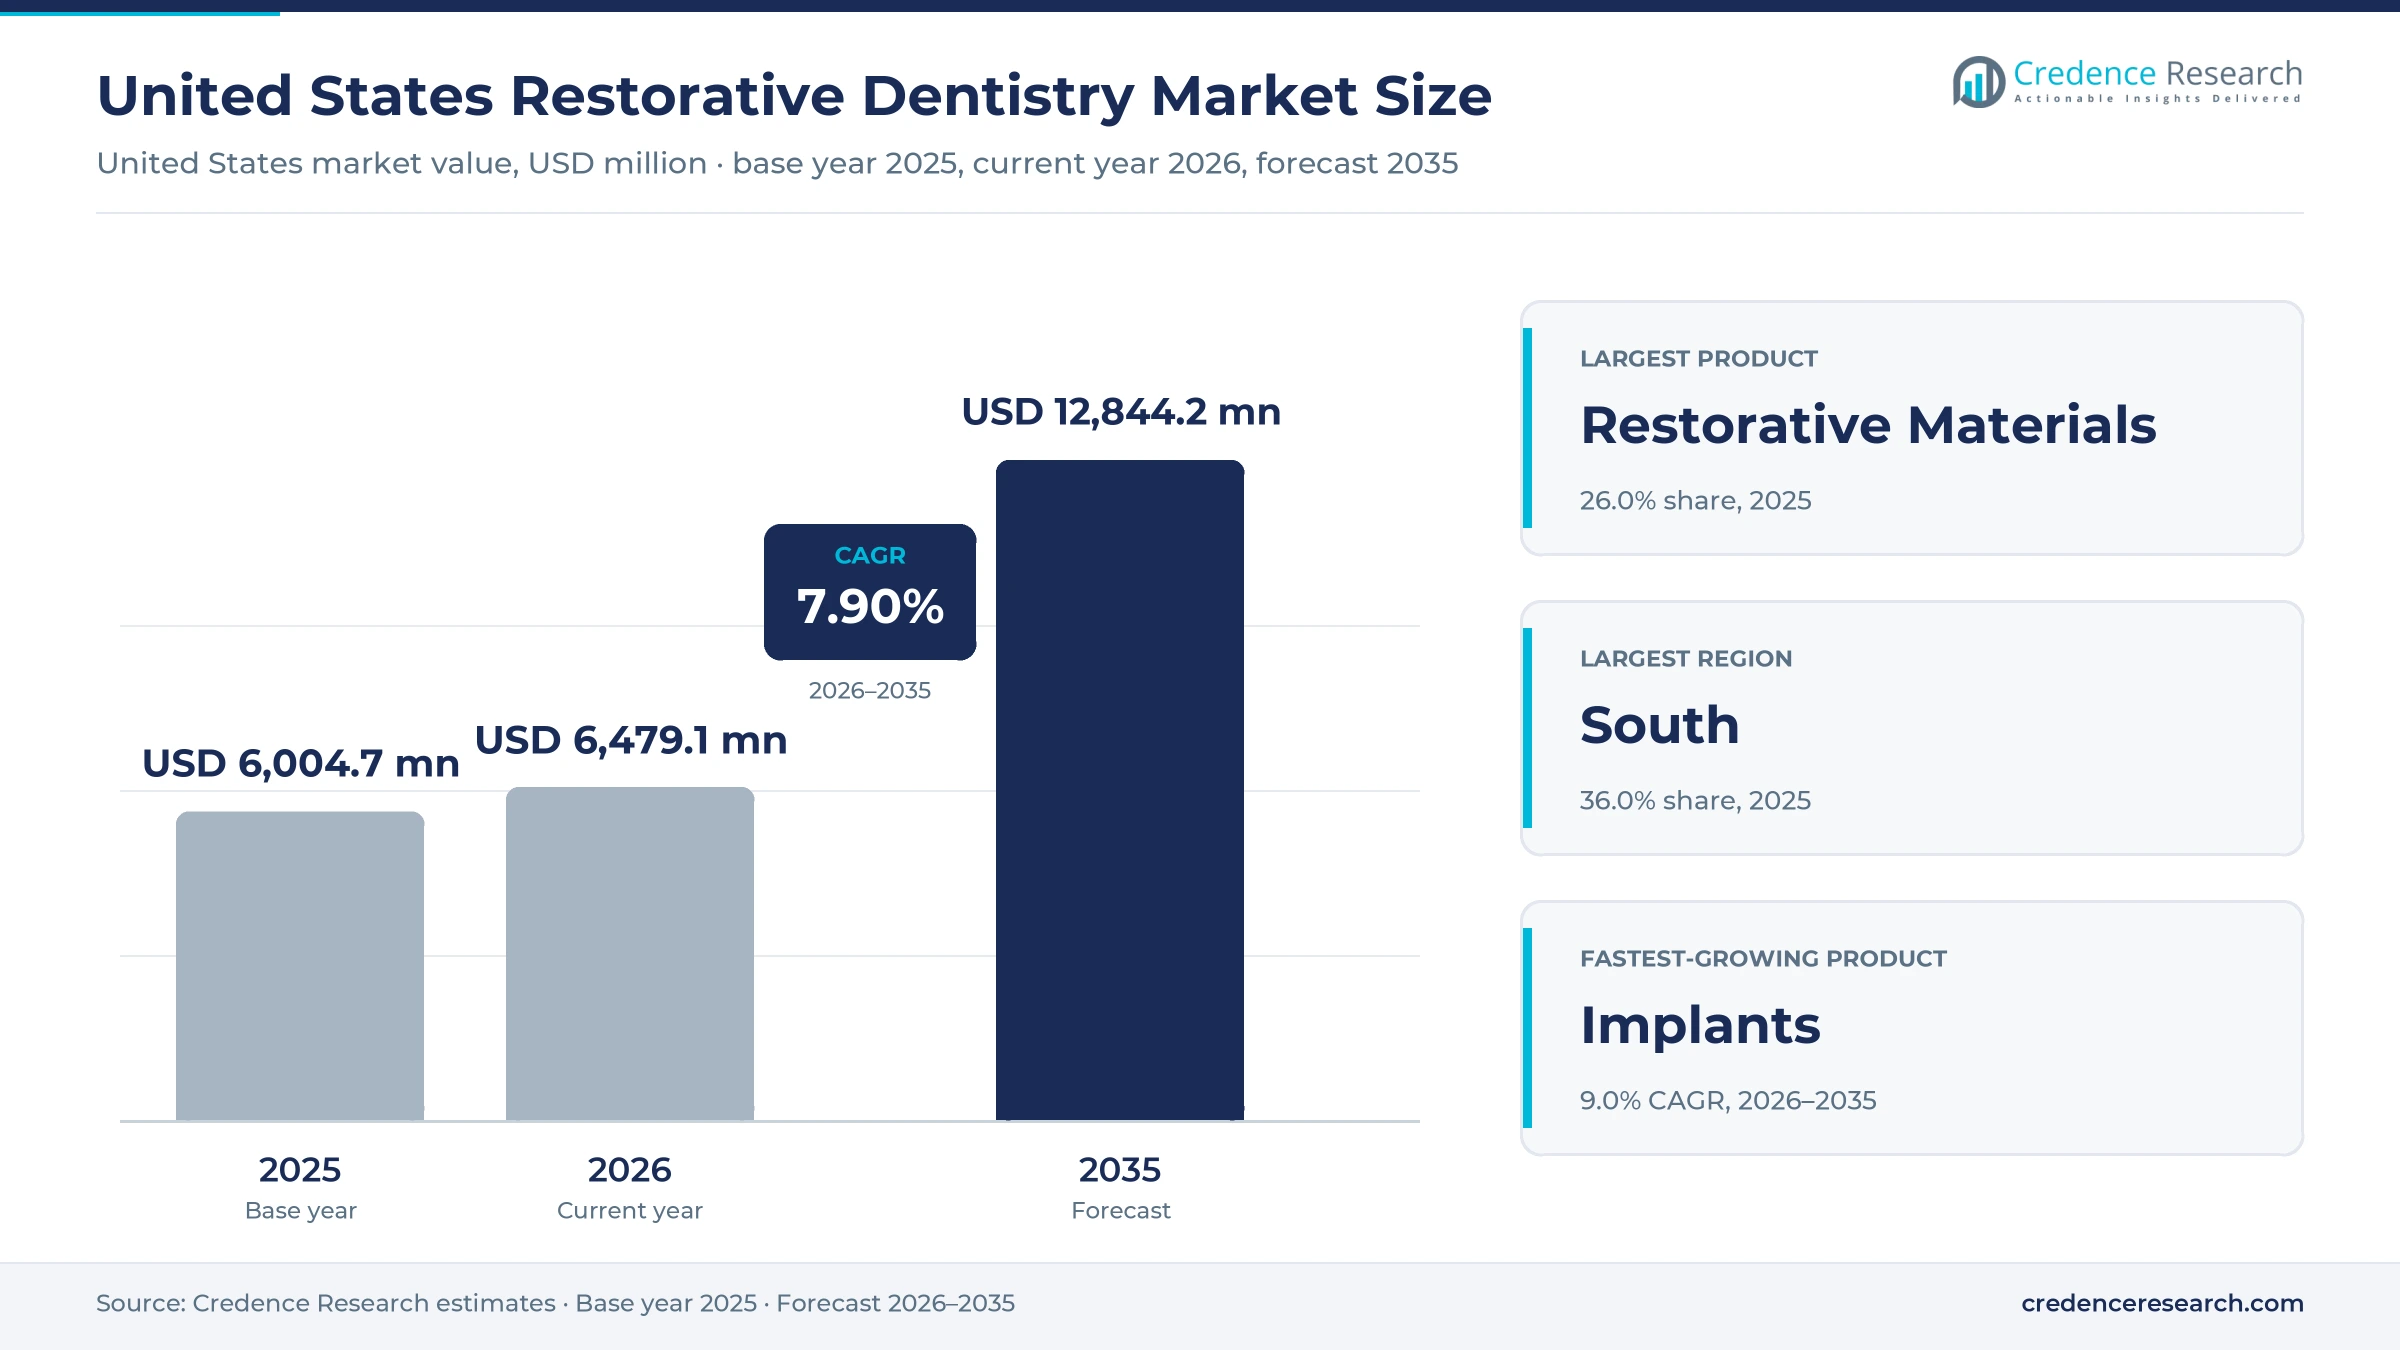
The United States restorative dentistry market was valued at USD 6.00 billion in 2025 and is projected to increase from USD 6.48 billion in 2026 to USD 12.84 billion by 2035, registering a CAGR of 7.90% during 2026–2035. Demand comes from general practices that place fillings, crowns and bridges every day, specialists who restore missing teeth with implants and dentures, and laboratories that mill and print indirect restorations. The South held the largest regional share, 36.0% in 2025, because it is home to the largest and fastest-growing population, and it is also the fastest-growing region at 8.4% a year. Product choice is shifting after parties to the Minamata Convention agreed in November 2025 to end dental amalgam use by 2034, which moves more filling volume to tooth-colored composites and glass ionomers. Chairside printing of permanent crowns, cleared by regulators for several resins in 2025 and 2026, is the next change that could move value from outside labs into the dental office.
Fillings, crowns, implants and the equipment that places them
The estimate covers direct restorative materials such as composites, glass ionomers and amalgam, indirect materials such as zirconia, lithium disilicate and metal ceramics, bonding agents, impression materials, biomaterials, dental implants and prosthetics, and restorative equipment including CAD/CAM systems, handpieces and curing lights sold in the United States. It counts purchases by dental hospitals and clinics, dental laboratories and teaching institutes.
The estimate excludes the professional fees that dentists charge patients, orthodontic aligners, preventive products and imaging systems sold without a restorative workflow. Practices buy most consumables through national distributors, while implant makers and laboratories often sell directly, and group practices increasingly negotiate central contracts.
United States Restorative Dentistry Market Insights
- The United States restorative dentistry market was valued at USD 6.00 billion in 2025 and is projected to reach USD 12.84 billion by 2035, registering a CAGR of 7.90% during 2026–2035.
- The South held a 36.0% share of 2025 value, because it gained about 1.8 million residents between 2023 and 2024 and now holds about 132.7 million people.
- Restorative materials led product demand with a 26.0% share of 2025 value, because nearly 21% of adults aged 20 to 64 have untreated decay in permanent teeth.
- SprintRay made its FDA-cleared Midas Restore resin for definitive crowns, inlays, onlays and veneers available in the United States on Sept. 1, 2026.
- Implants grow fastest at 9.0% a year, as complete tooth loss reached 19.7% of adults aged 75 and older in the 2024 CDC report.
Fillings lead on volume while implants grow fastest
Fillings lead on volume while implants grow fastest
Based on product, the market is categorized into restorative materials, implants, restorative equipment, prosthetics, impression materials, bonding agents and adhesives, and biomaterials. Restorative Materials led with a 26.0% share of 2025 value, because untreated decay keeps fillings and crowns the most frequent restorative procedures, and the CDC’s 2024 surveillance report found that about 11% of children aged 2 to 5 already had untreated decay in primary teeth. Implants grow fastest at 9.0% a year, as value fixtures such as Glidewell’s HT implant at USD 99 bring tooth replacement into general practices that once referred implant cases to specialists. Impression materials grow slowest of all products because digital scans replace trays.
Indirect materials lead while direct materials grow fastest
Based on material type, the market is categorized into indirect restorative materials and direct restorative materials. Indirect Restorative Materials led with a 58.0% share of 2025 value, because a crown carries far more material value than a filling, and Ivoclar launched IPS e.max Zirconia in May 2026 with sintering cut to 58 minutes for bridges of up to three units. Direct Restorative Materials grow fastest at 8.2% a year, as the amalgam phase-out pushes practices toward composites, shown by Kettenbach Dental expanding its Visalys Bulk Fill composite range in April 2026.
Clinics lead while laboratories grow fastest
Based on end-use, the market is categorized into dental hospitals and clinics, dental labs and research and teaching institutes. Dental Hospitals and Clinics led with a 71.0% share of 2025 value, because the 161,400 dentists employed in 2025, according to the Bureau of Labor Statistics, buy filling materials, implants and handpieces directly. Dental Labs grow fastest at 8.5% a year, as labs replace scarce hand labor with milling and printing, shown by Dandy launching a robotic stain and glaze shade process for monolithic zirconia in July 2026. Teaching institutes buy mainly for student training and clinical research.
| Segment Group | Leading Sub-segment | Share, 2025 | Fastest-growing Sub-segment | CAGR, 2026–2035 |
|---|---|---|---|---|
| By Product | Restorative Materials | 26.0% | Implants | 9.0% |
| By Material Type | Indirect Restorative Materials | 58.0% | Direct Restorative Materials | 8.2% |
| By End-use | Dental Hospitals and Clinics | 71.0% | Dental Labs | 8.5% |
Lab fees and implant parts set restoration costs
Practices pay per unit for most restorative inputs, so the price of a crown or implant case is the sum of lab fees, components and materials. National labs compete hard on crowns, and the Glidewell list prices in the table below show how low single-unit zirconia fees have fallen. Branded composites and premium implants carry higher margins than lab work. Chairside printing changes the math, because a three-pack of SprintRay Midas Restore capsules lists at USD 135, and practices can avoid a second visit. Price pressure is strongest where group practices and dental service organizations buy centrally.
| Offer | Typical price or fee | Basis |
|---|---|---|
| Full-strength zirconia crown, lab fee | USD 109 per unit, USD 89 model-free digital | Glidewell price list, 2026 |
| Lithium disilicate posterior crown, lab fee | USD 129 per unit | Glidewell price list, 2026 |
| Implant crown with custom abutment | USD 454 per unit | Glidewell price list, 2026 |
| Value implant fixture | USD 99 per implant | Glidewell HT implant, price list 2026 |
| Universal composite, 4 g syringe | USD 124.99 per syringe | Sky Dental Supply list price, 2026 |
| Printable definitive crown resin | USD 135 per three-pack of capsules | SprintRay, September 2026 |
Request a Free Sample
Fill in your details and we'll send you a free sample report.
- Sample data tables & charts
- Research methodology
Decay, aging, coverage and the amalgam exit lift spending
Untreated decay keeps filling and crown volume high
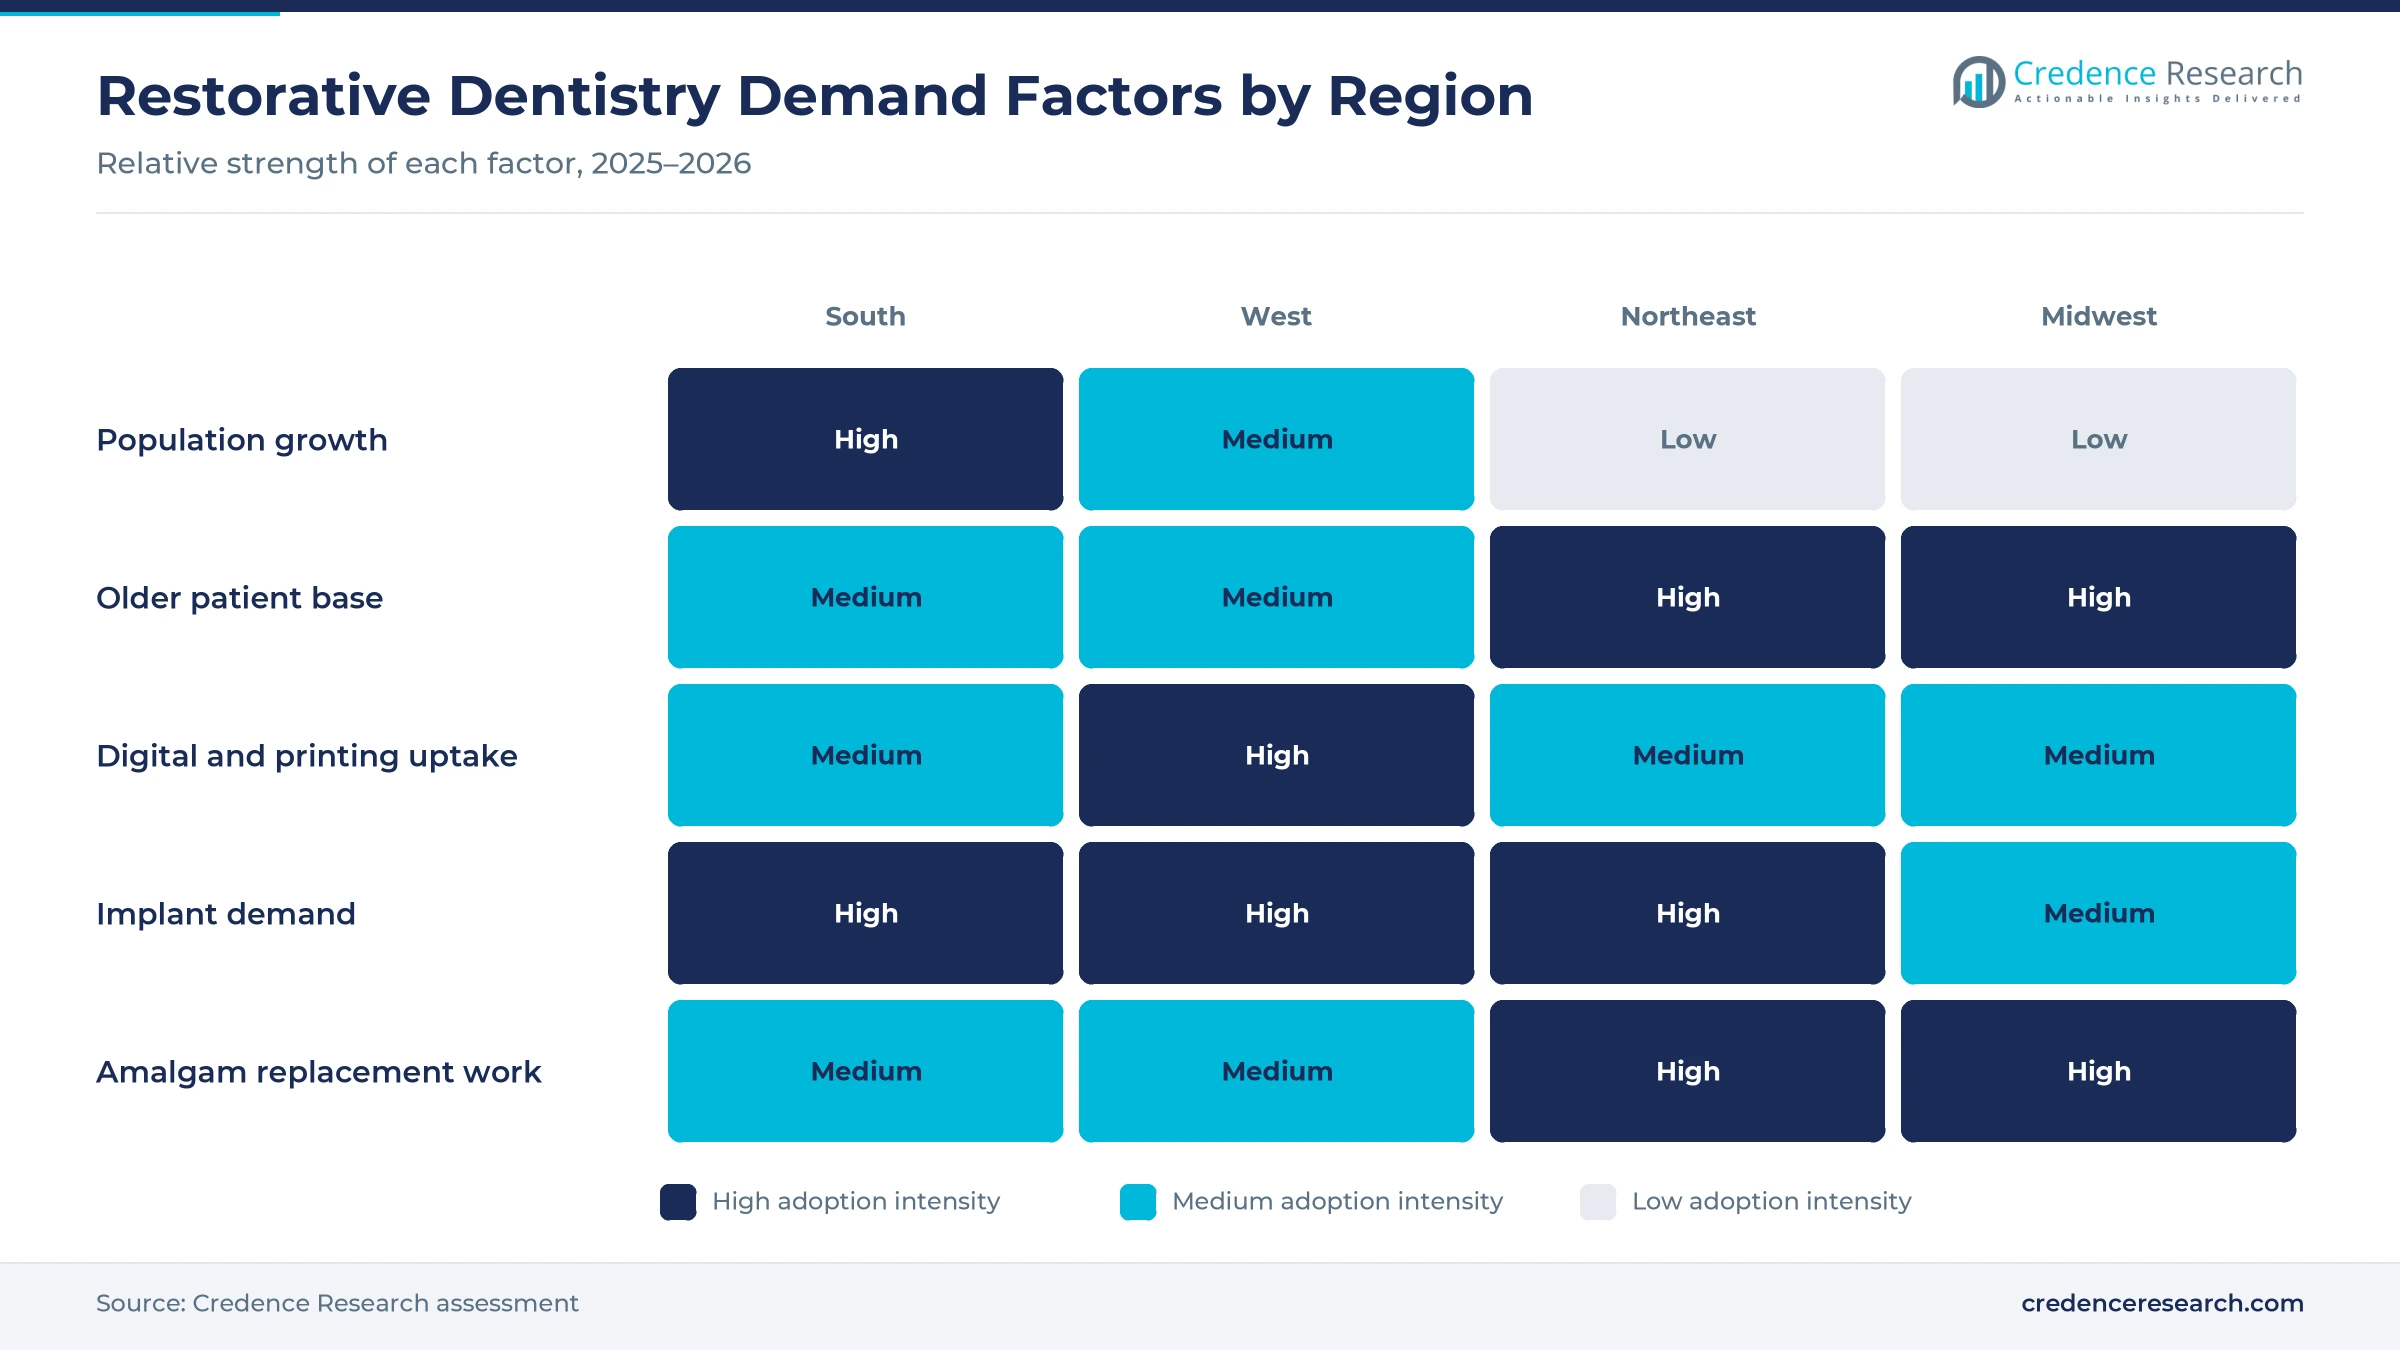
Restorative demand starts with the backlog of untreated disease, which keeps fillings and crowns at the center of daily practice. Nearly 21% of adults aged 20 to 64 had untreated decay in permanent teeth, and nearly 13% of adults aged 65 and older did, according to the CDC 2024 Oral Health Surveillance Report. The Bureau of Labor Statistics projects about 4,800 dentist openings a year through 2035 and 6% employment growth, so treatment capacity is rising slowly alongside the disease load. Material suppliers gain steady repeat volume from this base, which supports the leading share of restorative materials across practices of every size.
An older population needs more crowns, bridges and implants
Tooth loss rises steeply with age, so an aging population moves spending from small fillings toward crowns, bridges, dentures and implants. The population aged 65 and older reached 61.2 million in 2024, or 18.0% of the total, after growing 3.1% in one year, according to the Census Bureau. Complete tooth loss affects 11.4% of adults aged 65 to 74 and 19.7% of those aged 75 and older, the CDC surveillance data show. Implant-supported dentures and fixed bridges replace removable plates for many of these patients, which is why implants grow at 9.0% a year in the Credence Research estimate. Implant makers and laboratories with full-arch workflows gain most from this shift.
Wider benefit coverage brings more restorative visits
Spending on restorations depends on who pays, and public and private benefits are reaching more older adults. National dental spending reached USD 189 billion in 2024 and grew about 4% after inflation, with government programs up 9%, largely because of Medicare, according to the ADA Health Policy Institute. KFF found that 98% of enrollees in individual Medicare Advantage plans were in plans offering dental benefits in 2026. Many of those plans cover crowns or dentures, although annual dollar caps limit what each patient can use. These benefits lift treatment acceptance for prosthetics and implants among retirees, although caps steer patients toward lower-cost options.
The mercury amalgam exit moves fillings to composites
Regulators and treaty parties are pushing mercury out of fillings, which shifts volume to tooth-colored materials with higher prices per restoration. The FDA recommended on Sept. 24, 2020, that pregnant women, children under six and people with kidney or neurological disease avoid amalgam where possible, and named composite resins and glass ionomer cement as alternatives. Parties to the Minamata Convention agreed on Nov. 7, 2025, to end dental amalgam use by 2034, according to UNEP. As a result, direct materials grow at 8.2% a year in the Credence Research estimate, and makers of mercury fillings face a shrinking market.
Printed crowns, cloud scanners and lab automation spread
Chairside printing of permanent crowns is emerging
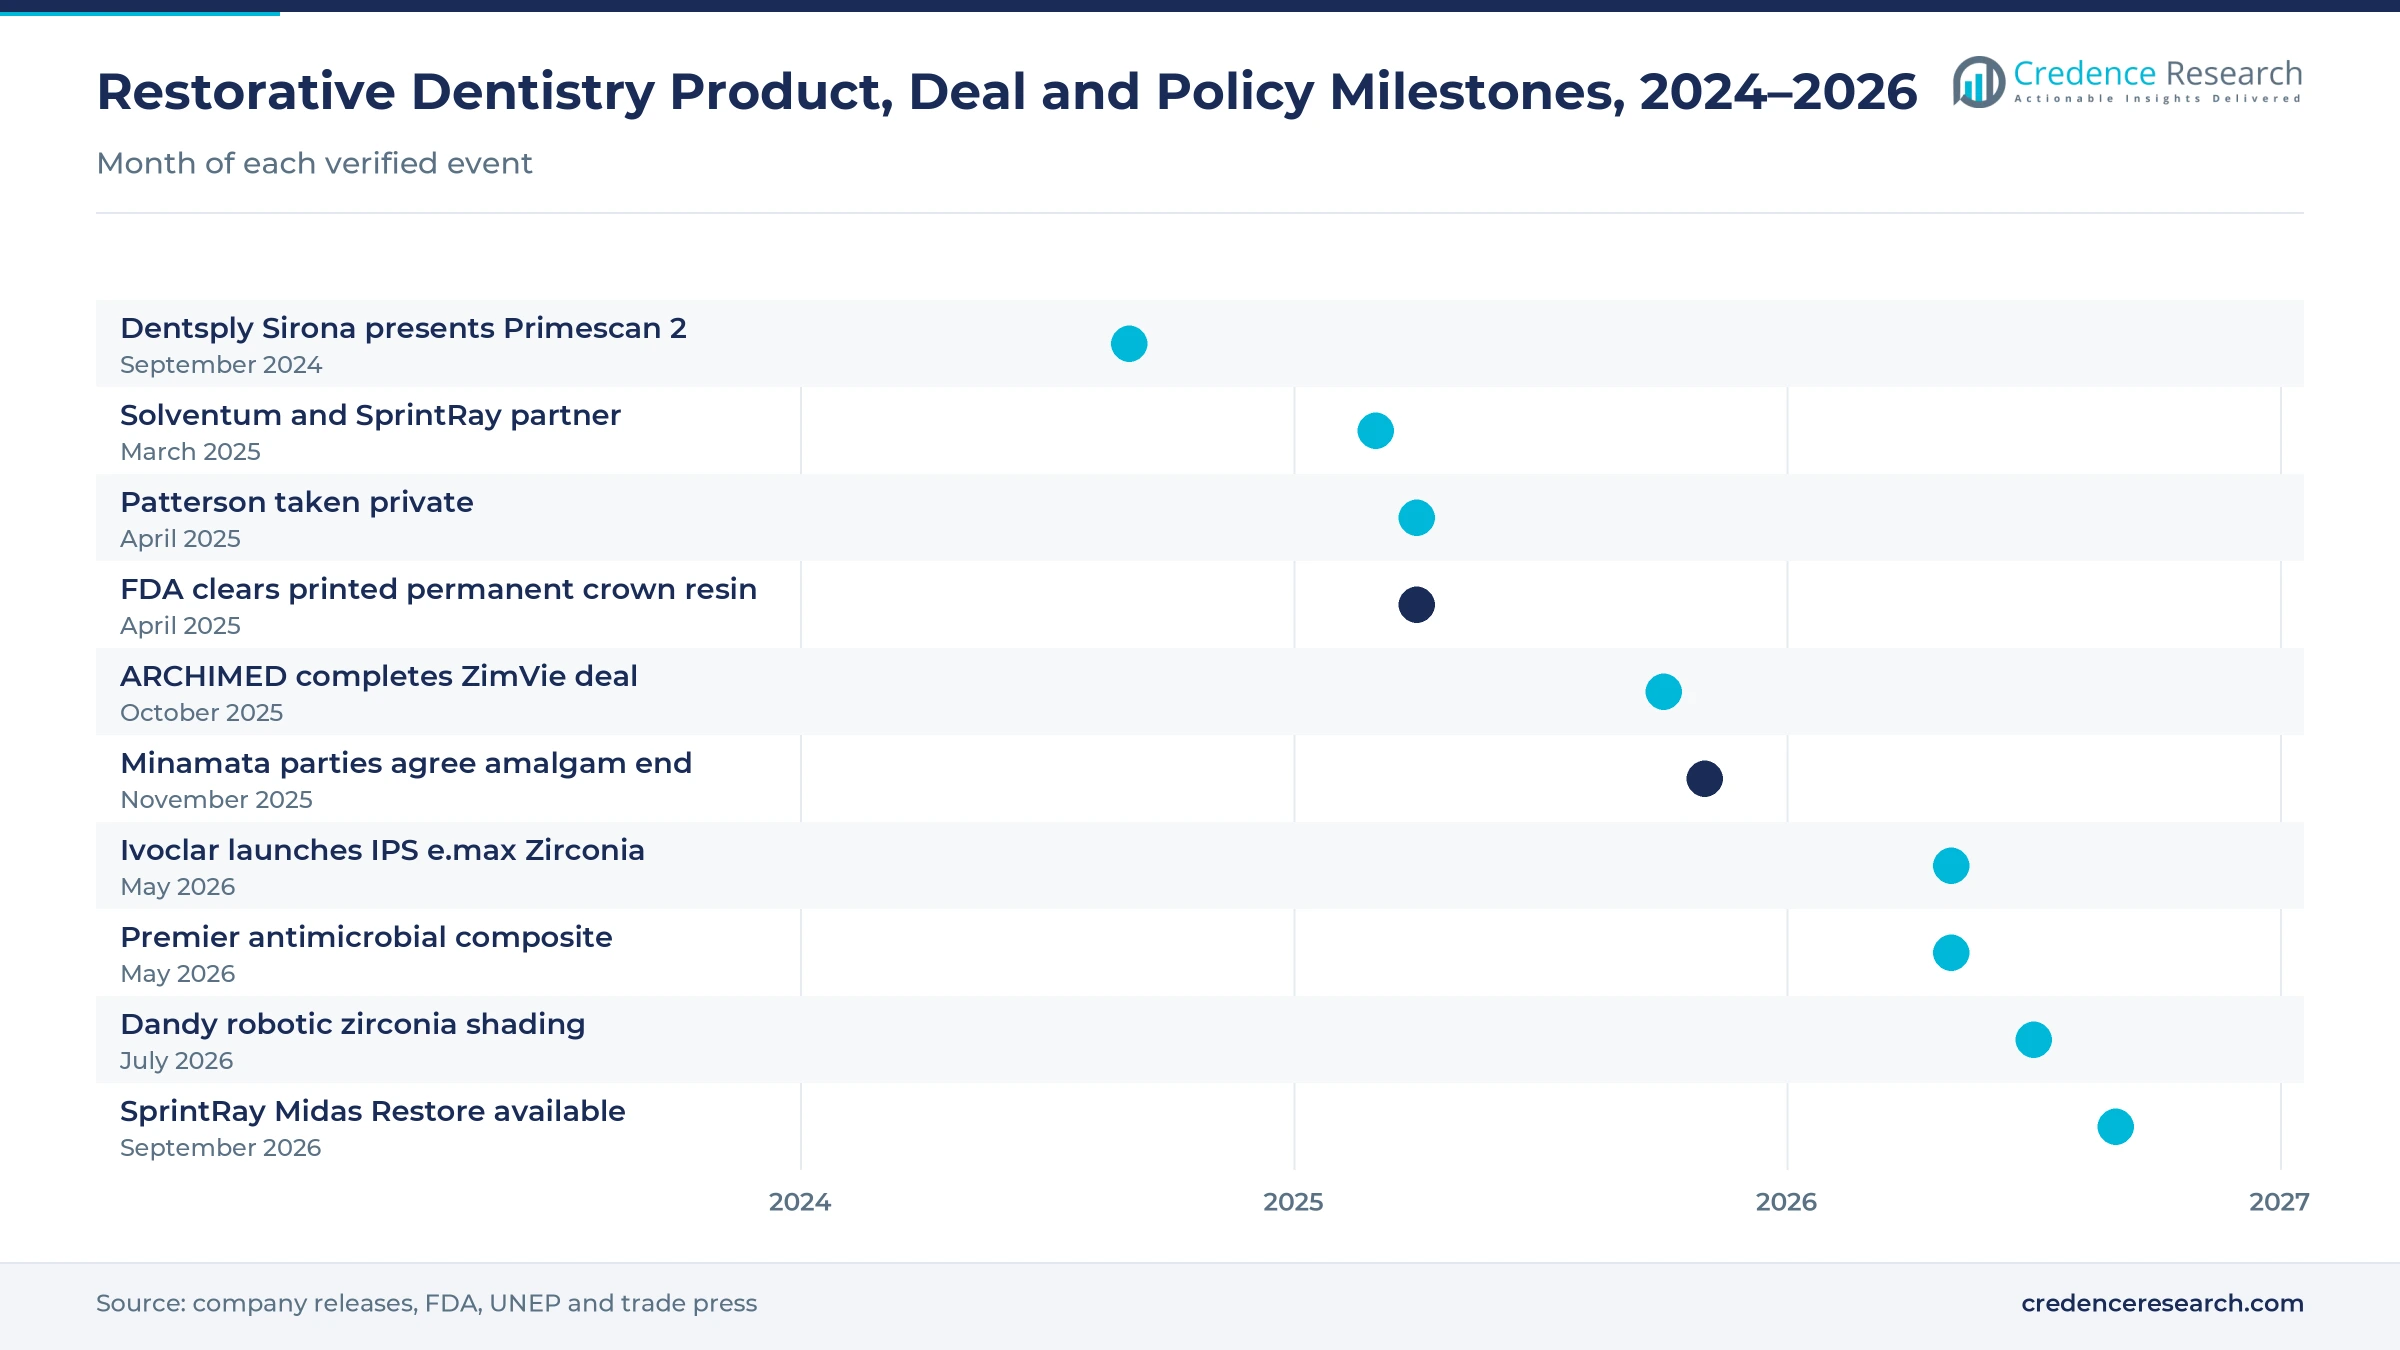
Practices are shifting toward printing permanent crowns in the office to cut lab fees and second visits, creating openings for ceramic-filled resins and compact printers across general dentistry. Aidite received FDA 510(k) clearance on April 30, 2025, for a printable resin indicated for permanent single crowns, inlays, onlays and veneers. SprintRay made its Midas Restore resin, cleared under 510(k) K260661, available in the United States on Sept. 1, 2026, and says its press prints up to three definitive crowns in ten minutes. Solventum and SprintRay signed a research and commercialization partnership in March 2025 aimed at a printed permanent crown, which is still in development. Printed crowns move material spending from outside labs to practices.
Cloud-based intraoral scanning replaces impression trays
Practices are moving from impression trays to wireless scanners whose data live in the cloud, so restorations can be designed by the practice, a lab or a manufacturer without file transfers. Dentsply Sirona presented Primescan 2 on Sept. 5, 2024, as a cloud-native scanner that requires a paid DS Core subscription to operate and completes full-arch scans in under one minute. Straumann credited new scanner technology and its iEXCEL implant system for stronger North American demand in the third quarter of 2026. About 25% of dentists planned major equipment purchases in 2026, the ADA Health Policy Institute found. Scanner subscriptions give suppliers recurring income and tie practices to their implant and material catalogs.
Antimicrobial fillings open a high-risk patient niche
High-risk patients offer suppliers an opening for fillings that resist bacterial attack at the margin, where many restorations fail. Premier Dental announced its FDA-cleared MultiMatch Flow Chameleon antimicrobial composite in May 2026, which uses nano-silica particles releasing octenidine to reduce demineralization, the company says. Nobio received FDA clearance for its Infinix antimicrobial flowable and bulk-fill composites in August 2019, Dental Products Report noted. Nearly 18% of children aged 6 to 8 had untreated decay in primary teeth, the CDC data show. Young children are among the high-risk groups in the FDA amalgam guidance above, which makes pediatric practices a natural first market. Clinical evidence that such products cut replacement rates is still limited, so suppliers that publish outcome data could win premium pricing in pediatric and geriatric practices.
Lab automation opens demand for milling and sintering systems
Laboratories face a shrinking technician workforce, which opens a market for faster zirconia, milling and printing systems that let fewer people produce more units. The Bureau of Labor Statistics counted about 34,400 dental laboratory technician jobs in 2025 and projects a 6% decline by 2035 as 3D printing and other labor-saving tools spread. Ivoclar’s faster-sintering zirconia, noted in the segment analysis, targets exactly this labor gap. The Dandy shading robot noted in the segment analysis shows labs automating even the finishing steps once done by hand. Equipment and material suppliers that shorten lab cycle times gain share among dental laboratories that compete on turnaround.
Tariffs, cost squeeze and benefit caps restrain buying
Tariffs raise costs for imported implants and equipment
A large part of the implants, ceramics and devices sold in the United States is imported, so tariffs pass quickly into costs. Dentsply Sirona raised its estimate of the annual tariff cost to its business, Dental Tribune International reported in September 2025, while Envista relied on local production and pricing to offset duties. Importers without U.S. plants are most exposed, including value implant lines that Straumann still makes in Brazil, and practices may delay equipment orders.
How does the practice cost squeeze slow purchases?
Practice owners are spending more on supplies while revenue barely keeps pace, which slows discretionary buying. Equipment and supply costs rose 5% after the start of 2025, and one-third of dentists reported insufficient patient volume in the fourth quarter, according to the ADA Health Policy Institute. Solo practices are most exposed, so they defer scanners and mills and buy lower-priced composites and value implants instead. More than one-third of dentists also planned to drop some insurance networks in 2026, shifting patients toward self-pay.
Benefit gaps limit care for low-income adults
Low-income adults often cannot afford crowns or implants, because public coverage for them is thin and uneven. In 21 states Medicaid dental coverage reaches only specific adult groups, and 10 states covered no extractions for the largest adult group at the end of 2024, CareQuest Institute reported in July 2025. Practices in those states see more extractions than restorations, which limits demand for implants and prosthetics. Makers of value implants and dentures are most exposed, because they rely most on lower-income patients.
Flat distributor sales show weak consumables demand
Distributor data show that routine consumables demand has barely grown, which caps volume for material makers. Henry Schein described U.S. dental merchandise demand as nearly flat and equipment sales as unchanged in its February 2026 full-year results. Material suppliers without implant or digital products are most exposed, because price increases rather than unit volume carry their sales. Unchanged equipment sales also suggest that practices are delaying chair, handpiece and curing light upgrades.
The South leads on population while the Northeast trails
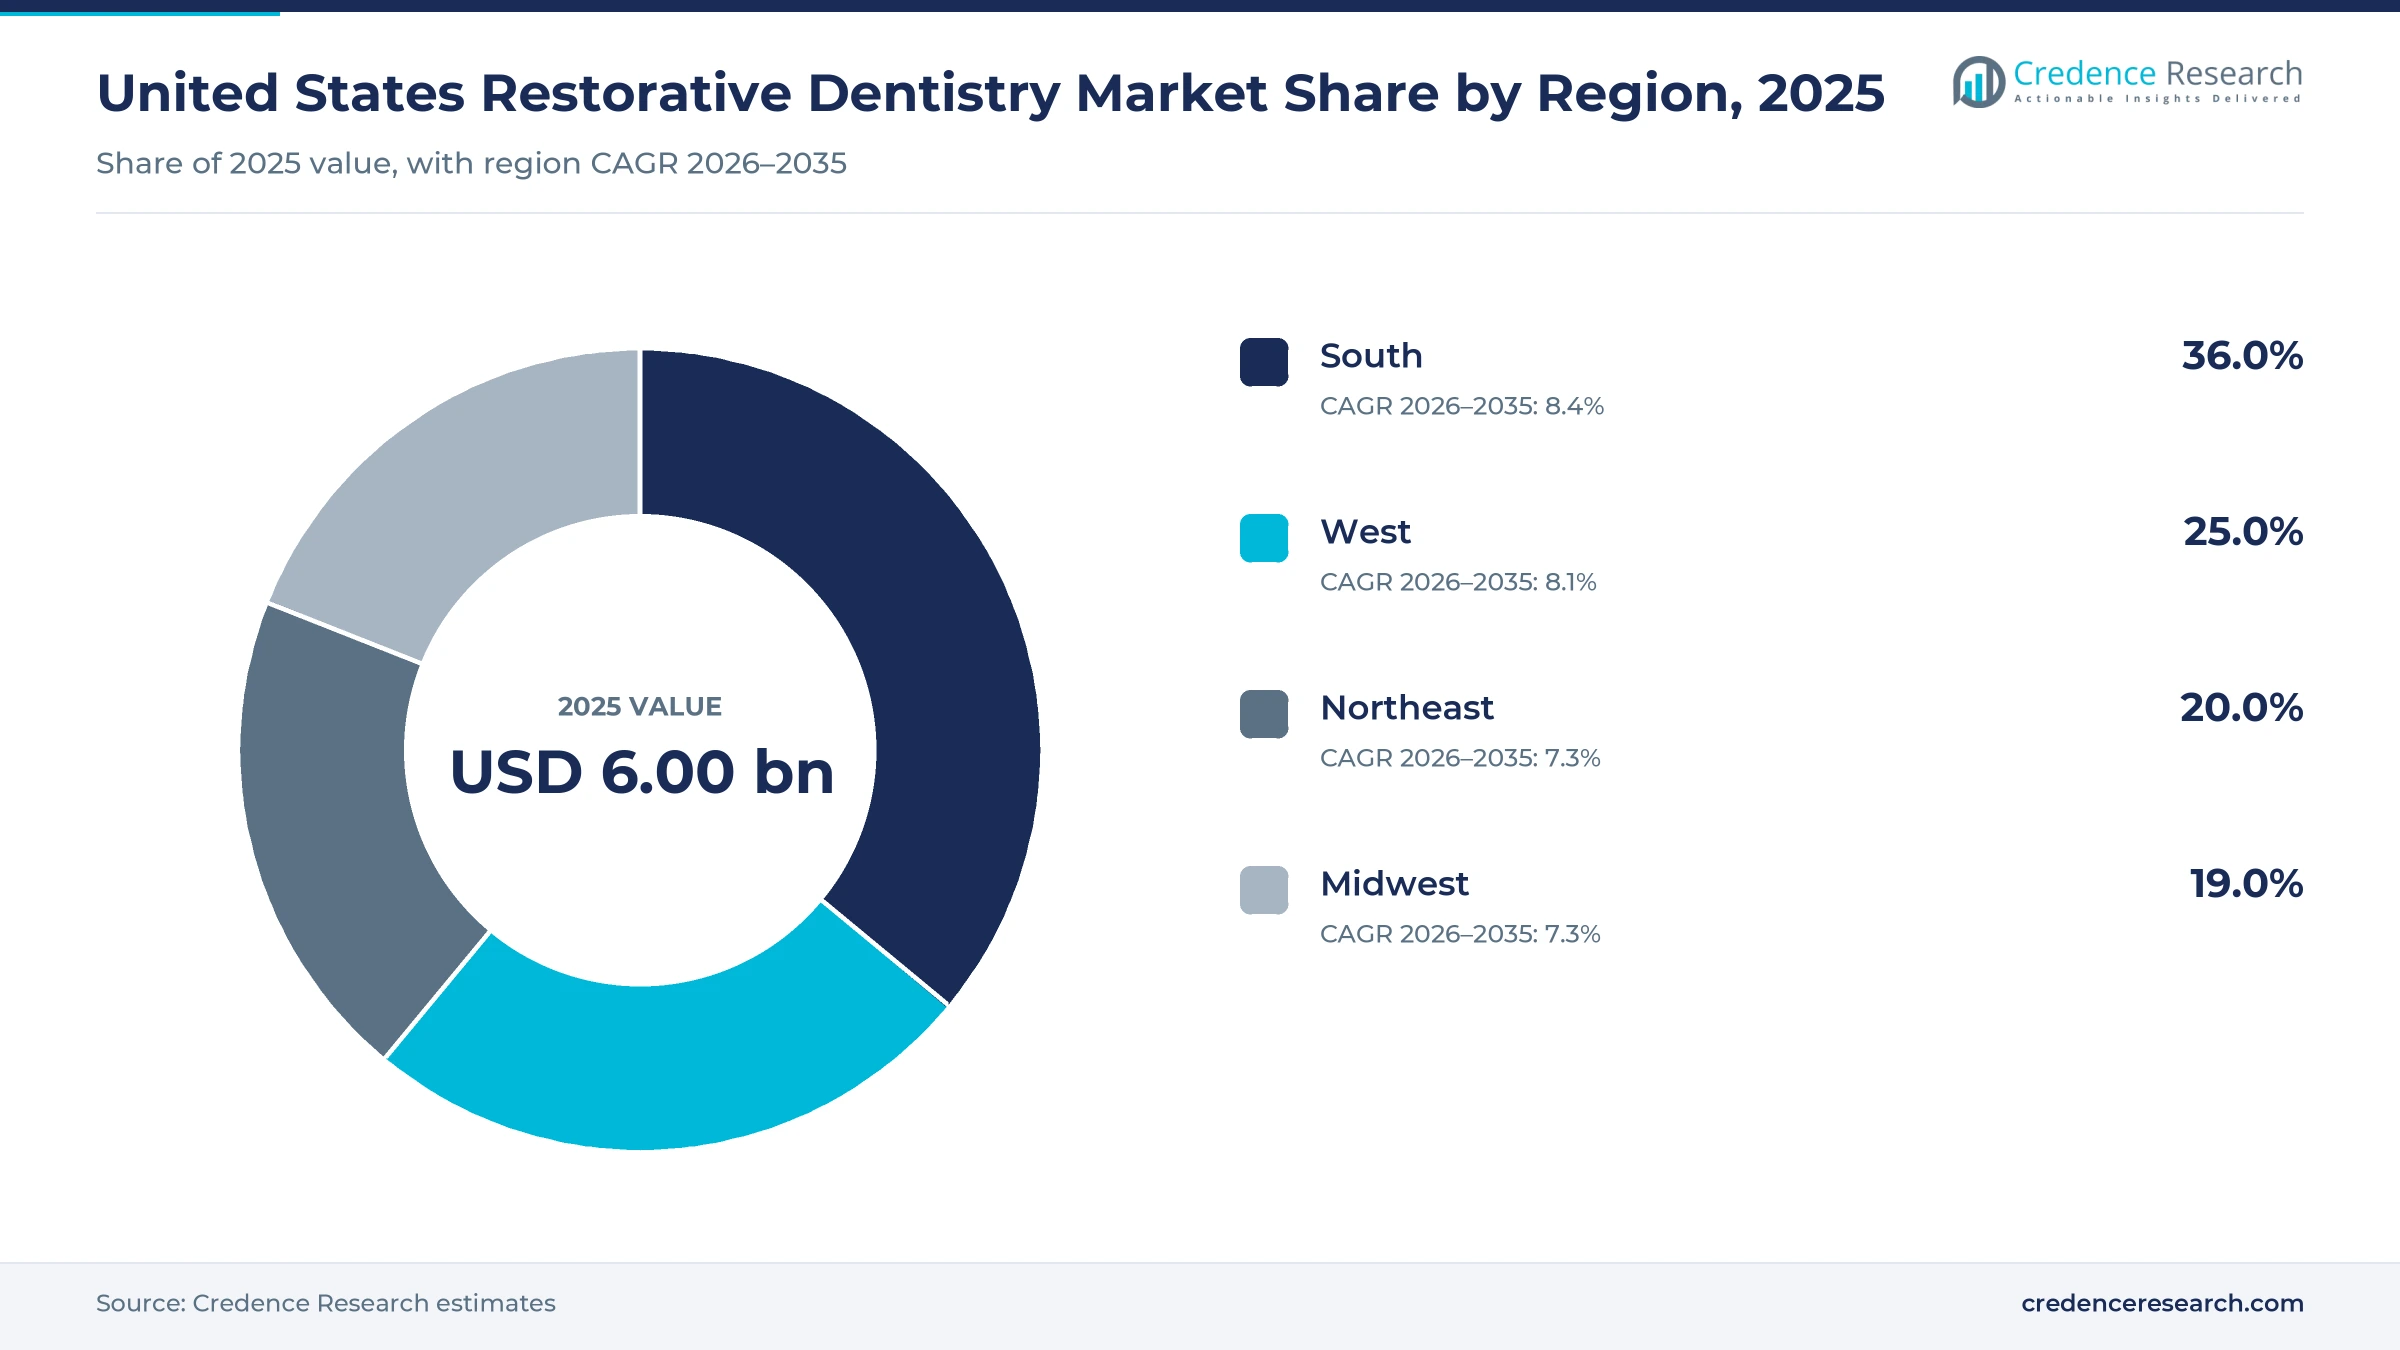
The United States restorative dentistry market is split into the four Census regions, from the South, the largest and fastest-growing by population, to the Northeast, where growth is slowest. Regional shares and growth rates are Credence Research estimates based on Census population and growth data and the distribution of dental practices.
| Region | Value, 2025 (USD billion) | Share, 2025 | CAGR, 2026–2035 |
|---|---|---|---|
| South | 2.16 | 36.0% | 8.4% |
| West | 1.50 | 25.0% | 8.1% |
| Northeast | 1.20 | 20.0% | 7.3% |
| Midwest | 1.14 | 19.0% | 7.3% |
Population growth keeps the South in front
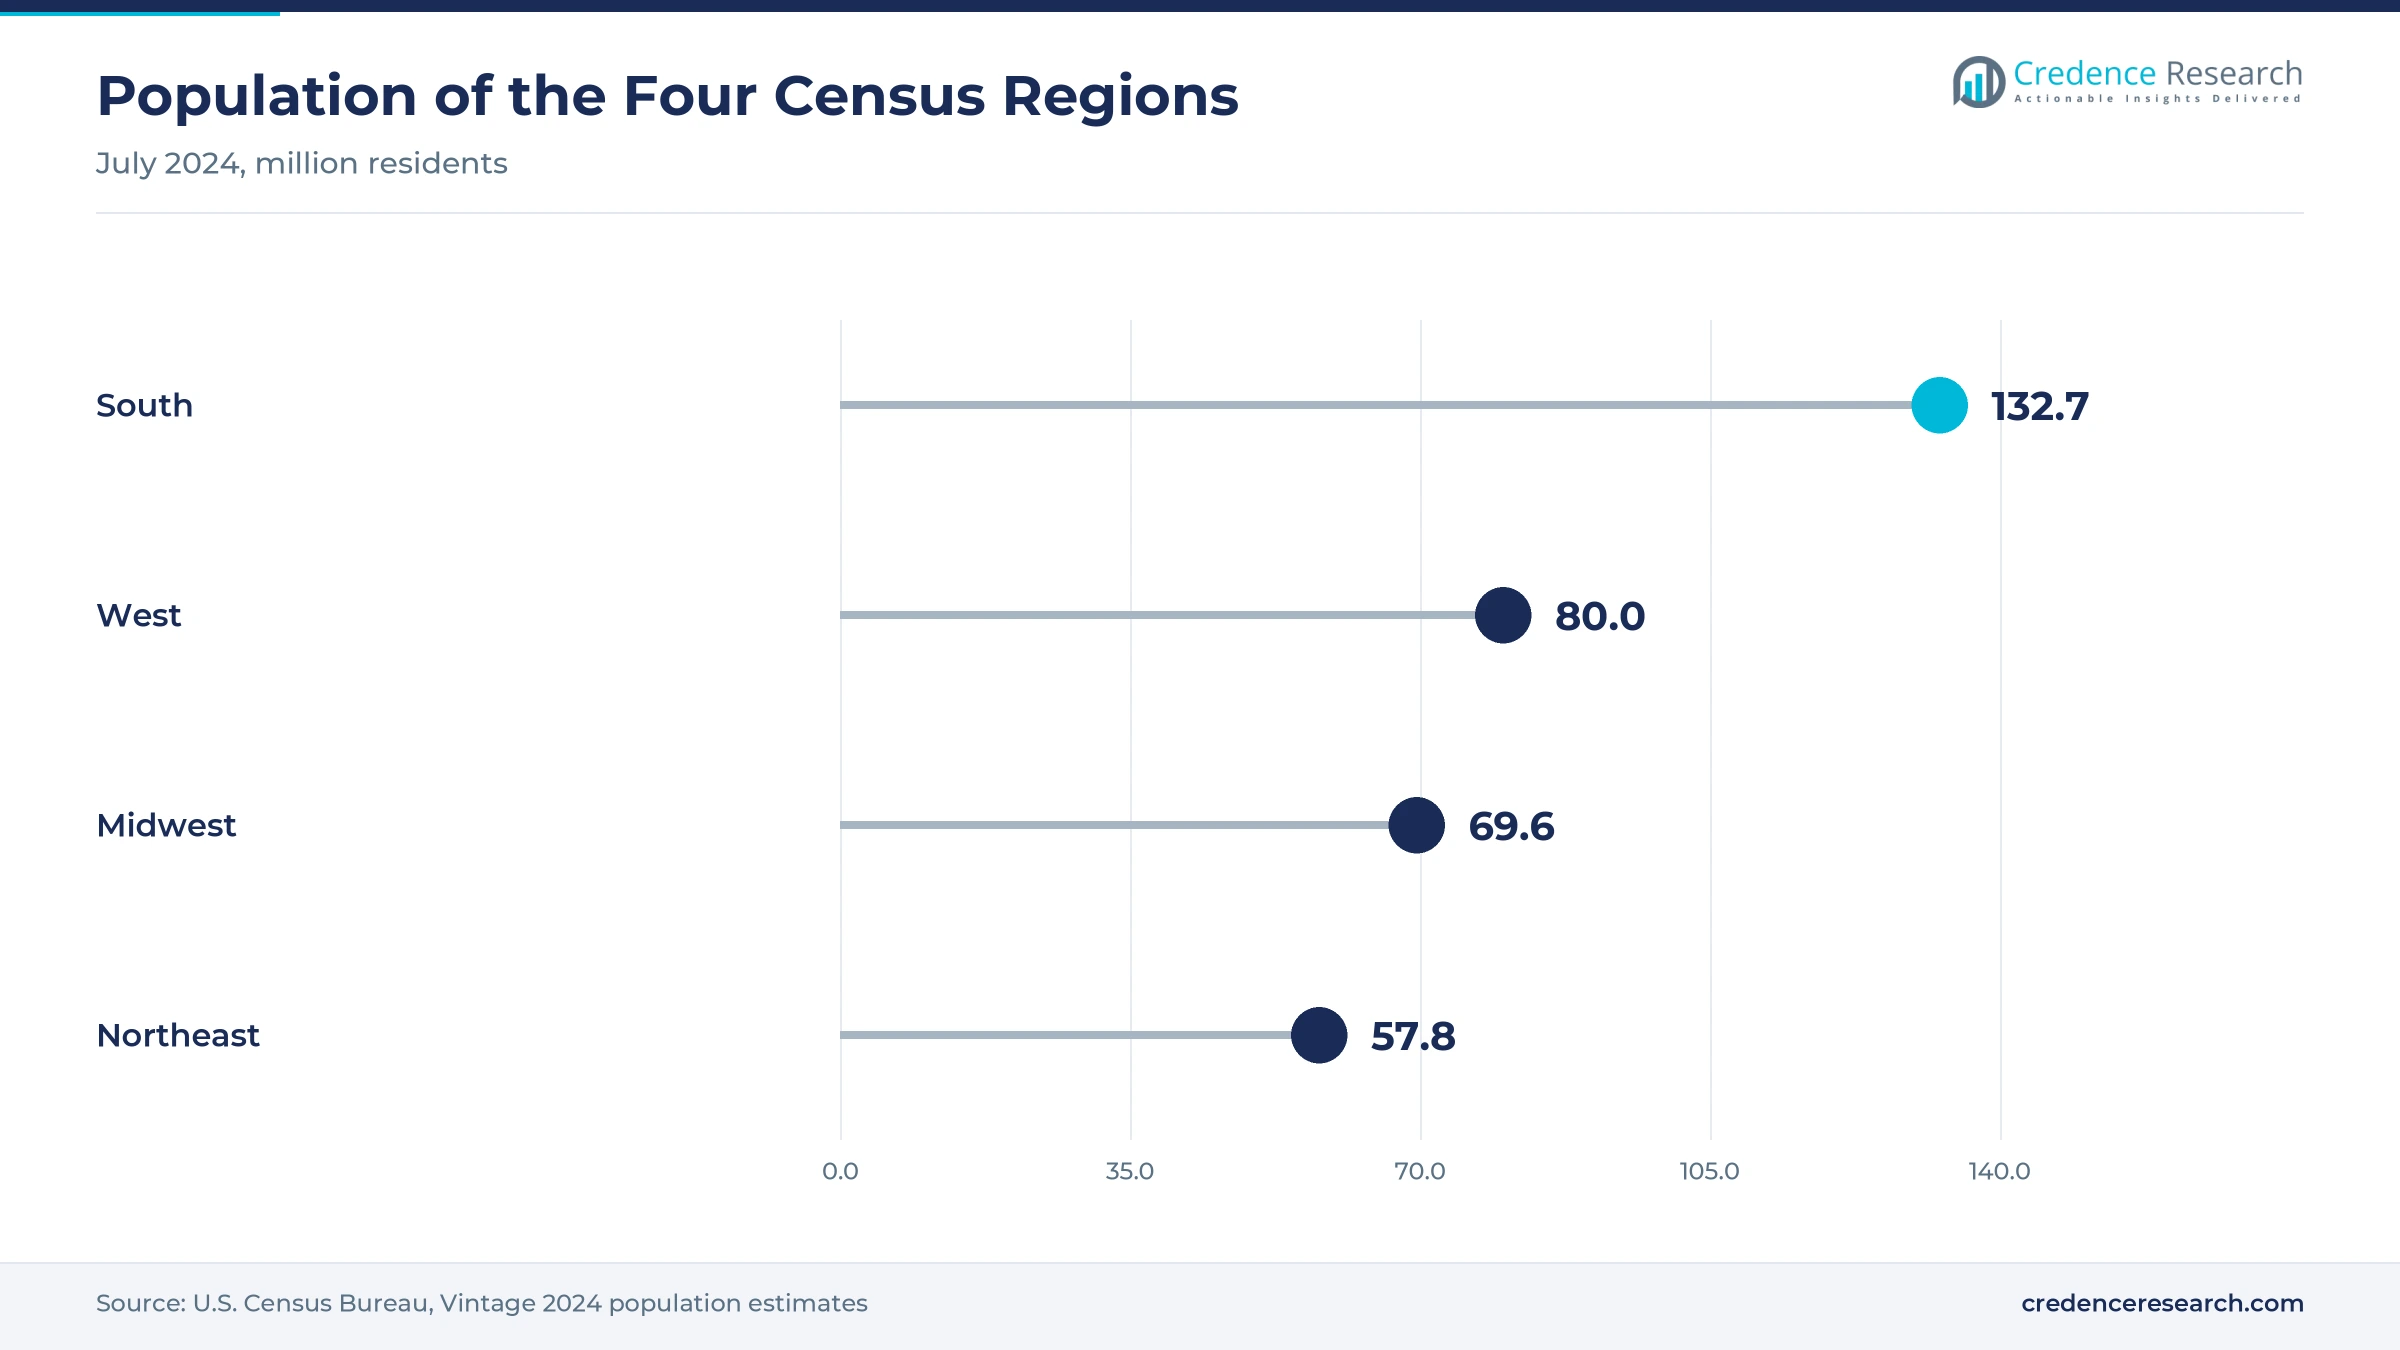
The South held a 36.0% share of 2025 value and grows fastest at 8.4% a year in the regional model. The region gained about 1.8 million residents between 2023 and 2024, a 1.4% rise, and reached about 132.7 million people, according to the Census Bureau. New residents and retirees create first-time restorative demand in growing suburbs, where group practices open new offices. Suppliers that serve these expanding group networks gain most of the new volume.
Lab capacity and digital uptake lift the West
The West held a 25.0% share of 2025 value and grows at 8.1% a year. Its population reached 80.0 million in 2024 after growing 0.9%, the Census Bureau reported. Large Western laboratories such as Glidewell in Irvine, California, mill and print crowns at national scale, so practices in the region have early access to low-cost digital lab work. Credence Research attributes the West’s slightly faster-than-national growth to that lab base and early uptake of digital workflows rather than to population growth.
Dense practices hold the Northeast but growth is slow
The Northeast held a 20.0% share of 2025 value and grows at 7.3% a year, the slowest rate in the regional model alongside one other region. Its population of about 57.8 million grew 0.76% between 2023 and 2024, according to the Census Bureau. In the Credence Research assessment, its long-established practices spend more on replacing old crowns, bridges and amalgam fillings than on first-time care. Implant cases for older patients keep value per visit high.
Slow population gains keep the Midwest steady
The Midwest held a 19.0% share of 2025 value and grows at 7.3% a year. Its population reached about 69.6 million in 2024 after growing 0.6%, the slowest regional rate the Census Bureau reported. Smaller towns rely on general dentists who place both fillings and implants, which favors suppliers with training programs and value implant lines. Medicaid adult coverage varies widely across the region, which shapes demand for prosthetics.
Take-private deals and new ceramic and composite launches
| Development | Status and market relevance |
|---|---|
| In April 2025, Patient Square Capital completed its acquisition of Patterson Companies, the dental supplies distributor. | Completed acquisition, Patterson now privately held |
| In October 2025, ARCHIMED completed its acquisition of ZimVie, the maker of dental implants, biomaterials and digital workflow tools. | Completed acquisition, ZimVie delisted from Nasdaq |
| In May 2026, Ivoclar launched IPS e.max Zirconia for restorations from thin veneers to wide-span bridges. | Commercial launch for dental technicians |
| In May 2026, Premier Dental announced the MultiMatch Flow Chameleon antimicrobial composite with BioArmor technology. | FDA-cleared product launch |
| In September 2026, SprintRay made its Midas Restore definitive crown resin available in the United States. | FDA 510(k) cleared, commercial availability |
Zirconia, printed ceramics and cloud scanning reshape care
- Monolithic zirconia gives laboratories a strong, tooth-colored crown that can be milled in one piece, which has displaced much of the metal-ceramic work once done by hand.
- Ceramic-filled printing resins let practices print permanent crowns, inlays and veneers in minutes, moving work that once went to outside laboratories into the office.
- Cloud-native intraoral scanners send digital impressions straight to design software, so practices, labs and implant makers can share one file without trays or shipping.
- Antimicrobial and bulk-fill composites aim to cut chair time and recurrent decay at filling margins, which matters most for patients at high risk of caries.
Need a Custom Version of This Report?
Tailor the scope, geography, or segments to your exact requirements.
- Custom geography or segment scope
- Direct access to our analyst team
Implant makers and material houses compete for DSO volume
Competition centers on control of the full restorative workflow, from scan to final crown or implant. Straumann and Envista lead premium implant systems, while ZimVie, now owned by ARCHIMED, and Glidewell compete with value and lab-linked implant lines. Dentsply Sirona sells scanners, CEREC milling, implants and materials, and ties practices to its DS Core cloud platform. Solventum, Ivoclar, GC, Kulzer, COLTENE and Septodont compete in composites, cements, bonding agents and glass ionomers, where clinician habit and distributor shelf space matter. SprintRay is pushing printed definitive crowns into the general practice. Group practices and dental service organizations increasingly negotiate national contracts, which rewards suppliers that can offer a broad catalog, training and digital integration under one agreement.
How is the supplier base organized?
Supply is concentrated in implants and equipment and more fragmented in materials and lab work. A handful of multinational groups, Dentsply Sirona, Straumann, Envista, Solventum and Ivoclar, sell across implants, materials and digital systems, while GC, Kulzer, COLTENE and Septodont specialize in direct materials. Two large distributors move most consumables, and Patterson has been privately held since April 2025. Entry barriers are FDA clearance, clinician training and access to distributor shelves. Margins sit in premium implants and proprietary materials, while lab crowns are a low-price, high-volume business.
Which suppliers do U.S. practices and labs shortlist?
| Company | Type | Role in the market |
|---|---|---|
| Dentsply Sirona | Full-line supplier | Scanners, CEREC milling, implants, composites and endodontic and restorative consumables |
| Institut Straumann AG | Implant specialist | Premium and value implant systems, scanners and digital prosthetic services |
| Envista Holdings Corporation (Nobel Biocare, Kerr) | Full-line supplier | Nobel Biocare implants and Kerr composites, cements and restorative consumables |
| Solventum | Materials specialist | Filtek composites, Scotchbond adhesives and RelyX cements for direct and indirect restorations |
| Ivoclar Vivadent AG | Materials specialist | IPS e.max ceramics, zirconia, composites and lab furnaces |
| ZimVie (ARCHIMED) | Implant specialist | Dental implants, biomaterials and digital workflow tools for tooth replacement |
| GC Corporation | Materials specialist | Glass ionomers, composites and impression materials |
| Mitsui Chemicals, Inc. (Kulzer) | Materials specialist | Kulzer Venus composites, impression materials and denture materials |
| COLTENE Holding AG | Materials specialist | Composites, impression materials and rotary instruments for restorative work |
| Septodont Holding | Materials specialist | Biodentine dentin substitute, glass ionomers and restorative consumables |
| Glidewell | Laboratory and implant maker | Zirconia crowns, dentures and value HT implants from its Irvine laboratory |
| SprintRay | Digital equipment specialist | Chairside 3D printers and FDA-cleared resins for definitive crowns |
Why implants and chairside printing gain most
Credence Research's view is that the next decade of value growth will come less from filling volume and more from implants and digital crowns, because an older population needs tooth replacement and printing lets practices keep crown work in-house. Implant makers with value lines, scanner integration and training gain most, while suppliers that depend on routine consumables face flat distributor volume. The pace of printed crown acceptance is the largest uncertainty, because long-term clinical data on these resins are still thin, so laboratories keep a strong position for complex cases.
Distributor data and spending statistics anchor the estimate
The report uses 2025 as the base year on a calendar basis, and market values come from the Credence Research model. The earlier 2023 estimate was carried forward to 2025 at its own growth rate and checked against distributor disclosures, national dental spending and supplier growth rates, which supported it. Segment splits and regional shares are Credence Research estimates from public data. Sources used are CDC, Census Bureau, BLS and FDA data, ADA Health Policy Institute research, company filings and releases, published price lists and trade press, and no interviews or surveys were conducted.
Implants and digital workflows carry growth to 2035
The United States restorative dentistry market is expected to reach USD 12.84 billion by 2035, registering a 7.90% CAGR during 2026–2035, as an aging population replaces lost teeth and practices move fillings from amalgam to composites. Growth should be strongest in implants, direct materials and laboratory work, because tooth loss, the 2034 amalgam deadline and automation each add value per case. Tariffs and benefit caps could slow some years, and printed crowns could shift value from labs to practices faster than expected. Laboratories that automate milling, sintering and shading should keep complex cases even as simple crowns move chairside.
What decides the range of outcomes to 2035?
The base case assumes steady implant growth among older patients and a gradual move to composites and digital crowns. The downside case follows higher tariffs on imported implants and devices together with cuts to Medicaid and Medicare Advantage dental benefits, which would push patients toward extractions and removable dentures. The upside case needs chairside printed crowns to win clinical acceptance and benefit caps to rise.
| Scenario | CAGR, 2026–2035 | Value, 2035 | What has to hold |
|---|---|---|---|
| Downside | 6.3% | USD 11.23 billion | Higher tariffs and benefit cuts delay implant cases and equipment purchases |
| Base | 7.90% | USD 12.84 billion | Implant demand rises with aging and fillings shift steadily to composites |
| Upside | 9.2% | USD 14.31 billion | Printed permanent crowns gain acceptance and dental benefit caps rise |
Frequently Asked Questions
How big is the United States restorative dentistry market?
Which product holds the largest share of U.S. restorative dentistry spending?
What counts as restorative dental materials?
Are bioactive and antimicrobial fillings available in the United States?
Is dental amalgam being phased out in the United States?
Where do regenerative and biomaterial products fit in the market?
Which region leads the United States restorative dentistry market?
Which companies lead the U.S. restorative dentistry market?
Table of Content
Chapter 1 Market Segmentation
- 1.1 Segmentation Framework
- 1.1.1 Product and Service Classification
- 1.1.2 Application and End-Use Classification
- 1.1.3 Technology and Solution Classification
- 1.1.4 Customer and Distribution Channel Classification
- 1.1.5 Geographic Segmentation
- 1.1.6 Market Segment Definitions and Boundaries
- 1.2 By Product
- 1.2.1 Restorative Materials
- 1.2.2 Implants
- 1.2.3 Restorative Equipment
- 1.2.4 Prosthetics
- 1.2.5 Impression Materials
- 1.2.6 Bonding Agents and Adhesives
- 1.2.7 Biomaterials
- 1.3 By Material Type
- 1.3.1 Indirect Restorative Materials
- 1.3.2 Direct Restorative Materials
- 1.4 By End-use
- 1.4.1 Dental Hospitals and Clinics
- 1.4.2 Dental Labs
- 1.4.3 Research and Teaching Institutes
Chapter 2 Introduction
- 2.1 Report Objectives and Scope
- 2.2 Product Definition and Industry Terminology
- 2.3 Market Inclusions and Exclusions
- 2.4 Research Process
- 2.4.1 Primary Research and Expert Interviews
- 2.4.2 Secondary Research and Source Review
- 2.4.3 Top-Down and Bottom-Up Estimation
- 2.4.4 Data Triangulation and Verification
- 2.5 Market Size Measurement Basis
- 2.5.1 2025: USD 6.00 billion → 2035: USD 12.84 billion
- 2.6 Historical and Forecast Reference Periods
- 2.6.1 Historical Period: 2018-2025
- 2.6.2 Base Year: 2025
- 2.6.3 Forecast Period: 2025-2035
- 2.7 Research Assumptions and Limitations
Chapter 3 Executive Summary
- 3.1 Market Snapshot and Key Findings
- 3.2 Base-Year Market Size, 2025
- 3.3 Forecast Market Size, 2035
- 3.4 Revenue and Volume Growth Outlook
- 3.5 Key Demand and Supply Indicators
- 3.6 Leading Market Segments
- 3.7 Fastest-Growing Market Opportunities
- 3.8 Regional Performance Highlights
- 3.9 Technology and Industry Transformation
- 3.10 Competitive Landscape Summary
- 3.11 Analyst View and Strategic Implications
Chapter 4 United States Restorative Dentistry Market Trends and Developments
- 4.1 Historical Industry Development, 2018-2025
- 4.2 Recent Market Trends and Developments
- 4.3 Demand and Customer Behavior Trends
- 4.4 Technology and Product Innovation
- 4.5 Artificial Intelligence, Automation and Digitalization
- 4.6 Local Manufacturing and Supply Chain Realignment
- 4.7 Industry Partnerships, Mergers and Acquisitions
- 4.8 Sustainability and Circular Economy Developments
- 4.9 Government and Private Sector Investment Trends
- 4.10 Emerging Business Models and Commercialization
- 4.11 Industry Developments and Announcements
Chapter 5 United States Restorative Dentistry Market Production, Supply and Demand Analysis
- 5.1 Demand Trend and Consumption Analysis, 2018-2025
- 5.2 Demand Forecast, 2025-2035
- 5.3 Production and Output Trend, 2018-2025
- 5.4 Production and Output Forecast, 2025-2035
- 5.5 Installed Capacity and Capacity Utilization
- 5.6 Company-Wise Production Plants and Statistics
- 5.6.1 Installed Production Capacity
- 5.6.2 Actual Production
- 5.6.3 Planned Capacity and Expansion Targets
- 5.7 Supply Chain Structure and Procurement Trends
- 5.8 Supply-Demand Gap and Bottlenecks
- 5.9 Import Dependence and Sourcing Structure
- 5.10 Contract Manufacturing and Outsourcing
- 5.11 Regional Supply and Demand Concentration
Chapter 6 United States Restorative Dentistry Market Pricing Analysis
- 6.1 Pricing Structure and Measurement
- 6.2 Historical Pricing Trends, 2018-2025
- 6.3 Pricing Outlook, 2025-2035
- 6.4 Average Selling Price and Unit Economics
- 6.5 Pricing by Product and Market Segment
- 6.6 Geographic Pricing Differences
- 6.7 Key Input, Energy, Labor and Logistics Costs
- 6.8 Contract Pricing and Purchasing Models
- 6.9 Pricing Sensitivity and Competitive Positioning
- 6.10 Price, Margin and Profitability Implications
Chapter 7 United States Restorative Dentistry Market Dynamics
- 7.1 Market Growth Drivers
- 7.1.1 Demand-Side Drivers
- 7.1.2 Technology and Innovation Drivers
- 7.1.3 Infrastructure and Investment Drivers
- 7.1.4 Regulatory and Policy Drivers
- 7.2 Market Restraints
- 7.2.1 Cost and Affordability Constraints
- 7.2.2 Technology and Adoption Barriers
- 7.2.3 Supply Chain and Operational Constraints
- 7.3 Market Challenges
- 7.3.1 Competitive Pressure and Margin Erosion
- 7.3.2 Skills, Infrastructure and Implementation Gaps
- 7.4 Emerging Market Opportunities
- 7.5 Market Dynamics Impact and Time-Horizon Assessment
Chapter 8 United States Restorative Dentistry Value Chain Analysis
- 8.1 Industry Value Chain Overview
- 8.2 Upstream Suppliers and Critical Inputs
- 8.3 Technology and Component Providers
- 8.4 Manufacturing or Service Delivery
- 8.5 Distribution, Channel Partners and Integrators
- 8.6 Downstream Applications and End Users
- 8.7 Value Addition and Profit Pools
- 8.8 Vertical Integration and Outsourcing
- 8.9 Supplier Concentration and Risk
- 8.10 Supply Chain Localization and Resilience
Chapter 9 United States Restorative Dentistry Market Regulations and Policies
- 9.1 Relevant Laws, Standards and Compliance Frameworks
- 9.2 Product, Service, Safety and Quality Requirements
- 9.3 Government Policies, Incentives and Subsidies
- 9.4 Imports, Exports and Trade Barriers
- 9.5 Public Procurement and Local Content Requirements
- 9.6 Environmental and Sustainability Compliance
- 9.7 Upcoming Policy Changes and Market Implications
Chapter 10 United States Restorative Dentistry Market Hotspots and Opportunities
- 10.1 Market Opportunity Mapping and Growth Hotspots
- 10.2 High-Growth Applications and Customer Groups
- 10.3 Underserved Markets and White-Space Opportunities
- 10.4 Emerging Technology and Product Opportunities
- 10.5 New Capacity and Investment Hotspots
- 10.6 Market Entry and Expansion Opportunities
- 10.7 Distribution and Partnership Opportunities
- 10.8 Near-Term and Long-Term Commercial Potential
- 10.9 Opportunity Attractiveness and Execution Risks
Chapter 11 United States Restorative Dentistry Market Outlook, 2025-2035
- 11.1 Market Size and Analysis
- 11.1.1 Revenue (Market Measurement: 2025: USD 6.00 billion → 2035: USD 12.84 billion)
- 11.1.2 Market Volume and Quantity Sold
- 11.1.3 Historical Market Size, 2018-2025
- 11.1.4 Base-Year Market Size, 2025
- 11.2 Market Forecast, 2025-2035
- 11.2.1 Revenue Forecast to 2035
- 11.2.2 Volume Forecast to 2035
- 11.2.3 CAGR and Year-on-Year Growth
- 11.2.4 Incremental Revenue Opportunity
- 11.3 Forecast Assumptions and Scenario Analysis
- 11.3.1 Base-Case Forecast
- 11.3.2 Optimistic and Conservative Scenarios
- 11.3.3 Technology, Pricing and Policy Sensitivities
- 11.4 Market Attractiveness and Growth Outlook
Chapter 12 United States Restorative Dentistry Market Segmentation and Outlook
- 12.1 Segmentation Summary and Market Shares, 2025
- 12.2 Largest and Fastest-Growing Segments
- 12.3 By Product - Market Size and Forecast, 2025-2035
- 12.3.1 Segment Definition and Scope
- 12.3.2 Historical Market Size, 2018-2025
- 12.3.3 Revenue Forecast, 2025-2035
- 12.3.4 Volume Forecast, 2025-2035
- 12.3.5 Base-Year Market Share, 2025
- 12.3.6 Segment CAGR and Growth Drivers
- 12.3.7 Subsegment Market Size and Forecast
- 12.3.7.1 Restorative Materials
- 12.3.7.2 Implants
- 12.3.7.3 Restorative Equipment
- 12.3.7.4 Prosthetics
- 12.3.7.5 Impression Materials
- 12.3.7.6 Bonding Agents and Adhesives
- 12.3.7.7 Biomaterials
- 12.3.8 Subsegment Pricing and Adoption Trends
- 12.3.9 Leading Suppliers and Competition
- 12.3.10 Regional Demand and Opportunities
- 12.4 By Material Type - Market Size and Forecast, 2025-2035
- 12.4.1 Segment Definition and Scope
- 12.4.2 Historical Market Size, 2018-2025
- 12.4.3 Revenue Forecast, 2025-2035
- 12.4.4 Volume Forecast, 2025-2035
- 12.4.5 Base-Year Market Share, 2025
- 12.4.6 Segment CAGR and Growth Drivers
- 12.4.7 Subsegment Market Size and Forecast
- 12.4.7.1 Indirect Restorative Materials
- 12.4.7.2 Direct Restorative Materials
- 12.4.8 Subsegment Pricing and Adoption Trends
- 12.4.9 Leading Suppliers and Competition
- 12.4.10 Regional Demand and Opportunities
- 12.5 By End-use - Market Size and Forecast, 2025-2035
- 12.5.1 Segment Definition and Scope
- 12.5.2 Historical Market Size, 2018-2025
- 12.5.3 Revenue Forecast, 2025-2035
- 12.5.4 Volume Forecast, 2025-2035
- 12.5.5 Base-Year Market Share, 2025
- 12.5.6 Segment CAGR and Growth Drivers
- 12.5.7 Subsegment Market Size and Forecast
- 12.5.7.1 Dental Hospitals and Clinics
- 12.5.7.2 Dental Labs
- 12.5.7.3 Research and Teaching Institutes
- 12.5.8 Subsegment Pricing and Adoption Trends
- 12.5.9 Leading Suppliers and Competition
- 12.5.10 Regional Demand and Opportunities
- 12.6 Segment Growth Comparison
- 12.7 Segment Attractiveness and Priority Matrix
Chapter 13 United States Restorative Dentistry End-Use and Application Market Outlook
- 13.1 End-Use Industry and Customer Demand Structure
- 13.2 Leading Applications and Customer Groups
- 13.3 End-Use Market Size, Share and Forecast
- 13.4 Major End-Use Industry Deep Dives
- 13.4.1 Customer Requirements and Use Cases
- 13.4.2 Demand and Replacement Cycles
- 13.4.3 Technical and Regulatory Considerations
- 13.4.4 Purchasing and Procurement Models
- 13.4.5 Leading Vendors and Distribution Channels
- 13.4.6 Forecast and Commercial Opportunities
- 13.5 Emerging Applications and Cross-Segment Demand
- 13.6 End-Use Industry Investment Priorities
Chapter 14 United States Restorative Dentistry Geographic Market Outlook, 2025-2035
- 14.1 Domestic Market Distribution and Demand Clusters
- 14.2 State- or Province-Wise Market Size and Forecast, 2025-2035
- 14.3 City and Metropolitan Market Outlook
- 14.4 Industrial, Manufacturing and Commercial Clusters
- 14.5 Geographic Concentration of Key End Users
- 14.6 Local Pricing and Purchasing Differences
- 14.7 Domestic Production Facilities and Capacity Map
- 14.8 Local Infrastructure and Project Pipeline
- 14.9 State-Level Policy and Incentive Differences
- 14.10 Subnational Investment Hotspots and Opportunities
- 14.11 Distribution and Logistics Networks
- 14.12 Domestic Competitive Footprint
Chapter 15 United States Restorative Dentistry Technology, Innovation and Sustainability Outlook
- 15.1 Technology Landscape and Maturity
- 15.2 Product, Process and Service Innovation
- 15.3 AI, Automation and Digital Tools in the Industry
- 15.4 Technology Adoption and Performance Benchmarking
- 15.5 Innovation Pipeline and R&D Investment
- 15.6 Patent and Intellectual Property Trends
- 15.7 Energy Efficiency and Resource Management
- 15.8 Sustainability, Recycling and Circularity
- 15.9 Technology Roadmap, 2025-2035
- 15.10 Risks of Obsolescence and Technology Substitution
Chapter 16 United States Restorative Dentistry Market Key Strategic Imperatives
- 16.1 Growth and Market Entry Priorities
- 16.2 High-Return Products and Segments
- 16.3 Pricing, Profitability and Cost Optimization
- 16.4 Technology Investment and Product Differentiation
- 16.5 Supply Chain Localization and Resilience
- 16.6 Distribution and Customer Acquisition
- 16.7 Partnership, Acquisition and Capacity Strategy
- 16.8 Regional Expansion Priorities
- 16.9 Short-, Medium- and Long-Term Actions
Chapter 17 Competition Outlook
- 17.1 Industry Competition Characteristics
- 17.2 Market Structure and Concentration
- 17.3 Market Share and Competitive Positioning, 2025
- 17.4 Company-Wise Revenue and Product Benchmarking
- 17.5 Production and Service Capacity Benchmarking
- 17.6 Technology, Pricing and Differentiation
- 17.7 Regional Footprint and Distribution Strength
- 17.8 Mergers, Acquisitions and Strategic Alliances
- 17.9 New Entrants and Competitive Threats
- 17.10 Porter's Five Forces and Industry Attractiveness
- 17.11 Competitive Outlook, 2025-2035
Chapter 18 Company Profiles
- 18.1 Company Coverage and Selection Criteria
- 18.2 Dentsply Sirona
- 18.2.1 Business Description
- 18.2.2 Company Ownership and Geographic Presence
- 18.2.3 Product and Service Portfolio
- 18.2.4 Manufacturing and Operating Footprint
- 18.2.5 Production Capacity and Expansion Plans
- 18.2.6 Financial Performance and Investment
- 18.2.7 Market Share and Competitive Position
- 18.2.8 Technology and Innovation Capabilities
- 18.2.9 Strategic Alliances or Partnerships
- 18.2.10 Recent Developments
- 18.2.11 Growth Strategy and Outlook
- 18.3 Institut Straumann AG
- 18.4 Envista Holdings Corporation (Nobel Biocare, Kerr)
- 18.5 Solventum
- 18.6 Ivoclar Vivadent AG
- 18.7 ZimVie (ARCHIMED)
- 18.8 GC Corporation
- 18.9 Mitsui Chemicals, Inc. (Kulzer)
- 18.10 COLTENE Holding AG
- 18.11 Septodont Holding
- 18.12 Glidewell
- 18.13 SprintRay
- 18.14 Other Relevant Market Participants
Note: Every listed company is profiled on the structure shown under the first company. The company list is preliminary and may change based on research findings, market developments, data availability and client requirements.
Chapter 19 Disclaimer
- 19.1 Research and Forecast Disclaimer
- 19.2 Data Source and Estimation Limitations
Note: The depth of individual sections depends on data availability for this market. Volume, capacity, trade and other unit-based metrics are included where applicable.