
Market Overview:
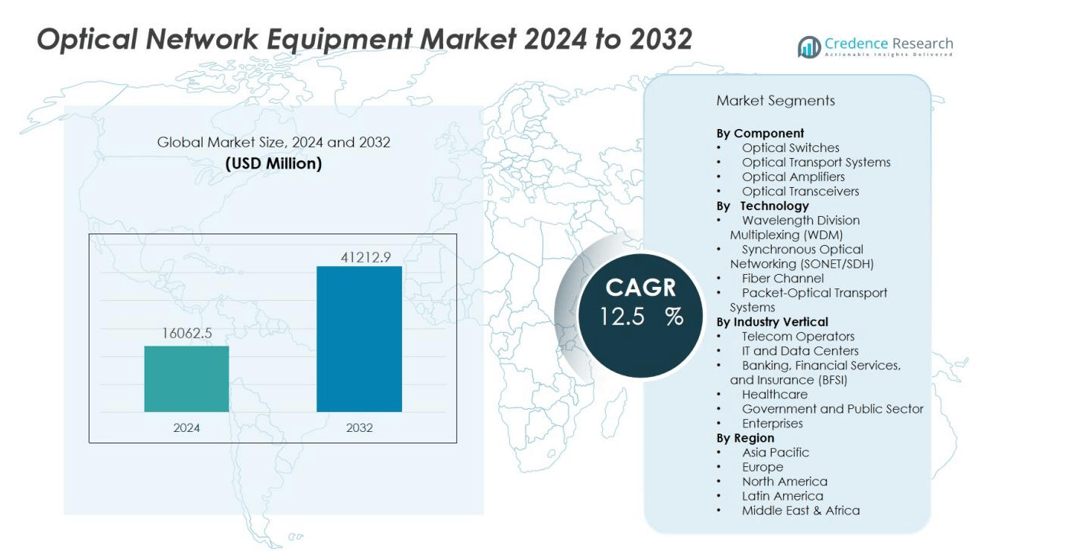
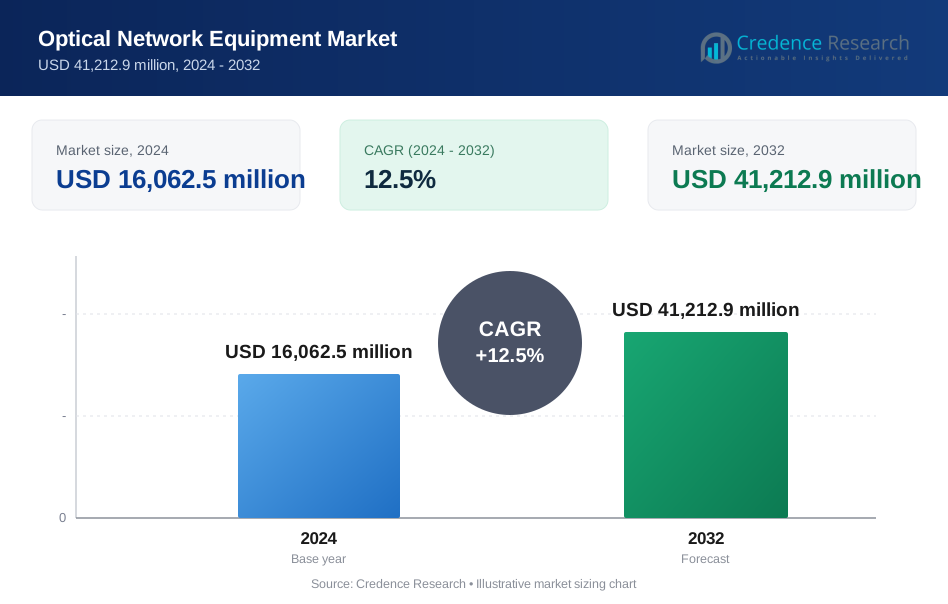
The optical network equipment market size was valued at USD 16062.5 million in 2024 and is anticipated to reach USD 41212.9 million by 2032, at a CAGR of 12.5 % during the forecast period (2024-2032).
| REPORT ATTRIBUTE | DETAILS |
|---|---|
| Historical Period | 2020-2023 |
| Base Year | 2024 |
| Forecast Period | 2025-2032 |
| Optical Network Equipment Market Size 2024 | USD 16062.5 million |
| Optical Network Equipment Market, CAGR | 12.5% |
| Optical Network Equipment Market Size 2032 | USD 41212.9 million |
Growth in the optical network equipment market is primarily driven by the rapid adoption of 5G technology, data center expansions, and increasing cloud-based services. Enterprises and telecom providers are prioritizing high-speed, low-latency connections to support digital transformation, AI workloads, and large-scale automation. The need for energy-efficient and scalable solutions further strengthens demand. Vendors are focusing on advanced WDM systems, packet-optical transport, and flexible architectures that can support evolving network requirements, ensuring robust opportunities for innovation.
Regionally, North America holds a dominant share due to strong demand from hyperscale data centers, telecom operators, and government-backed digital infrastructure programs. Europe follows closely, supported by high broadband penetration and smart city initiatives. Asia-Pacific represents the fastest-growing region, led by China, India, and Japan, where rising internet users, large-scale 5G rollouts, and government-led connectivity projects drive strong adoption. Latin America and the Middle East & Africa are also emerging, with investments in modernizing telecom infrastructure and expanding fiber networks to bridge digital divides.
Market Insights:
- The optical network equipment market was valued at USD 16,062.5 million in 2024 and is projected to reach USD 41,212.9 million by 2032, growing at a CAGR of 12.5%.
- Rising demand for high-speed internet, streaming services, online gaming, and cloud applications is accelerating adoption of advanced optical systems.
- The roll-out of 5G networks and IoT expansion is driving investments in WDM and packet-optical transport solutions for scalability and low latency.
- Growth of hyperscale data centers and cloud services is fueling demand for secure, energy-efficient, and high-capacity optical equipment.
- High deployment costs, complex integration with legacy systems, and cybersecurity risks pose significant challenges for market expansion.
- North America leads with 34% market share, followed by Europe at 27% and Asia-Pacific at 31%, highlighting strong regional adoption.
- Government-backed digitalization initiatives and smart city projects are creating opportunities for sustainable and large-scale infrastructure growth.
Market Drivers:
Rising Demand for High-Speed Connectivity:
The optical network equipment market is driven by the growing requirement for high-speed internet and seamless data transmission. Increasing adoption of streaming services, online gaming, and enterprise cloud applications is creating pressure on network operators to expand capacity. It is enabling providers to deploy advanced fiber optic systems that ensure low latency and higher bandwidth. This demand directly boosts investments in optical transmission and transport solutions.
- For instance, Nokia deployed its PSE-6s coherent optics technology withWindstream Wholesale in 2023, enabling transmission speeds of 1.2 Tbps per wavelength, which significantly improved backbone network capacity while ensuring low latency for data-intensive applications.
Expansion of 5G Networks and IoT Applications:
The roll-out of 5G networks is a significant growth driver for the optical network equipment market. It requires robust backhaul infrastructure capable of handling massive data traffic from IoT devices, smart cities, and autonomous systems. Operators are investing in WDM and packet-optical transport solutions to achieve high reliability and scalability. It is reinforcing the role of optical equipment as a backbone for next-generation connectivity.
For instance, Nokia’s 1830 Photonic Service Switch equipped with its FP4 coherent optics chipset delivers up to 7.2 Tb/s per wavelength, enabling operators to scale backhaul capacity for 5G deployments seamlessly.
Data Center Growth and Cloud Adoption:
The rapid expansion of hyperscale data centers and cloud services is fueling demand for advanced optical equipment. Enterprises and service providers are prioritizing secure, energy-efficient, and high-capacity solutions to support digital transformation. It is pushing vendors to innovate with flexible, software-defined networking systems that integrate seamlessly with existing infrastructure. The need for resilient data exchange between global facilities strengthens long-term adoption.
Government and Enterprise Digitalization Initiatives:
Government-backed broadband expansion projects and enterprise digital strategies are accelerating investments in optical networks. Programs focused on bridging digital divides, developing smart infrastructure, and enhancing cybersecurity are creating large-scale opportunities. It is encouraging partnerships between telecom operators, governments, and technology providers to deploy modern optical solutions. These initiatives are establishing a favorable environment for sustainable growth in the market.
Market Trends:
Adoption of Advanced Technologies and Architectures:
The optical network equipment market is witnessing a strong shift toward advanced technologies such as coherent optics, wavelength-division multiplexing (WDM), and software-defined networking. It is driving higher efficiency, scalability, and performance to meet rising bandwidth requirements across telecom and enterprise applications. Vendors are integrating automation, AI-driven network management, and virtualization to improve reliability and reduce operational costs. The transition from legacy systems to flexible packet-optical transport solutions is accelerating across developed and emerging markets. Investments in future-ready architectures are strengthening the ability of service providers to deliver low-latency, high-capacity networks. This trend is expected to continue as global data traffic grows at an exponential pace.
- For instance, Ciena deployed its WaveLogic 5 Extreme coherent optics enabling 800 Gbps single-wavelength transmission over a commercial long-haul network in 2023, showcasing significant advances in optical efficiency.
Focus on Sustainability and Energy Efficiency:
The optical network equipment market is aligning with sustainability goals through innovations in energy-efficient designs and eco-friendly materials. It is encouraging vendors to develop low-power optical transceivers, compact hardware, and intelligent cooling technologies to reduce carbon footprints. Governments and enterprises are emphasizing green network infrastructure as part of broader environmental initiatives. Service providers are prioritizing solutions that minimize energy consumption while maximizing throughput. Rising awareness of climate change is pushing equipment manufacturers to integrate circular economy principles into product lifecycles. This trend highlights the growing balance between digital growth and environmental responsibility, shaping future product development strategies.
- For instance, Huawei's latest gigabit optical network terminals (ONTs) powered by edge AI can save each customer 38kWh of electricity per year through optimized energy management and sleep modes.
Market Challenges Analysis:
High Deployment Costs and Complex Integration:
The optical network equipment market faces significant challenges due to high deployment costs and the complexity of integrating new systems with existing infrastructure. It requires substantial capital investment in fiber optics, advanced transceivers, and transport systems, which can limit adoption among smaller operators and enterprises. Legacy infrastructure often creates compatibility issues, making upgrades time-consuming and resource-intensive. The complexity of managing diverse network architectures and ensuring seamless interoperability further slows adoption. These financial and operational hurdles often delay large-scale modernization projects.
Cybersecurity Risks and Supply Chain Disruptions:
The optical network equipment market is also challenged by rising cybersecurity threats and global supply chain vulnerabilities. It remains highly exposed to risks from data breaches, network attacks, and system vulnerabilities that can disrupt critical services. Securing high-capacity networks against advanced threats requires continuous investment in monitoring and protection tools. Geopolitical tensions and shortages of key components, such as semiconductors, often disrupt production and supply, causing delays in equipment availability. Fluctuating raw material costs and regulatory constraints increase pressure on vendors and service providers. These factors collectively create uncertainty for long-term planning and growth strategies.
Market Opportunities:
Expansion of 5G and Edge Computing Infrastructure:
The optical network equipment market holds strong opportunities with the global roll-out of 5G and the rapid growth of edge computing. It enables telecom operators to build low-latency, high-capacity networks that support autonomous vehicles, IoT ecosystems, and immersive applications. The need for robust backhaul and fronthaul solutions is accelerating demand for advanced optical transport systems. Service providers are investing heavily in scalable architectures that can handle massive traffic volumes and deliver reliable performance. The integration of edge data centers further strengthens the role of optical solutions in supporting distributed and real-time computing.
Rising Investments in Smart Cities and Digital Transformation:
The optical network equipment market benefits from increasing government and enterprise investments in digital infrastructure and smart city projects. It creates opportunities for vendors to deliver solutions that enhance connectivity, improve energy efficiency, and support intelligent urban services. Expanding adoption of cloud platforms, AI, and big data analytics is generating higher demand for resilient and secure optical networks. Developing regions are prioritizing broadband expansion to bridge connectivity gaps, opening new markets for equipment providers. Strategic collaborations between public and private sectors are also encouraging large-scale deployments. These factors position the market for sustainable growth across diverse applications.
Market Segmentation Analysis:
By Component:
The optical network equipment market is segmented into optical switches, optical transport systems, optical amplifiers, and transceivers. It is witnessing strong demand for transceivers and amplifiers due to growing requirements for high-speed data transmission and efficient signal management. Optical transport systems are widely deployed by telecom operators to expand capacity and improve reliability in large-scale networks. Enterprises are also investing in advanced switching solutions to support digital transformation and cloud connectivity. The component segment continues to evolve with innovation in low-power and compact designs.
- For instance, II-VI’s Finisar 400G QSFP-DD transceiver supports up to 10 km of single-mode reach, enabling operators to upgrade links without replacing existing fiber.
By Technology:
The market is categorized by technologies such as Wavelength Division Multiplexing (WDM), Synchronous Optical Networking (SONET/SDH), and fiber channel. It is dominated by WDM, which delivers high bandwidth and scalability, making it the preferred choice for data centers and telecom providers. SONET/SDH retains adoption in legacy systems but is gradually being replaced by modern packet-optical solutions. Fiber channel technology remains important in enterprise storage networking. Vendors are focusing on next-generation WDM systems with coherent optics and software-defined networking integration.
- For instance, Infinera’s ICE6 coherent optical engine reached 800 Gbps transmission across 800 km in 2023, enabling software-driven scaling for large telecom operators.
By Industry Vertical:
The optical network equipment market serves telecom operators, IT and data centers, BFSI, healthcare, government, and enterprises. It is heavily driven by telecom providers, who account for the largest share due to rapid 5G rollouts and broadband expansion. Data centers represent another fast-growing vertical, fueled by cloud adoption and digital transformation. BFSI and healthcare are adopting optical solutions to secure data and improve connectivity for critical operations. Governments are also driving demand through large-scale digital infrastructure projects.
Segmentations:
By Component:
- Optical Switches
- Optical Transport Systems
- Optical Amplifiers
- Optical Transceivers
By Technology:
- Wavelength Division Multiplexing (WDM)
- Synchronous Optical Networking (SONET/SDH)
- Fiber Channel
- Packet-Optical Transport Systems
By Industry Vertical:
- Telecom Operators
- IT and Data Centers
- Banking, Financial Services, and Insurance (BFSI)
- Healthcare
- Government and Public Sector
- Enterprises
By Region:
- North America
- U.S.
- Canada
- Mexico
- Europe
- Germany
- France
- U.K.
- Italy
- Spain
- Rest of Europe
- Asia Pacific
- China
- Japan
- India
- South Korea
- South-east Asia
- Rest of Asia Pacific
- Latin America
- Brazil
- Argentina
- Rest of Latin America
- Middle East & Africa
- GCC Countries
- South Africa
- Rest of the Middle East and Africa
Regional Analysis:
North America:
North America holds 34% market share of the optical network equipment market, supported by advanced telecom infrastructure and high adoption of digital technologies. The region benefits from strong investments in hyperscale data centers and the rapid expansion of 5G networks. It continues to witness demand from enterprises and government projects focusing on broadband and smart city initiatives. The presence of leading technology providers strengthens its competitive landscape and ensures faster adoption of innovations. The United States dominates within the region due to large-scale cloud adoption and modernization of legacy systems. Canada is also experiencing growth driven by national digital connectivity programs.
Europe:
Europe maintains 27% market share of the optical network equipment market, supported by high broadband penetration and regulatory initiatives. Countries such as Germany, the United Kingdom, and France are leading deployments through investments in fiber networks and smart infrastructure. It benefits from government-backed programs encouraging digitalization and sustainability-focused telecom upgrades. Enterprises across the region are accelerating cloud adoption and strengthening their data center capacities. The emphasis on energy-efficient solutions and data security enhances adoption of advanced optical systems. Southern and Eastern Europe are catching up with infrastructure modernization efforts, creating wider opportunities.
Asia-Pacific :
Asia-Pacific accounts for 31% market share of the optical network equipment market, driven by rapid 5G deployment and large internet user bases. China leads with aggressive investments in telecom infrastructure, supported by government initiatives and strong domestic manufacturing. India is experiencing significant growth through nationwide digital connectivity programs and enterprise cloud adoption. It also benefits from rising investments in smart cities and expanding IT services. Japan and South Korea remain at the forefront of technological innovation, strengthening demand for advanced optical solutions. Emerging economies in Southeast Asia are contributing through infrastructure development and increasing demand for high-speed connectivity.
Key Player Analysis:
- Huawei Technologies Co.
- Cisco
- Nokia
- Ciena
- Broadcom
- ADTRAN
- Fujitsu Optical Components
- NEC
- Infinera
- Juniper Networks
- Corning
- Ericsson
- Mitsubishi Electric
Competitive Analysis:
The optical network equipment market is highly competitive, shaped by global leaders and regional players focusing on innovation and strategic partnerships. Key companies include Huawei Technologies Co., Cisco, Nokia, Ciena, Broadcom, ADTRAN, Fujitsu Optical Components, and NEC. It is characterized by continuous investment in advanced technologies such as coherent optics, WDM systems, and software-defined networking to meet rising demand for high-speed and scalable connectivity. Vendors are competing by enhancing energy efficiency, reducing latency, and integrating automation features to support 5G rollouts and cloud adoption. Strategic mergers, acquisitions, and collaborations are strengthening market presence while enabling access to new geographies. Competition also reflects a balance between established multinational providers and emerging firms that deliver cost-effective, localized solutions. It demonstrates a dynamic environment where technological advancement and customer-centric strategies are crucial for sustaining leadership and capturing future growth opportunities.
Recent Developments:
- In August 2025, Huawei Technologies announced its upcoming “Ride the Wind” Innovative Product Launch event set for September 19 in Paris, which will unveil new wearables, tablets, and phones.
- In January 2025, Cisco completed the acquisition of SnapAttack, a cyber threat detection and hunting startup, to strengthen Cisco’s AI-driven security and observability offerings, as announced by Booz Allen.
- In June 2025, Nokia announced a partnership with Andorix to accelerate adoption of Private 5G networks and neutral host networks in North America, targeting real estate and building operations use cases.
Market Concentration & Characteristics:
The optical network equipment market reflects a moderately concentrated structure, with leading global players holding strong positions due to their technological expertise and extensive distribution networks. It is defined by continuous innovation in coherent optics, WDM solutions, and software-defined architectures that address rising bandwidth and efficiency demands. Competition is shaped by strategic partnerships, mergers, and regional expansions as vendors aim to strengthen market presence and customer reach. The market also shows characteristics of high capital intensity, long product lifecycles, and growing emphasis on energy-efficient designs. Regional players are gaining traction by offering cost-effective solutions tailored to local infrastructure needs. Overall, it demonstrates a balance of established global leaders and agile regional participants, creating a dynamic competitive environment.
Report Coverage:
The research report offers an in-depth analysis based on Component, Technology, Industry Vertical and Region. It details leading Market players, providing an overview of their business, product offerings, investments, revenue streams, and key applications. Additionally, the report includes insights into the competitive environment, SWOT analysis, current Market trends, as well as the primary drivers and constraints. Furthermore, it discusses various factors that have driven Market expansion in recent years. The report also explores Market dynamics, regulatory scenarios, and technological advancements that are shaping the industry. It assesses the impact of external factors and global economic changes on Market growth. Lastly, it provides strategic recommendations for new entrants and established companies to navigate the complexities of the Market.
Future Outlook:
- The optical network equipment market will expand with increasing reliance on high-speed data transmission and low-latency connectivity.
- Telecom operators will prioritize large-scale deployments to support 5G, IoT ecosystems, and advanced mobile applications.
- Vendors will invest in coherent optics, flexible WDM systems, and software-defined solutions to enhance scalability and efficiency.
- Enterprises will adopt advanced optical systems to strengthen cloud integration, digital transformation, and cross-border data exchange.
- Data center operators will drive demand through hyperscale expansions and the need for resilient interconnection infrastructure.
- Governments will accelerate investments in broadband and smart city projects, creating new opportunities for infrastructure modernization.
- Sustainability initiatives will push manufacturers to design energy-efficient, low-power, and environmentally responsible optical solutions.
- Cybersecurity enhancements will remain a priority, with advanced encryption and monitoring systems integrated into optical networks.
- Emerging economies will strengthen adoption through rapid urbanization, growing internet penetration, and state-backed connectivity programs.
- The competitive landscape will evolve with strategic alliances, regional expansions, and continuous product innovation to address global demand.
Request a Free Sample
Fill in your details and we'll send you a free sample report.
- Sample data tables & charts
- Research methodology
Need a Custom Version of This Report?
Tailor the scope, geography, or segments to your exact requirements.
- Custom geography or segment scope
- Direct access to our analyst team
Frequently Asked Questions
What is the current market size for the optical network equipment market, and what is its projected size in 2032?
Which optical network equipment market segment held the largest share in 2024?
Who are the leading companies in the optical network equipment market?
Which region commanded the largest share of the optical network equipment market in 2024?
At what Compound Annual Growth Rate is the optical network equipment market projected to grow between 2024 and 2032?
What are the primary factors fueling the growth of the optical network equipment market?
Table of Content
Chapter 1. Report Introduction
- 1.1 Report Description & Purpose
- 1.1.1 Report Title & Market Definition
- 1.1.2 Unique Selling Propositions (USP) & Key Differentiators
- 1.1.3 Value Proposition for Stakeholders
- 1.2 Research Objectives
- 1.2.1 Market Sizing Objectives (Volume & Revenue)
- 1.2.2 Segmentation Objectives
- 1.2.3 Competitive Intelligence Objectives
- 1.2.4 Forecast & Scenario Objectives
- 1.3 Report Scope
- 1.3.1 Optical Network Equipment Scope – Types & Subtypes Covered
- 1.3.2 Geographic Scope – Regions & Countries Covered
- 1.3.3 Historical Period, Base Year & Forecast Period (2024; forecast to 2032)
- 1.3.4 Inclusions & Exclusions
- 1.4 HS Code & Classification Framework
- 1.5 Currency, Units & Pricing Basis
- 1.6 Target Stakeholders
- 1.7 Limitations & Assumptions
Chapter 2. Executive Summary
- 2.1 Global Optical Network Equipment Market Snapshot
- 2.1.1 Market Size – Historical (2024) & Forecast (2024-2032) (2024: USD 16,062.5 million → 2032: USD 41,212.9 million)
- 2.1.2 Volume & Revenue – Global Totals
- 2.1.3 Key Market Highlights – Top Five Facts
- 2.2 Optical Network Equipment Market Segmentation Snapshot
- 2.2.1 Market Split by Region – 2024 vs. 2032
- 2.3 Competitive Snapshot
- 2.3.1 Top 10 Players by Revenue Share – 2024
- 2.3.2 Top 10 Players by Volume Share – 2024
- 2.3.3 Recent Strategic Developments (18-Month Summary)
- 2.4 Key Investment Highlights & Strategic Conclusions
Chapter 3. Optical Network Equipment Market Dynamics & Industry Analysis
- 3.1 Market Overview & Context
- 3.1.1 Optical Network Equipment Market Position in the Broader Automotive Value Chain
- 3.1.2 OEM vs. Replacement Market Dynamics
- 3.1.3 Market Maturity & Development Stage by Region
- 3.2 Optical Network Equipment Market Drivers
- 3.3 Optical Network Equipment Market Restraints & Challenges
- 3.4 Optical Network Equipment Market Opportunities
- 3.5 Porter's Five Forces Analysis
- 3.5.1 Threat of New Entrants
- 3.5.2 Bargaining Power of Suppliers
- 3.5.3 Bargaining Power of Buyers
- 3.5.4 Threat of Substitutes
- 3.5.5 Competitive Rivalry – Intensity Assessment
- 3.6 Optical Network Equipment Value Chain Analysis
- 3.6.1 Upstream – Raw Material/Input Suppliers
- 3.6.1.1 Raw Material/Input 1
- 3.6.1.2 Raw Material/Input 2
- 3.6.1.3 Raw Material/Input 3
- 3.6.2 Midstream – Production/Manufacturing/Service Delivery
- 3.6.2.1 Production/Process Overview
- 3.6.2.2 Key Facility Locations & Capacity by Manufacturer
- 3.6.3 Downstream – Distribution & End Consumer
- 3.6.3.1 Primary Channel – B2B/OEM
- 3.6.3.2 Secondary Channels – Dealer, Retail, Online, Direct
- 3.6.4 Value Chain Profitability Analysis
- 3.6.1 Upstream – Raw Material/Input Suppliers
- 3.7 PESTEL Analysis
- 3.7.1 Political Factors
- 3.7.2 Economic Factors
- 3.7.3 Social Factors
- 3.7.4 Technological Factors
- 3.7.5 Environmental Factors
- 3.7.6 Legal Factors
- 3.8 Optical Network Equipment Supply Chain Analysis
- 3.8.1 Raw Material/Input Supply Risk Assessment
- 3.8.2 Manufacturing Concentration Risk (Geographic Exposure)
- 3.8.3 Trade Disruption Impact Analysis
- 3.9 Regulatory & Policy Landscape
Note: The regulatory and policy landscape section covers regulations based on their applicability to the market, Optical Network Equipment category, geography, and scope of the study. Only regulatory frameworks with a material impact on operations, compliance, trade, sustainability, or market access are analyzed in detail.
Chapter 4. Key Investment Pockets & Opportunity Analysis
- 4.1 Optical Network Equipment Market Attractiveness Analysis
- 4.1.1 By Region – Investment Attractiveness Matrix (Volume × CAGR)
- 4.2 Absolute Revenue Growth Opportunity
- 4.2.1 By Region – Absolute USD Growth Through 2032
- 4.3 Incremental Volume Opportunity
- 4.3.1 By Region – Incremental Volume Through 2032
- 4.3.2 Segment – Incremental Volume
- 4.4 Emerging Submarket Opportunity Deep Dive (Subject to Applicability)
- 4.5 Emerging Market Opportunity Scorecards
- 4.5.1 United States
- 4.5.2 Europe
- 4.5.3 Asia
- 4.5.4 Middle East & Africa
Note: Emerging Market Opportunity Scorecards will be included based on relevance and strategic importance. Regions listed are indicative and may vary depending on data availability and market dynamics.
Chapter 5. Optical Network Equipment Import-Export Analysis & Trade Flows
- 5.1 Global Trade Overview
- 5.1.1 Global Export Value by Country (2024)
- 5.1.2 Global Export Volume by Country (2024)
- 5.1.3 Global Import Value by Country (2024)
- 5.1.4 Global Import Volume by Country (2024)
- 5.1.5 Net Trade Balance by Country (2024)
- 5.2 Export Analysis – Segment
- 5.2.1 Type 1 (HS Code)
- 5.2.2 Type 2 (HS Code)
- 5.2.3 Type 3 (HS Code)
- 5.2.4 Type 4 (HS Code)
- 5.2.5 Type 5 (HS Code)
- 5.3 Import Analysis – Segment
- 5.3.1 Type 1 (HS Code)
- 5.3.2 Type 2 (HS Code)
- 5.3.3 Type 3 (HS Code)
- 5.3.4 Type 4 (HS Code)
- 5.3.5 Type 5 (HS Code)
- 5.4 Average Unit Trade Prices
- 5.4.1 Average Export Price – Segment & Country
- 5.4.2 Average Import Price – Segment & Source Country
- 5.4.3 Price Trends (2024)
- 5.5 Key Trade Route Analysis
- 5.5.1 Trade Route 1
- 5.5.2 Trade Route 2
- 5.5.3 Trade Route 3
- 5.5.4 Trade Route 4
- 5.5.5 Trade Route 5
- 5.6 Trade Policy Impact Assessment
- 5.6.1 US Anti-Dumping & Section 301 Tariffs
- 5.6.2 EU Customs Union Impact
- 5.6.3 Major Free Trade Agreements
- 5.6.4 USMCA Rules of Origin
Note: Trade policy analysis will be included only where relevant to the Optical Network Equipment market.
Chapter 6. Competitive Landscape & Company Benchmarking
- 6.1 Optical Network Equipment Market Concentration & Structure
- 6.1.1 Herfindahl-Hirschman Index (HHI) – vs. 2024
- 6.1.2 Tier 1, Tier 2 & Tier 3 Market Structure
- 6.1.3 Global, Regional & Local Player Dynamics
- 6.2 Optical Network Equipment Market Share Analysis – 2024
- 6.2.1 Global Revenue Share by Company
- 6.2.2 Global Volume Share by Company
- 6.2.3 Regional Revenue Share
- 6.2.4 Market Share Evolution ( vs. 2024)
- 6.2.5 OEM Segment Share by Company
- 6.2.6 Replacement Segment Share by Company
- 6.3 Production/Delivery Capacity & Facility Analysis
- 6.3.1 Global Installed Capacity
- 6.3.2 Capacity Utilization Rates
- 6.3.3 Production/Output Volume
- 6.3.4 Facility Locations & Capacity Map
- 6.3.5 Planned Capacity Additions
- 6.4 Optical Network Equipment Competitive Benchmarking Matrix
- 6.4.1 Revenue, Volume, CAGR & Profitability Comparison
- 6.4.2 Channel Revenue Mix
- 6.4.3 Geographic Revenue Exposure
- 6.4.4 R&D Intensity
- 6.4.5 Sustainability Maturity
- 6.5 Strategic Developments in Optical Network Equipment (Last 24 Months)
- 6.5.1 Mergers, Acquisitions & Divestments
- 6.5.2 New Optical Network Equipment Launches
- 6.5.3 Facility Expansions
- 6.5.4 Strategic Alliances, Joint Ventures & Partnerships
- 6.5.5 Distribution Expansion & Market Entry
- 6.5.6 Sustainability & ESG Initiatives
- 6.6 Competitive Strategy Mapping
- 6.6.1 Leader, Challenger, Follower & Niche Classification
- 6.6.2 Pricing Strategy Comparison
- 6.6.3 Channel Strategy Matrix
Note: Strategic developments are included based on their materiality and the availability of reliable information.
Chapter 7. Global Optical Network Equipment Market – By Distribution Channel
- 7.1 Segment Overview
- 7.1.1 Volume & Revenue Split by Channel (2024 & 2032)
- 7.1.2 Channel Mix Evolution (2024-2032)
Chapter 8. Regional Market Analysis – Global Overview
- 8.1 Global Regional Overview
- 8.1.1 Regional Volume Share
- 8.1.2 Regional Revenue Share
- 8.1.3 Regional Volume by Region
- 8.1.4 Regional Revenue by Region
- 8.1.5 Regional Forecast Through 2032
- 8.2 Cross-Regional Segment Analysis
- 8.2.1 By Distribution Channel
- 8.2.2 By Brand/Price Tier
Chapter 9. North America Optical Network Equipment Market
- 9.1 United States
- 9.2 Canada
- 9.3 Mexico
Chapter 10. Europe Optical Network Equipment Market
- 10.1 Germany
- 10.2 France
- 10.3 Italy
- 10.4 United Kingdom
- 10.5 Spain
- 10.6 Poland
- 10.7 Russia
- 10.8 Netherlands
- 10.9 Belgium
- 10.10 Sweden
- 10.11 Denmark
- 10.12 Norway
- 10.13 Rest of Europe
Chapter 11. Asia Pacific Optical Network Equipment Market
- 11.1 China
- 11.2 India
- 11.3 Japan
- 11.4 South Korea
- 11.5 Thailand
- 11.6 Indonesia
- 11.7 Vietnam
- 11.8 Malaysia
- 11.9 Australia
- 11.10 Rest of Asia Pacific
Chapter 12. Latin America Optical Network Equipment Market
- 12.1 Brazil
- 12.2 Argentina
- 12.3 Colombia
- 12.4 Chile
- 12.5 Rest of Latin America
Chapter 13. Middle East Optical Network Equipment Market
- 13.1 Saudi Arabia
- 13.2 United Arab Emirates
- 13.3 Turkey
- 13.4 Israel
- 13.5 Iran
- 13.6 Rest of the Middle East
Chapter 14. Africa Optical Network Equipment Market
- 14.1 South Africa
- 14.2 Egypt
- 14.3 Nigeria
- 14.4 Morocco
- 14.5 Rest of Africa
Chapter 15. Optical Network Equipment Company Profiles
- 15.1 [Company 01]
- 15.1.1 Company Overview
- 15.1.2 Key Management Personnel
- 15.1.3 Products & Services Portfolio
- 15.1.4 Financial Performance
- 15.1.5 Key Market Focus & Geographic Presence
- 15.1.6 Recent Developments & Strategic Initiatives
Note: The company profile list is preliminary and may change based on research findings, market developments, data availability, and client requirements.
Chapter 16. Appendices
- Appendix A – List of Abbreviations & Acronyms
- Appendix B – Industry Classification Code Reference – Full Series
- Appendix C – Production & Capacity Data Tables
- Appendix D – End-Use & Demand Base Tables
- Appendix E – Consumption & Replacement Rate Assumptions
- Appendix F – ASP Reference Tables
- Appendix G – Manufacturing & Facility Database
- Appendix H – Import-Export Data Tables
- Appendix I – Regulatory Summary Tables
- Appendix J – Primary Research Participant List (Anonymized)
- Appendix K – Primary Research Questionnaire Framework
- Appendix L – Data Sources & Bibliography
- Appendix M – Market Size Divergence & Source Comparison
Chapter 17. Research Methodology
- 17.1 Research Framework & Philosophy
- 17.2 Secondary Research – Sources, Hierarchy & Data Extraction
- 17.3 Data Modeling – Bottom-Up & Top-Down Market Sizing
- 17.4 Primary Research – Stakeholder Framework, LOI & Sample Sizes
- 17.5 Forecast Methodology – Regression, Scenario & Sensitivity Analysis
- 17.6 Quality Control – Four-Layer Validation Framework
- 17.7 Limitations & Standard Assumptions
- 17.8 Disclaimer
