Market Overview
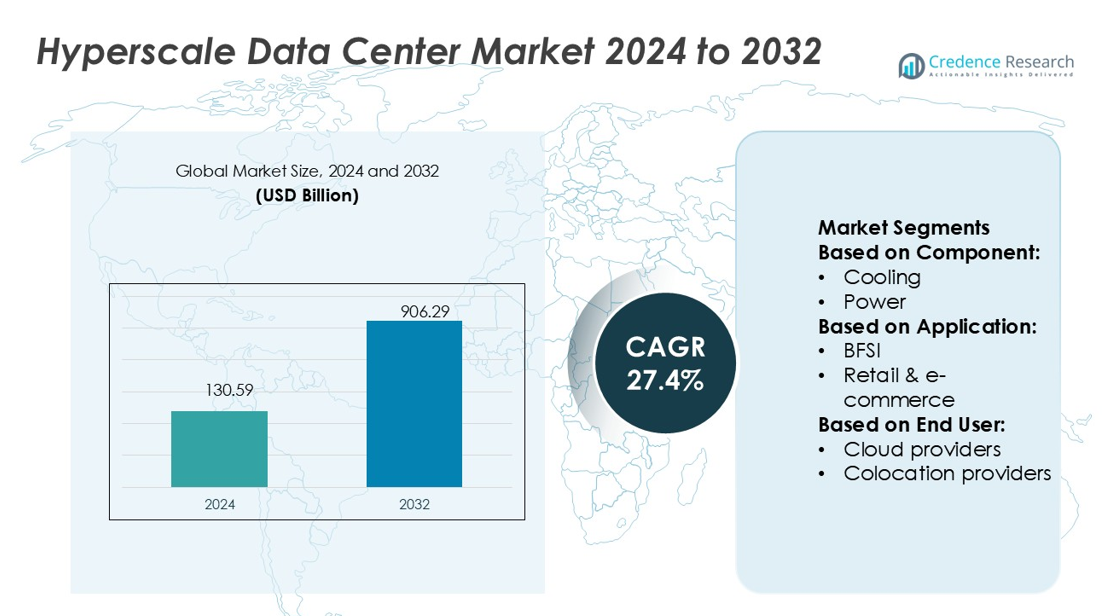
Hyperscale Data Center Market size was valued USD 130.59 billion in 2024 and is anticipated to reach USD 906.29 billion by 2032, at a CAGR of 27.4% during the forecast period.
| REPORT ATTRIBUTE |
DETAILS |
| Historical Period |
2020-2023 |
| Base Year |
2024 |
| Forecast Period |
2025-2032 |
| Hyperscale Data Center Market Size 2024 |
USD 130.59 billion |
| Hyperscale Data Center Market, CAGR |
27.4% |
| Hyperscale Data Center Market Size 2032 |
USD 906.29 billion |
The hyperscale data center market is driven by top players including Amazon, Microsoft, Alphabet, Meta, Equinix, Huawei, IBM, Intel, NVIDIA, and Broadcom. These companies dominate through extensive investments in cloud infrastructure, AI-ready platforms, and high-performance computing solutions. Cloud leaders focus on expanding global footprints, while hardware specialists enable next-generation processing and networking capabilities. Colocation and interconnection providers further strengthen ecosystem resilience. Asia-Pacific leads the market with a 34% share in 2024, supported by large-scale deployments in China, India, and Australia, driven by strong government support, expanding digital economies, and robust local supply chains that reinforce its regional dominance.
Market Insights
- The hyperscale data center market was valued at USD 130.59 billion in 2024 and is projected to reach USD 906.29 billion by 2032, growing at a CAGR of 27.4%.
- Market growth is driven by rising cloud adoption, AI integration, and demand for high-performance computing across industries, supported by increasing investments in scalable infrastructure.
- Key trends include the adoption of energy-efficient designs, automation, and edge computing, along with rapid geographic expansion into emerging economies to meet digital service demands.
- Competitive dynamics are shaped by top players such as Amazon, Microsoft, Alphabet, Meta, Equinix, Huawei, IBM, Intel, NVIDIA, and Broadcom, who focus on innovation, sustainability, and global capacity expansion despite high capital costs.
- Asia-Pacific leads with 34% market share in 2024, followed by North America at 36% and Europe at 28%, while the solution segment dominates with 38% share, reflecting strong demand for integrated hyperscale infrastructure globally.
Access crucial information at unmatched prices!
Request your sample report today & start making informed decisions powered by Credence Research Inc.!
Download Sample
Market Segmentation Analysis:
By Component
Within the hyperscale data center market, the solution segment dominates with over 38% share, driven by demand for integrated infrastructure platforms that combine storage, computing, and networking. These solutions enable scalability and efficiency, reducing deployment time and operational complexity. Cooling and power systems also see high adoption due to rising rack density and energy optimization needs, but they trail integrated solutions. Increasing use of AI workloads and cloud-native applications further pushes enterprises to rely on full-stack solutions, making this segment the backbone of hyperscale deployments globally.
- For instance, AWS deploys Graviton4 processors with 96 cores and 12 DDR5-5600 memory channels in new EC2 instances, enabling higher compute density per rack.
By Application
The IT and telecom segment leads with 34% share, as hyperscale facilities form the backbone of digital networks and internet infrastructure. Massive data consumption, 5G rollouts, and rising cloud services drive adoption across telecom operators. BFSI follows closely, focusing on secure and compliant hosting, while entertainment and media sectors expand with streaming, gaming, and content delivery demands. Retail and e-commerce also contribute strongly due to the growth of omnichannel operations. However, IT and telecom’s reliance on high-capacity, low-latency data handling ensures its continued dominance in this market.
- For instance, Intel’s “Clearwater Forest” Xeon processors, built on the company’s 18A process, will feature 288 efficiency cores (E-cores) per socket.In a dual-socket server configuration, the total core count reaches 576 E-cores.
By End User
Cloud providers hold the largest share at 51%, reflecting their aggressive global data center expansions to support SaaS, IaaS, and PaaS offerings. Hyperscale operators like AWS, Microsoft, and Google invest heavily in new capacity to address exponential growth in AI, big data, and enterprise cloud migration. Colocation providers also gain traction, serving enterprises seeking flexible models without high capital expenditure. Traditional enterprises remain a smaller segment but are steadily transitioning workloads. The overwhelming scale and recurring investment strategies of cloud providers ensure their sustained leadership in the hyperscale data center ecosystem.
Key Growth Drivers
Rising Cloud Adoption
Rapid enterprise migration to cloud platforms drives hyperscale data center expansion. Organizations demand scalable, secure, and cost-efficient infrastructure to support SaaS, IaaS, and PaaS solutions. Cloud-native applications, hybrid deployments, and AI workloads push operators to add capacity across global regions. The need for real-time processing and remote accessibility further accelerates investments. Leading cloud providers like AWS, Microsoft, and Google are building hyperscale campuses to meet these needs, making cloud adoption one of the strongest market growth drivers.
- For instance, Microsoft’s new “Fairwater” campus is being built on a 315-acre site.network. The facility consists of three buildings that combine for approximately 1.2 million square feet.
Data Traffic Surge from Digitalization
Explosive data growth from IoT, social media, video streaming, and 5G adoption fuels hyperscale facility demand. Enterprises rely on high-density infrastructure to process, store, and analyze vast data volumes. Rising smartphone penetration and connected devices add significant strain on networks, requiring robust hyperscale ecosystems. Data-intensive industries like banking, e-commerce, and entertainment expand reliance on hyperscale solutions to ensure seamless digital operations. This constant data traffic surge directly boosts construction and upgrades of hyperscale data centers worldwide.
- For instance, Huawei’s Atlas 950 SuperCluster integrates 524,288 Ascend 950DT AI accelerators, enabling 1 ZettaFLOPS FP4 inference and 524 ExaFLOPS FP8 training throughput.
Focus on Energy Efficiency and Sustainability
Sustainability is a crucial growth driver as operators invest in energy-efficient hyperscale designs. Growing concerns over carbon emissions and rising energy costs push data center builders to integrate renewable power, liquid cooling, and advanced automation. Governments encourage green certifications, while enterprises demand providers that align with ESG targets. These sustainability-focused investments reduce operational costs and strengthen long-term competitiveness. As a result, energy efficiency and renewable adoption play a vital role in shaping future hyperscale market strategies.
Key Trends & Opportunities
Integration of AI and Automation
AI-powered tools are transforming hyperscale data center operations. Predictive analytics, robotic process automation, and AI-driven monitoring enhance efficiency and reduce downtime. With rising adoption of machine learning and generative AI workloads, hyperscale providers see opportunities to deploy AI-optimized chips and servers. Automation also supports rapid scalability, improving deployment speed and lowering manual intervention. This trend positions AI integration as a major opportunity to enhance efficiency and meet advanced enterprise demands.
- For instance, Google’s TPU v4 architecture uses optical circuit switches (OCSes) that consume < 3 % of system power while enabling dynamic interconnect reconfiguration across 4,096 chips.
Geographic Expansion into Emerging Economies
Emerging economies in Asia-Pacific, Latin America, and Africa present strong growth opportunities for hyperscale data centers. Rising internet penetration, e-commerce adoption, and government-backed digital initiatives create demand for large-scale infrastructure. Abundant renewable resources and improving connectivity attract global providers to set up regional campuses. For example, hyperscale investments in India, Brazil, and South Africa accelerate due to local demand for cloud and digital services. Expanding into underserved regions allows operators to capture new customer bases and strengthen global presence.
- For instance, Broadcom launched its Tomahawk 6 switch chip delivering 102.4 Tbps of Ethernet switching capacity, enabling hyperscalers in India and Brazil to scale interconnect bandwidth per rack.
Key Challenges
High Capital Expenditure Requirements
Building hyperscale facilities requires billions in upfront investment for land, power, cooling, and advanced infrastructure. Operators face challenges in financing these projects while ensuring profitability. Rising construction costs, supply chain delays, and inflation add further pressure. Smaller players and enterprises struggle to match the scale of global providers, limiting competitive entry. High capital intensity often restricts market participation to only a few dominant hyperscale operators, slowing diversification in the industry.
Energy and Resource Constraints
Hyperscale facilities consume massive amounts of electricity and water, creating resource challenges. Regions with power shortages or environmental restrictions face difficulties in supporting large campuses. Governments impose stricter sustainability rules, while communities raise concerns about environmental impact. Operators must balance growth with responsible energy use and advanced cooling solutions. These constraints increase operational risks and may limit expansion in regions with inadequate renewable supply or infrastructure support, challenging the pace of hyperscale development.
Regional Analysis
North America
North America leads the hyperscale data center market with 36% share in 2024, supported by strong presence of global cloud providers such as AWS, Microsoft, and Google. The U.S. drives most deployments with large-scale investments in AI, big data, and edge computing infrastructure. Favorable regulatory frameworks, advanced connectivity, and availability of renewable energy further strengthen the region’s dominance. Canada contributes through government digitalization initiatives and growing cloud adoption among enterprises. Rising demand for AI-ready campuses and energy-efficient designs ensures North America maintains its leadership in the hyperscale market throughout the forecast period.
Europe
Europe accounts for 28% share in the hyperscale data center market, driven by demand for secure and sustainable infrastructure. Countries like Germany, the UK, and France dominate installations, supported by stringent data localization regulations and strong enterprise adoption of cloud services. The European Green Deal and renewable integration push operators to focus on energy-efficient campuses. Colocation providers also expand rapidly, addressing demand from SMEs and regulated sectors. Rising investments in AI-ready infrastructure, 5G rollouts, and cross-border digital services position Europe as a critical hub for hyperscale growth, balancing innovation with sustainability commitments.
Asia-Pacific
Asia-Pacific holds 30% share of the hyperscale data center market, emerging as the fastest-growing region. China and India drive large-scale deployments, supported by government-backed digital initiatives, massive internet user bases, and rapid adoption of cloud services. Japan, South Korea, and Australia add momentum through advanced AI, IoT, and 5G adoption. Abundant renewable resources and favorable investment policies attract global providers to build regional campuses. Expanding e-commerce, streaming, and mobile services further fuel demand. Asia-Pacific’s dynamic digital economy and rising infrastructure investments position it as the strongest growth engine for hyperscale facilities globally.
Latin America
Latin America represents 4% share in the hyperscale data center market, with Brazil and Mexico leading developments. Cloud adoption in retail, banking, and government sectors fuels steady expansion. Brazil dominates with large-scale campuses supported by renewable energy access and growing internet penetration. Mexico follows with investments in telecom and digital infrastructure. Other nations like Chile and Colombia emerge as secondary hubs due to government incentives and regional connectivity. Despite challenges in power infrastructure and capital investment, rising digitalization and cloud migration provide growth opportunities for hyperscale operators in the region.
Middle East & Africa
The Middle East & Africa account for 2% share of the hyperscale data center market, but the region shows high growth potential. The UAE, Saudi Arabia, and South Africa lead adoption, driven by national digital transformation agendas and expanding telecom networks. Hyperscale providers invest in AI-ready campuses to support smart city initiatives and cloud-first government policies. Renewable energy projects and strategic geographic location strengthen appeal for global operators. While limited power availability and infrastructure gaps challenge growth, rising demand for localized cloud and data services positions MEA as an emerging opportunity for hyperscale expansion.
Market Segmentations:
By Component:
By Application:
By End User:
- Cloud providers
- Colocation providers
By Geography
- North America
- Europe
- UK
- France
- Germany
- Italy
- Spain
- Russia
- Belgium
- Netherlands
- Austria
- Sweden
- Poland
- Denmark
- Switzerland
- Rest of Europe
- Asia Pacific
- China
- Japan
- South Korea
- India
- Australia
- Thailand
- Indonesia
- Vietnam
- Malaysia
- Philippines
- Taiwan
- Rest of Asia Pacific
- Latin America
- Brazil
- Argentina
- Peru
- Chile
- Colombia
- Rest of Latin America
- Middle East
- UAE
- KSA
- Israel
- Turkey
- Iran
- Rest of Middle East
- Africa
- Egypt
- Nigeria
- Algeria
- Morocco
- Rest of Africa
Competitive Landscape
The hyperscale data center market is shaped by leading players such as Equinix, Amazon, Intel, Microsoft, Huawei, Alphabet, Broadcom, NVIDIA, Meta, and IBM. The hyperscale data center market is highly competitive, characterized by rapid technological advancements and large-scale infrastructure investments. Operators focus on expanding global footprints to meet growing demand for cloud services, AI workloads, and data-intensive applications. The landscape is defined by continuous innovation in energy-efficient designs, high-performance computing, and automation technologies to optimize operations and reduce costs. Strategic partnerships, mergers, and acquisitions play a vital role in strengthening capabilities and expanding service portfolios. The competitive environment emphasizes scalability, sustainability, and digital resilience, ensuring providers remain agile in meeting evolving enterprise and consumer needs.
Shape Your Report to Specific Countries or Regions & Enjoy 30% Off!
Key Player Analysis
- Equinix
- Amazon
- Intel
- Microsoft
- Huawei
- Alphabet
- Broadcom
- NVIDIA
- Meta
- IB
Recent Developments
- In April 2025, Corscale Data Centers and Affinius Capital announce strategic partnership with e2companies to exclusively utilize its Virtual Utility® technology in the united states hyperscale data center market.
- In January 2025, Amazon Web Services (AWS) announced the launch of new hyperscale data center campuses in Thailand and Saudi Arabia, strengthening its infrastructure footprint in emerging digital economies. The facilities are designed with high-density AI workloads in mind and powered by 100% renewable energy, reinforcing AWS leadership in sustainable hyperscale cloud solutions.
- In January 2025, Oracle unveiled the Exadata X11M, the newest iteration of its Exadata platform, offering major advancements in performance for AI, analytics, and online transaction processing (OLTP) workloads.
- In April 2024, Schneider Electric engaged in a partnership with Digital Realty, a provider of colocation and interconnection solutions. Through this partnership, the company aims to maintain the life of the mission-critical systems at the PAR5 data storage facility
Report Coverage
The research report offers an in-depth analysis based on Component, Application, End-User and Geography. It details leading market players, providing an overview of their business, product offerings, investments, revenue streams, and key applications. Additionally, the report includes insights into the competitive environment, SWOT analysis, current market trends, as well as the primary drivers and constraints. Furthermore, it discusses various factors that have driven market expansion in recent years. The report also explores market dynamics, regulatory scenarios, and technological advancements that are shaping the industry. It assesses the impact of external factors and global economic changes on market growth. Lastly, it provides strategic recommendations for new entrants and established companies to navigate the complexities of the market.
Future Outlook
- Hyperscale data centers will expand rapidly to support AI, machine learning, and big data.
- Cloud migration across industries will continue driving large-scale infrastructure investments.
- Energy-efficient and sustainable designs will become a top priority for operators.
- Growing adoption of 5G and edge computing will boost demand for localized hyperscale facilities.
- Integration of advanced processors and GPUs will enhance high-performance computing capabilities.
- Automation and AI-driven monitoring will improve efficiency and reduce operational downtime.
- Emerging markets in Asia-Pacific, Latin America, and Africa will attract new hyperscale campuses.
- Colocation services will gain traction as enterprises seek flexible and cost-effective solutions.
- Hybrid and multi-cloud strategies will accelerate hyperscale adoption across enterprises.
- Strategic alliances and mergers will shape the competitive landscape and expand service portfolios.


