
U.S. camera buyers shift spending from recorders to software
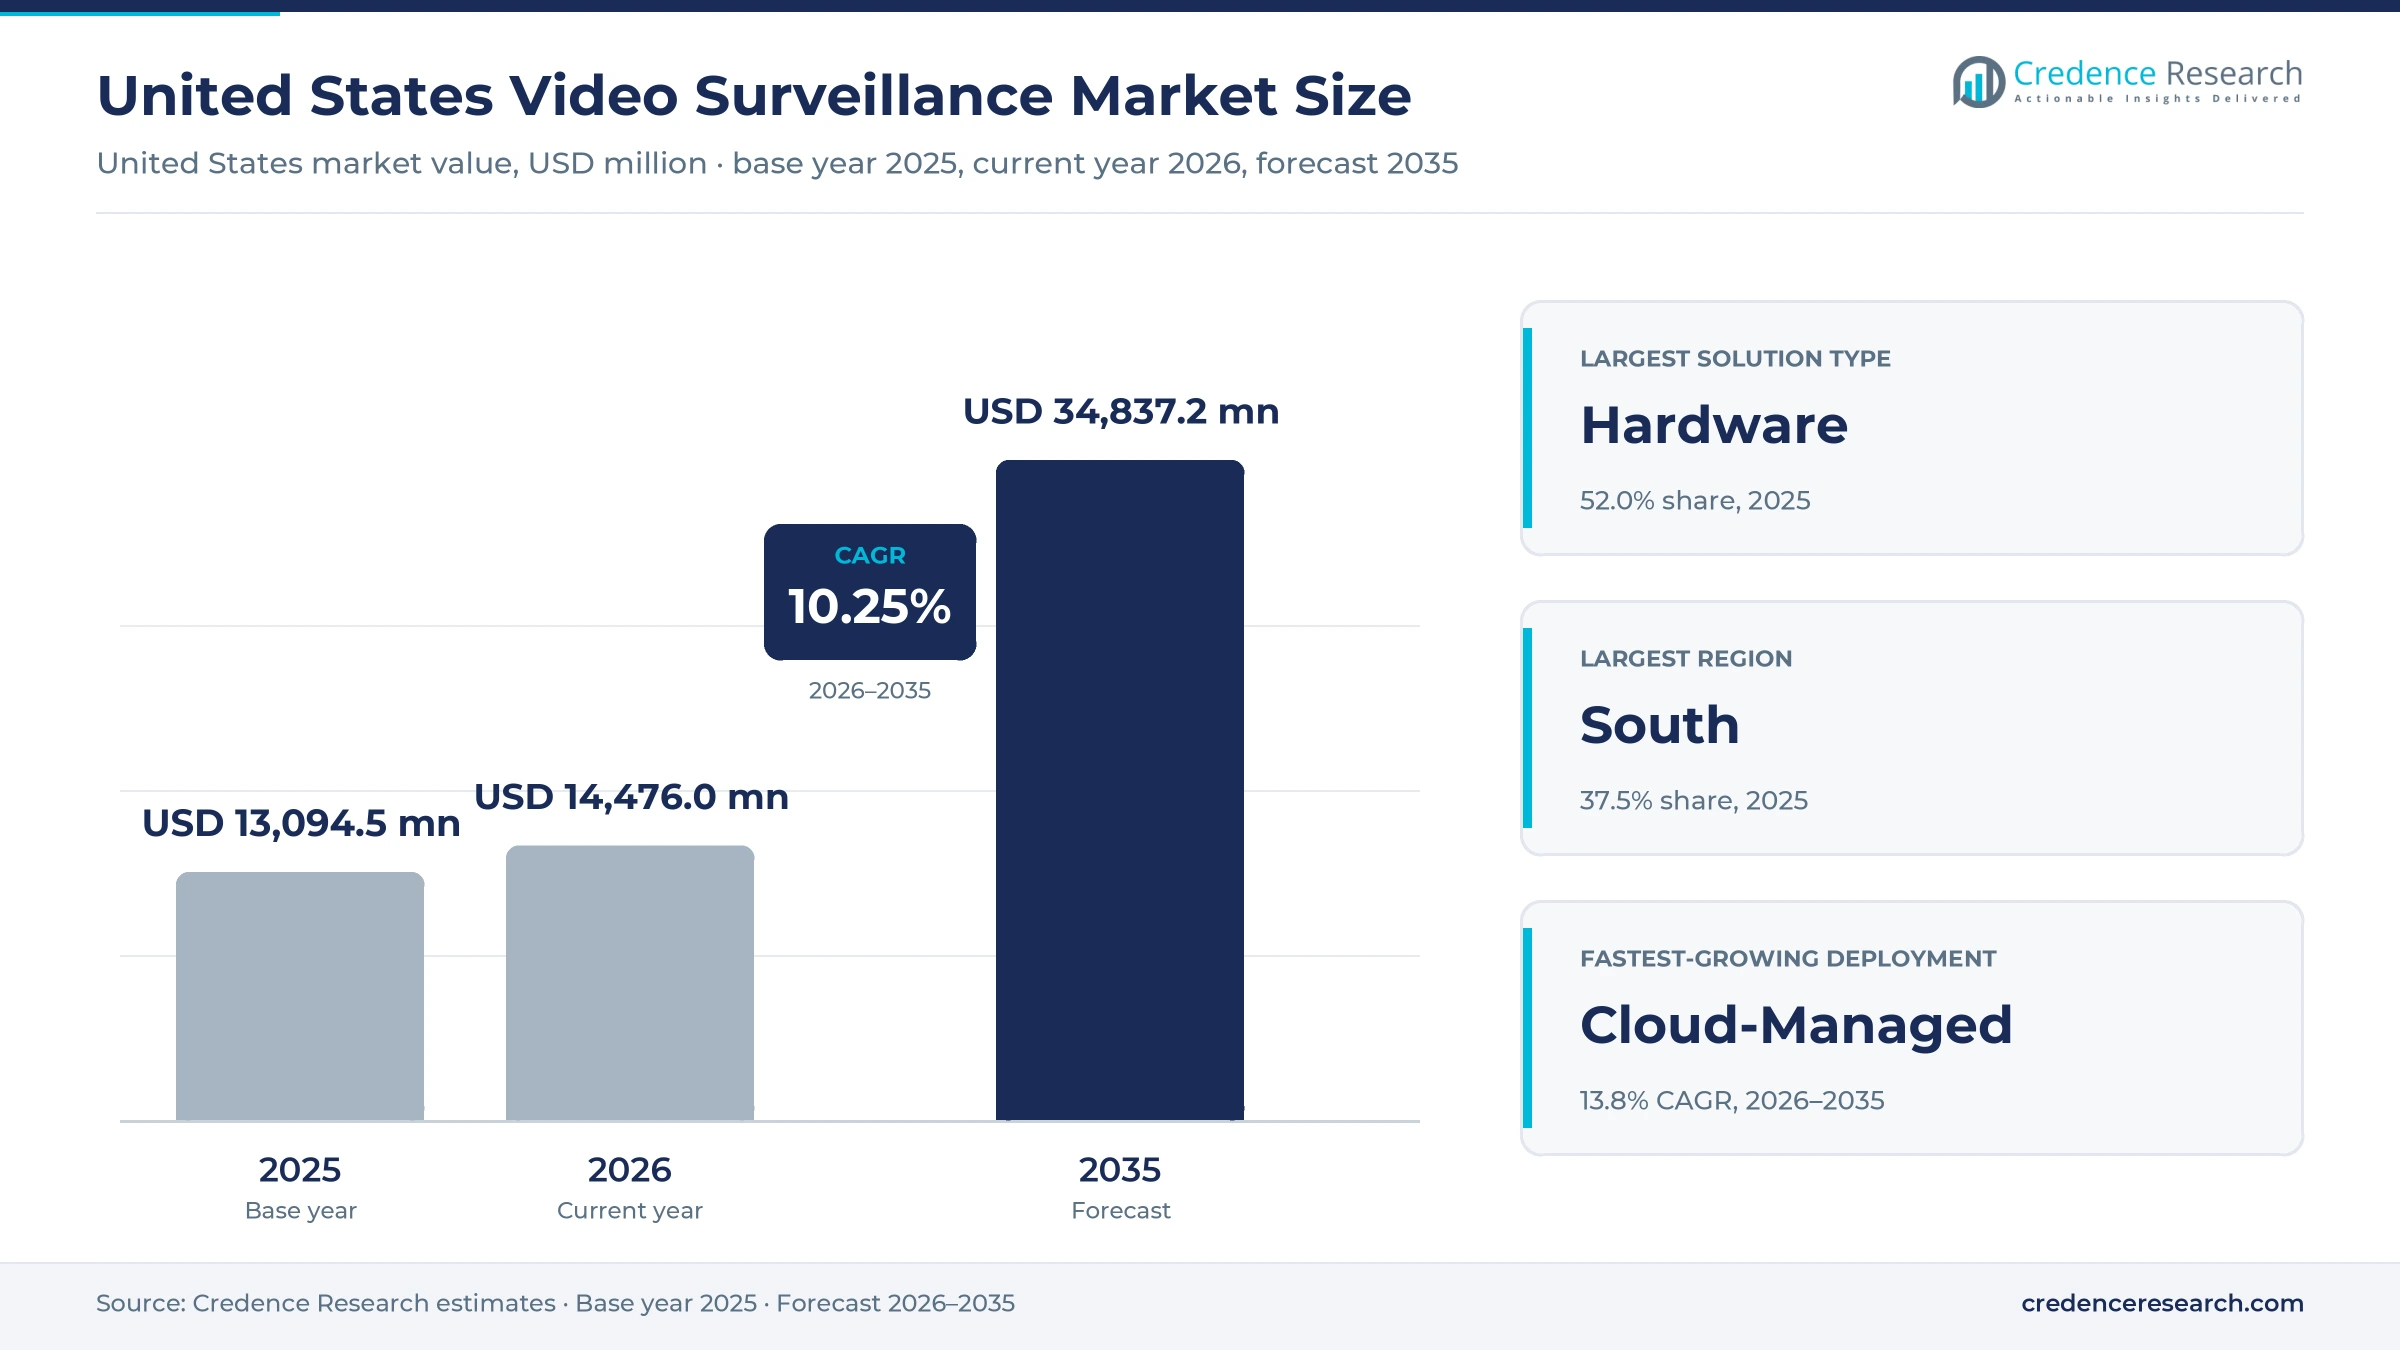
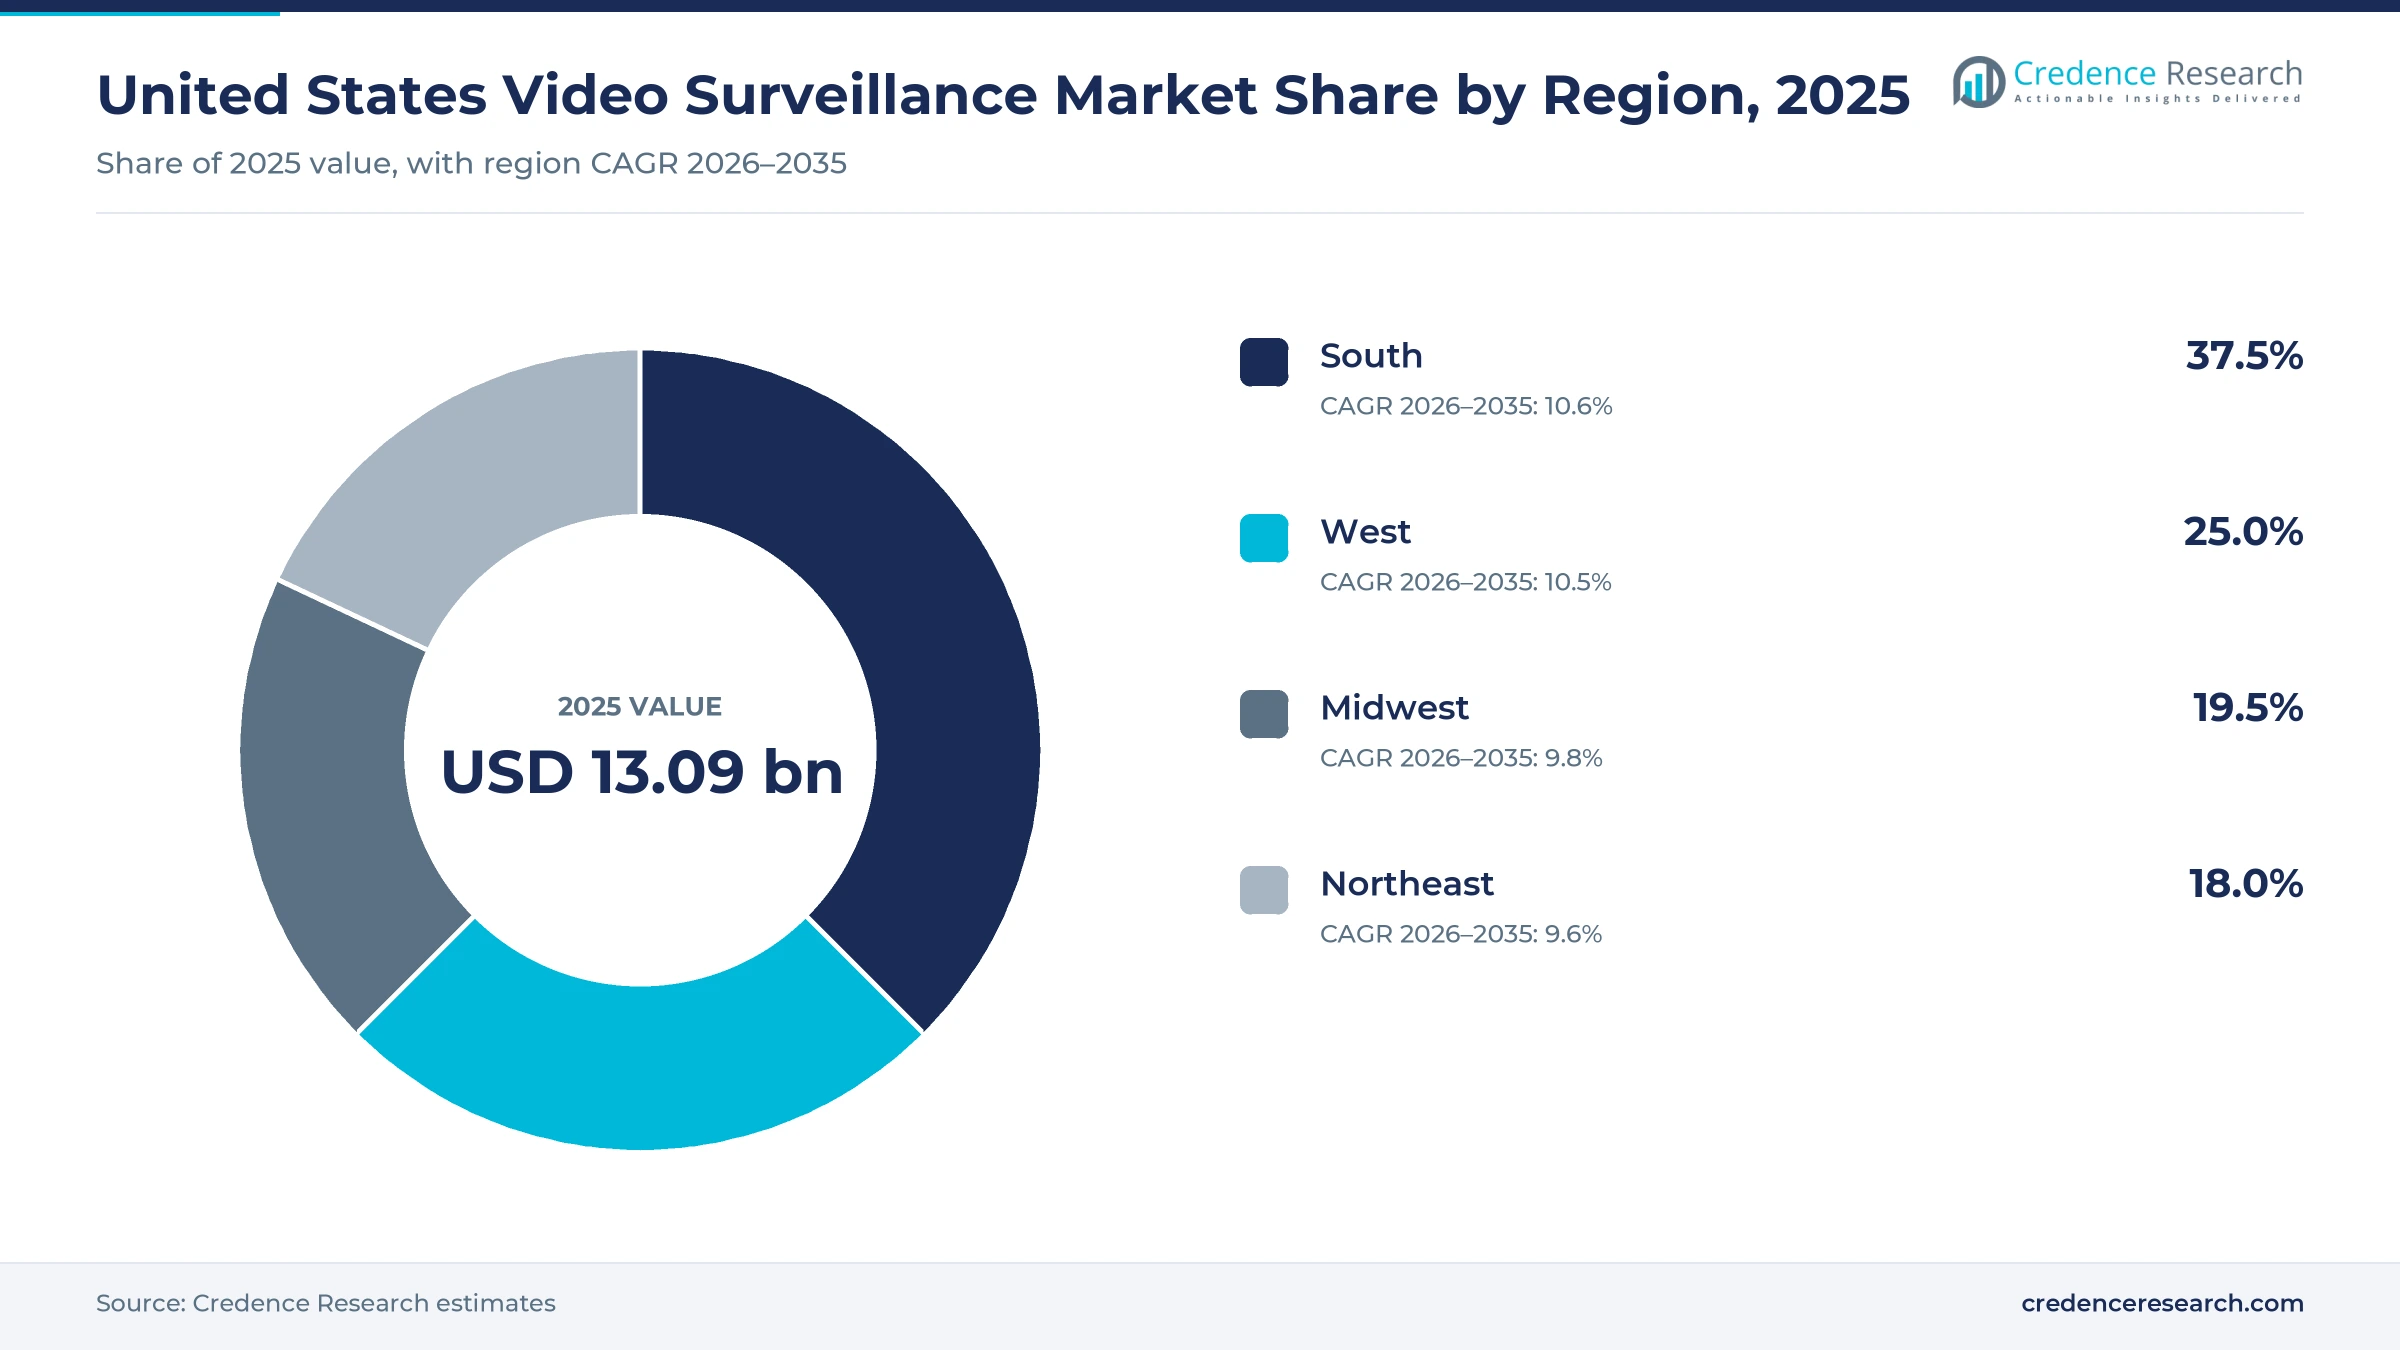
The United States video surveillance market was valued at USD 13.09 billion in 2025 and is projected to increase from USD 14.48 billion in 2026 to USD 34.84 billion by 2035, registering a CAGR of 10.25% during 2026–2035. Spending is driven by organizations that want recorded footage to be searchable by AI, by multi-site operators moving camera management to hybrid and cloud platforms, and by buyers replacing equipment that no longer meets federal procurement rules. The South held the largest regional share, 37.5% in 2025, and it is also the fastest-growing region at 10.6% a year as population and new commercial sites keep shifting toward the region. Hardware still takes the largest slice of spending, but software licenses grow faster because vendors now charge per camera and per year. Tariff-driven price increases on imported cameras in 2025 raised project costs, while the FCC voted in October 2025 to create a process that can stop sales of previously authorized equipment from listed suppliers.
Cameras, recording software and service contracts make up the market
The market counts spending by U.S. businesses, public agencies, healthcare providers and households on security cameras, recorders and storage appliances, video management and analytics software, cloud licenses and the installation, monitoring and maintenance services that keep systems running. Buyers purchase through integrators, alarm dealers, IT resellers, retail and online stores, and direct vendor sales teams.
Body-worn police cameras, in-vehicle dash cameras, license plate reader subscriptions sold as standalone services and alarm monitoring without video are outside the scope. The value chain runs from chip and sensor makers through camera brands and software developers to distributors, integrators and dealers, and finally to single sites, multi-site organizations, public agencies and households.
United States Video Surveillance Market Insights
- The United States video surveillance market grows from USD 13.09 billion in 2025 to USD 34.84 billion by 2035 at a 10.25% CAGR as AI search and cloud licenses lift spending per camera.
- The South held the largest regional share at 37.5% in 2025 and grows fastest, helped by population growth of 6.0% since 2020.
- Hardware led solution types with 52.0% in 2025, while Software is the fastest-growing solution type at 12.7% a year to 2035.
- The FCC voted on Oct. 28, 2025 to create a process that can stop the import and sale of previously authorized equipment from Covered List suppliers.
- Verkada raised $200 million in February 2025 and reported more than 30,000 customers, as cloud-managed vendors win share from recorder-based systems.
Hardware leads while cloud-managed systems grow fastest
Hardware holds the largest share as software scales fastest
Based on solution type, the market is categorized into hardware, software and services. Hardware led with 52.0% of 2025 value because every new site still needs cameras, recorders and storage, and higher-specification units carry more of the cost. Cisco Meraki made its MV84X its first multi-imager camera in spring 2025, packing four 5MP sensors and a 4 TB solid-state drive into one housing. Software grows fastest at 12.7% a year as Genetec's global survey of 7,368 security professionals, released in December 2025, found that appetite for AI had more than doubled in a year, and analytics are sold as per-camera licenses.
On-premises systems lead as cloud-managed estates grow fastest
Based on deployment model, the market is categorized into on-premises, hybrid and cloud-managed systems. On-Premises led with 50.0% of 2025 value because most installed cameras still record to local servers and recorders, which suits large campuses with limited upload bandwidth. Motorola Solutions designed its generative AI Avigilon Visual Alerts tool, launched Sept. 25, 2025, to run on premises. Cloud-Managed grows fastest at 13.8% a year as Verkada reported more than 1.5 million of its cloud-managed devices online in February 2025, and the cloud-managed Meraki MV53X stores up to 120 days of footage on board.
Commercial sites lead while healthcare facilities grow fastest
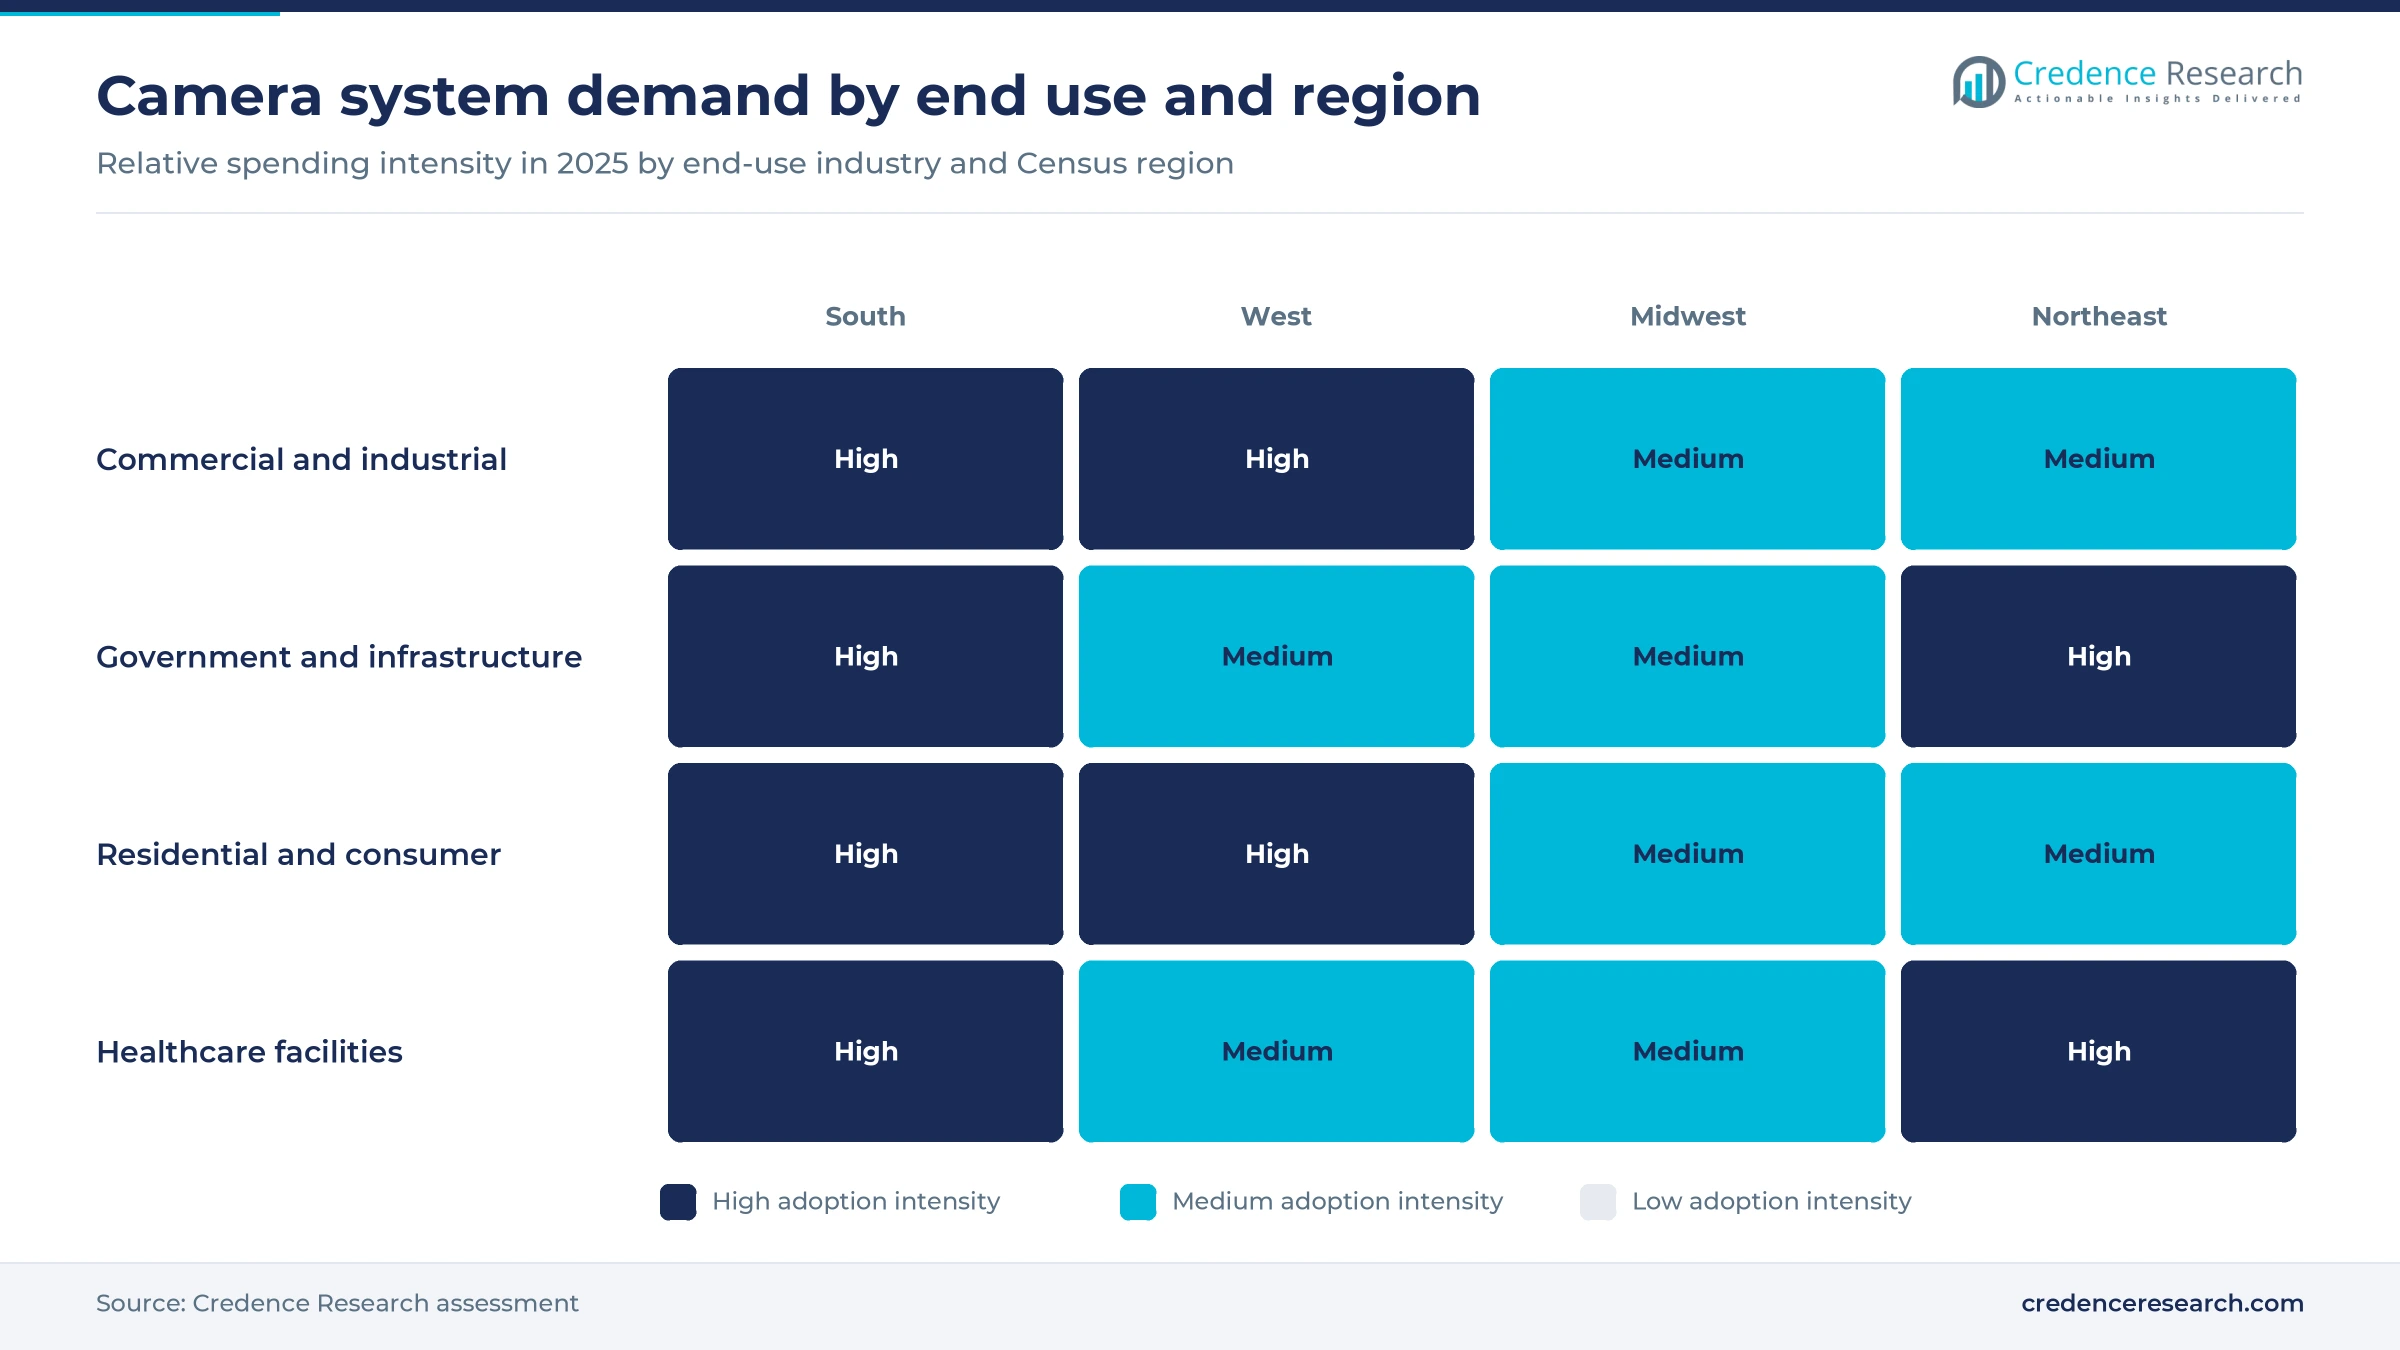
Based on end-use industry, the market is categorized into commercial and industrial facilities, government and infrastructure, residential and consumer, and healthcare facilities. Commercial and Industrial Facilities led with 44.0% of 2025 value because offices, stores, warehouses and plants run the largest camera counts per site, and Verkada counted more than 90 Fortune 500 companies among its customers in February 2025. Healthcare Facilities grows fastest at 11.2% a year as violence against staff concentrates in care settings, with a 2018 rate of 124.9 injuries per 10,000 full-time workers in psychiatric and substance abuse hospitals, according to the Bureau of Labor Statistics. Residential demand runs through home security systems and app-based cameras.
Investigation leads while proactive detection grows fastest
Based on application, the market is categorized into incident investigation, proactive threat detection and operational video intelligence. Incident Investigation led with 55.0% of 2025 value because most footage is still reviewed after an event, and Ring said seven neighbors shared 168 videos within hours of a Providence Police request after a December 2025 shooting near Brown University. Proactive Threat Detection grows fastest at 12.2% a year as platforms trigger action before harm, and Motorola Solutions said its Inform software can turn on nearby cameras and alert guards by radio after repeated failed badge swipes.
| Segment Group | Leading Sub-segment | Share, 2025 | Fastest-growing Sub-segment | CAGR, 2026–2035 |
|---|---|---|---|---|
| By Solution Type | Hardware | 52.0% | Software | 12.7% |
| By Deployment Model | On-Premises | 50.0% | Cloud-Managed | 13.8% |
| By End-Use Industry | Commercial and Industrial Facilities | 44.0% | Healthcare Facilities | 11.2% |
| By Application | Incident Investigation | 55.0% | Proactive Threat Detection | 12.2% |
Per-camera licenses now rival the price of the camera
U.S. camera pricing now combines an upfront device purchase with a recurring license for each camera, while large projects add installation and support contracts priced by the integrator. Cloud vendors sell multi-year licenses that are prepaid, so a ten-year Verkada term lists at $2,199 per camera, which ties customers to one platform for the life of the hardware. Johnson Controls took the opposite route in March 2025, promoting its victor VideoEdge recorders with no extra camera licensing fees for Illustra Flex and Pro cameras. Tariffs, covered in the challenges, move hardware prices, while license prices stay steady and protect vendor margins.
| Offer | Typical price or fee | Basis |
|---|---|---|
| Ring Home plans, Basic to Premium | USD 4.99 to USD 19.99 a month | Ring pricing page, November 2026 |
| Ring Retinal 4K and 2K cameras | USD 59.99 to USD 499.99 | TechCrunch, September 2025 |
| Verkada cameras | About USD 699 to USD 7,899 a camera | Safe and Sound lists, 2026 |
| Verkada cloud license | From USD 249 per camera a year | Safe and Sound lists, 2026 |
| Cisco Meraki MV enterprise license, one year | USD 476.99 per camera | CDW lists, November 2026 |
Request a Free Sample
Fill in your details and we'll send you a free sample report.
- Sample data tables & charts
- Research methodology
AI search, hybrid cloud and compliant gear lift budgets
AI analytics make recorded footage searchable
Buyers now pay for software that finds people, vehicles and events in hours of footage instead of storing video nobody reviews. Genetec reported in December 2025 that AI ranked alongside access control and video as a 2026 project priority for the first time, based on its survey run from Aug. 18 to Sept. 15, 2025. Motorola Solutions introduced Avigilon Visual Alerts on Sept. 25, 2025, letting users define new events such as a patient wandering near a hospital exit. Cisco Meraki added attribute search, motion search and motion recap to its MV53X 4K camera, orderable from Feb. 18, 2025. Vendors of AI camera analytics convert those features into paid license tiers.
Hybrid and cloud management spreads across multi-site estates
Organizations with many sites want one console for every camera, which favors hybrid and cloud management over separate local recorders. Genetec found in its 2025 survey of more than 5,600 security leaders that 43% of end users preferred hybrid deployment within five years, against 18% fully cloud and 17% staying fully on premises. Verkada raised $200 million at a $4.5 billion valuation on Feb. 19, 2025, with more than 30,000 customers. Motorola Solutions showed its Operator platform for hybrid on-premises and cloud estates at ISC West in March 2026. Sellers of cloud-hosted camera services gain recurring income from each site they connect.
Federal rules force replacement with qualified equipment
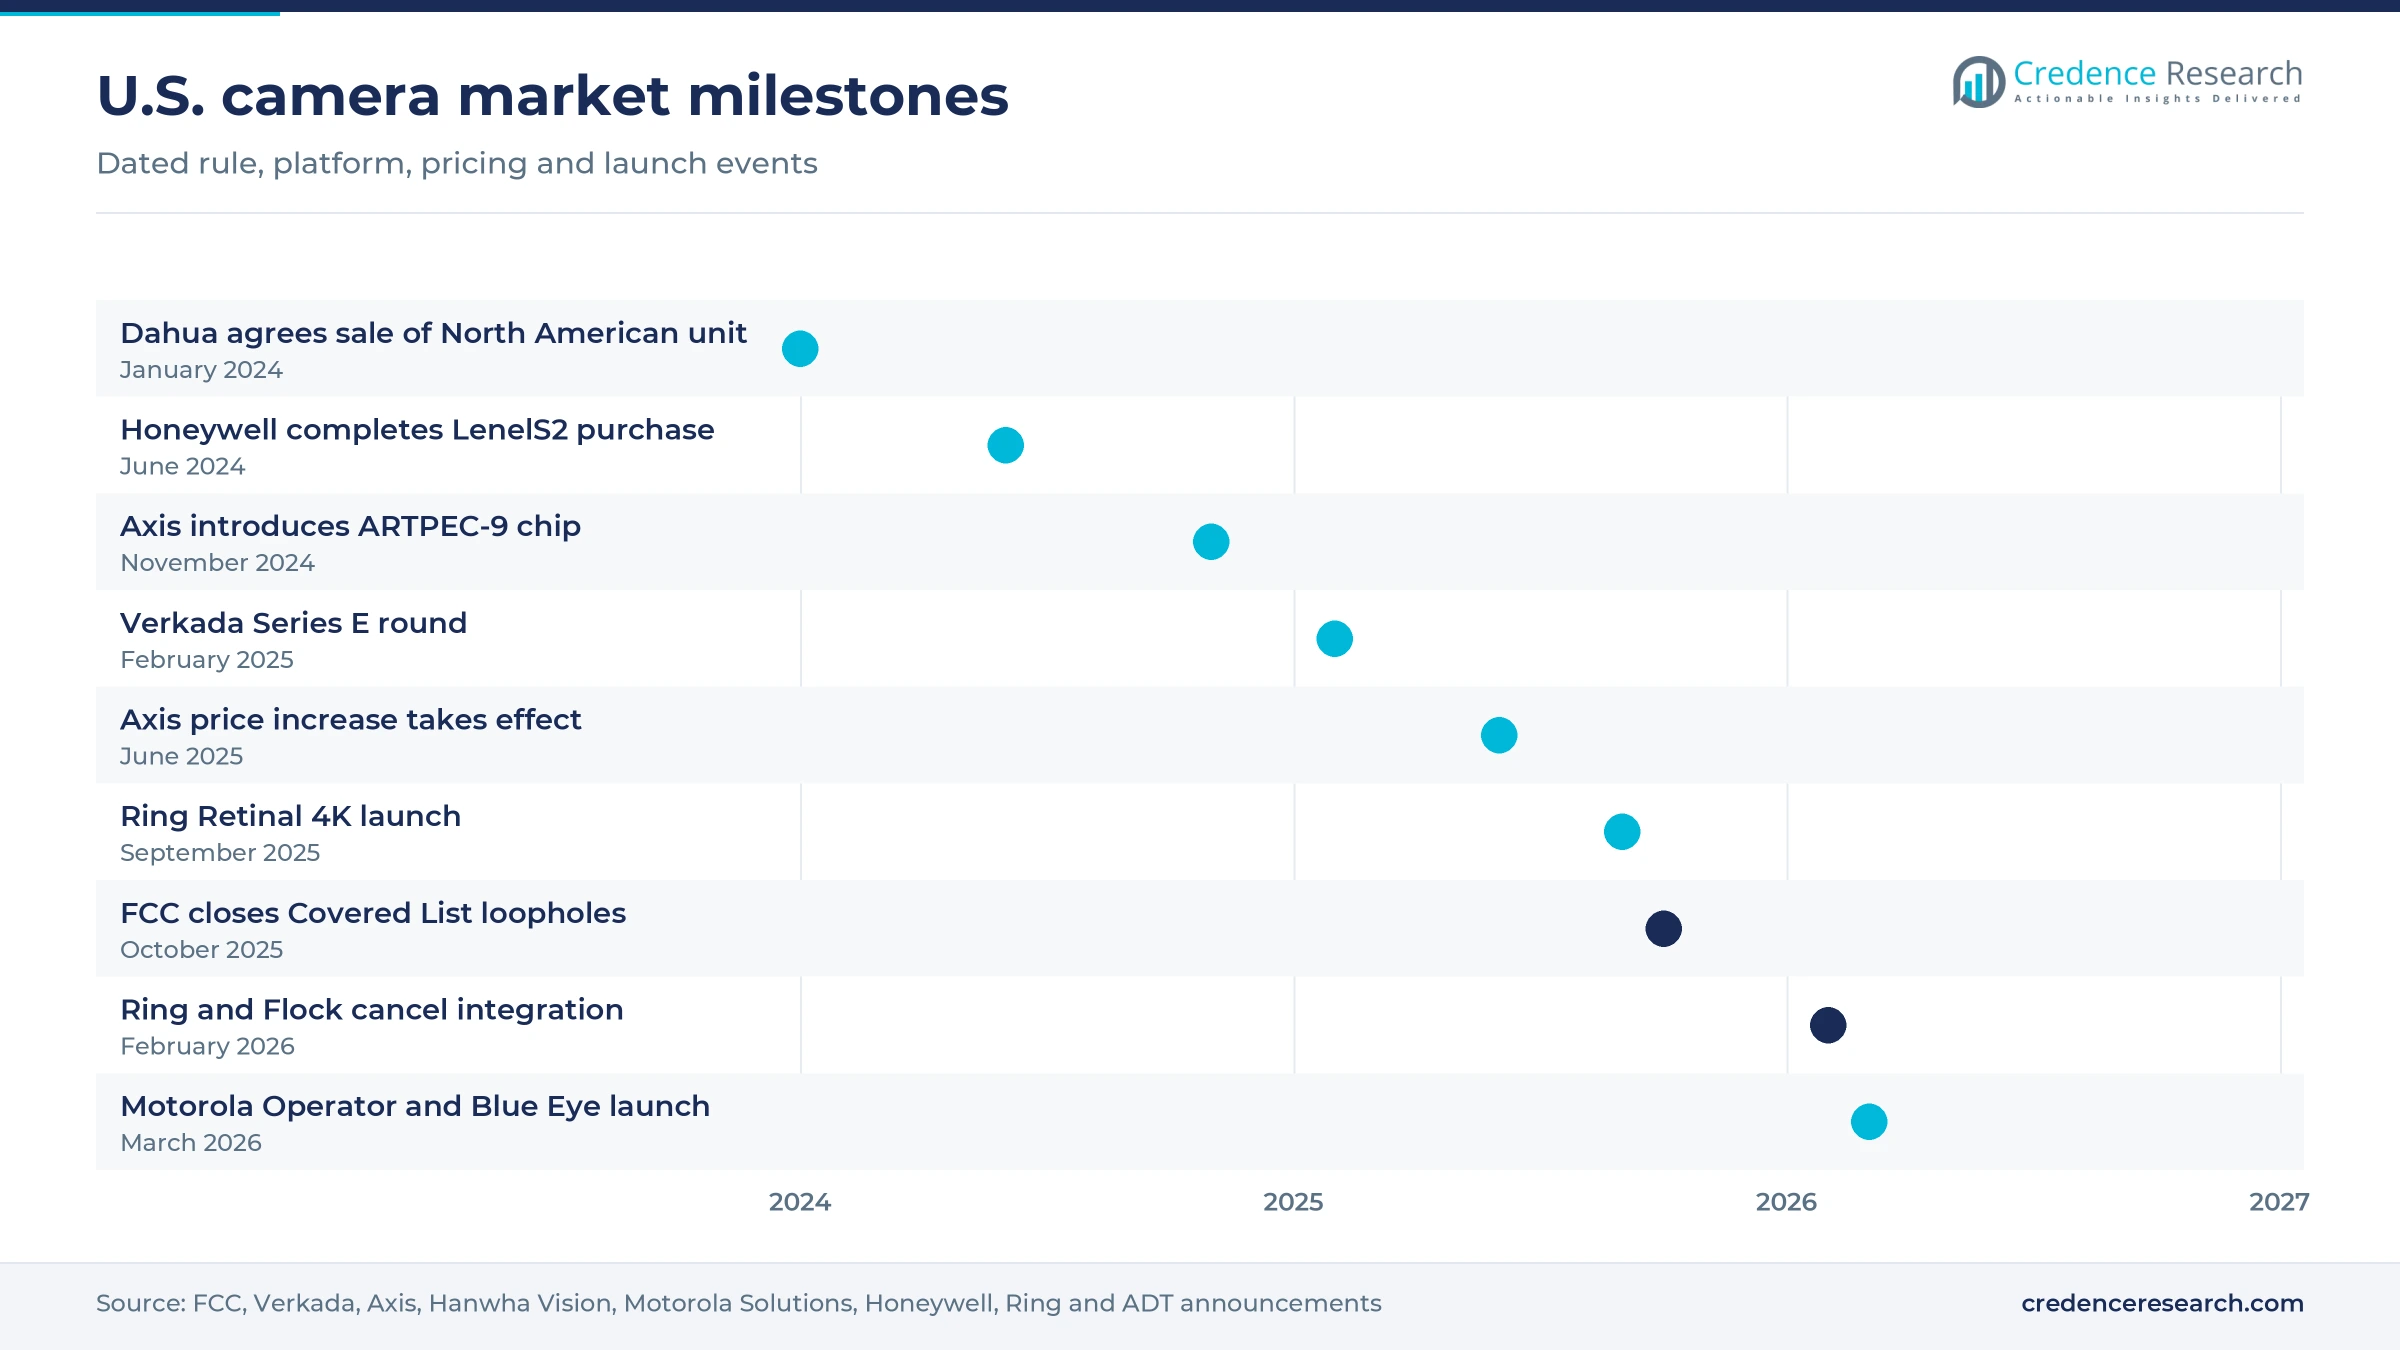
Federal rules keep pushing public buyers and contractors to replace cameras from restricted Chinese suppliers. Section 889 of the FY 2019 defense act bars federal agencies and, from Aug. 13, 2020, federal grant recipients from buying Hikvision, Dahua and Hytera video equipment for security uses, according to the Election Assistance Commission. The FCC voted unanimously on Oct. 28, 2025 to close the modular transmitter loophole and create a process to stop sales of previously authorized devices. Dahua had already agreed in January 2024 to sell its North American business to Luminys Systems. Each restriction widens the replacement pool for compliant camera makers such as Axis, Hanwha Vision and Motorola Solutions.
Retail theft keeps loss prevention budgets on cameras
Retailers are adding cameras inside and outside stores because theft and violence keep rising. Shoplifting and merchandise theft incidents rose 19% from 2023 to 2024, after a 26% rise the year before, according to the National Retail Federation report summarized by ASIS. In the same survey of 70 retail companies, 61% had increased perimeter and exterior measures such as lighting, cameras and license plate readers, and 57% planned further increases within 18 months. That demand favors vendors that can manage cameras across hundreds of stores from one console and share clips with police. Chains with hundreds of stores therefore become some of the largest buyers of multi-site camera platforms.
Smart home cameras, remote guarding and hospitals gain
Home cameras shift to 4K and recognition features
Consumer cameras are moving from simple motion alerts to higher-resolution devices with recognition and neighborhood features. Amazon launched its Ring Retinal 4K line on Sept. 30, 2025, with the Wired Doorbell Pro, Floodlight Cam Pro and Outdoor Cam Pro. Familiar Faces, which lets owners enroll friends and family so routine visits trigger fewer alerts, was set to roll out from December 2025. Search Party, which uses nearby outdoor cameras to look for lost dogs, was scheduled to start in November 2025. ADT began offering five new Google Nest camera models on Oct. 15, 2025, widening its professionally installed lineup. Features that require a paid plan keep subscription income growing faster than device sales.
Remote monitoring and agentic AI emerge in place of patrols
Enterprises are pairing cameras with remote operators and AI assistants to cover more sites with fewer guards. Motorola Solutions presented Blue Eye at ISC West in March 2026, a remote monitoring service with human-led 24/7 threat interception and talk-down through site speakers. The same launch added Assist Chat, an AI interface that lets operators query system data, and an expanded Visual Alerts appliance for automated threat triage. Genetec found that 70% of respondents in its 2026 survey had concerns about how AI systems are designed, particularly data use. Vendors that explain their models clearly will win remote monitoring contracts first.
Hospitals open a high-value opening for camera vendors
Hospitals and care facilities are an opening because staff safety now drives camera spending in patient areas and entrances. Healthcare workers accounted for 73% of nonfatal workplace injuries due to violence in 2018, according to the Bureau of Labor Statistics, and were about five times as likely to suffer them as all workers. The rate in hospitals was 12.8 per 10,000 full-time workers against 2.1 for all workers. Generative AI alerts for patients wandering near exits, noted in the drivers, are an early example of analytics built for hospital floors. Vendors that integrate cameras with nurse call, wandering alerts and duress buttons can sell larger contracts per facility.
Unified video and door platforms open multi-site deals
Multi-site organizations increasingly buy cameras and door control from one vendor, which opens larger platform contracts. Honeywell completed its $4.95 billion purchase of Carrier's Global Access Solutions business, including LenelS2, on June 3, 2024. Facilities Dive reported that LenelS2 brought access control, mobile credentials and video products into the Honeywell portfolio. Johnson Controls released C•CURE IQ 3.10 on March 31, 2025 for access control and video across on-premises, hybrid and cloud deployments. Verkada said more than 70% of its large customers used two or more of its products in February 2025. Suppliers that bundle cameras with electronic access control systems raise switching costs and win renewals.
Tariffs, breach liability and privacy pushback slow buyers
Tariffs raise imported camera costs
Most U.S. cameras and components are imported, so tariff swings in 2025 went straight into project budgets. Axis Communications announced on May 13, 2025 that its camera prices would rise from June 1, citing global economic and trade conditions. Integrators told SDM in June 2025 that some vendors were passing on increases of 10% to 20% because of tariffs. Hanwha Vision instead froze its prices on June 3, 2025, showing that suppliers with deeper margins can use tariffs to win share.
Breaches raise liability for cloud camera vendors
Cloud-connected cameras create a single point of attack, and regulators now treat weak security as a legal risk. The FTC referred a complaint against Verkada to the Department of Justice on Aug. 30, 2024, and the company agreed to pay $2.95 million in a settlement it disputed. A March 2021 breach had exposed live feeds from about 150,000 cameras, including clinics and psychiatric hospitals. Buyers now ask for security audits before signing, which lengthens sales cycles for cloud vendors.
Privacy pushback limits sharing and recognition
Public objections to police access and face recognition limit some of the features vendors want to sell. Ring and Flock Safety canceled a planned integration for police video requests on Feb. 12, 2026, after it drew criticism, and Ring said no customer videos had been sent to Flock. Ring does not offer Familiar Faces in Illinois, Texas or Portland, Oregon, a sign that local rules differ. Vendors must therefore build features state by state, which raises compliance costs.
Grant funding swings delay public projects
Nonprofit organizations rely on federal grants for facility hardening and cameras, and those grants change sharply from year to year. FEMA made $274.5 million available under the FY 2025 Nonprofit Security Grant Program, with applications due Aug. 11, 2025. The Congressional Research Service put FY 2024 funding at $454 million, so the pool fell by about 40% in one year. Integrators serving these buyers face delayed or smaller projects when funding drops.
The South leads as population and new sites shift there
| Region | Value, 2025 (USD billion) | Share, 2025 | CAGR, 2026–2035 |
|---|---|---|---|
| South | 4.91 | 37.5% | 10.6% |
| West | 3.27 | 25.0% | 10.5% |
| Midwest | 2.55 | 19.5% | 9.8% |
| Northeast | 2.36 | 18.0% | 9.6% |
The South holds the largest share as new sites open
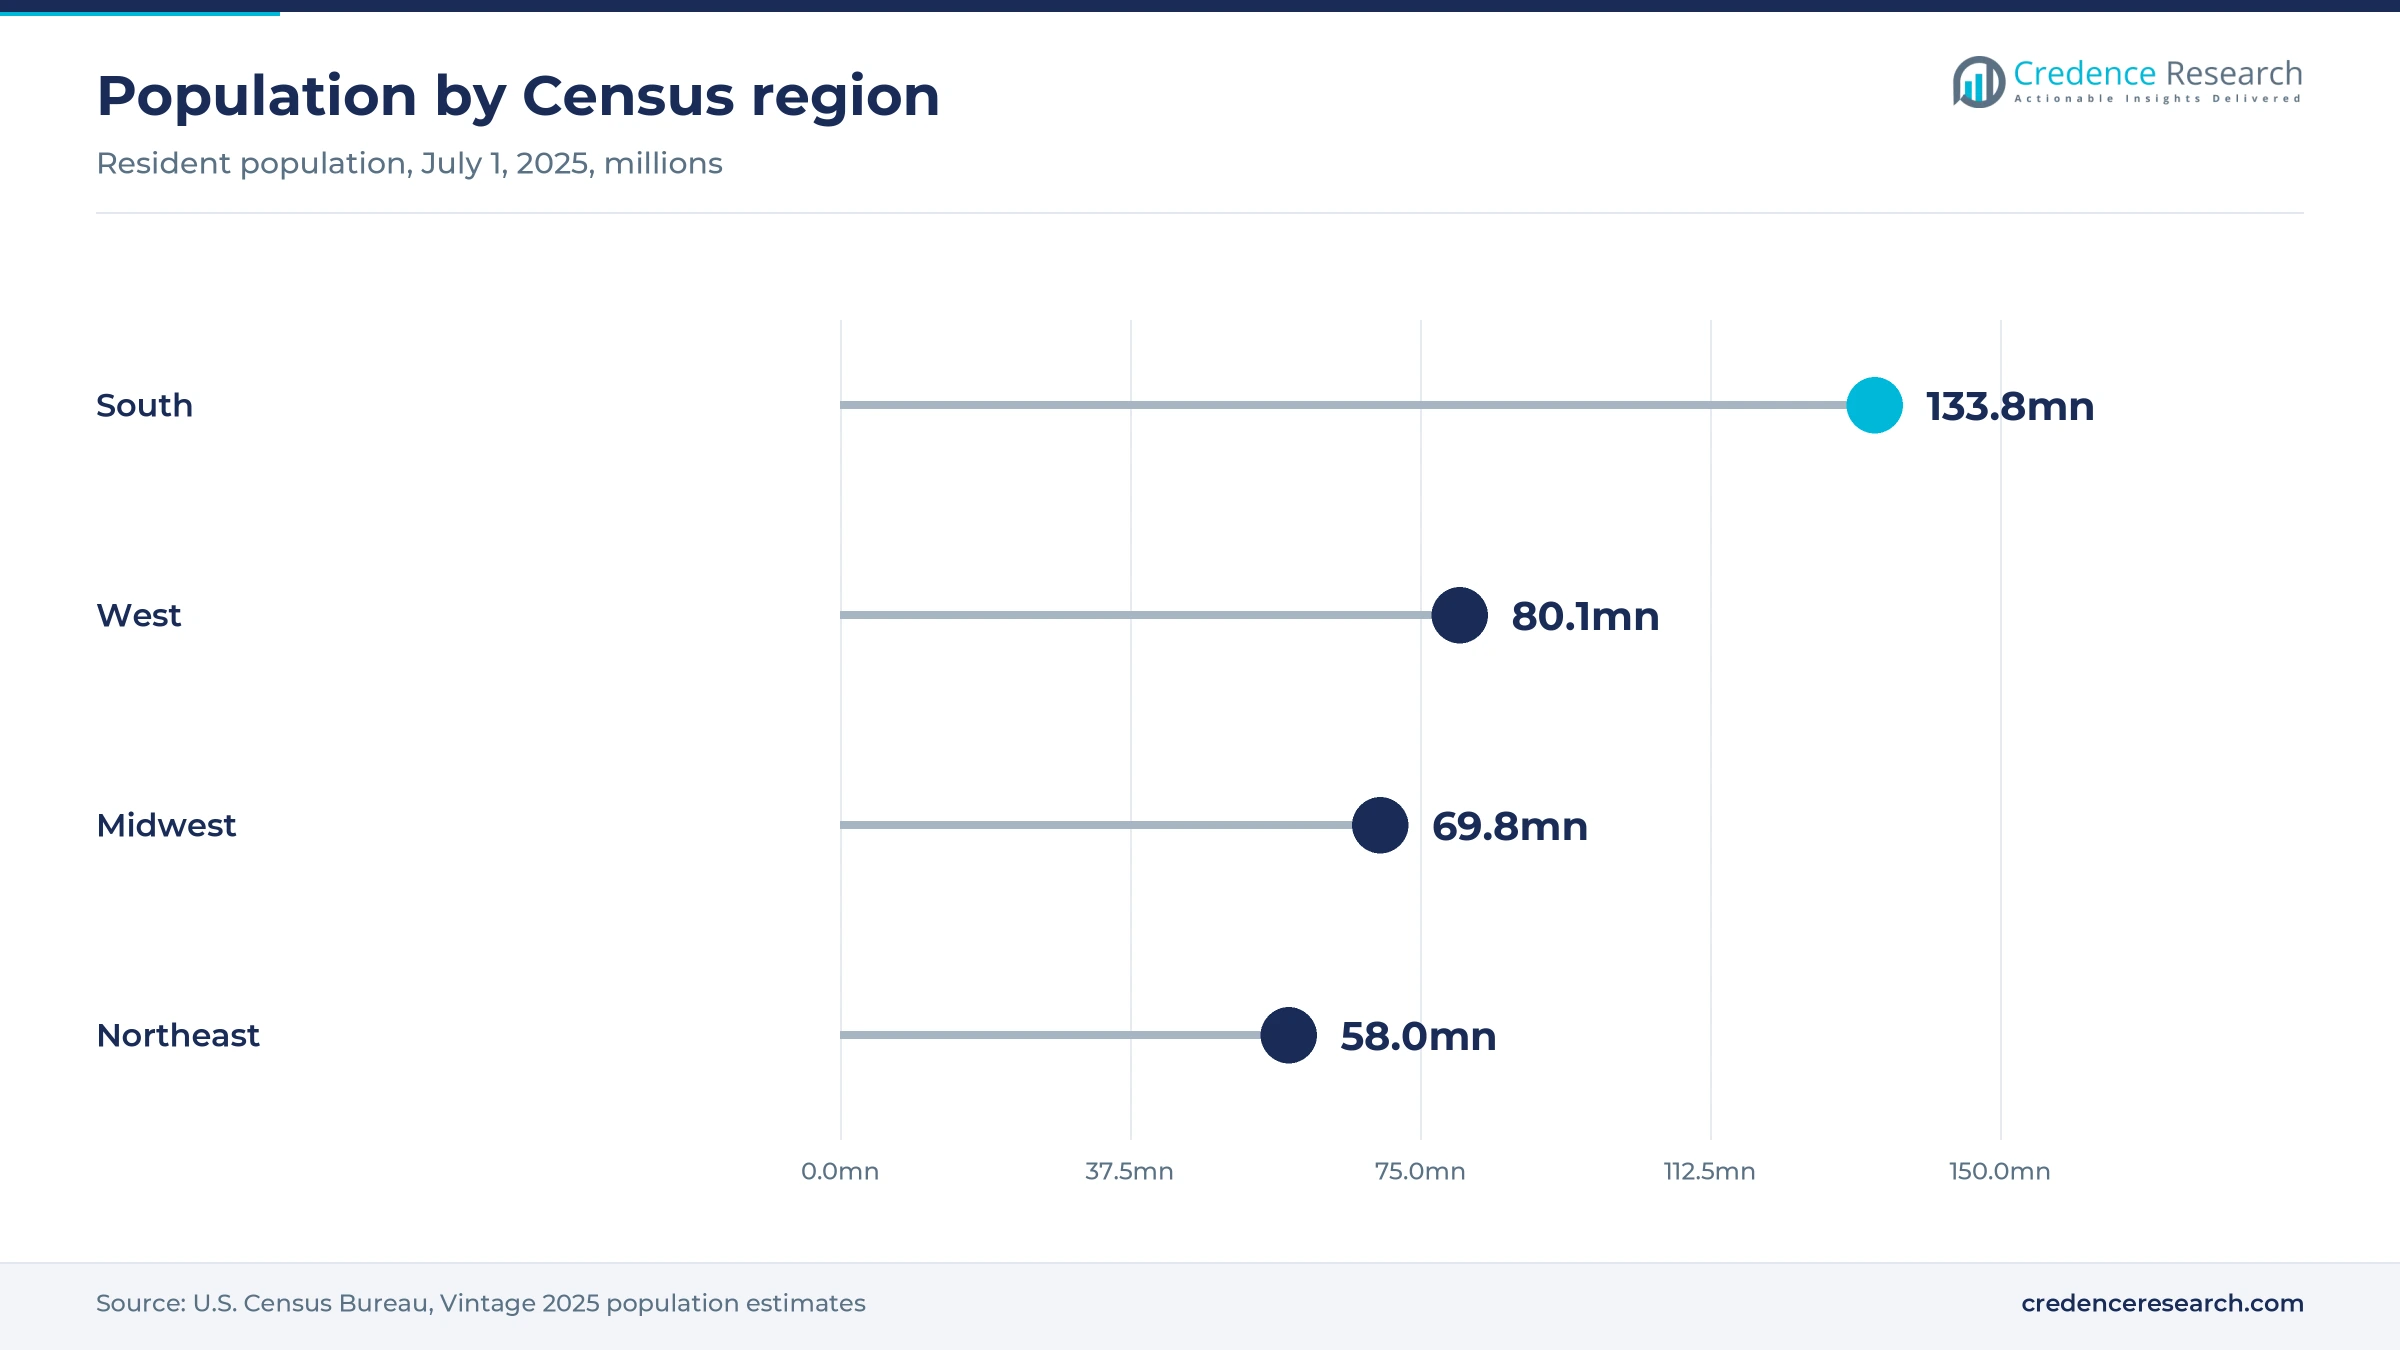
The South held 37.5% of 2025 value and grows at 10.6% a year, the fastest of the four regions. Census Bureau estimates put its population at 133.8 million on July 1, 2025, up 6.0% since 2020 and nearly twice the national rate of 3.1%. The region added about 7.6 million residents over that period, more than the other three regions combined. New warehouses, stores, schools and housing developments buy camera systems from scratch, which favors cloud-managed platforms that are simple to install.
The West ties dense metros to early technology adoption
The West held 25.0% of 2025 value and grows at 10.5% a year. Its population reached 80.1 million in 2025, up 1.9% since 2020, according to the Census Bureau. Large technology, logistics and retail operators in the region are early buyers of cloud-managed cameras and AI search. The Ring feature limits in Portland, noted in the challenges, show how local privacy rules shape what consumer vendors can sell in the region.
The Midwest relies on replacement of installed systems
The Midwest held 19.5% of 2025 value and grows at 9.8% a year. Its population rose 1.1% from 2020 to 69.8 million in 2025, according to the Census Bureau, so most demand comes from replacing older analog and recorder-based systems at existing plants, warehouses and stores. Vendors win here mainly on replacement cycles and on compliance with state privacy law.
The Northeast buys upgrades in dense cities
The Northeast held 18.0% of 2025 value and grows at 9.6% a year, the slowest of the four regions. Its population of 58.0 million in 2025 was only 0.7% above the 2020 level, according to the Census Bureau. Dense cities, transit systems and universities keep spending per site high. Police use of resident footage is established, as the Providence request noted in the segment section shows, so city agencies remain steady buyers of investigation tools.
Platform launches and FCC rules defined 2025 and 2026
| Development | Status and market relevance |
|---|---|
| In February 2025, Verkada raised a $200 million Series E round at a $4.5 billion valuation. | Completed; funds expansion of cloud-managed security |
| In September 2025, Amazon launched the Ring Retinal 4K camera and doorbell line with AI search features. | Launched; raises home camera resolution |
| In October 2025, the FCC voted to close loopholes that let Covered List suppliers keep selling previously authorized equipment. | Adopted; widens replacement demand |
| In October 2025, ADT began offering five new Google Nest camera models to its customers. | Launched; expands installed home camera range |
| In March 2026, Motorola Solutions showed its Operator platform, Blue Eye monitoring and new Avigilon cameras at ISC West. | Launched; hybrid enterprise platform |
Edge AI chips, multi-imager cameras and AV1 cut costs
- Edge AI chips move analytics onto the camera, and Axis said on Nov. 20, 2024 that its ARTPEC-9 chip triples video analytics performance.
- AV1 encoding cuts bitrate by about 20% beyond earlier gains, according to Axis, which lowers bandwidth and footage storage costs for cloud systems.
- Multi-imager cameras replace several single cameras with one mount, which reduces cabling, licenses and installation labor at large sites.
- Generative AI assistants let operators describe an event in plain language and search or trigger alerts without writing rules.
Need a Custom Version of This Report?
Tailor the scope, geography, or segments to your exact requirements.
- Custom geography or segment scope
- Direct access to our analyst team
Platform vendors and camera makers compete for the stack
Competition turns on who owns the software layer that sits on top of the cameras. Motorola Solutions combines Avigilon cameras, Alta cloud video and remote monitoring with its public safety radio base. Verkada sells cameras, door control, alarms and sensors managed from one cloud console, priced by license per device. Cisco Meraki reaches IT departments that already manage its network gear, while Honeywell and Johnson Controls sell video as part of building security contracts. Axis Communications and Hanwha Vision compete for integrator-led projects that need open systems and compliant hardware. In homes, Ring competes on device price and app features, while ADT sells installed systems with professional monitoring. Price competition is sharpest in hardware, while enterprise contracts are won on integration, security audits and migration risk.
Platform vendors, camera makers and channels form three tiers
The U.S. supply side splits into three tiers with different economics. Platform vendors such as Motorola Solutions, Verkada, Cisco Meraki, Honeywell and Johnson Controls sell cameras with their own software and earn most of their margin on licenses and service. Camera specialists such as Axis Communications and Hanwha Vision sell open devices through distributors and integrators, which compete on price and compliance. Thousands of integrators and alarm dealers install and maintain systems, while Ring and ADT reach households. Federal procurement rules and cybersecurity audits raise entry barriers for new camera brands, which keeps the professional tier concentrated.
Companies profiled and their roles in this market
| Company | Type | Role in the market |
|---|---|---|
| Motorola Solutions | Enterprise and public safety platform | Launched Inform in September 2025 and Operator and Blue Eye in March 2026 |
| Verkada | Cloud-managed platform | Raised $200 million in February 2025 and reported more than 30,000 customers |
| Axis Communications | Camera manufacturer | Introduced the ARTPEC-9 chip in November 2024 and raised prices from June 2025 |
| ADT | Residential installer and monitor | Added five Google Nest camera models in October 2025 |
| Amazon (Ring) | Consumer camera brand | Launched Retinal 4K cameras in September 2025 and ended the Flock integration plan in February 2026 |
| Honeywell | Building security vendor | Completed the LenelS2 acquisition from Carrier in June 2024 |
| Johnson Controls | Building security vendor | Released C•CURE IQ 3.10 and victor VideoEdge recorders in March 2025 |
| Hanwha Vision | Camera manufacturer | Froze U.S. prices and absorbed tariff costs from June 2025 |
| Cisco (Meraki) | Cloud-managed network and camera vendor | Released the MV53X and MV84X cameras in 2025 |
Recurring software, not camera counts, carries growth
Credence Research's view is that the U.S. market will be won on software and services rather than on camera counts. Hardware remains the largest share, but tariff swings and federal supplier rules make it the least predictable line. Cloud-managed vendors keep adding sites by pricing each camera by the year, and platform vendors lock in multi-site customers by combining cameras, door control and remote monitoring. The strongest positions belong to suppliers that pass security audits, explain their AI clearly and offer hybrid options for campuses that cannot move every recorder to the cloud.
Site counts, list prices and filings anchor the estimate
The report uses 2025 as the base year and 2026 to 2035 as the forecast period. Market values come from the Credence Research model, which builds spending from counts of U.S. commercial sites, public agencies and households and typical yearly outlays on cameras, software licenses and services. Segment and regional splits are Credence Research estimates built from Census Bureau population data, Bureau of Labor Statistics and National Retail Federation figures, FEMA grant notices, FCC actions, published vendor price lists, and company announcements and filings. No interviews or primary surveys were conducted for this edition.
Camera estates become managed, searchable data services
The United States video surveillance market is expected to grow from USD 14.48 billion in 2026 to USD 34.84 billion by 2035 at a 10.25% CAGR. Software and cloud-managed deployments will gain the most share, with cloud-managed systems rising 13.8% a year as recorder-based systems reach the end of their lives. Hardware spending will move in cycles tied to tariffs, federal supplier rules and resolution upgrades. The South will add the most new sites as its population grows. By 2035, most U.S. organizations are likely to buy cameras as part of a managed, searchable data service, with AI assistants sold as paid upgrades.
Tariffs and the pace of cloud migration set the 2035 range
The range of outcomes depends on how quickly multi-site organizations move recorder-based estates to hybrid and cloud platforms and on how camera prices settle after the 2025 tariff increases. A downside case assumes renewed tariff rises, smaller public grant pools and stricter state privacy rules. The base case assumes steady replacement of restricted equipment and gradual cloud migration. An upside case needs faster adoption of AI search and remote monitoring, which would lift license spending per camera.
| Scenario | CAGR, 2026–2035 | Value, 2035 | What has to hold |
|---|---|---|---|
| Downside | 8.4% | USD 30.04 billion | Tariffs rise again, grant pools shrink and state privacy rules restrict analytics |
| Base | 10.25% | USD 34.84 billion | Restricted equipment is replaced steadily while cloud migration continues at the current pace |
| Upside | 11.8% | USD 39.66 billion | AI search and remote monitoring spread quickly and lift license spending per camera |
Frequently Asked Questions
How big is the United States video surveillance market?
Which solution type leads U.S. camera spending?
Which U.S. region leads the market?
Which deployment model grows fastest?
How do FCC rules affect camera buyers?
How did tariffs affect U.S. camera prices in 2025?
Who are the key companies in the United States video surveillance market?
What does a cloud camera license cost in the United States?
Table of Content
Chapter 1 Market Segmentation
- 1.1 Segmentation Framework
- 1.1.1 Product and Service Classification
- 1.1.2 Application and End-Use Classification
- 1.1.3 Technology and Solution Classification
- 1.1.4 Customer and Distribution Channel Classification
- 1.1.5 Geographic Segmentation
- 1.1.6 Market Segment Definitions and Boundaries
- 1.2 By Solution Type
- 1.2.1 Hardware
- 1.2.2 Software
- 1.2.3 Services
- 1.3 By Deployment Model
- 1.3.1 On-Premises
- 1.3.2 Hybrid
- 1.3.3 Cloud-Managed
- 1.4 By End-Use Industry
- 1.4.1 Commercial and Industrial Facilities
- 1.4.2 Government and Infrastructure
- 1.4.3 Residential and Consumer
- 1.4.4 Healthcare Facilities
- 1.5 By Application
- 1.5.1 Incident Investigation
- 1.5.2 Proactive Threat Detection
- 1.5.3 Operational Video Intelligence
Chapter 2 Introduction
- 2.1 Report Objectives and Scope
- 2.2 Product Definition and Industry Terminology
- 2.3 Market Inclusions and Exclusions
- 2.4 Research Process
- 2.4.1 Primary Research and Expert Interviews
- 2.4.2 Secondary Research and Source Review
- 2.4.3 Top-Down and Bottom-Up Estimation
- 2.4.4 Data Triangulation and Verification
- 2.5 Market Size Measurement Basis
- 2.5.1 2025: USD 13.09 billion → 2035: USD 34.84 billion
- 2.6 Historical and Forecast Reference Periods
- 2.6.1 Historical Period: 2018-2025
- 2.6.2 Base Year: 2025
- 2.6.3 Forecast Period: 2025-2035
- 2.7 Research Assumptions and Limitations
Chapter 3 Executive Summary
- 3.1 Market Snapshot and Key Findings
- 3.2 Base-Year Market Size, 2025
- 3.3 Forecast Market Size, 2035
- 3.4 Revenue and Volume Growth Outlook
- 3.5 Key Demand and Supply Indicators
- 3.6 Leading Market Segments
- 3.7 Fastest-Growing Market Opportunities
- 3.8 Regional Performance Highlights
- 3.9 Technology and Industry Transformation
- 3.10 Competitive Landscape Summary
- 3.11 Analyst View and Strategic Implications
Chapter 4 United States Video Surveillance Market Trends and Developments
- 4.1 Historical Industry Development, 2018-2025
- 4.2 Recent Market Trends and Developments
- 4.3 Demand and Customer Behavior Trends
- 4.4 Technology and Product Innovation
- 4.5 Artificial Intelligence, Automation and Digitalization
- 4.6 Local Manufacturing and Supply Chain Realignment
- 4.7 Industry Partnerships, Mergers and Acquisitions
- 4.8 Sustainability and Circular Economy Developments
- 4.9 Government and Private Sector Investment Trends
- 4.10 Emerging Business Models and Commercialization
- 4.11 Industry Developments and Announcements
Chapter 5 United States Video Surveillance Market Production, Supply and Demand Analysis
- 5.1 Demand Trend and Consumption Analysis, 2018-2025
- 5.2 Demand Forecast, 2025-2035
- 5.3 Production and Output Trend, 2018-2025
- 5.4 Production and Output Forecast, 2025-2035
- 5.5 Installed Capacity and Capacity Utilization
- 5.6 Company-Wise Production Plants and Statistics
- 5.6.1 Installed Production Capacity
- 5.6.2 Actual Production
- 5.6.3 Planned Capacity and Expansion Targets
- 5.7 Supply Chain Structure and Procurement Trends
- 5.8 Supply-Demand Gap and Bottlenecks
- 5.9 Import Dependence and Sourcing Structure
- 5.10 Contract Manufacturing and Outsourcing
- 5.11 Regional Supply and Demand Concentration
Chapter 6 United States Video Surveillance Market Pricing Analysis
- 6.1 Pricing Structure and Measurement
- 6.2 Historical Pricing Trends, 2018-2025
- 6.3 Pricing Outlook, 2025-2035
- 6.4 Average Selling Price and Unit Economics
- 6.5 Pricing by Product and Market Segment
- 6.6 Geographic Pricing Differences
- 6.7 Key Input, Energy, Labor and Logistics Costs
- 6.8 Contract Pricing and Purchasing Models
- 6.9 Pricing Sensitivity and Competitive Positioning
- 6.10 Price, Margin and Profitability Implications
Chapter 7 United States Video Surveillance Market Dynamics
- 7.1 Market Growth Drivers
- 7.1.1 Demand-Side Drivers
- 7.1.2 Technology and Innovation Drivers
- 7.1.3 Infrastructure and Investment Drivers
- 7.1.4 Regulatory and Policy Drivers
- 7.2 Market Restraints
- 7.2.1 Cost and Affordability Constraints
- 7.2.2 Technology and Adoption Barriers
- 7.2.3 Supply Chain and Operational Constraints
- 7.3 Market Challenges
- 7.3.1 Competitive Pressure and Margin Erosion
- 7.3.2 Skills, Infrastructure and Implementation Gaps
- 7.4 Emerging Market Opportunities
- 7.5 Market Dynamics Impact and Time-Horizon Assessment
Chapter 8 United States Video Surveillance Value Chain Analysis
- 8.1 Industry Value Chain Overview
- 8.2 Upstream Suppliers and Critical Inputs
- 8.3 Technology and Component Providers
- 8.4 Manufacturing or Service Delivery
- 8.5 Distribution, Channel Partners and Integrators
- 8.6 Downstream Applications and End Users
- 8.7 Value Addition and Profit Pools
- 8.8 Vertical Integration and Outsourcing
- 8.9 Supplier Concentration and Risk
- 8.10 Supply Chain Localization and Resilience
Chapter 9 United States Video Surveillance Market Regulations and Policies
- 9.1 Relevant Laws, Standards and Compliance Frameworks
- 9.2 Product, Service, Safety and Quality Requirements
- 9.3 Government Policies, Incentives and Subsidies
- 9.4 Imports, Exports and Trade Barriers
- 9.5 Public Procurement and Local Content Requirements
- 9.6 Environmental and Sustainability Compliance
- 9.7 Data Protection, AI and Cybersecurity Compliance
- 9.8 Upcoming Policy Changes and Market Implications
Chapter 10 United States Video Surveillance Market Hotspots and Opportunities
- 10.1 Market Opportunity Mapping and Growth Hotspots
- 10.2 High-Growth Applications and Customer Groups
- 10.3 Underserved Markets and White-Space Opportunities
- 10.4 Emerging Technology and Product Opportunities
- 10.5 New Capacity and Investment Hotspots
- 10.6 Market Entry and Expansion Opportunities
- 10.7 Distribution and Partnership Opportunities
- 10.8 Near-Term and Long-Term Commercial Potential
- 10.9 Opportunity Attractiveness and Execution Risks
Chapter 11 United States Video Surveillance Market Outlook, 2025-2035
- 11.1 Market Size and Analysis
- 11.1.1 Revenue (Market Measurement: 2025: USD 13.09 billion → 2035: USD 34.84 billion)
- 11.1.2 Market Volume and Quantity Sold
- 11.1.3 Historical Market Size, 2018-2025
- 11.1.4 Base-Year Market Size, 2025
- 11.2 Market Forecast, 2025-2035
- 11.2.1 Revenue Forecast to 2035
- 11.2.2 Volume Forecast to 2035
- 11.2.3 CAGR and Year-on-Year Growth
- 11.2.4 Incremental Revenue Opportunity
- 11.3 Forecast Assumptions and Scenario Analysis
- 11.3.1 Base-Case Forecast
- 11.3.2 Optimistic and Conservative Scenarios
- 11.3.3 Technology, Pricing and Policy Sensitivities
- 11.4 Market Attractiveness and Growth Outlook
Chapter 12 United States Video Surveillance Market Segmentation and Outlook
- 12.1 Segmentation Summary and Market Shares, 2025
- 12.2 Largest and Fastest-Growing Segments
- 12.3 By Solution Type - Market Size and Forecast, 2025-2035
- 12.3.1 Segment Definition and Scope
- 12.3.2 Historical Market Size, 2018-2025
- 12.3.3 Revenue Forecast, 2025-2035
- 12.3.4 Volume Forecast, 2025-2035
- 12.3.5 Base-Year Market Share, 2025
- 12.3.6 Segment CAGR and Growth Drivers
- 12.3.7 Subsegment Market Size and Forecast
- 12.3.7.1 Hardware
- 12.3.7.2 Software
- 12.3.7.3 Services
- 12.3.8 Subsegment Pricing and Adoption Trends
- 12.3.9 Leading Suppliers and Competition
- 12.3.10 Regional Demand and Opportunities
- 12.4 By Deployment Model - Market Size and Forecast, 2025-2035
- 12.4.1 Segment Definition and Scope
- 12.4.2 Historical Market Size, 2018-2025
- 12.4.3 Revenue Forecast, 2025-2035
- 12.4.4 Volume Forecast, 2025-2035
- 12.4.5 Base-Year Market Share, 2025
- 12.4.6 Segment CAGR and Growth Drivers
- 12.4.7 Subsegment Market Size and Forecast
- 12.4.7.1 On-Premises
- 12.4.7.2 Hybrid
- 12.4.7.3 Cloud-Managed
- 12.4.8 Subsegment Pricing and Adoption Trends
- 12.4.9 Leading Suppliers and Competition
- 12.4.10 Regional Demand and Opportunities
- 12.5 By End-Use Industry - Market Size and Forecast, 2025-2035
- 12.5.1 Segment Definition and Scope
- 12.5.2 Historical Market Size, 2018-2025
- 12.5.3 Revenue Forecast, 2025-2035
- 12.5.4 Volume Forecast, 2025-2035
- 12.5.5 Base-Year Market Share, 2025
- 12.5.6 Segment CAGR and Growth Drivers
- 12.5.7 Subsegment Market Size and Forecast
- 12.5.7.1 Commercial and Industrial Facilities
- 12.5.7.2 Government and Infrastructure
- 12.5.7.3 Residential and Consumer
- 12.5.7.4 Healthcare Facilities
- 12.5.8 Subsegment Pricing and Adoption Trends
- 12.5.9 Leading Suppliers and Competition
- 12.5.10 Regional Demand and Opportunities
- 12.6 By Application - Market Size and Forecast, 2025-2035
- 12.6.1 Segment Definition and Scope
- 12.6.2 Historical Market Size, 2018-2025
- 12.6.3 Revenue Forecast, 2025-2035
- 12.6.4 Volume Forecast, 2025-2035
- 12.6.5 Base-Year Market Share, 2025
- 12.6.6 Segment CAGR and Growth Drivers
- 12.6.7 Subsegment Market Size and Forecast
- 12.6.7.1 Incident Investigation
- 12.6.7.2 Proactive Threat Detection
- 12.6.7.3 Operational Video Intelligence
- 12.6.8 Subsegment Pricing and Adoption Trends
- 12.6.9 Leading Suppliers and Competition
- 12.6.10 Regional Demand and Opportunities
- 12.7 Segment Growth Comparison
- 12.8 Segment Attractiveness and Priority Matrix
Chapter 13 United States Video Surveillance End-Use and Application Market Outlook
- 13.1 End-Use Industry and Customer Demand Structure
- 13.2 Leading Applications and Customer Groups
- 13.3 End-Use Market Size, Share and Forecast
- 13.4 Major End-Use Industry Deep Dives
- 13.4.1 Customer Requirements and Use Cases
- 13.4.2 Demand and Replacement Cycles
- 13.4.3 Technical and Regulatory Considerations
- 13.4.4 Purchasing and Procurement Models
- 13.4.5 Leading Vendors and Distribution Channels
- 13.4.6 Forecast and Commercial Opportunities
- 13.5 Emerging Applications and Cross-Segment Demand
- 13.6 End-Use Industry Investment Priorities
Chapter 14 United States Video Surveillance Geographic Market Outlook, 2025-2035
- 14.1 Domestic Market Distribution and Demand Clusters
- 14.2 State- or Province-Wise Market Size and Forecast, 2025-2035
- 14.3 City and Metropolitan Market Outlook
- 14.4 Industrial, Manufacturing and Commercial Clusters
- 14.5 Geographic Concentration of Key End Users
- 14.6 Local Pricing and Purchasing Differences
- 14.7 Domestic Production Facilities and Capacity Map
- 14.8 Local Infrastructure and Project Pipeline
- 14.9 State-Level Policy and Incentive Differences
- 14.10 Subnational Investment Hotspots and Opportunities
- 14.11 Distribution and Logistics Networks
- 14.12 Domestic Competitive Footprint
Chapter 15 United States Video Surveillance Technology, Innovation and Sustainability Outlook
- 15.1 Technology Landscape and Maturity
- 15.2 Product, Process and Service Innovation
- 15.3 AI, Automation and Digital Tools in the Industry
- 15.4 Technology Adoption and Performance Benchmarking
- 15.5 Innovation Pipeline and R&D Investment
- 15.6 Patent and Intellectual Property Trends
- 15.7 Energy Efficiency and Resource Management
- 15.8 Sustainability, Recycling and Circularity
- 15.9 Technology Roadmap, 2025-2035
- 15.10 Risks of Obsolescence and Technology Substitution
Chapter 16 United States Video Surveillance Market Key Strategic Imperatives
- 16.1 Growth and Market Entry Priorities
- 16.2 High-Return Products and Segments
- 16.3 Pricing, Profitability and Cost Optimization
- 16.4 Technology Investment and Product Differentiation
- 16.5 Supply Chain Localization and Resilience
- 16.6 Distribution and Customer Acquisition
- 16.7 Partnership, Acquisition and Capacity Strategy
- 16.8 Regional Expansion Priorities
- 16.9 Short-, Medium- and Long-Term Actions
Chapter 17 Competition Outlook
- 17.1 Industry Competition Characteristics
- 17.2 Market Structure and Concentration
- 17.3 Market Share and Competitive Positioning, 2025
- 17.4 Company-Wise Revenue and Product Benchmarking
- 17.5 Production and Service Capacity Benchmarking
- 17.6 Technology, Pricing and Differentiation
- 17.7 Regional Footprint and Distribution Strength
- 17.8 Mergers, Acquisitions and Strategic Alliances
- 17.9 New Entrants and Competitive Threats
- 17.10 Porter's Five Forces and Industry Attractiveness
- 17.11 Competitive Outlook, 2025-2035
Chapter 18 Company Profiles
- 18.1 Company Coverage and Selection Criteria
- 18.2 Motorola Solutions
- 18.2.1 Business Description
- 18.2.2 Company Ownership and Geographic Presence
- 18.2.3 Product and Service Portfolio
- 18.2.4 Manufacturing and Operating Footprint
- 18.2.5 Production Capacity and Expansion Plans
- 18.2.6 Financial Performance and Investment
- 18.2.7 Market Share and Competitive Position
- 18.2.8 Technology and Innovation Capabilities
- 18.2.9 Strategic Alliances or Partnerships
- 18.2.10 Recent Developments
- 18.2.11 Growth Strategy and Outlook
- 18.3 Verkada
- 18.4 Axis Communications
- 18.5 ADT
- 18.6 Amazon (Ring)
- 18.7 Honeywell
- 18.8 Johnson Controls
- 18.9 Genetec
- 18.10 Hanwha Vision
- 18.11 Cisco (Meraki)
- 18.12 Other Relevant Market Participants
Note: Every listed company is profiled on the structure shown under the first company. The company list is preliminary and may change based on research findings, market developments, data availability and client requirements.
Chapter 19 Disclaimer
- 19.1 Research and Forecast Disclaimer
- 19.2 Data Source and Estimation Limitations
Note: The depth of individual sections depends on data availability for this market. Volume, capacity, trade and other unit-based metrics are included where applicable.

