
U.S. still image licensing holds up as AI pictures spread
The United States still image market was valued at USD 1.13 billion in 2025 and is projected to increase from USD 1.17 billion in 2026 to USD 1.58 billion by 2035, registering a CAGR of 3.35% during 2026–2035. Demand comes from advertising agencies, in-house brand teams, publishers and newsrooms, online retailers and independent creators that license photographs and illustrations for campaigns, articles, product pages and social posts. The South held the largest regional share, 37.5% in 2025, because it is home to about 39% of the national population, more than any other region, and to many fast-growing small businesses. The South is also the fastest-growing region at 3.6% a year, as its population grows faster than in the other three regions. The main regulatory change came on Jan. 29, 2025, when the U.S. Copyright Office said that prompts alone do not make an AI output copyrightable, which keeps licensed human-made pictures valuable to brands that need clear ownership.
Which picture licenses the U.S. market counts and leaves out
The market counts the fees that U.S. buyers pay to license photographs, illustrations and vectors from stock and editorial libraries. It covers subscriptions, credit packs, single licenses, API contracts and managed news feeds, sold royalty-free, rights-managed or under exclusive terms, across creative stock, editorial news, sport and entertainment pictures and premium or archive collections.
Stock video, music, commissioned photo shoots, camera and software sales, and bulk datasets sold to AI developers for model training are excluded. Value flows from contributors and staff photographers to agencies and marketplaces, which set prices, clear rights and indemnify buyers, and then to agencies, brand teams, publishers and creators that place the pictures in finished work.
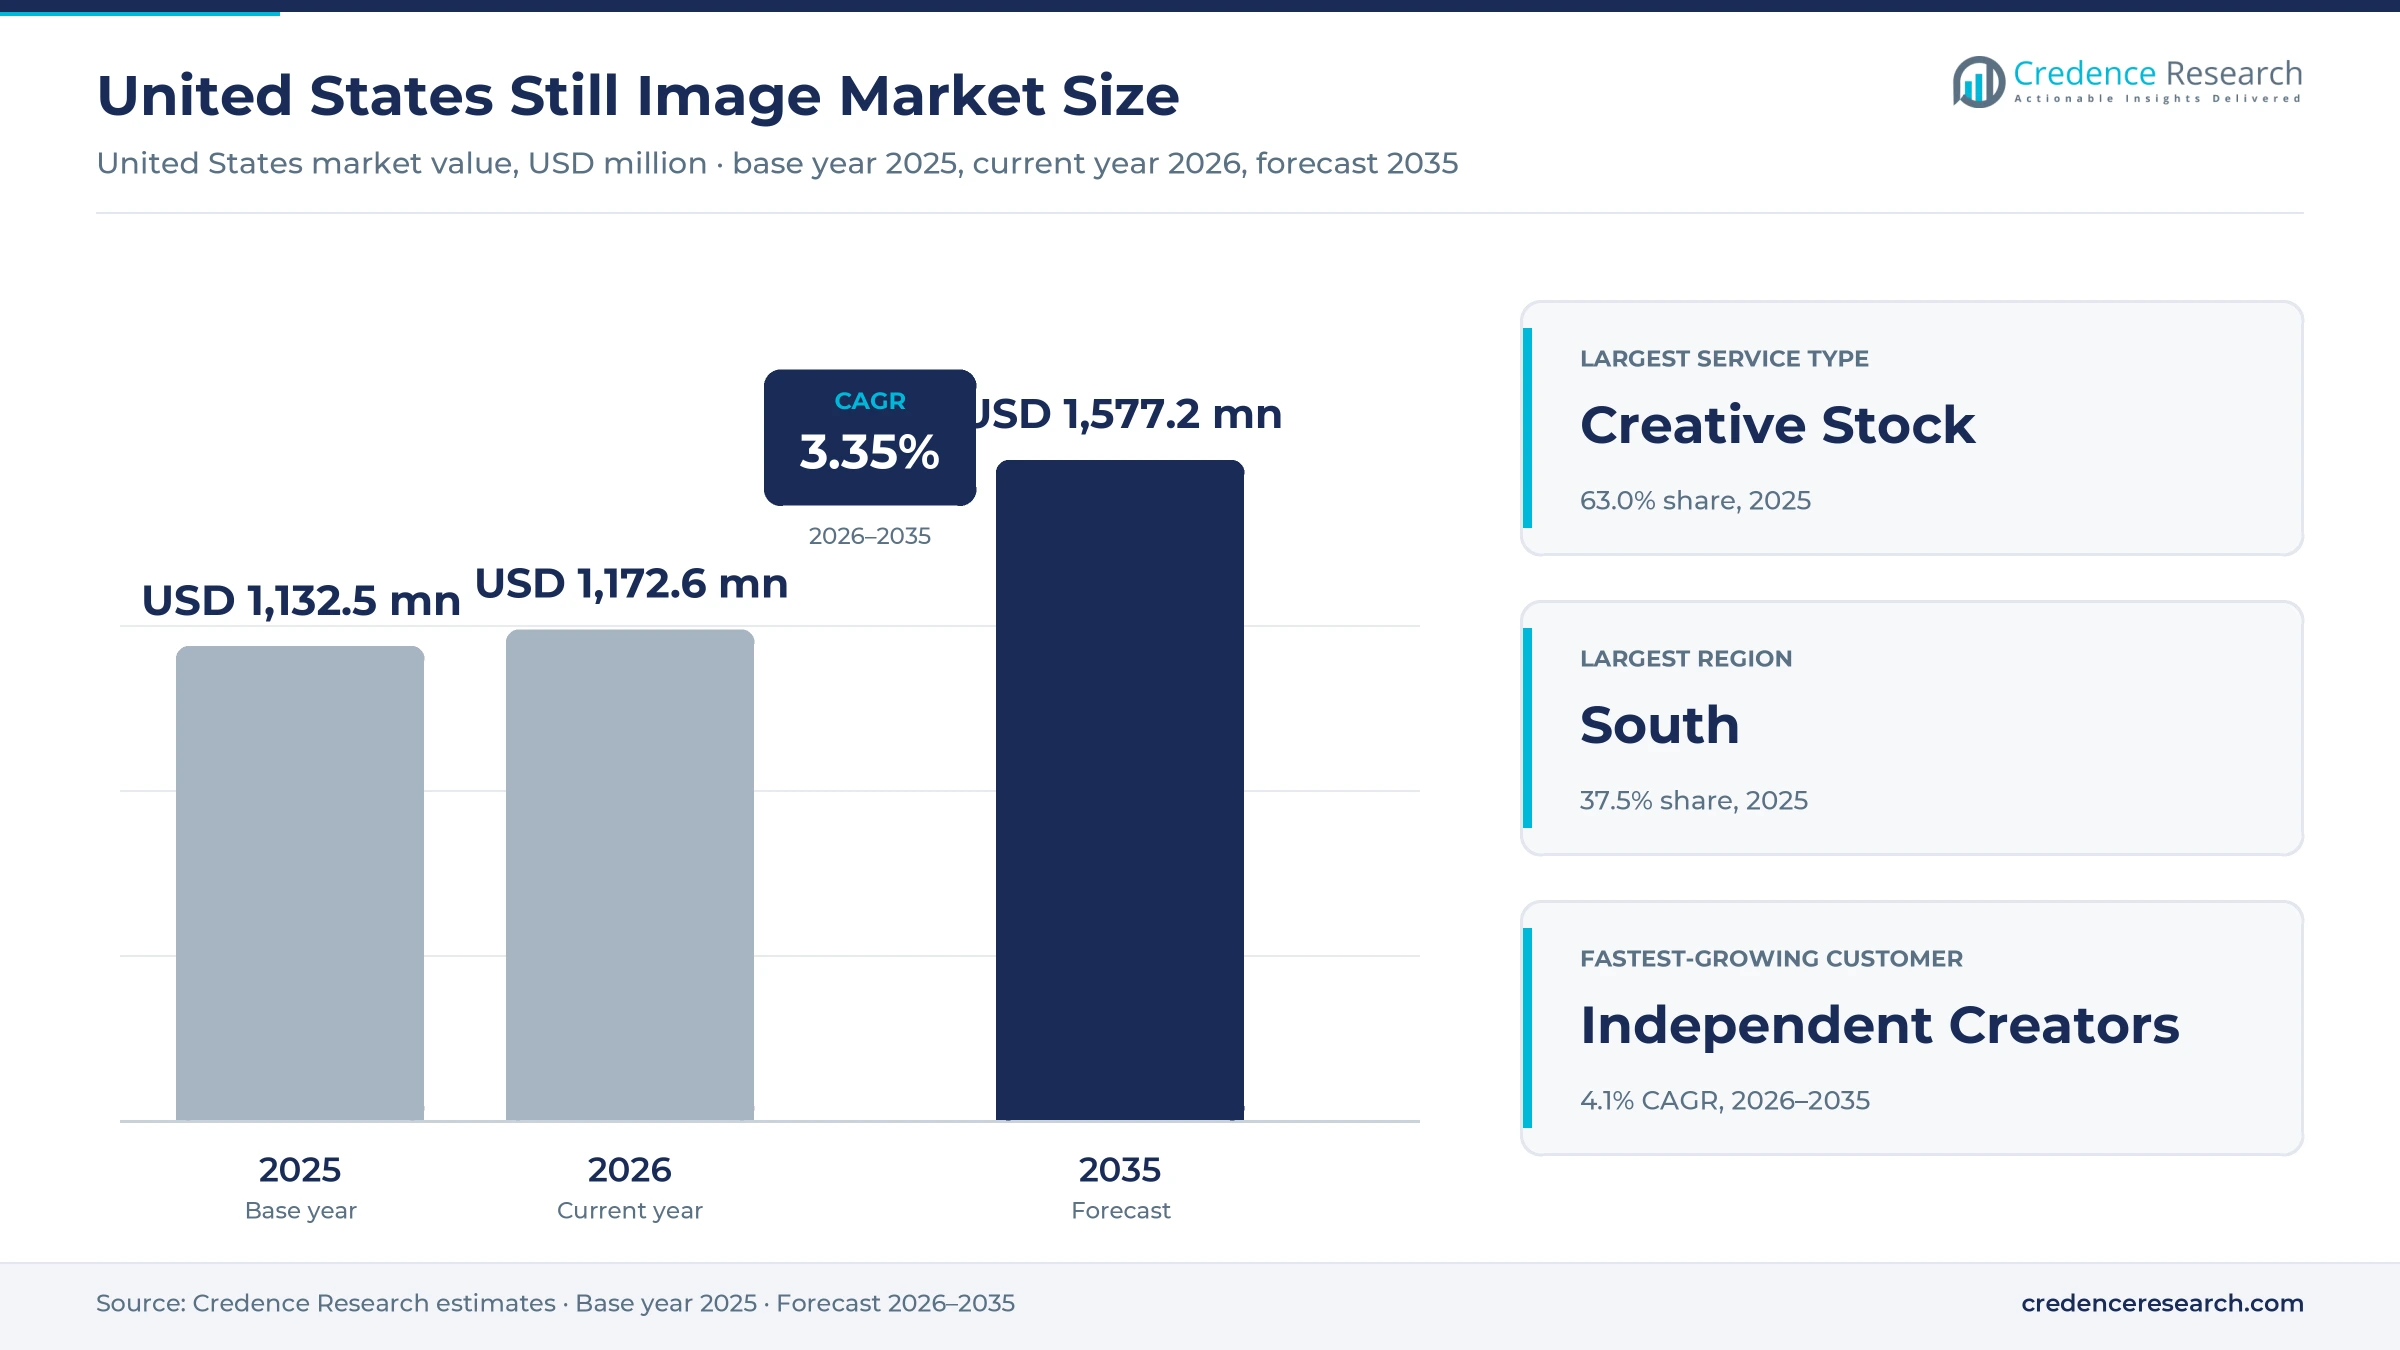
United States Still Image Market Insights
- The United States still image market grows from USD 1.13 billion in 2025 to USD 1.58 billion by 2035, a 3.35% CAGR, as editorial and creator demand offset pressure on basic stock.
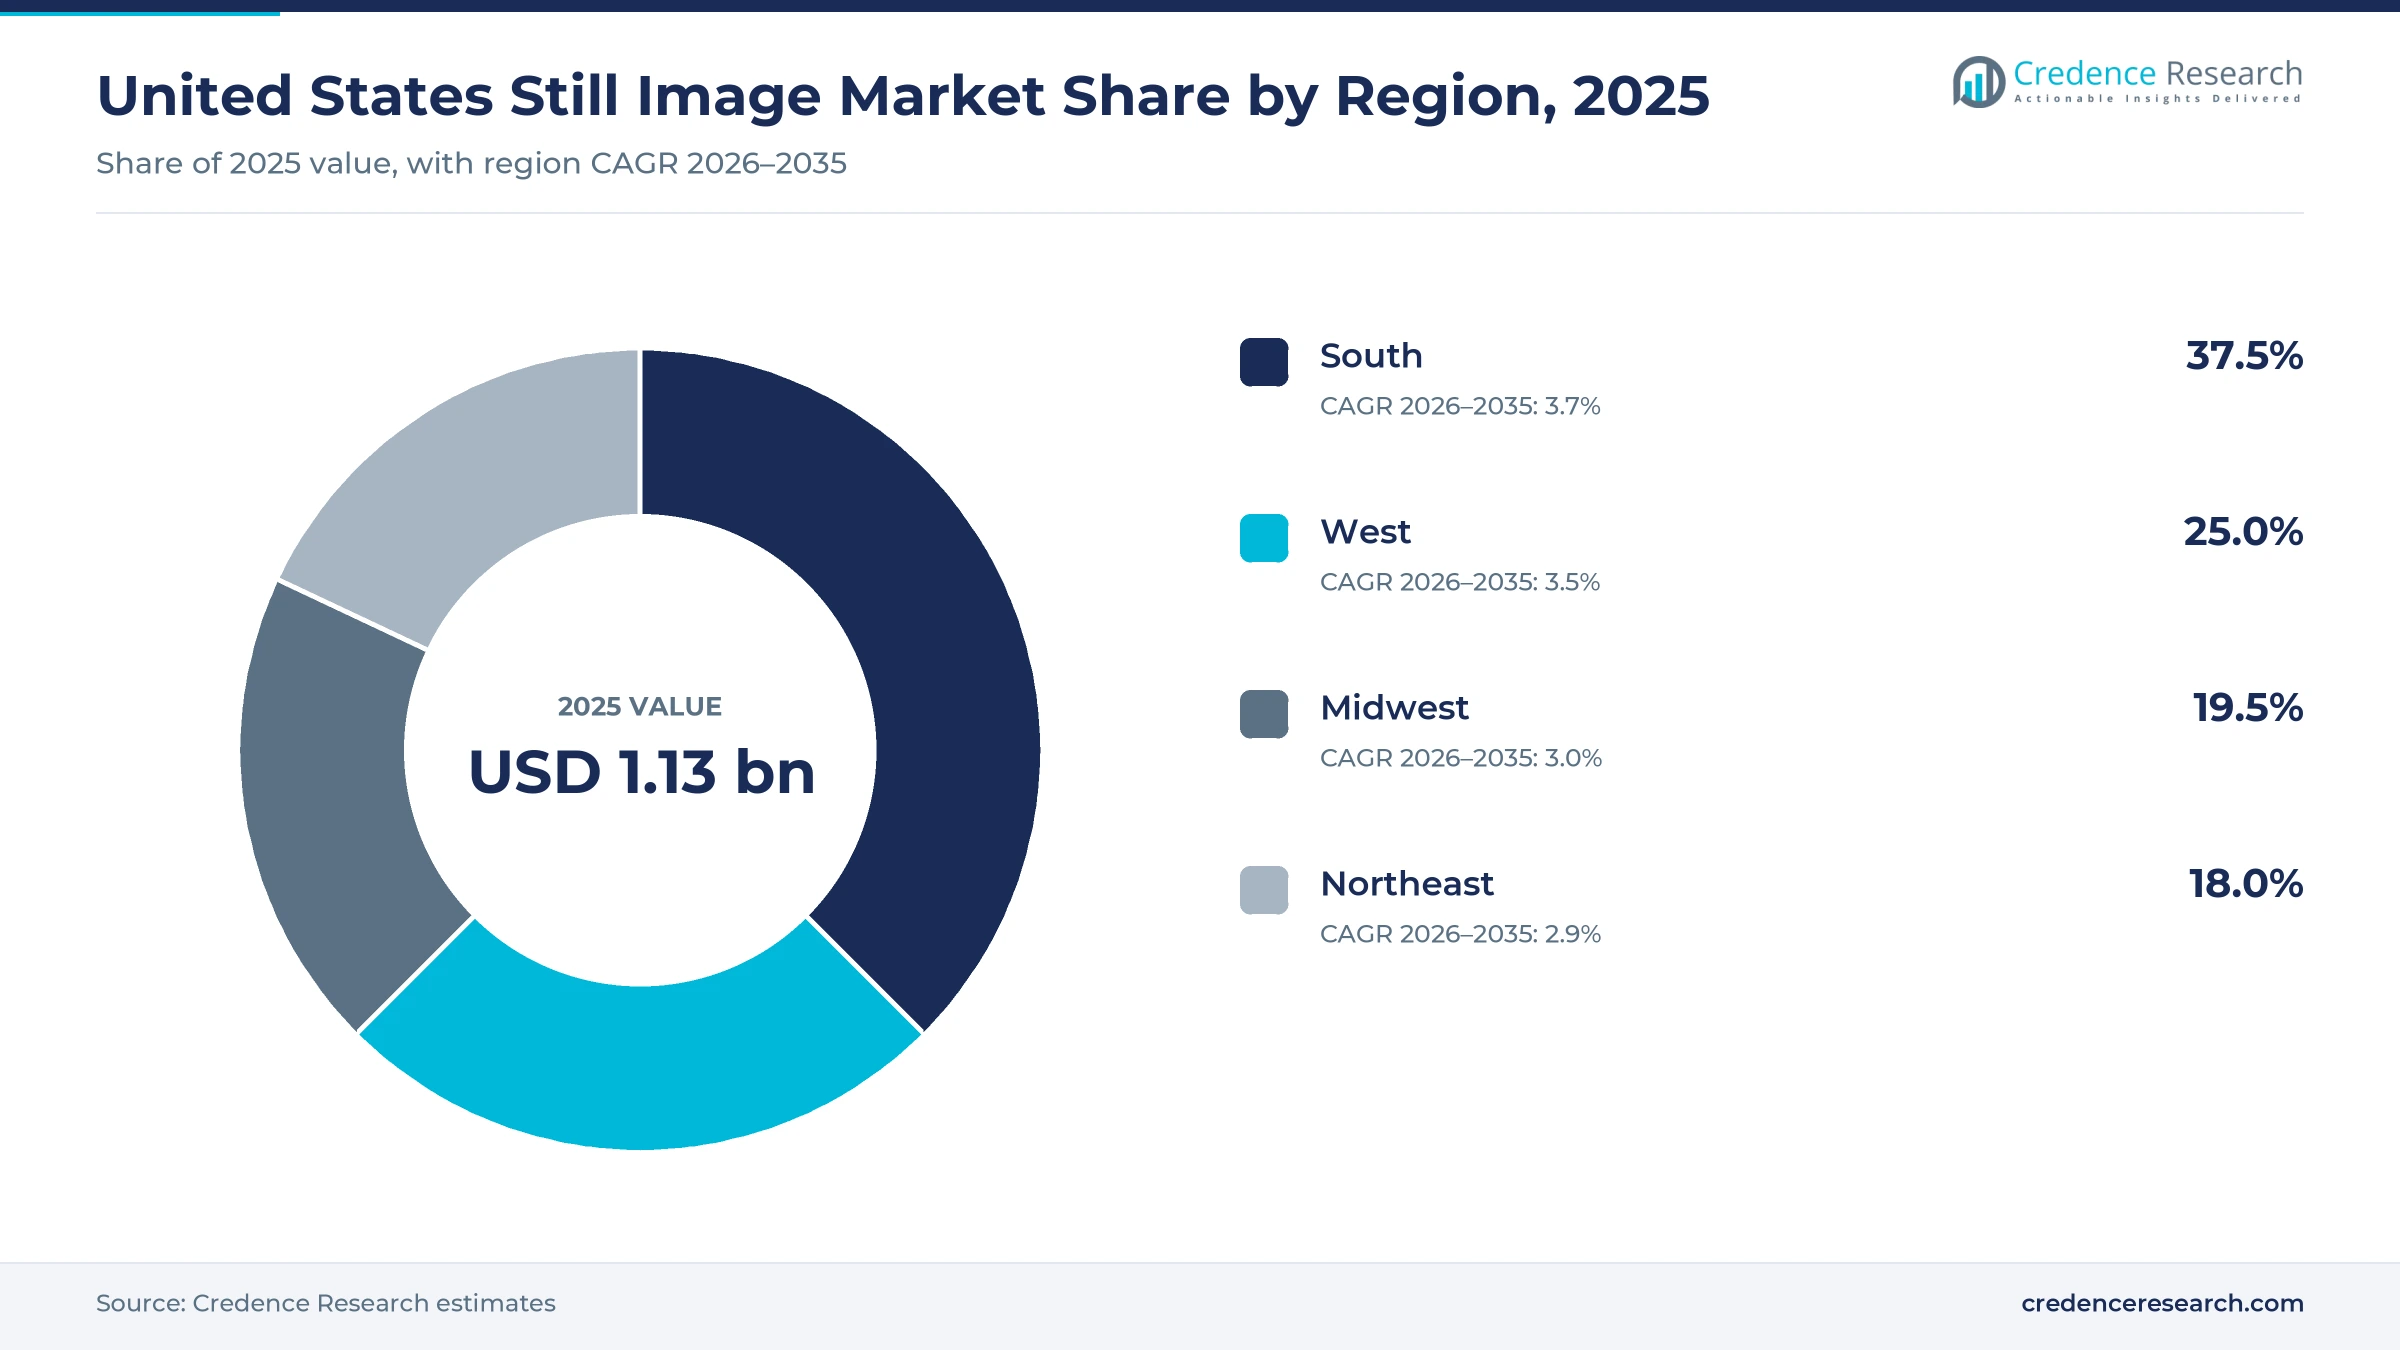
- The South held 37.5% of 2025 value, because it has about 39% of the U.S. population and the fastest population growth of the four regions.
- Creative stock licensing held 63.0% of 2025 value, because brand and agency teams license pictures for every digital campaign they run.
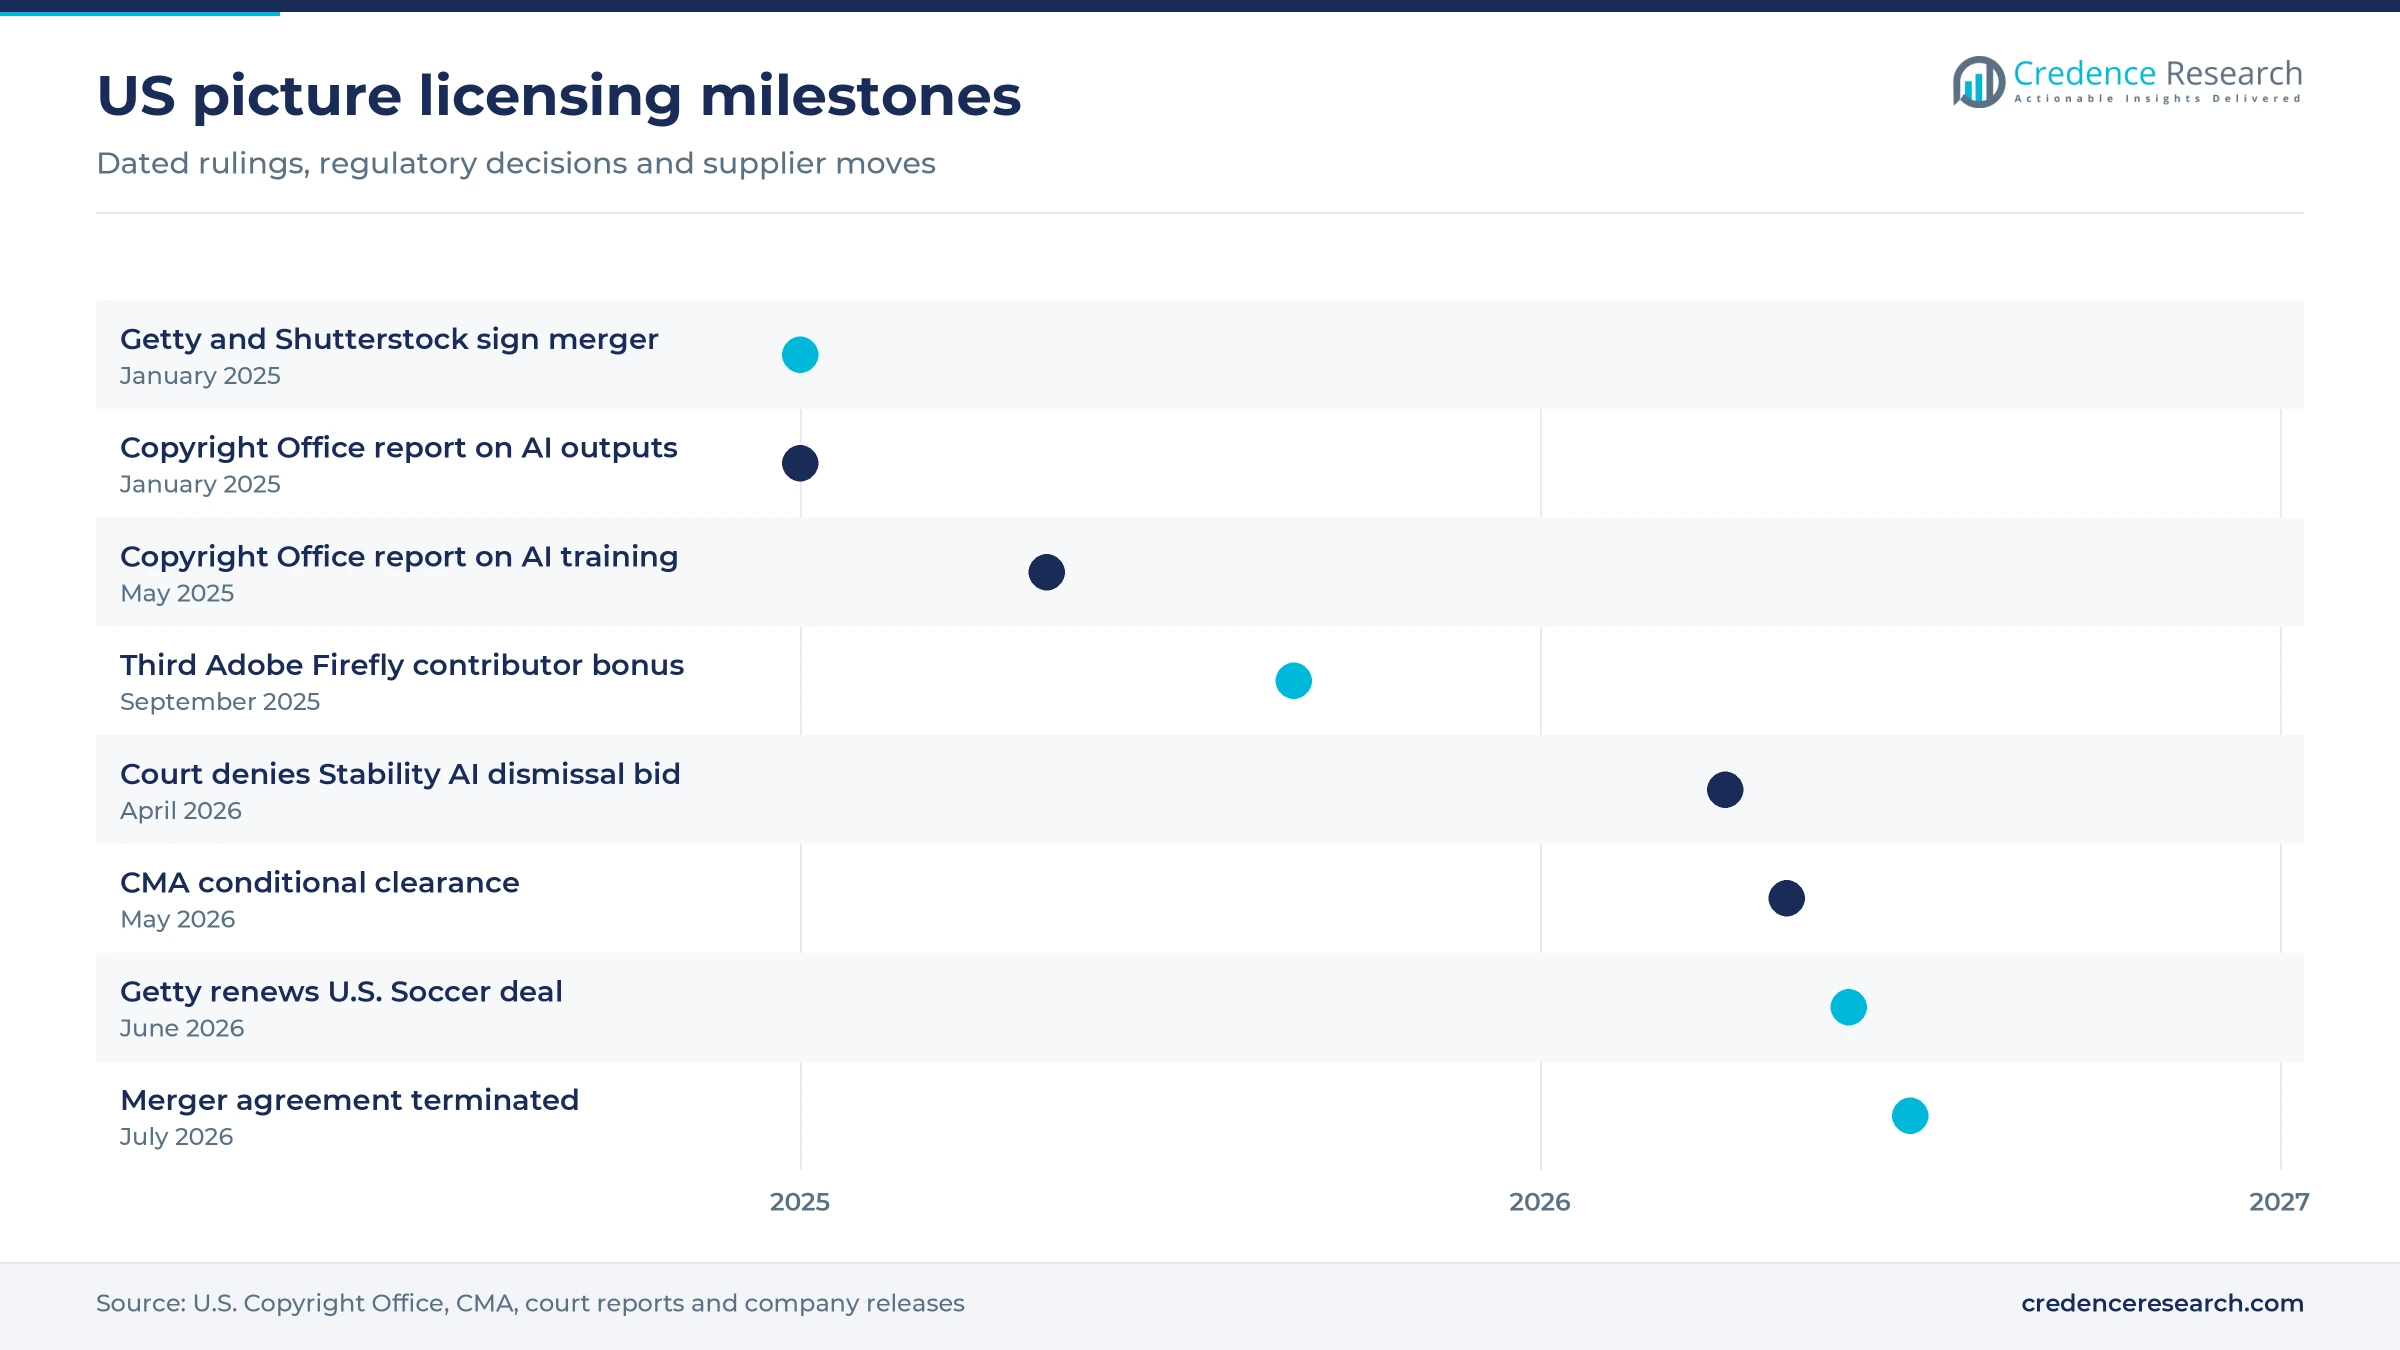
- Getty Images terminated its planned merger with Shutterstock on July 7, 2026, after the U.K. regulator required a sale of the Shutterstock editorial business.
- U.S. digital ad revenue reached USD 294.6 billion in 2025, up 13.9%, according to IAB and PwC, which keeps the main buyer group spending.
Creative stock and in-house brand teams carry most value
Why creative stock leads and editorial grows fastest
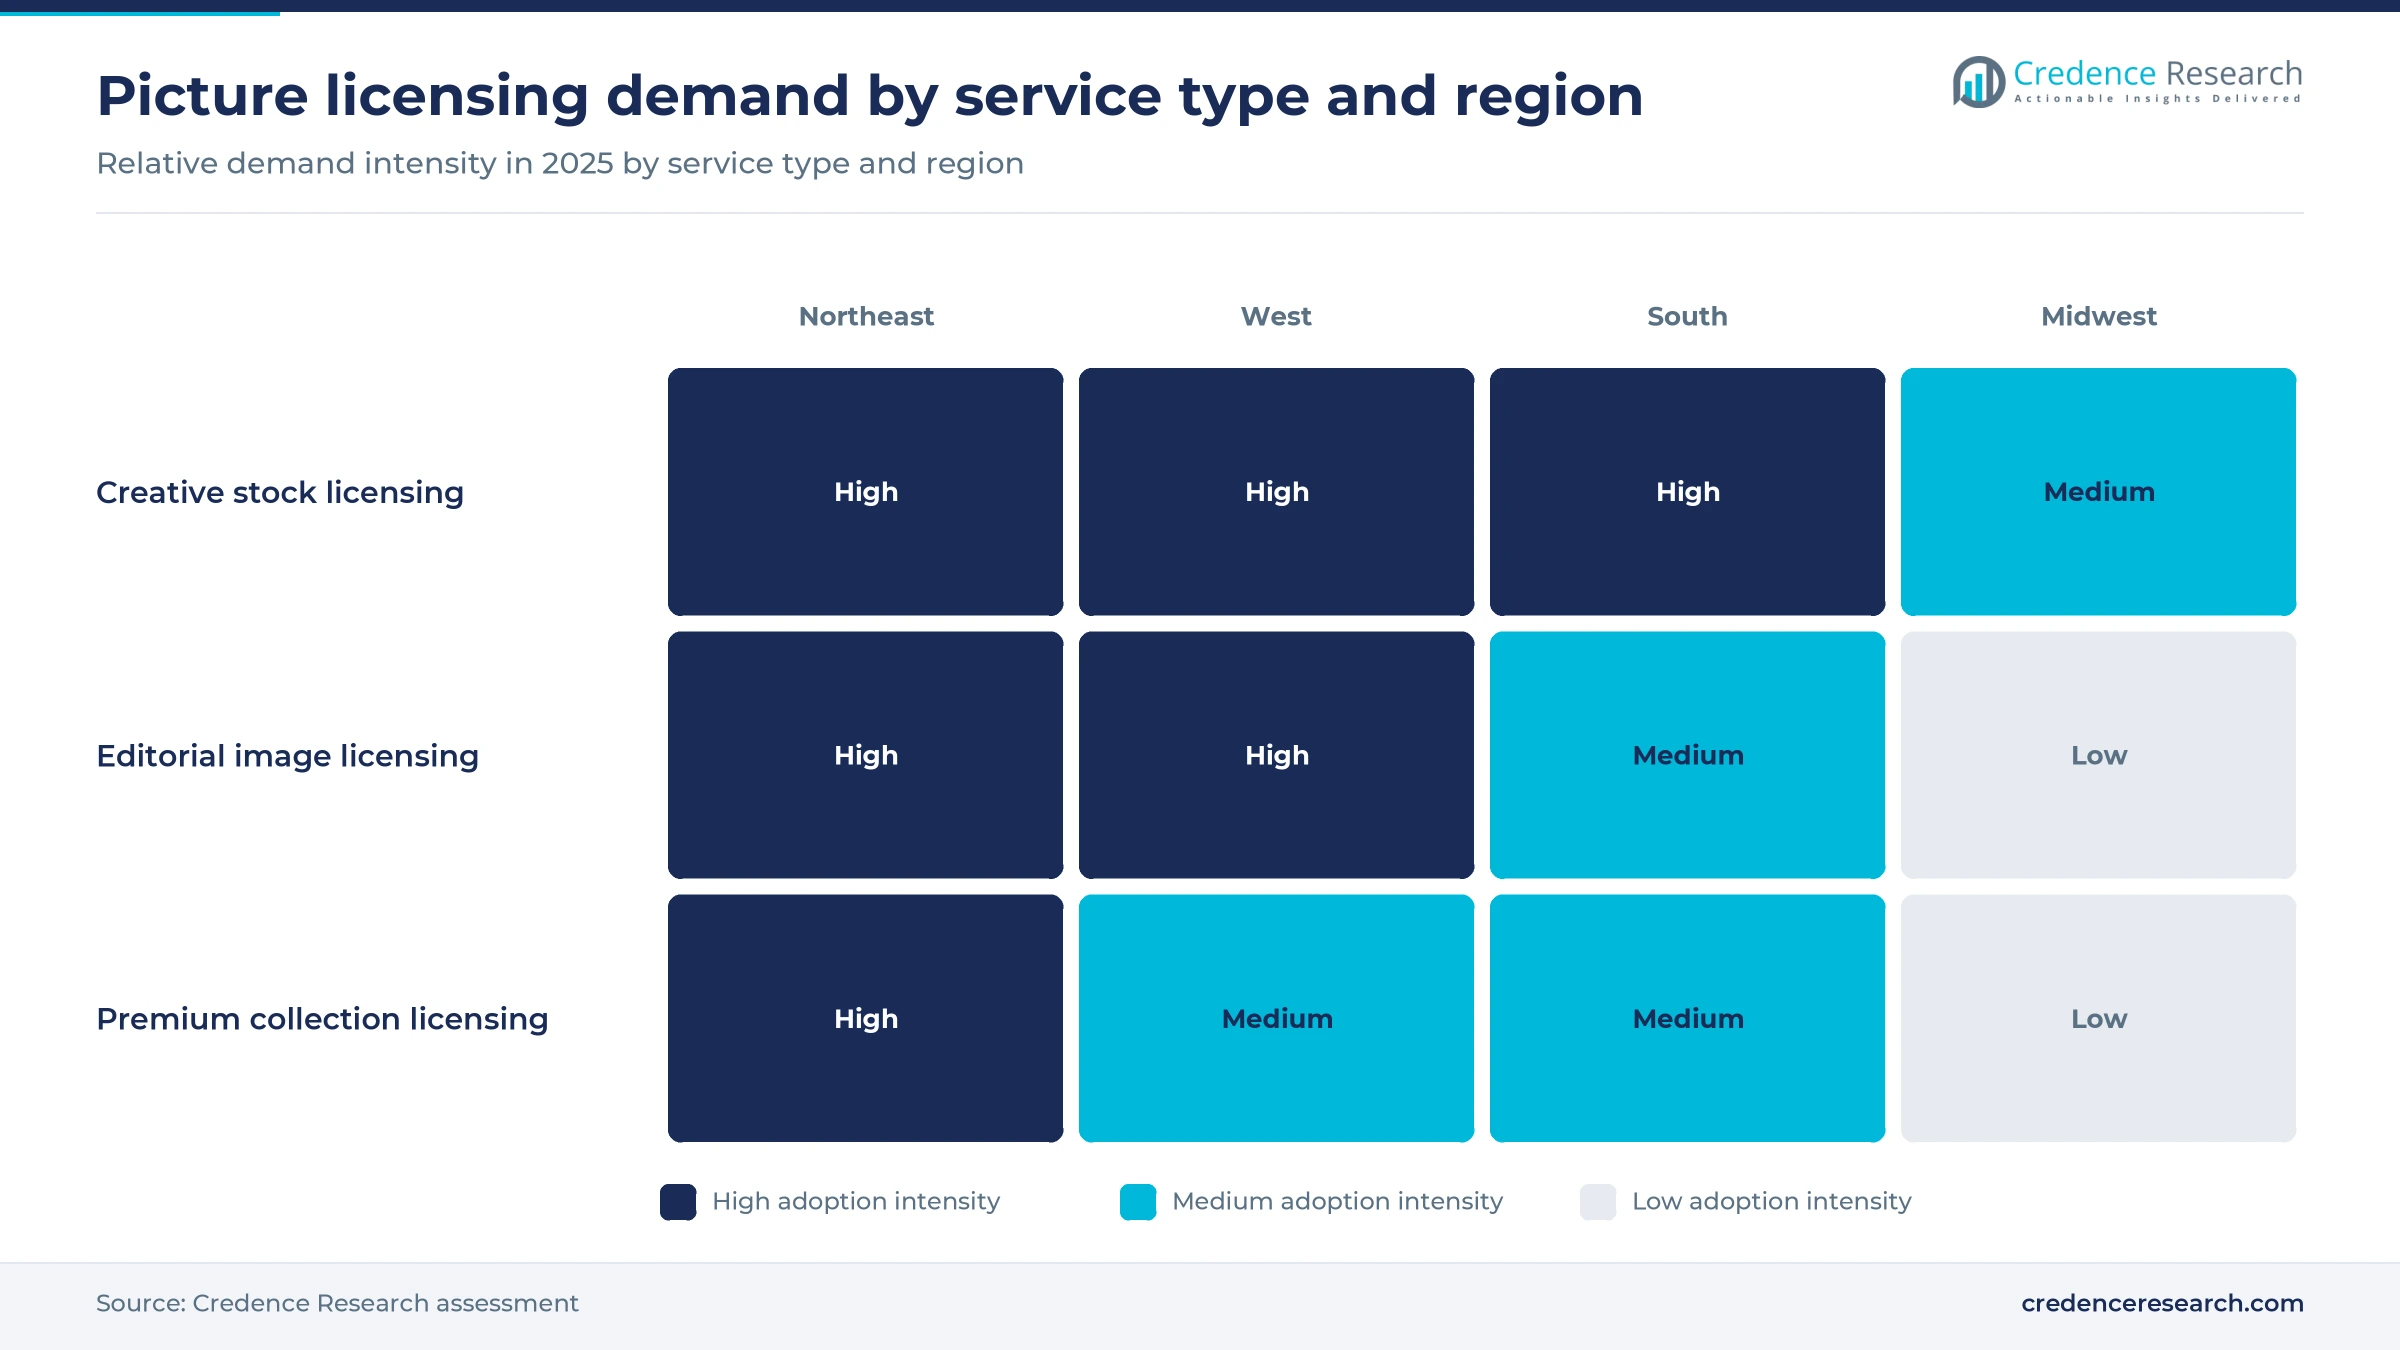
Based on service type, the market is categorized into creative stock licensing, editorial image licensing and premium collection licensing. Creative stock licensing led with 63.0% of 2025 value because libraries now hold enough generic pictures to cover almost any brief, and Getty Images reported that its image collection grew 5.7% to 625 million in the year to June 2026. Editorial image licensing grows fastest at 4.0% a year as newspapers employ fewer photographers of their own, and Pew Research Center found newspaper newsroom employment fell from 71,070 in 2008 to 30,820 in 2020. Editorial suppliers therefore hold pricing power that creative stock is losing.
In-house teams lead while independent creators grow fastest
Based on customer type, the market is categorized into advertising agencies, in-house creative teams and independent creators. In-house creative teams led with 41.0% of 2025 value because brands keep more creative work under their own roof, and 82% of members of the Association of National Advertisers had an in-house agency in 2023, up from 42% in 2008. Independent creators grow fastest at 4.1% a year as creator advertising reached USD 37 billion in 2025 and is projected to reach USD 44 billion in 2026, according to IAB. Creators buy small plans often, so suppliers court them with low-cost monthly subscriptions.
Advertising leads as digital commerce grows fastest
Based on end-use industry, the market is categorized into advertising and brand marketing, publishing and news media, and digital commerce. Advertising and brand marketing led with 46.0% of 2025 value because display advertising alone brought in USD 81.6 billion in 2025, 27.7% of U.S. digital ad revenue, according to IAB and PwC, and every display unit needs a picture. Digital commerce grows fastest at 4.2% a year as commerce media revenue reached USD 63.4 billion in 2025, up 18.0%, so retailers and brands need far more lifestyle pictures for product pages and retail ads.
Royalty-free leads while exclusive licensing grows fastest
Based on business model, the market is categorized into royalty-free licensing, rights-managed licensing and exclusive licensing. Royalty-free licensing led with 74.0% of 2025 value because subscription plans sell royalty-free downloads at a few dollars each, and iStock charges 18 extra credits for an extended license rather than a new negotiated fee. Exclusive licensing grows fastest at 4.5% a year as rights holders restrict where their pictures appear, and U.S. Soccer imagery covered by its June 2026 renewal with Getty Images is available only on gettyimages.com. Exclusive content lets suppliers defend their prices against freely generated pictures.
| Segment Group | Leading Sub-segment | Share, 2025 | Fastest-growing Sub-segment | CAGR, 2026–2035 |
|---|---|---|---|---|
| By Service Type | Creative stock licensing | 63.0% | Editorial image licensing | 4.0% |
| By Customer Type | In-house creative teams | 41.0% | Independent creators | 4.1% |
| By End-Use Industry | Advertising and brand marketing | 46.0% | Digital commerce | 4.2% |
| By Business Model | Royalty-free licensing | 74.0% | Exclusive licensing | 4.5% |
Subscriptions push per-download prices toward a few dollars
Most U.S. buyers pay a flat monthly or annual fee for a set number of downloads, so the price per picture depends more on commitment than on content. Annual plans cost about 27% to 40% less per month than month-to-month plans, and credit packs charge the most per picture. Suppliers push buyers toward annual terms, and annual subscriptions made up 58.8% of Getty Images revenue in the second quarter of 2026, up from 53.5% a year earlier. Extended licenses, indemnity and Signature or premium collections are where suppliers still lift the average price.
| Plan or license | Typical price or fee | Basis |
|---|---|---|
| iStock Basic annual plan, 10 Essentials downloads a month | USD 2.90 per download | iStock plans and pricing page, November 2026 |
| iStock Premium annual plan, 10 downloads a month | USD 7.00 per download | iStock plans and pricing page, November 2026 |
| iStock single Essentials image from a one-credit pack | USD 12 per image | iStock list price checked July 2026 |
| Shutterstock annual plan, 10 images a month | USD 25 a month, USD 300 a year | Shutterstock list price checked July 2026 |
| Shutterstock on-demand pack, two images | USD 29 per pack | Shutterstock list price checked July 2026 |
| Adobe Stock, 10 assets a month | USD 29.99 a month annual, USD 49.99 month to month | Adobe Stock list price checked July 2026 |
Request a Free Sample
Fill in your details and we'll send you a free sample report.
- Sample data tables & charts
- Research methodology
Ad budgets, online retail and live news keep buyers paying
Digital ad budgets need a steady flow of pictures
Every digital campaign needs pictures, and U.S. digital ad budgets are still growing at double-digit rates. U.S. digital ad revenue reached USD 294.6 billion in 2025, up 13.9%, according to IAB and PwC in April 2026. Social media advertising rose 32.6% to USD 117.7 billion, the largest format at 40.0% of the total, and social formats burn through fresh pictures faster than any other channel. Advertising and brand marketing held 46.0% of 2025 value, so the pace of ad growth sets the pace for the whole market. In-house brand teams and agencies that license pictures directly inside creative software turn this spending into recurring annual subscriptions rather than one-off purchases.
Online retail multiplies picture-heavy product pages
Online retail creates a large and growing volume of product pages, banners and marketplace listings that need pictures. E-commerce sales reached USD 340.2 billion in the second quarter of 2026, or 17.1% of total U.S. retail sales, according to the Census Bureau estimate released on Aug. 18, 2026. Small sellers often lack studio budgets, and iStock said in December 2025 that 83% of respondents believe higher-quality images are more likely to stand out. Online sellers therefore license lifestyle and product-context pictures in bulk instead of paying for shoots. Suppliers that offer search tools tuned to product and lifestyle scenes, and API access for marketplaces, win this repeat volume from retailers of every size.
Live news and sport keep editorial pictures in demand
News, sport and entertainment pictures must come from a photographer at the event, which protects editorial licensing from AI substitution. Getty Images says it covers more than 160,000 news, sport and entertainment events each year, which gives it an editorial archive that smaller libraries cannot match on deadline. Getty also lists more than 115 staff photographers and videographers in its 2025 annual report, a scale that few newsrooms can match with their own staff after the newsroom cuts noted above. Publishers increasingly buy agency feeds and per-picture licenses instead of staffing every event, which shifts editorial spending from payroll to licensing and supports the strongest growth among service types.
Copyright guidance favors licensed human-made pictures
Federal copyright guidance makes licensed pictures safer for brands than raw AI output. The U.S. Copyright Office said on Jan. 29, 2025 that prompts alone do not make an AI output copyrightable, so a brand cannot own a purely generated picture. Its pre-publication report of May 9, 2025 on AI training added that fair use will not always excuse developers from licensing, and introduced market dilution as a possible harm to creators. Getty Images sells AI generation tools trained only on its own permissioned content with indemnification. On April 23, 2026, a federal court in Northern California also let Getty pursue claims that Stability AI copied more than 12 million of its photographs. These positions keep corporate legal teams buying licensed pictures for campaigns that carry brand risk.
Authenticity labels and licensed AI tools reshape supply
Authenticity labels rise as buyers distrust AI pictures
Buyers are shifting toward pictures they can prove are real, because consumers increasingly doubt what they see. A Getty Images VisualGPS study of April 2024, covering more than 30,000 adults in 25 countries including the United States, found that almost 90% want to know if an image was made with AI. The same study found 98% agree authentic images and videos are pivotal to trust. In December 2025, iStock reported that 60% of people distrust the ads they see, largely because they think the content is AI-generated or manipulated, while 64% prefer real images in advertising. Suppliers with verified contributors and provenance data gain from this shift.
Licensed AI generators emerge inside stock libraries
Stock suppliers now sell AI generation next to their libraries, which keeps buyers on their platforms. Getty Images launched Generative AI by Getty Images in fall 2023 and Generative AI by iStock in early 2024, both trained on Getty creative content and described as commercially safe. Adobe paid a third Firefly bonus to Adobe Stock contributors in September 2025 for content used to train its models. Depositphotos added an AI Assistant in May 2026 that generates pictures with Bria and Nano Banana models. These tools let libraries compete with general generative AI models while paying the photographers whose work trained them.
Sports and archive rights open a premium editorial niche
Exclusive sports and archive rights give suppliers content that rivals and AI tools cannot copy. Getty Images renewed its multi-year deal as U.S. Soccer's Official Photographic Agency on June 11, 2026, with imagery of the national teams available only on gettyimages.com and the federation's historical catalog to be added over time. Getty says it works with more than 125 sports leagues, governing bodies and clubs and covers over 50,000 sporting events a year. Exclusive licensing grows fastest among business models at 4.5% a year, so rights deals of this kind lift the average price per picture and give suppliers content that holds its value for decades.
Licensing inside design platforms offers an opening
Design platforms put licensed pictures in front of millions of users who never visit a stock website, which opens a large channel for suppliers. Getty Images renewed its multi-year Canva partnership in August 2024, keeping Canva users' access to millions of creative assets and supporting Canva's USD 200 million Content Fund. Adobe said in September 2025 that creators can preview and license Adobe Stock content from the Libraries panel in Photoshop, Illustrator, InDesign and Premiere Pro. Suppliers that connect to digital asset management systems used by brand teams can capture enterprise volume the same way, because every licensed file then sits where campaigns are built.
AI substitution and a shrinking buyer base cap growth
AI-generated pictures replace basic stock demand
Generic stock pictures are the easiest content for AI tools to replace, and federal labor forecasts already reflect it. The Bureau of Labor Statistics expects photographer employment to decline 1% from 2025 to 2035, and says stock photos are projected to be partially replaced by AI-generated images. Photographers held about 145,000 jobs in the United States in 2025. Creative stock suppliers lose low-value downloads first, so they shift toward editorial, exclusive and premium collections that AI cannot copy.
Fewer purchasing customers squeeze download volume
The number of paying buyers is falling even as libraries grow, which weakens volume at the low end. Getty Images reported on Aug. 10, 2026 that its purchasing customers over the previous 12 months fell 10.0% to 636,000, while paid download volume fell 2.8% to 90 million. Occasional buyers who once bought single pictures now generate them or use free design platforms. Suppliers respond by locking remaining customers into annual subscriptions, which steadies value but caps new customer growth.
Lower contributor pay threatens fresh supply
Libraries depend on contributors, and pay cuts risk thinning the flow of new pictures. Alamy moved to a tiered contract in 2026 that pays 15% to contributors earning below USD 250 a year, 20% to most others and 40% only above a USD 3,000 threshold, according to PetaPixel on Sept. 1, 2026. Photographers already earn a median USD 44,660 a year, according to the Bureau of Labor Statistics. Lower royalties push part-time contributors away, so suppliers must pay more for the fresh, diverse pictures buyers want.
The failed merger leaves cost pressure unresolved
Consolidation was meant to cut costs across the two largest suppliers, but it did not happen. Getty Images terminated its merger agreement with Shutterstock on July 7, 2026, after the U.K. regulator required a sale of the Shutterstock editorial business. The companies had claimed annual cost synergies of USD 150 million to USD 200 million. Shutterstock's chief executive stepped down in July 2026, with the finance chief appointed interim leader. Both companies must now cut costs alone while download volume falls.
The South leads on population size and growth
| Region | Value, 2025 (USD billion) | Share, 2025 | CAGR, 2026–2035 |
|---|---|---|---|
| South | 0.42 | 37.5% | 3.6% |
| West | 0.28 | 25.0% | 3.5% |
| Midwest | 0.22 | 19.5% | 3.0% |
| Northeast | 0.20 | 18.0% | 2.9% |
The South leads on the largest, fastest-growing population
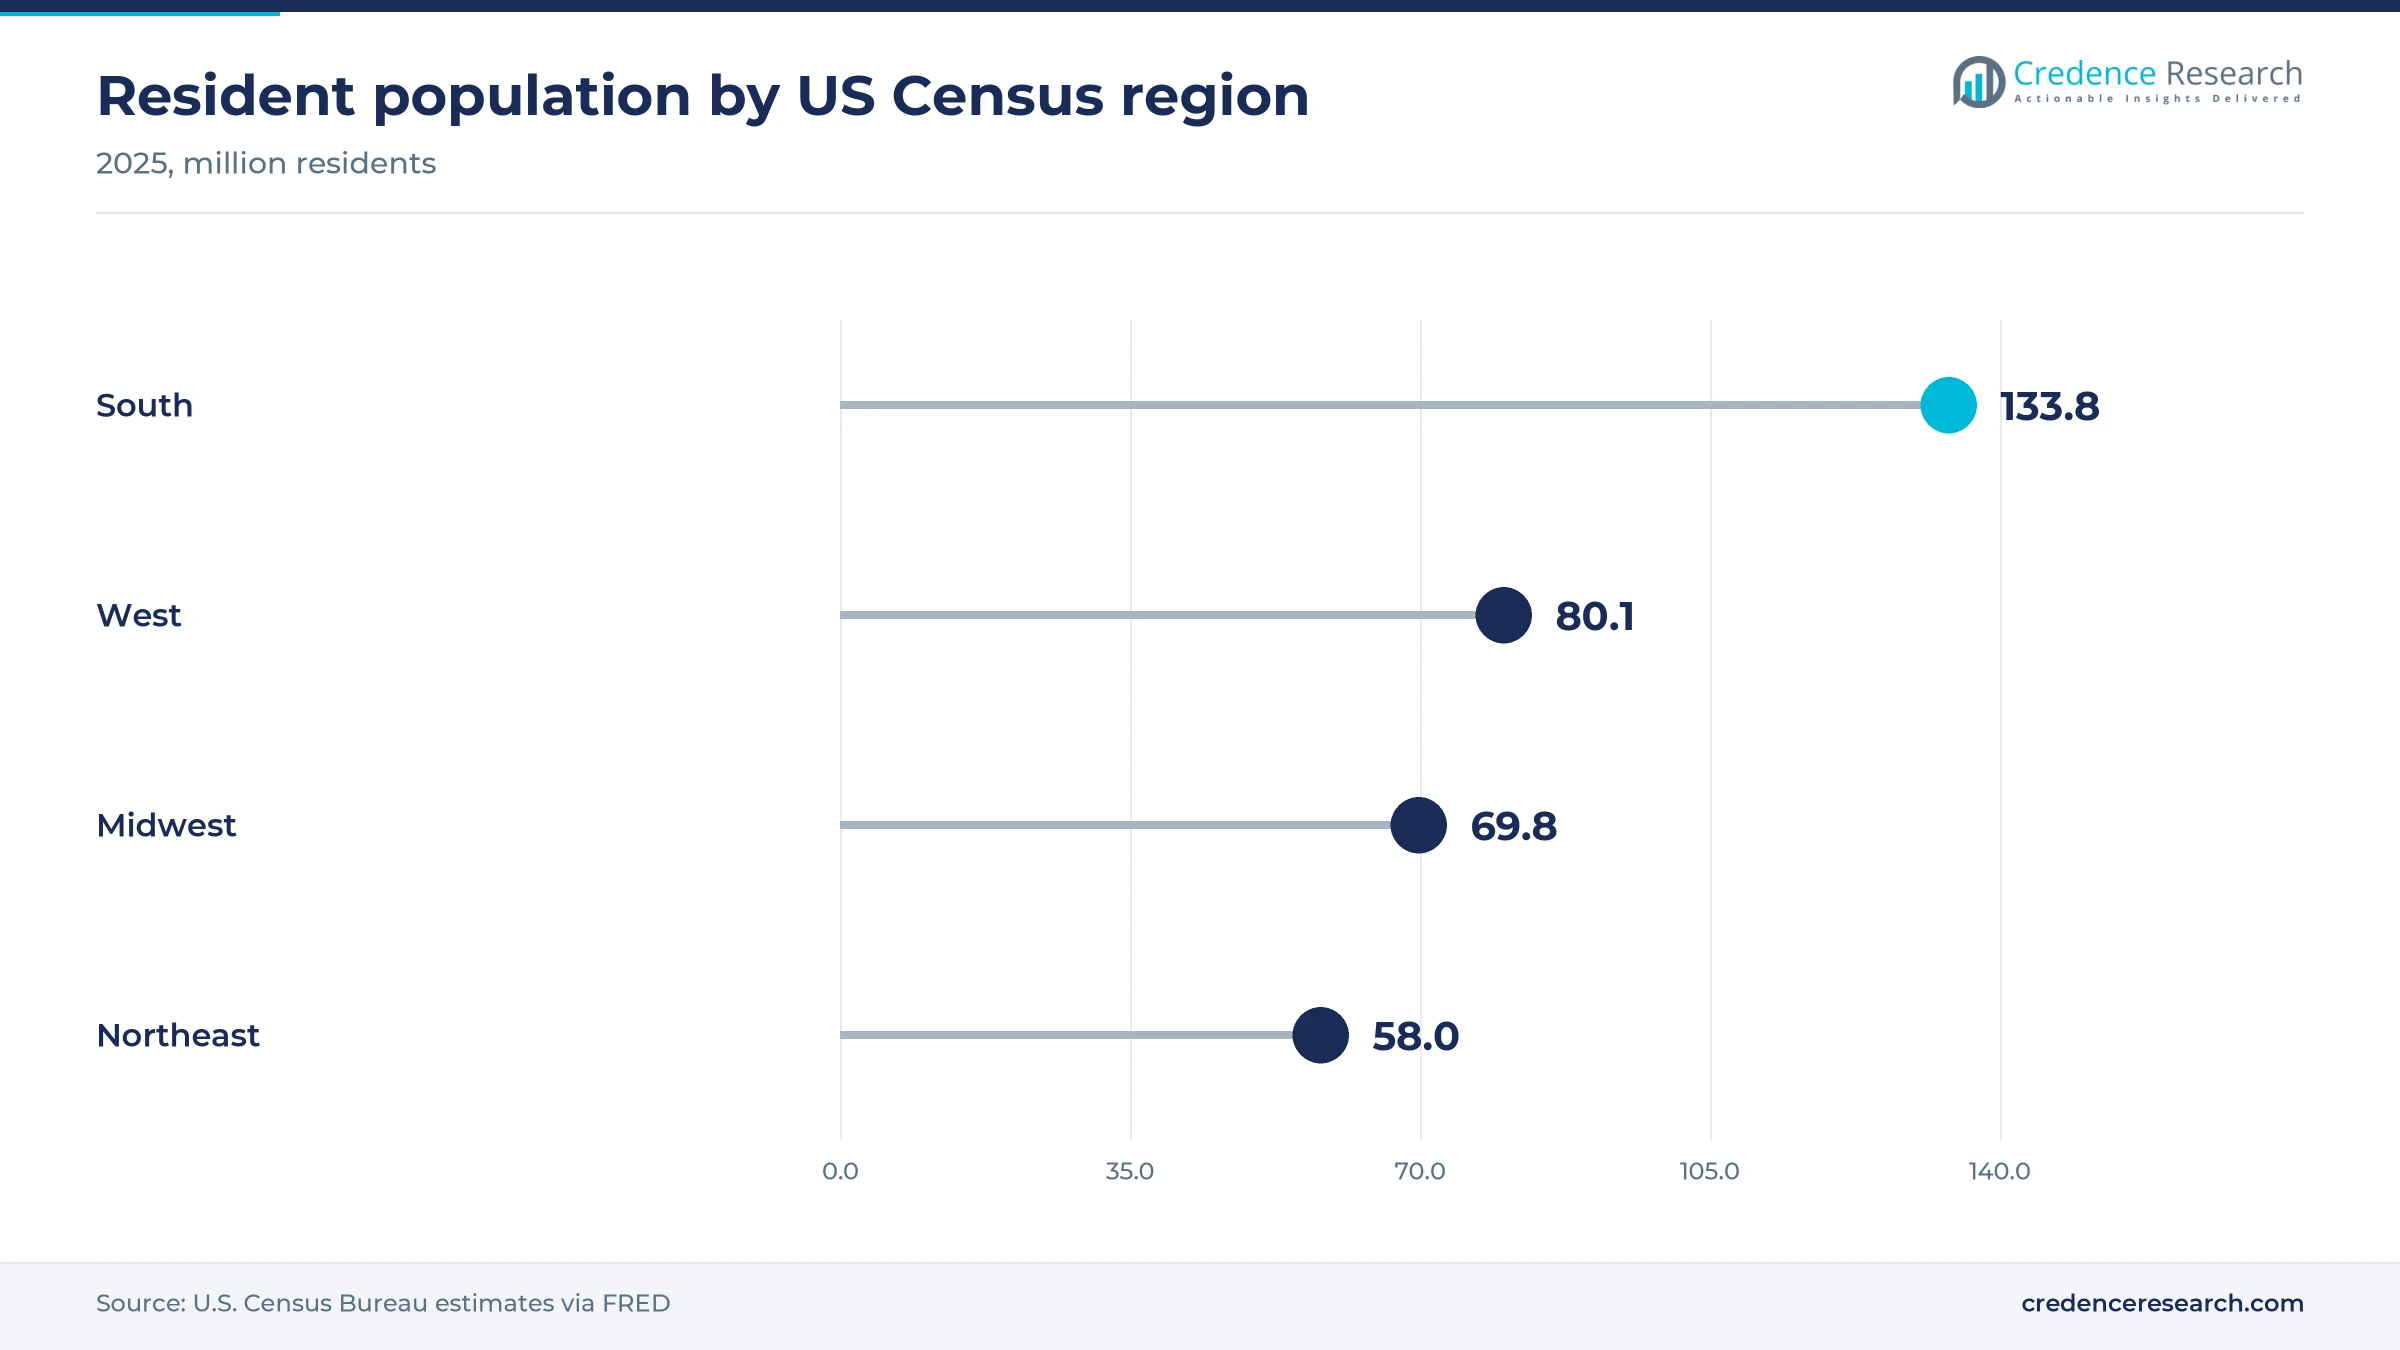
The South held a 37.5% share of 2025 value and grows fastest at 3.6% a year. It had about 133.8 million residents in 2025, according to Census Bureau estimates published by the St. Louis Fed, and added about 0.9% in a year, more than any other region, a gain of about 1.2 million people. Retailers, regional agencies and fast-growing small businesses in Texas, Florida and Georgia add steady creative stock volume.
The West rests on tech platforms and entertainment
The West held a 25.0% share of 2025 value and grows at 3.5% a year. Getty Images is based in Seattle, and the region had about 80.1 million residents in 2025, according to Census Bureau estimates, up about 0.3% in a year. Los Angeles film and television studios drive entertainment and celebrity picture demand. Technology firms in California and Washington buy large API and enterprise licenses for apps, websites and marketing.
The Midwest grows on retail and consumer brands
The Midwest held a 19.5% share of 2025 value and grows at 3.0% a year. The region had about 69.8 million residents in 2025, according to Census Bureau estimates, and grew only about 0.4% in a year. That is about 20.4% of the national population, close to the region's share of value. Consumer goods, retail and manufacturing brands across the region run in-house creative teams that license pictures for catalogs, packaging mockups and online campaigns.
The Northeast concentrates publishers and agencies
The Northeast held 18.0% of 2025 value and grows at 2.9% a year. The region had about 58.0 million residents in 2025, the smallest of the four, according to Census Bureau estimates, and grew only about 0.2% in a year. New York remains the base of the largest ad agencies, magazine groups and national news organizations, so editorial and premium licenses weigh more here than in any other region.
A failed merger and AI rulings define 2025 and 2026
| Development | Status and market relevance |
|---|---|
| In January 2025, Getty Images and Shutterstock signed an agreement to combine in a merger of equals. | Terminated in July 2026; the two suppliers continue to compete separately |
| In September 2025, Adobe marked ten years of Adobe Stock with a third Firefly bonus for contributors and in-app licensing across its creative tools. | Running; deepens licensing inside Adobe applications |
| In April 2026, a federal court in Northern California denied most of Stability AI's motion to dismiss the Getty Images copyright and trademark suit. | Ongoing; case over more than 12 million photographs proceeds |
| In May 2026, the U.K. Competition and Markets Authority cleared the Getty and Shutterstock merger only if the Shutterstock editorial business was sold. | Final report; Getty declined the remedy |
| In July 2026, Getty Images terminated the merger agreement and Shutterstock named its finance chief interim chief executive. | Completed; consolidation of the two largest suppliers stops |
Search, rights data and licensed generators drive delivery
- Search APIs let publishers, retailers and design platforms pull licensed pictures straight into their own systems and pay per use.
- Conversational search replaces keyword lists with follow-up questions, as in the Depositphotos AI Assistant added in May 2026.
- Licensed generators create new pictures from models trained only on permissioned library content and carry supplier indemnity.
- Rights and provenance metadata records the model release, license terms and origin of each file, which brand legal teams now check.
Need a Custom Version of This Report?
Tailor the scope, geography, or segments to your exact requirements.
- Custom geography or segment scope
- Direct access to our analyst team
Getty and Shutterstock stay apart as Adobe gains ground
Competition in U.S. picture licensing turns on library depth, editorial access, price per download and integration with the tools buyers already use. Getty Images sells creative and editorial content under the Getty Images and iStock brands and leads in news and sport. Shutterstock competes on subscription price and owns the Backgrid and Splash celebrity agencies. Adobe Stock sells inside Creative Cloud applications, which gives it a built-in audience of designers. Alamy competes as an open marketplace with broad contributor supply, and Depositphotos competes on low plan prices and AI search. Lower-cost libraries and design platforms compete for the same small buyers, a pattern that also holds in global stock photography. Suppliers that pair exclusive content with indemnified AI tools keep enterprise accounts.
How the U.S. supply side is organized
Supply is concentrated in a few large libraries with a long tail of microstock agencies and specialist archives. Getty Images works with more than 600,000 content creators and over 360 content partners, according to its August 2026 results release. The U.K. regulator found in May 2026 that Shutterstock is one of the few meaningful alternatives to Getty in editorial content, while it saw no concerns in stock content. Event access and rights deals are the main barriers in editorial, where margins are highest, while creative stock margins depend on subscription scale.
Companies profiled and their roles in this market
| Company | Type | Role in the market |
|---|---|---|
| Getty Images | Creative and editorial library | Seattle-based owner of Getty Images and iStock; covers more than 160,000 events a year |
| Shutterstock | Creative and editorial library | New York-based subscription library; owns Shutterstock Editorial, Backgrid and Splash |
| Adobe (Adobe Stock) | Integrated creative platform | Sells stock content inside Photoshop, Illustrator, InDesign and Premiere Pro |
| Alamy | Open contributor marketplace | Moved contributors to a tiered 15%, 20% and 40% commission contract in 2026 |
| Depositphotos | Low-cost stock library | Added an AI Assistant with conversational search and generation in May 2026 |
Editorial access and rights cover decide future margins
Credence Research's view is that event access and rights cover, not library size, now decide who earns money in U.S. picture licensing. Generic stock is becoming cheap to replace, as the fall in purchasing customers noted above shows, while news, sport and exclusive content keep their value. Editorial and exclusive licensing are the two fastest-growing parts of the market, so suppliers with event credentials and long-term rights deals hold the strongest position. Independent creators are the clearest volume opening, but they buy on price.
Supplier filings and ad and retail data anchor the model
The report uses 2025 as the base year and forecasts value to 2035 in USD million from the Credence Research market model. Segment and regional splits are Credence Research estimates built from Getty Images and Shutterstock SEC filings and releases, IAB and PwC advertising data, Census Bureau e-commerce and population estimates, Bureau of Labor Statistics data, U.S. Copyright Office reports, U.K. Competition and Markets Authority releases and supplier list prices. No interviews or surveys were used for this edition of the report.
Editorial and creator demand carry growth to 2035
The United States still image market reaches USD 1.58 billion by 2035, growing at 3.35% a year from USD 1.17 billion in 2026. Creative stock keeps the largest share, but editorial and exclusive content grow faster as buyers pay for pictures AI cannot make. The South stays the largest region and grows fastest on population gains. Independent creators and digital commerce add the most new buyers. The speed of AI substitution and the outcome of copyright cases over AI training are the two factors most likely to move the forecast in either direction.
AI substitution and editorial demand set the range to 2035
The range of outcomes depends mainly on how fast AI generation replaces basic stock downloads and how much editorial and exclusive content can grow. Faster loss of occasional buyers and further cuts to contributor pay would produce the downside. Stronger demand for verified pictures, more exclusive sports and archive deals and wider licensing inside design platforms would produce the upside.
| Scenario | CAGR, 2026–2035 | Value, 2035 | What has to hold |
|---|---|---|---|
| Downside | 1.8% | USD 1.37 billion | AI tools replace most generic stock downloads and buyer numbers keep falling |
| Base | 3.35% | USD 1.58 billion | Editorial and creator demand offset slow erosion in creative stock volume |
| Upside | 4.5% | USD 1.75 billion | Provenance rules, exclusive rights deals and platform licensing lift the price per picture |
Frequently Asked Questions
How big is the United States still image market?
Which service type leads U.S. picture licensing?
Which companies supply stock and editorial pictures in the United States?
How much does a stock picture cost in the United States?
Why did the Getty Images and Shutterstock merger fail?
Is AI replacing stock photos in the United States?
Can brands own AI-generated pictures under U.S. copyright law?
Which region leads picture licensing demand in the United States?
Table of Content
Chapter 1 Market Segmentation
- 1.1 Segmentation Framework
- 1.1.1 Product and Service Classification
- 1.1.2 Application and End-Use Classification
- 1.1.3 Technology and Solution Classification
- 1.1.4 Customer and Distribution Channel Classification
- 1.1.5 Geographic Segmentation
- 1.1.6 Market Segment Definitions and Boundaries
- 1.2 By Service Type
- 1.2.1 Creative stock licensing
- 1.2.2 Editorial image licensing
- 1.2.3 Premium collection licensing
- 1.3 By Customer Type
- 1.3.1 In-house creative teams
- 1.3.2 Advertising agencies
- 1.3.3 Independent creators
- 1.4 By End-Use Industry
- 1.4.1 Advertising and brand marketing
- 1.4.2 Publishing and news media
- 1.4.3 Digital commerce
- 1.5 By Business Model
- 1.5.1 Royalty-free licensing
- 1.5.2 Rights-managed licensing
- 1.5.3 Exclusive licensing
Chapter 2 Introduction
- 2.1 Report Objectives and Scope
- 2.2 Product Definition and Industry Terminology
- 2.3 Market Inclusions and Exclusions
- 2.4 Research Process
- 2.4.1 Primary Research and Expert Interviews
- 2.4.2 Secondary Research and Source Review
- 2.4.3 Top-Down and Bottom-Up Estimation
- 2.4.4 Data Triangulation and Verification
- 2.5 Market Size Measurement Basis
- 2.5.1 2025: USD 1.13 billion → 2035: USD 1.58 billion
- 2.6 Historical and Forecast Reference Periods
- 2.6.1 Historical Period: 2018-2025
- 2.6.2 Base Year: 2025
- 2.6.3 Forecast Period: 2025-2035
- 2.7 Research Assumptions and Limitations
Chapter 3 Executive Summary
- 3.1 Market Snapshot and Key Findings
- 3.2 Base-Year Market Size, 2025
- 3.3 Forecast Market Size, 2035
- 3.4 Revenue and Volume Growth Outlook
- 3.5 Key Demand and Supply Indicators
- 3.6 Leading Market Segments
- 3.7 Fastest-Growing Market Opportunities
- 3.8 Regional Performance Highlights
- 3.9 Technology and Industry Transformation
- 3.10 Competitive Landscape Summary
- 3.11 Analyst View and Strategic Implications
Chapter 4 United States Still Image Market Trends and Developments
- 4.1 Historical Industry Development, 2018-2025
- 4.2 Recent Market Trends and Developments
- 4.3 Demand and Customer Behavior Trends
- 4.4 Technology and Product Innovation
- 4.5 Artificial Intelligence, Automation and Digitalization
- 4.6 Local Manufacturing and Supply Chain Realignment
- 4.7 Industry Partnerships, Mergers and Acquisitions
- 4.8 Sustainability and Circular Economy Developments
- 4.9 Government and Private Sector Investment Trends
- 4.10 Emerging Business Models and Commercialization
- 4.11 Industry Developments and Announcements
Chapter 5 United States Still Image Market Production, Supply and Demand Analysis
- 5.1 Demand Trend and Consumption Analysis, 2018-2025
- 5.2 Demand Forecast, 2025-2035
- 5.3 Production and Output Trend, 2018-2025
- 5.4 Production and Output Forecast, 2025-2035
- 5.5 Installed Capacity and Capacity Utilization
- 5.6 Company-Wise Production Plants and Statistics
- 5.6.1 Installed Production Capacity
- 5.6.2 Actual Production
- 5.6.3 Planned Capacity and Expansion Targets
- 5.7 Supply Chain Structure and Procurement Trends
- 5.8 Supply-Demand Gap and Bottlenecks
- 5.9 Import Dependence and Sourcing Structure
- 5.10 Contract Manufacturing and Outsourcing
- 5.11 Regional Supply and Demand Concentration
Chapter 6 United States Still Image Market Pricing Analysis
- 6.1 Pricing Structure and Measurement
- 6.2 Historical Pricing Trends, 2018-2025
- 6.3 Pricing Outlook, 2025-2035
- 6.4 Average Selling Price and Unit Economics
- 6.5 Pricing by Product and Market Segment
- 6.6 Geographic Pricing Differences
- 6.7 Key Input, Energy, Labor and Logistics Costs
- 6.8 Contract Pricing and Purchasing Models
- 6.9 Pricing Sensitivity and Competitive Positioning
- 6.10 Price, Margin and Profitability Implications
Chapter 7 United States Still Image Market Dynamics
- 7.1 Market Growth Drivers
- 7.1.1 Demand-Side Drivers
- 7.1.2 Technology and Innovation Drivers
- 7.1.3 Infrastructure and Investment Drivers
- 7.1.4 Regulatory and Policy Drivers
- 7.2 Market Restraints
- 7.2.1 Cost and Affordability Constraints
- 7.2.2 Technology and Adoption Barriers
- 7.2.3 Supply Chain and Operational Constraints
- 7.3 Market Challenges
- 7.3.1 Competitive Pressure and Margin Erosion
- 7.3.2 Skills, Infrastructure and Implementation Gaps
- 7.4 Emerging Market Opportunities
- 7.5 Market Dynamics Impact and Time-Horizon Assessment
Chapter 8 United States Still Image Value Chain Analysis
- 8.1 Industry Value Chain Overview
- 8.2 Upstream Suppliers and Critical Inputs
- 8.3 Technology and Component Providers
- 8.4 Manufacturing or Service Delivery
- 8.5 Distribution, Channel Partners and Integrators
- 8.6 Downstream Applications and End Users
- 8.7 Value Addition and Profit Pools
- 8.8 Vertical Integration and Outsourcing
- 8.9 Supplier Concentration and Risk
- 8.10 Supply Chain Localization and Resilience
Chapter 9 United States Still Image Market Regulations and Policies
- 9.1 Relevant Laws, Standards and Compliance Frameworks
- 9.2 Product, Service, Safety and Quality Requirements
- 9.3 Government Policies, Incentives and Subsidies
- 9.4 Imports, Exports and Trade Barriers
- 9.5 Public Procurement and Local Content Requirements
- 9.6 Environmental and Sustainability Compliance
- 9.7 Data Protection, AI and Cybersecurity Compliance
- 9.8 Upcoming Policy Changes and Market Implications
Chapter 10 United States Still Image Market Hotspots and Opportunities
- 10.1 Market Opportunity Mapping and Growth Hotspots
- 10.2 High-Growth Applications and Customer Groups
- 10.3 Underserved Markets and White-Space Opportunities
- 10.4 Emerging Technology and Product Opportunities
- 10.5 New Capacity and Investment Hotspots
- 10.6 Market Entry and Expansion Opportunities
- 10.7 Distribution and Partnership Opportunities
- 10.8 Near-Term and Long-Term Commercial Potential
- 10.9 Opportunity Attractiveness and Execution Risks
Chapter 11 United States Still Image Market Outlook, 2025-2035
- 11.1 Market Size and Analysis
- 11.1.1 Revenue (Market Measurement: 2025: USD 1.13 billion → 2035: USD 1.58 billion)
- 11.1.2 Market Volume and Quantity Sold
- 11.1.3 Historical Market Size, 2018-2025
- 11.1.4 Base-Year Market Size, 2025
- 11.2 Market Forecast, 2025-2035
- 11.2.1 Revenue Forecast to 2035
- 11.2.2 Volume Forecast to 2035
- 11.2.3 CAGR and Year-on-Year Growth
- 11.2.4 Incremental Revenue Opportunity
- 11.3 Forecast Assumptions and Scenario Analysis
- 11.3.1 Base-Case Forecast
- 11.3.2 Optimistic and Conservative Scenarios
- 11.3.3 Technology, Pricing and Policy Sensitivities
- 11.4 Market Attractiveness and Growth Outlook
Chapter 12 United States Still Image Market Segmentation and Outlook
- 12.1 Segmentation Summary and Market Shares, 2025
- 12.2 Largest and Fastest-Growing Segments
- 12.3 By Service Type - Market Size and Forecast, 2025-2035
- 12.3.1 Segment Definition and Scope
- 12.3.2 Historical Market Size, 2018-2025
- 12.3.3 Revenue Forecast, 2025-2035
- 12.3.4 Volume Forecast, 2025-2035
- 12.3.5 Base-Year Market Share, 2025
- 12.3.6 Segment CAGR and Growth Drivers
- 12.3.7 Subsegment Market Size and Forecast
- 12.3.7.1 Creative stock licensing
- 12.3.7.2 Editorial image licensing
- 12.3.7.3 Premium collection licensing
- 12.3.8 Subsegment Pricing and Adoption Trends
- 12.3.9 Leading Suppliers and Competition
- 12.3.10 Regional Demand and Opportunities
- 12.4 By Customer Type - Market Size and Forecast, 2025-2035
- 12.4.1 Segment Definition and Scope
- 12.4.2 Historical Market Size, 2018-2025
- 12.4.3 Revenue Forecast, 2025-2035
- 12.4.4 Volume Forecast, 2025-2035
- 12.4.5 Base-Year Market Share, 2025
- 12.4.6 Segment CAGR and Growth Drivers
- 12.4.7 Subsegment Market Size and Forecast
- 12.4.7.1 In-house creative teams
- 12.4.7.2 Advertising agencies
- 12.4.7.3 Independent creators
- 12.4.8 Subsegment Pricing and Adoption Trends
- 12.4.9 Leading Suppliers and Competition
- 12.4.10 Regional Demand and Opportunities
- 12.5 By End-Use Industry - Market Size and Forecast, 2025-2035
- 12.5.1 Segment Definition and Scope
- 12.5.2 Historical Market Size, 2018-2025
- 12.5.3 Revenue Forecast, 2025-2035
- 12.5.4 Volume Forecast, 2025-2035
- 12.5.5 Base-Year Market Share, 2025
- 12.5.6 Segment CAGR and Growth Drivers
- 12.5.7 Subsegment Market Size and Forecast
- 12.5.7.1 Advertising and brand marketing
- 12.5.7.2 Publishing and news media
- 12.5.7.3 Digital commerce
- 12.5.8 Subsegment Pricing and Adoption Trends
- 12.5.9 Leading Suppliers and Competition
- 12.5.10 Regional Demand and Opportunities
- 12.6 By Business Model - Market Size and Forecast, 2025-2035
- 12.6.1 Segment Definition and Scope
- 12.6.2 Historical Market Size, 2018-2025
- 12.6.3 Revenue Forecast, 2025-2035
- 12.6.4 Volume Forecast, 2025-2035
- 12.6.5 Base-Year Market Share, 2025
- 12.6.6 Segment CAGR and Growth Drivers
- 12.6.7 Subsegment Market Size and Forecast
- 12.6.7.1 Royalty-free licensing
- 12.6.7.2 Rights-managed licensing
- 12.6.7.3 Exclusive licensing
- 12.6.8 Subsegment Pricing and Adoption Trends
- 12.6.9 Leading Suppliers and Competition
- 12.6.10 Regional Demand and Opportunities
- 12.7 Segment Growth Comparison
- 12.8 Segment Attractiveness and Priority Matrix
Chapter 13 United States Still Image End-Use and Application Market Outlook
- 13.1 End-Use Industry and Customer Demand Structure
- 13.2 Leading Applications and Customer Groups
- 13.3 End-Use Market Size, Share and Forecast
- 13.4 Major End-Use Industry Deep Dives
- 13.4.1 Customer Requirements and Use Cases
- 13.4.2 Demand and Replacement Cycles
- 13.4.3 Technical and Regulatory Considerations
- 13.4.4 Purchasing and Procurement Models
- 13.4.5 Leading Vendors and Distribution Channels
- 13.4.6 Forecast and Commercial Opportunities
- 13.5 Emerging Applications and Cross-Segment Demand
- 13.6 End-Use Industry Investment Priorities
Chapter 14 United States Still Image Geographic Market Outlook, 2025-2035
- 14.1 Domestic Market Distribution and Demand Clusters
- 14.2 State- or Province-Wise Market Size and Forecast, 2025-2035
- 14.3 City and Metropolitan Market Outlook
- 14.4 Industrial, Manufacturing and Commercial Clusters
- 14.5 Geographic Concentration of Key End Users
- 14.6 Local Pricing and Purchasing Differences
- 14.7 Domestic Production Facilities and Capacity Map
- 14.8 Local Infrastructure and Project Pipeline
- 14.9 State-Level Policy and Incentive Differences
- 14.10 Subnational Investment Hotspots and Opportunities
- 14.11 Distribution and Logistics Networks
- 14.12 Domestic Competitive Footprint
Chapter 15 United States Still Image Technology, Innovation and Sustainability Outlook
- 15.1 Technology Landscape and Maturity
- 15.2 Product, Process and Service Innovation
- 15.3 AI, Automation and Digital Tools in the Industry
- 15.4 Technology Adoption and Performance Benchmarking
- 15.5 Innovation Pipeline and R&D Investment
- 15.6 Patent and Intellectual Property Trends
- 15.7 Energy Efficiency and Resource Management
- 15.8 Sustainability, Recycling and Circularity
- 15.9 Technology Roadmap, 2025-2035
- 15.10 Risks of Obsolescence and Technology Substitution
Chapter 16 United States Still Image Market Key Strategic Imperatives
- 16.1 Growth and Market Entry Priorities
- 16.2 High-Return Products and Segments
- 16.3 Pricing, Profitability and Cost Optimization
- 16.4 Technology Investment and Product Differentiation
- 16.5 Supply Chain Localization and Resilience
- 16.6 Distribution and Customer Acquisition
- 16.7 Partnership, Acquisition and Capacity Strategy
- 16.8 Regional Expansion Priorities
- 16.9 Short-, Medium- and Long-Term Actions
Chapter 17 Competition Outlook
- 17.1 Industry Competition Characteristics
- 17.2 Market Structure and Concentration
- 17.3 Market Share and Competitive Positioning, 2025
- 17.4 Company-Wise Revenue and Product Benchmarking
- 17.5 Production and Service Capacity Benchmarking
- 17.6 Technology, Pricing and Differentiation
- 17.7 Regional Footprint and Distribution Strength
- 17.8 Mergers, Acquisitions and Strategic Alliances
- 17.9 New Entrants and Competitive Threats
- 17.10 Porter's Five Forces and Industry Attractiveness
- 17.11 Competitive Outlook, 2025-2035
Chapter 18 Company Profiles
- 18.1 Company Coverage and Selection Criteria
- 18.2 Getty Images
- 18.2.1 Business Description
- 18.2.2 Company Ownership and Geographic Presence
- 18.2.3 Product and Service Portfolio
- 18.2.4 Manufacturing and Operating Footprint
- 18.2.5 Production Capacity and Expansion Plans
- 18.2.6 Financial Performance and Investment
- 18.2.7 Market Share and Competitive Position
- 18.2.8 Technology and Innovation Capabilities
- 18.2.9 Strategic Alliances or Partnerships
- 18.2.10 Recent Developments
- 18.2.11 Growth Strategy and Outlook
- 18.3 Shutterstock
- 18.4 Adobe (Adobe Stock)
- 18.5 Alamy
- 18.6 Depositphotos
- 18.7 Other Relevant Market Participants
Note: Every listed company is profiled on the structure shown under the first company. The company list is preliminary and may change based on research findings, market developments, data availability and client requirements.
Chapter 19 Disclaimer
- 19.1 Research and Forecast Disclaimer
- 19.2 Data Source and Estimation Limitations
Note: The depth of individual sections depends on data availability for this market. Volume, capacity, trade and other unit-based metrics are included where applicable.

