| REPORT ATTRIBUTE |
DETAILS |
| Historical Period |
2020-2023 |
| Base Year |
2024 |
| Forecast Period |
2025-2032 |
| Real-Time Payments Market Size 2024 |
USD 29,284.05 Million |
| Real-Time Payments Market, CAGR |
35.27% |
| Real-Time Payments Market Size 2032 |
USD 3,27,040.27 Million |
Market Overview:
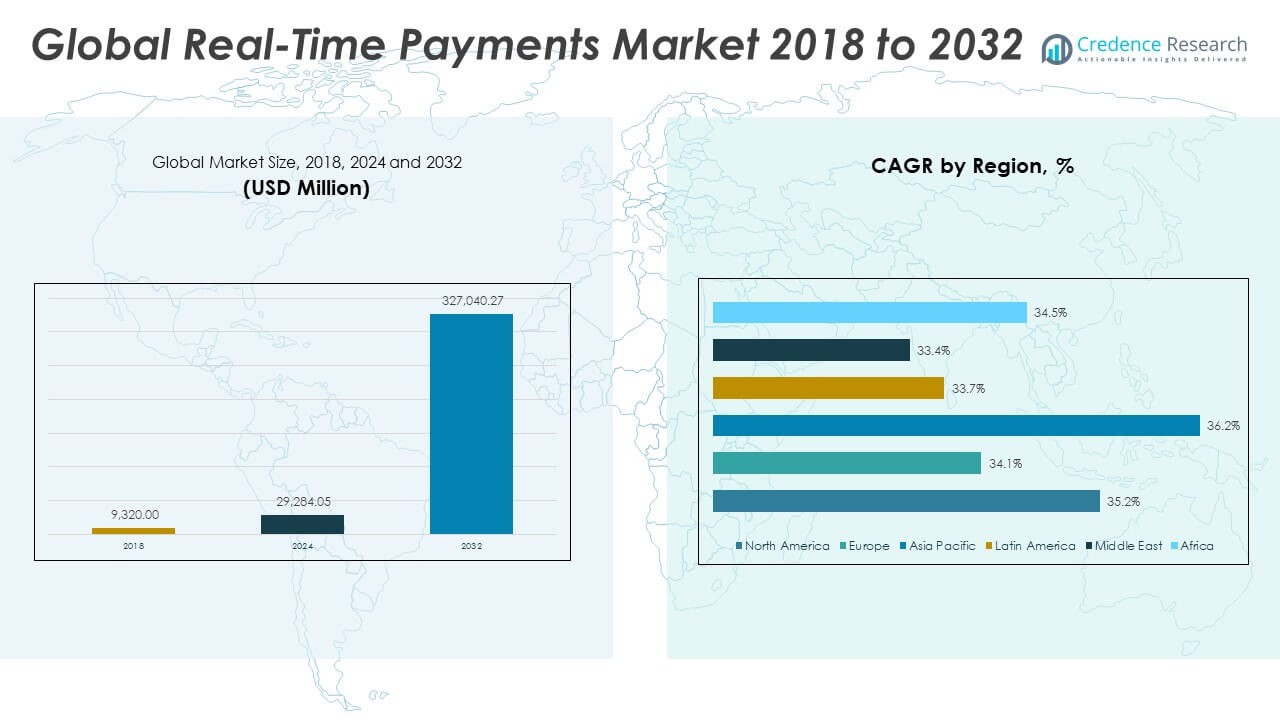
The Real-Time Payments Market size was valued at USD 9,320.00 million in 2018 to USD 29,284.05 million in 2024 and is anticipated to reach USD 3,27,040.27 million by 2032, at a CAGR of 35.27% during the forecast period.
The real-time payments market is driven by rising consumer expectations for instant, seamless, and secure transactions across banking and retail environments. The surge in mobile device usage and the proliferation of digital wallets have increased the demand for faster payment infrastructures. Businesses are integrating real-time systems to streamline cash flow, reduce settlement times, and enhance customer experience. Governments and central banks are also actively promoting digital payment ecosystems through regulatory frameworks and national payment rails. Real-time payments support financial inclusion by providing underserved populations with immediate access to financial services. Fintech innovation, including API-based banking and cloud-native platforms, further accelerates adoption. The incorporation of AI and machine learning strengthens fraud detection and enhances transaction visibility. Enterprises also benefit from enriched data messaging capabilities that improve reconciliation processes and reduce error rates. The growing reliance on remote commerce, gig economy transactions, and peer-to-peer payments continues to reinforce real-time payments as a foundational element of modern finance.
Asia-Pacific leads the real-time payments market, driven by government-led initiatives, high smartphone penetration, and strong fintech ecosystems. Countries like India and China have established mature, widely used instant payment systems, while Southeast Asia is rapidly enhancing cross-border interoperability. North America is steadily modernizing its payment infrastructure with the rollout of real-time rails and growing collaboration between banks and fintech providers. In Europe, established platforms like Faster Payments and SEPA Instant drive adoption, supported by regulatory frameworks and digital banking trends. Latin America is expanding rapidly, with countries such as Brazil gaining global attention for innovative government-backed systems that promote financial inclusion and digital access. The Middle East and Africa are also seeing strong momentum, as public-private efforts focus on digital transformation and mobile-first payment ecosystems. These regional developments reflect a global shift toward faster, more transparent, and inclusive financial systems, with real-time payments becoming a key pillar in economic digitization strategies.
Access crucial information at unmatched prices!
Request your sample report today & start making informed decisions powered by Credence Research Inc.!
Download Sample
Market Insights:
- The Real-Time Payments Market is projected to grow from USD 29,284.05 million in 2024 to USD 3,27,040.27 million by 2032, registering a strong CAGR of 35.27%.
- Increasing consumer preference for instant, secure, and seamless transactions is fueling demand across banking, retail, and service sectors.
- Government initiatives and central bank-backed real-time rails are accelerating nationwide adoption and financial inclusion in emerging economies.
- Mobile penetration and digital wallet usage are transforming user behavior, making mobile-first payment ecosystems a primary growth avenue.
- Cloud-based infrastructure, APIs, and AI-driven fraud detection are reshaping how financial institutions implement and scale real-time payment systems.
- Fragmented global infrastructure and lack of standardization are major challenges to cross-border interoperability and scalability.
- Asia-Pacific leads the market, with India, China, and Southeast Asia driving innovation and volume, while North America and Europe continue to modernize legacy systems.
Market Drivers:
Rising Demand for Instant, Seamless Financial Transactions
The growing consumer expectation for instant and seamless payment experiences is a major driver for the Real-Time Payments Market. Consumers and businesses increasingly value the ability to send and receive money instantly, without delays associated with traditional clearing systems. This demand is amplified by the proliferation of digital commerce and peer-to-peer payment platforms that prioritize speed and convenience. Real-time capabilities support enhanced customer satisfaction and foster loyalty, especially in sectors like retail, gig economy, and financial services. The shift toward instant disbursements for insurance claims, payroll, and refunds is reinforcing the value of real-time payment systems. Businesses also benefit from improved cash flow management and reduced payment processing times, further accelerating market growth.
- For example, according to ACI Worldwide, a leader in real-time payments software, global real-time payment transactions surged by 41% in 2020, reaching 70.3 billion transactions during the COVID-19 pandemic. India’s Unified Payments Interface (UPI) processed approximately 117 billion transactions in 2023, confirming its position as the world’s largest real-time payments platform.
Government Support and National Digital Payment Infrastructure Initiatives
Strong government backing and national payment infrastructure development are significantly shaping the growth of the Real-Time Payments Market. Many countries have launched real-time payment networks backed by central banks or regulatory authorities, enabling faster adoption across the public and private sectors. These initiatives aim to increase financial inclusion, reduce reliance on cash, and improve transaction transparency. In emerging economies, real-time payments are playing a key role in extending banking access to underserved populations. By promoting interoperability and standardization, governments are facilitating integration across financial institutions. National payment rails, supported by regulatory mandates, are positioning real-time systems as the backbone of digital financial ecosystems. It continues to gain momentum through public-private collaboration and infrastructure investment.
- For example, the U.S. Federal Reserve’s FedNow Service, launched in 2023, enables 24/7/365 instant payments for participating financial institutions, directly connecting banks and credit unions nationwide.
Acceleration of Mobile and Digital Banking Services Across Markets
The widespread adoption of smartphones, mobile apps, and digital wallets is fueling real-time transaction volume globally. Consumers prefer mobile-first experiences that allow them to manage finances, pay bills, and transfer money instantly with minimal friction. This behavioral shift has pushed banks and fintechs to integrate real-time functionality into digital banking platforms. Increased usage of QR code payments, contactless transactions, and embedded finance tools is expanding the use cases for instant payments. Real-time payment platforms are also being embedded into business systems for B2B, treasury, and supply chain transactions. It is strengthening its position as a core enabler of mobile-led financial services, especially in regions where traditional banking infrastructure remains limited.
Technological Advancements and API-Driven Payment Ecosystems
Innovation in technology is a key force advancing the Real-Time Payments Market. The rise of open banking frameworks and API integration is enabling real-time connectivity between banks, merchants, and consumers. These systems allow for transparent data exchange, enhanced automation, and efficient reconciliation. Cloud-based infrastructure supports scalable and cost-effective deployment of real-time platforms, reducing reliance on legacy systems. Artificial intelligence and machine learning are being used to detect anomalies, prevent fraud, and improve user verification. It is benefiting from the convergence of digital identity, tokenization, and real-time data analytics. These innovations collectively improve transaction speed, reliability, and security making real-time payments more viable across diverse industries and use cases.
Market Trends:
Expansion of Cross-Border Real-Time Payment Capabilities
One of the most prominent trends shaping the Real-Time Payments Market is the development of cross-border instant payment systems. Financial institutions, governments, and technology providers are working together to enable real-time fund transfers across jurisdictions, breaking down barriers in international commerce. Initiatives like regional payment linkages and bilateral agreements between countries are helping streamline settlement processes beyond domestic borders. Interoperability between national payment rails is a growing priority, supported by the adoption of global standards such as ISO 20022. This trend is transforming how individuals and businesses conduct international remittances, trade settlements, and foreign transactions. It is creating a more connected financial ecosystem by facilitating low-cost, high-speed global money movement.
Rise of Embedded Real-Time Payments in Digital Ecosystems
The integration of real-time payment functionalities into broader digital platforms is gaining momentum. E-commerce websites, ride-hailing apps, marketplaces, and social media platforms are embedding payment options that enable immediate transactions without redirecting users to external gateways. This shift reflects growing demand for frictionless financial experiences within everyday digital interactions. The Real-Time Payments Market is adapting to this trend by enabling seamless back-end connectivity with third-party platforms via APIs and SDKs. Businesses are leveraging embedded payments to improve user engagement and streamline checkout processes. It is aligning with the broader movement toward contextual commerce and integrated financial experiences across sectors.
Growth of Real-Time Payment Use Cases in Corporate and B2B Segments
The Real-Time Payments Market is witnessing an expansion in corporate and business-to-business (B2B) applications. Traditionally reliant on batch-based or manual payment processes, enterprises are now adopting real-time systems to gain better control over working capital and reduce operational inefficiencies. Use cases such as supplier payouts, invoice settlements, and treasury transfers are increasingly shifting toward real-time models. This trend is driven by the need for greater transparency, faster cash reconciliation, and improved liquidity management. It is reshaping how businesses manage their financial operations, with real-time capabilities becoming integral to enterprise resource planning (ERP) systems and financial workflows. Large corporations and SMEs alike are integrating real-time functionality into their payment strategies.
- For instance, The Clearing House’s RTP network raised its transaction limit from $1 million to $10 million in February 2025, enabling high-value corporate transactions. Bank of America reported that payments exceeding $1 million now constitute over 50% of the total RTP transaction value processed for corporate clients.
Increased Focus on Value-Added Services Around Real-Time Payments
The emergence of value-added services is becoming a key differentiator within the Real-Time Payments Market. Payment providers are offering enhanced functionalities such as request-to-pay, payment scheduling, fraud analytics, and real-time notifications. These services extend the utility of real-time payments beyond simple fund transfers, adding intelligence and control for users. Banks and fintechs are also building platforms that bundle financial insights, reconciliation tools, and reporting dashboards alongside real-time payment solutions. It is helping institutions create more holistic offerings that cater to both retail and business clients. This trend signals a shift from commoditized payment rails to intelligent, service-rich transaction ecosystems.
- Visa, for example, offers a suite of value-added services supporting real-time account-based payments, including Directory Services for alias-based addressing (e.g., mobile numbers, emails), advanced AI-driven risk analytics for fraud detection, and ISO 20022-compliant Request-to-Pay services that streamline payment initiation and reconciliation.
Market Challenges Analysis:
Fragmented Global Infrastructure and Lack of Interoperability
The lack of standardization across national payment systems poses a significant challenge to the Real-Time Payments Market. Many countries operate their own real-time payment infrastructures with differing protocols, compliance requirements, and messaging standards, making cross-border integration complex. This fragmentation limits scalability for multinational businesses and fintechs aiming to offer seamless global services. It restricts the market from achieving full potential in international commerce and remittances. Efforts to harmonize frameworks through ISO 20022 adoption are ongoing, but disparities in implementation timelines and technical maturity persist. The market must overcome these infrastructure and interoperability gaps to create a truly connected global payments ecosystem. It will require coordinated efforts among regulators, financial institutions, and technology providers.
Cybersecurity Risks and Fraud Vulnerabilities in Instant Settlement Models
The shift to real-time transaction processing introduces heightened cybersecurity and fraud risks, posing a challenge to user trust and system resilience. Instant payments provide limited time for fraud detection, increasing the risk of unauthorized transfers, phishing attacks, and account takeovers. Financial institutions face pressure to implement real-time monitoring, AI-based risk scoring, and transaction authentication without compromising user experience. The Real-Time Payments Market is under constant threat from evolving cyber threats targeting digital wallets, mobile apps, and APIs. It must invest heavily in fraud prevention tools and secure architecture to maintain integrity and regulatory compliance. Balancing speed, transparency, and security remains a delicate challenge for stakeholders across the ecosystem.
Market Opportunities:
Expansion into Underserved and Emerging Markets with Mobile-First Strategies
Emerging markets present a strong opportunity for the Real-Time Payments Market, especially where traditional banking infrastructure is limited. Mobile-first payment systems can bridge financial gaps and support unbanked populations through secure, instant transaction access. Governments and fintech companies are prioritizing financial inclusion, creating demand for accessible, low-cost payment solutions. The widespread use of smartphones enables real-time payments to gain traction quickly in regions like Sub-Saharan Africa, Southeast Asia, and Latin America. It can capitalize on these conditions by deploying agile, cloud-based platforms tailored to local user behavior. Market players that offer localized solutions with user-friendly interfaces and minimal onboarding barriers will gain early-mover advantage.
Integration of Real-Time Payments in Embedded Finance and Industry-Specific Platforms
The growing trend of embedding financial services within non-financial platforms opens new avenues for the Real-Time Payments Market. Sectors such as retail, healthcare, logistics, and education are integrating instant payment options into their customer journeys. Real-time settlement capabilities can enhance supplier payments, payroll systems, and consumer checkouts. It can create value-added services by combining data analytics, automated invoicing, and real-time transaction tracking. This convergence strengthens customer relationships and builds ecosystem loyalty. Industry-specific applications of real-time payments are expected to create differentiated solutions and revenue streams for providers.
Market Segmentation Analysis:
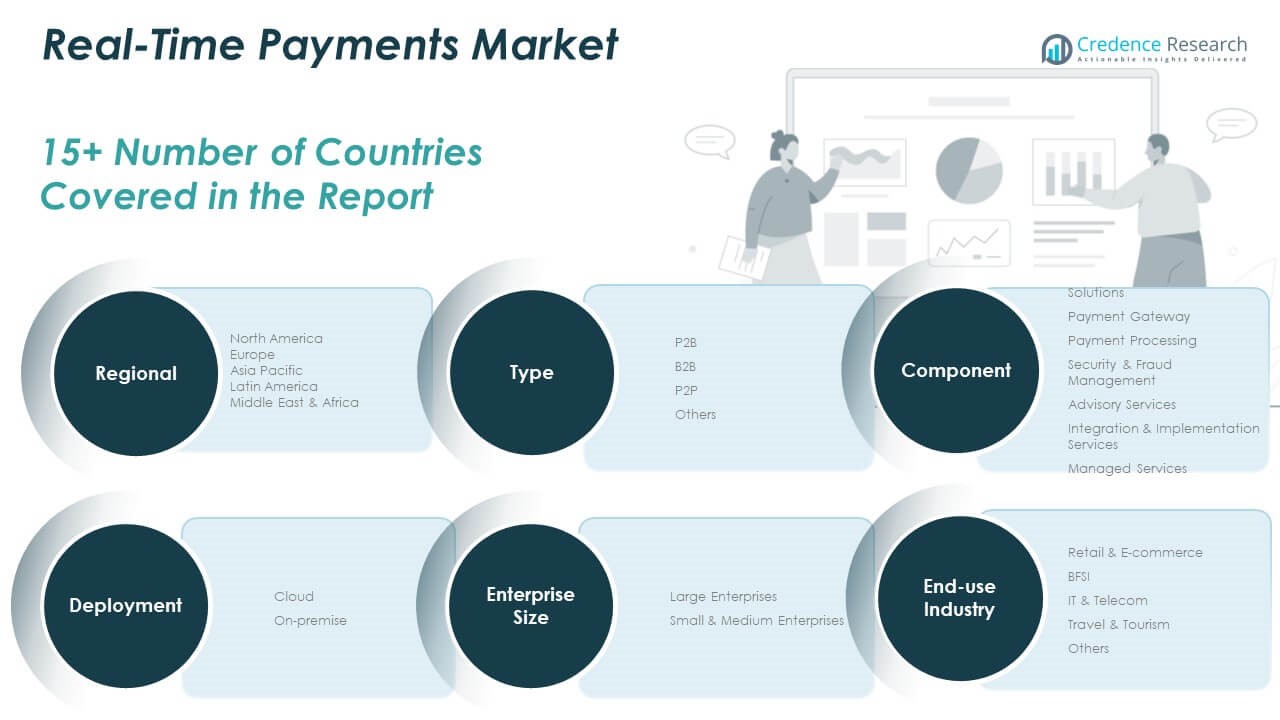
The Real-Time Payments Market is segmented by type, component, deployment, enterprise size, and end-use industry.
By type, P2B dominates due to increasing retail and utility transactions, followed by strong growth in P2P and B2B payments as digital transfers replace cash and checks.
- For example, PayPalremains a leader in digital retail transactions, supporting one-touch payments and seamless integration with most e-commerce platforms. In 2025, PayPal processed more than 13 billion transactions globally.
By component, solutions account for the largest share, led by payment gateways and payment processing tools. Security & fraud management and integration services are gaining traction due to rising concerns over transaction safety and interoperability. Services such as advisory and support play a vital role in implementation and ongoing optimization.
- For instance, Adyenis a top global gateway for large enterprises, offering unified payment processing, risk management, and multi-currency support for brands operating worldwide
By deployment, cloud-based platforms lead due to their scalability, speed, and lower infrastructure costs, while on-premise remains relevant for highly regulated sectors.
By enterprise size, large enterprises contribute the most revenue, driven by complex payment needs and high transaction volumes. The SME segment is expanding rapidly with adoption of affordable, modular payment tools.
By end-use industry, BFSI and retail & e-commerce dominate, with growing uptake in IT & telecom and travel & tourism.
Segmentation:
By Type
- P2B (Person to Business)
- B2B (Business to Business)
- P2P (Person to Person)
- Others
By Component
Solutions:
- Payment Gateway
- Payment Processing
- Security & Fraud Management
- Advisory Services
- Integration & Implementation Services
- Managed Services
Services:
- Professional & Support Services
By Deployment
By Enterprise Size
- Large Enterprises
- Small & Medium Enterprises
By End-use Industry
- Retail & E-commerce
- BFSI (Banking, Financial Services, and Insurance)
- IT & Telecom
- Travel & Tourism
- Others
By Region
- North America
- Europe
- Asia Pacific
- Latin America
- Middle East
- Africa
Regional Analysis:
The North America Real-Time Payments Market size was valued at USD 2,469.80 million in 2018 to USD 7,631.25 million in 2024 and is anticipated to reach USD 84,830.98 million by 2032, at a CAGR of 35.2% during the forecast period. North America holds a significant share in the Real-Time Payments Market, accounting for 21% of global revenue. It is driven by modernization of legacy systems and growing demand for faster, transparent financial services. The launch of initiatives such as the FedNow Service and the RTP network has improved adoption across financial institutions. Large banks, fintechs, and payment processors are actively integrating real-time functionality to meet rising expectations in sectors like e-commerce, payroll, and insurance. The region’s advanced digital infrastructure and regulatory alignment support secure and efficient real-time settlements. It continues to expand with strong collaboration between public and private stakeholders.
The Europe Real-Time Payments Market size was valued at USD 1,985.16 million in 2018 to USD 5,938.00 million in 2024 and is anticipated to reach USD 61,729.72 million by 2032, at a CAGR of 34.1% during the forecast period. Europe commands 16% of the global Real-Time Payments Market share, driven by well-established platforms and evolving digital strategies. Countries like the UK, Sweden, and the Netherlands lead adoption through national schemes like Faster Payments and SEPA Instant Credit Transfer. The European Union’s focus on harmonized payment standards, such as ISO 20022, supports regional interoperability. Businesses across the continent are incorporating real-time solutions to streamline financial operations and reduce settlement cycles. The market is also benefiting from open banking regulations that promote innovation and third-party integration. It remains a key region for payment modernization and cross-border initiatives.
The Asia Pacific Real-Time Payments Market size was valued at USD 3,851.02 million in 2018 to USD 12,417.78 million in 2024 and is anticipated to reach USD 146,550.28 million by 2032, at a CAGR of 36.2% during the forecast period. Asia Pacific dominates the Real-Time Payments Market with a market share of 43%, supported by advanced digital ecosystems and government-backed payment infrastructures. India’s UPI, China’s Alipay and WeChat Pay, and Thailand’s PromptPay are examples of successful nationwide real-time systems. High smartphone penetration and mobile-first user behavior have accelerated adoption across urban and rural areas. The region is witnessing growing fintech collaboration, enabling seamless, scalable platforms. Cross-border interoperability projects are strengthening real-time transaction capabilities within ASEAN and beyond. It continues to lead global trends with innovation and volume-driven growth.
The Latin America Real-Time Payments Market size was valued at USD 477.18 million in 2018 to USD 1,481.48 million in 2024 and is anticipated to reach USD 15,066.74 million by 2032, at a CAGR of 33.7% during the forecast period. Latin America holds a 6% share in the Real-Time Payments Market, with Brazil leading transformation through its PIX platform. The market is gaining momentum due to increasing digital wallet usage, growing financial inclusion efforts, and widespread adoption of mobile banking. Government-led initiatives are supporting rapid onboarding of users into formal financial systems. Real-time capabilities are helping to reduce cash dependency, streamline disbursements, and improve digital commerce experiences. Countries like Mexico, Colombia, and Argentina are investing in real-time rails and expanding access for SMEs and underserved communities. It offers high potential for scalable, inclusive payment solutions.
The Middle East Real-Time Payments Market size was valued at USD 326.20 million in 2018 to USD 954.47 million in 2024 and is anticipated to reach USD 9,518.67 million by 2032, at a CAGR of 33.4% during the forecast period. The Middle East accounts for 3% of the global Real-Time Payments Market, driven by national digital transformation strategies and smart government initiatives. Countries like Saudi Arabia and the UAE have launched instant payment platforms to support cashless economies and diversify financial infrastructure. Banks are actively modernizing their systems to integrate real-time capabilities with mobile banking apps and enterprise systems. The market is witnessing increased investment in cybersecurity and fraud prevention to ensure secure digital transactions. Strategic partnerships between global technology firms and regional banks are accelerating deployment. It is emerging as a promising growth region for instant payments and financial modernization.
The Africa Real-Time Payments Market size was valued at USD 210.63 million in 2018 to USD 861.07 million in 2024 and is anticipated to reach USD 9,343.88 million by 2032, at a CAGR of 34.5% during the forecast period. Africa holds 2% of the Real-Time Payments Market share, with growing interest in mobile-led financial ecosystems and fintech-driven innovation. Countries like Nigeria, South Africa, and Kenya are adopting real-time systems to enhance financial access and reduce transaction costs. The widespread use of mobile money platforms provides a foundation for real-time capabilities in both urban and rural regions. Cross-border remittance services and merchant payments are becoming key applications. Governments and central banks are supporting regulatory frameworks that encourage competition and innovation. It presents strong growth opportunities where real-time systems align with financial inclusion goals and digital economy expansion.
Shape Your Report to Specific Countries or Regions & Enjoy 30% Off!
Key Player Analysis:
- ACI Worldwide, Inc.
- Fidelity National Information Services, Inc. (FIS Inc.)
- Finastra
- Fiserv, Inc.
- Mastercard, Inc.
- Montran Corp.
- PayPal Holdings, Inc.
- Temenos AG
- Visa Inc.
- Volante Technologies Inc.
- Wirecard AG
- Worldpay, Inc.
Competitive Analysis:
The Real-Time Payments Market features intense competition among global technology providers, financial institutions, payment processors, and fintech companies. Key players focus on expanding their solution portfolios, forming strategic alliances, and investing in scalable cloud-based infrastructures. Leading firms are integrating API-driven platforms, fraud detection tools, and data-rich messaging capabilities to differentiate their offerings. Regional players often tailor solutions to specific regulatory environments and user behaviors, strengthening their market presence. It continues to attract new entrants due to rising demand for instant transactions across industries. Established players leverage partnerships with banks and governments to deploy national real-time payment rails and cross-border services. Competition is evolving beyond transaction speed toward value-added services, user experience, and ecosystem integration.
Recent Developments:
- In June 2025, Fiserv announced the upcoming launch of its new stablecoin, FIUSD, as part of a broader digital asset platform. This stablecoin will be integrated into Fiserv’s banking and payments infrastructure by the end of 2025, providing financial institutions and merchants with scalable, real-time digital asset services.
- In April 2025, Fidelity National Information Services (FIS) signed a definitive agreement to acquire the issuer processing business of Global Payments Inc. (GPN) for $13.5 billion. This acquisition is expected to strengthen FIS’s capabilities in the real-time payments market and is projected to close in the first half of 2026, pending regulatory approvals.
- In March 2025, Finastra entered into a strategic partnership with i2c Inc. to offer debit card issuance and digital wallet solutions to North American financial institutions. This partnership enhances Finastra’s core banking services with real-time, digital-first payment features, supporting seamless integration and improved customer experiences.
- In February 2025, ACI Worldwide announced a strategic partnership with UK-based fintech Banfico to provide payment verification services for banks and payment providers across the UK and Europe. This collaboration is aimed at enhancing real-time payment security and compliance in the region.
Market Concentration & Characteristics:
The Real-Time Payments Market is moderately fragmented, with a mix of global leaders and strong regional providers competing across diverse geographies. It features a dynamic landscape shaped by rapid innovation, regulatory involvement, and high demand for digital transaction speed. Market participants include traditional financial institutions, fintech startups, payment network operators, and technology vendors. The market is characterized by low switching costs, high scalability, and ongoing platform evolution through API integration and real-time analytics. Governments and central banks play a pivotal role in shaping national infrastructures, while private players drive technological advancement. It emphasizes interoperability, security, and value-added features to enhance user experience and operational efficiency.
Report Coverage:
The research report offers an in-depth analysis based on type, component, deployment, enterprise size, and end-use industry. It details leading market players, providing an overview of their business, product offerings, investments, revenue streams, and key applications. Additionally, the report includes insights into the competitive environment, SWOT analysis, current market trends, as well as the primary drivers and constraints. Furthermore, it discusses various factors that have driven market expansion in recent years. The report also explores market dynamics, regulatory scenarios, and technological advancements that are shaping the industry. It assesses the impact of external factors and global economic changes on market growth. Lastly, it provides strategic recommendations for new entrants and established companies to navigate the complexities of the market.
Future Outlook:
- Growing adoption of real-time payments across B2B sectors will transform corporate finance operations.
- Integration with blockchain and distributed ledger technologies will enhance transaction transparency.
- AI-powered fraud detection and risk scoring will strengthen payment security frameworks.
- Expansion of real-time payment rails into rural and underserved regions will drive financial inclusion.
- Embedded payments in IoT ecosystems will unlock new consumer and industrial applications.
- Strategic partnerships between banks and fintechs will accelerate cross-border payment innovation.
- Government-backed initiatives will continue to standardize protocols and improve interoperability.
- Consumer demand for frictionless experiences will push retailers to adopt instant settlement options.
- Cloud-native platforms will enable scalable deployment for banks and third-party providers.
- Value-added services like request-to-pay and real-time invoicing will create new revenue models.


