
Market Overview
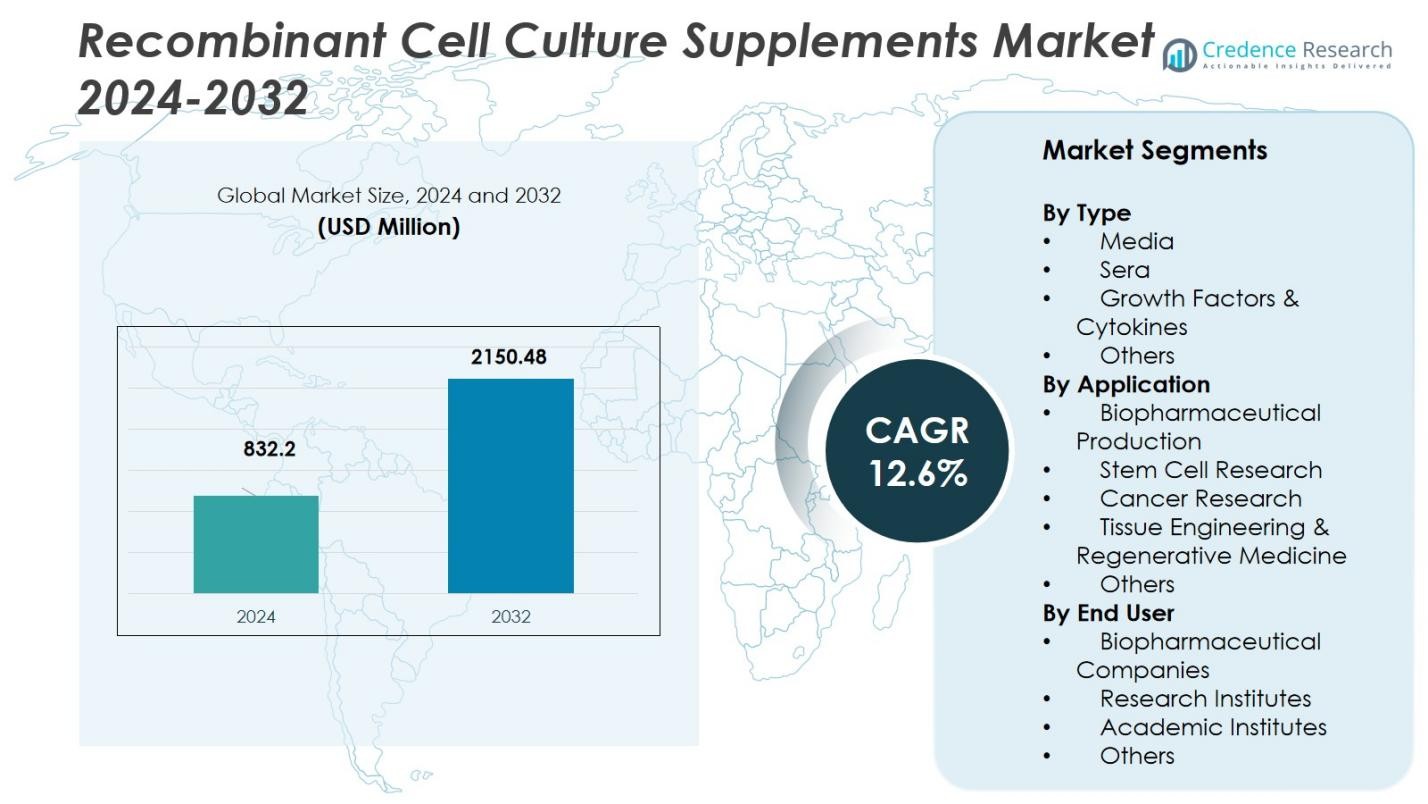
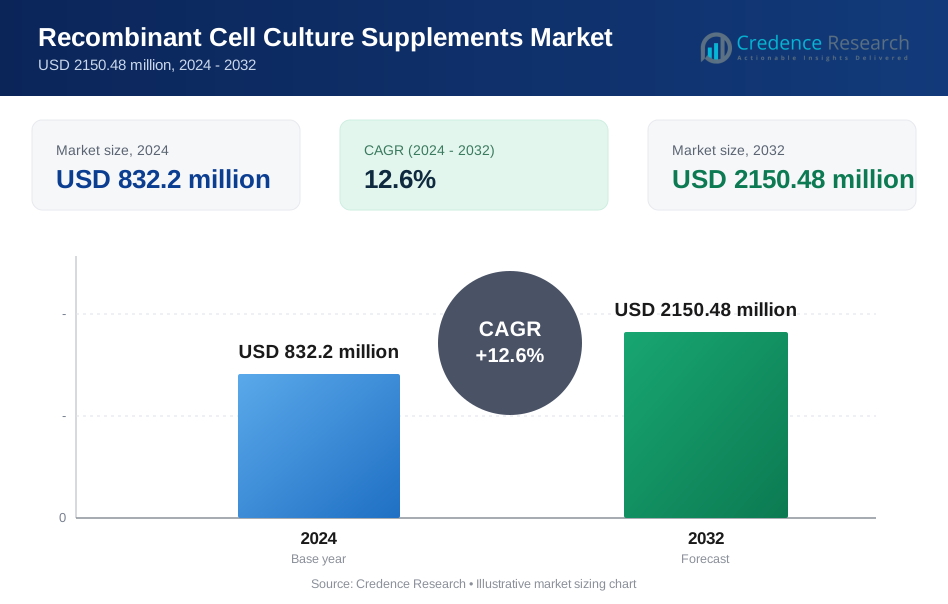
The Recombinant Cell Culture Supplements Market was valued at USD 832.2 million in 2024 and is anticipated to reach USD 2150.48 million by 2032, growing at a CAGR of 12.6% during the forecast period.
| REPORT ATTRIBUTE | DETAILS |
|---|---|
| Historical Period | 2020-2023 |
| Base Year | 2024 |
| Forecast Period | 2025-2032 |
| Recombinant Cell Culture Supplements Market Size 2024 | USD 832.2 Million |
| Recombinant Cell Culture Supplements Market, CAGR | 12.6% |
| Recombinant Cell Culture Supplements Market Size 2032 | USD 2150.48 Million |
The Recombinant Cell Culture Supplements Market is driven by key players such as Thermo Fisher Scientific Inc., Merck KGaA, Sartorius AG, Lonza Group AG, and Bio-Techne Corporation. These companies lead through extensive portfolios of high‑purity recombinant growth factors, cytokines, and defined media components, supporting the growth of biologics, biosimilars, and gene therapies. North America holds the largest market share, accounting for 37.43% in 2024, owing to its robust biopharmaceutical ecosystem, advanced manufacturing infrastructure, and regulatory frameworks favoring animal-free media. Europe follows closely, with a share of 34.4%, supported by a mature biopharmaceutical industry and growing demand for cell and gene therapies. The Asia Pacific region, holding 24.0% of the market, is experiencing rapid expansion due to increased biopharmaceutical investments and rising production capacities, particularly in vaccine manufacturing.
Market Insights
- The Recombinant Cell Culture Supplements Market was valued at USD 832.2 million in 2024 and is projected to reach USD 2,150.48 million by 2032, growing at a CAGR of 12.6% during the forecast period (2025–2032).
- Key drivers include the increasing demand for biologics and cell/gene therapies, the shift to serum-free, animal-free media, and technological advancements in cell culture systems.
- The market is characterized by innovations in recombinant growth factors, cytokines, and custom feed strategies, which are crucial for enhancing bioprocessing efficiency.
- High production costs and process variability across different cell lines present significant challenges to widespread adoption, limiting the market's accessibility for smaller labs.
- North America holds the largest regional share at 37.43%, followed by Europe at 34.4%, with Asia Pacific showing rapid growth, holding 24% of the global market share in 2024.
 Market Segmentation Analysis:
By Type
In the “Type” segment of the recombinant cell culture supplements market, the dominant sub‑segment is those supplements classified as growth factors & cytokines, which are estimated to hold about 25.2% of the segment share in 2025. This dominance is driven by the increasing requirement for precisely defined supplements to support advanced cell culture systems, especially in biopharmaceutical manufacturing and regenerative medicine settings. The shift toward serum‑free and animal‑component‑free media is also boosting demand for well‑characterised recombinant growth factors and cytokines, as they offer better consistency and regulatory compliance.
- For instance, Proteintech offers GMP-grade cytokines and growth factors produced in human expression systems, ensuring regulatory compliance and high quality for clinical applications.
By Application
Within the “Application” segment, the largest share is captured by the biopharmaceutical production sub‑segment, accounting for roughly 48.7% of the total market. This segment’s strength stems from the ongoing expansion of biologics, biosimilars, and cell/gene therapy manufacturing, which require high‑performance cell culture supplements to optimise yield, quality, and reproducibility. In addition, the increasing regulatory demand for serum‑free and defined culture systems further supports the uptake of recombinant supplements in this production arena.
- For instance, the increasing use of recombinant supplements in cell and gene therapy manufacturing by firms like Lonza, which supports enhanced cell proliferation and product quality in scalable processes.
By End User
Looking at the “End User” segment, the dominant sub‑segment is biopharmaceutical companies (i.e., pharmaceutical & biotechnology companies), which held approximately 38.8% of the market in 2024. Their leading position is underpinned by large‑scale biologics manufacturing, rigorous quality standards, and the need for scalable, reproducible upstream processes. Moreover, the outsourcing trend toward contract development and manufacturing organisations (CDMOs) is expected to further drive this sub‑segment’s growth, as these enterprises adopt recombinant supplements to support high‑volume, high‑complexity cell culture workflows.
Key Growth Drivers
Escalating Biopharmaceutical Demand
The expanding global pipeline of biologics, including monoclonal antibodies, vaccines, and gene- and cell-therapies, significantly drives the demand for advanced cell culture supplements in the recombinant sector. As biopharmaceutical companies scale up manufacturing and adopt complex upstream processes, they require high-quality, consistent supplements to support cell growth, viability, and product yield in large-scale bioreactors. This shift toward biologics production underlines the rising need for recombinant cell culture supplements, supporting higher productivity, regulatory compliance, and efficient manufacturing processes.
- For instance, companies like Lonza use recombinant supplements to enhance cell proliferation and product consistency, reinforcing their essential role in modern biologics production and regulatory compliance.
Transition to Animal-Free, Serum-Free Media
The industry’s movement away from fetal bovine serum and other animal-derived components toward defined, animal-free and serum-free media has become a fundamental growth driver for recombinant supplements. Regulatory and ethical pressures, alongside concerns over batch-to-batch variability and contamination risk, are prompting manufacturers to adopt recombinant growth factors, cytokines, and other defined supplements. This trend is catalyzing demand for more consistent, scalable cell culture systems and boosting the uptake of high-purity recombinant supplements.
- For instance, Thermo Fisher Scientific has developed a range of high-purity recombinant cytokines specifically designed for serum-free media applications, enabling consistent cell culture performance at scale.
Innovations in Cell Culture Technologies and Supportive R&D
Advancements in cell culture technologies such as single-use bioreactors, perfusion systems, automation, and custom feed strategies are enabling more efficient and higher-yield bioprocesses, which, in turn, drive the need for specialized recombinant cell culture supplements. Concurrently, increased research investment in regenerative medicine, stem-cell therapies, and personalized medicine demands tailored supplements to meet specific cell-line and process requirements. These combined technological and R&D advancements are propelling growth in the recombinant cell culture supplements market.
Key Trends & Opportunities
Expansion of Cell-and-Gene Therapy Applications
The growing prominence of cell-and-gene therapies opens an opportunity for recombinant cell culture supplements to support new processes for stem cells, gene-modified cells, and tissue-engineered constructs. As these therapies progress from research to commercialization, manufacturers increasingly require specialized supplements that promote expansion, differentiation, and viability of therapeutic cell types. This shift enables supplement companies to develop niche, value-added products tailored to emerging therapy platforms.
- For instance, Thermo Fisher Scientific offers recombinant stem cell growth factors like BMP-4 and cytokines that block unwanted differentiation and maintain pluripotency in stem cell cultures, supporting precise expansion and differentiation.
Growth in Emerging Regions and Outsourced Manufacturing
Emerging markets in Asia-Pacific and other developing regions are investing heavily in biopharmaceuticals and biotechnology infrastructure, creating new geographic opportunities for recombinant cell culture supplements. At the same time, the outsourcing of biologics manufacturing to contract development and manufacturing organizations (CDMOs) is increasing, enabling supplement suppliers to partner with large-scale contract manufacturers and serve global production footprints. These trends offer growth potential for supplement providers to expand beyond traditional markets and customer segments.
- For instance, the CDMO Simtra BioPharma Solutions expanded capacity by completing a new sterile injectables facility in Halle, Germany, in 2025.
Key Challenges
High Cost and Production Complexity
Producing recombinant cell culture supplements involves advanced genetic engineering, sophisticated bioprocessing, and stringent quality controls, all of which contribute to high development and manufacturing costs. These elevated cost structures can limit wider adoption, particularly among smaller research labs or cost-sensitive segments. In addition, complex purification, regulatory compliance, and scalability issues present further hurdles for supplement developers and users alike.
Process Variability and Cell Culture Specificity
A significant challenge in this market lies in managing variability across cell lines, culture systems, and applications-each requiring different supplement compositions, concentrations, and performance characteristics. The need for cell-line-specific optimization means that off-the-shelf recombinant supplements may not always meet required performance, leading to batch failures or sub-optimal yields. This variability increases the burden on manufacturers to develop tailored solutions and undermines scalability and standardization in upstream processes.
Regional Analysis
North America
The North America region secured a 37.43% share of the global recombinant cell culture supplements market in 2024, underpinned by a robust biopharmaceutical ecosystem and substantial biotech research investment. The region benefits from well-established pharmaceutical firms, strong regulatory frameworks favouring animal-free media, and advanced manufacturing infrastructure. These factors drive high adoption of recombinant supplements in biologics and cell-therapy production. Growth is further supported by continuous innovation in upstream bioprocessing and a high volume of clinical programmes, positioning North America as the primary revenue contributor in this market.
Europe
Europe accounted for a 34.4% share of the global market in 2024, owing to its mature biopharmaceutical manufacturing base, stringent regulatory standards, and increasing adoption of defined culture systems. The region’s strong academic and industrial research activities in cell- and gene-therapies have elevated demand for recombinant supplements. Countries such as Germany, the UK, and France lead the pipeline of advanced therapies, driving uptake of high-quality culture inputs. As manufacturing moves toward serum-free defined media, supplementary demand rises, reinforcing Europe’s significant market standing.
Asia Pacific
Holding 24.0% of the global market in 2024, the Asia Pacific region is a rapidly expanding segment of the recombinant cell culture supplements market. Growth is driven by increasing biopharmaceutical production, rising vaccine manufacturing capacity, and accelerating investment in cell- and gene-therapy infrastructure across China, India, Japan, and Southeast Asia. Governments support domestic biotechnology expansion, and industry players seek cost-efficient manufacturing. The region’s high-growth trajectory positions it as a critical opportunity for supplement providers.
Latin America
Latin America represents a smaller yet emerging market, estimated at around 5% of the global share, reflecting gradual uptake of recombinant supplements across biopharma R&D and manufacturing. Increasing interest in biologics production, together with improvements in regional healthcare infrastructure and regulations, underlies market expansion. Whilst individually the markets remain less developed compared to North America or Europe, Latin America offers growing potential for suppliers aiming to partner with contract manufacturers and research institutions to meet rising local demand.
Middle East & Africa
The Middle East & Africa (MEA) region is estimated at about 5% of global market share and presents meaningful growth potential, although currently at a lower base. Expansion is supported by rising chronic disease burden, growing investment in biotechnology, and increasing collaboration with global biopharma firms. Nations such as Saudi Arabia, the UAE, and South Africa are focusing on domestic biologics and regenerative medicine capabilities, which in turn drives demand for recombinant cell culture supplements over the forecast period.
Market Segmentations:
By Type
- Media
- Sera
- Growth Factors & Cytokines
- Others
By Application
- Biopharmaceutical Production
- Stem Cell Research
- Cancer Research
- Tissue Engineering & Regenerative Medicine
- Others
By End User
- Biopharmaceutical Companies
- Research Institutes
- Academic Institutes
- Others
By Region
- North America
- U.S.
- Canada
- Mexico
- Europe
- Germany
- France
- U.K.
- Italy
- Spain
- Rest of Europe
- Asia Pacific
- China
- Japan
- India
- South Korea
- South-east Asia
- Rest of Asia Pacific
- Latin America
- Brazil
- Argentina
- Rest of Latin America
- Middle East & Africa
- GCC Countries
- South Africa
- Rest of the Middle East and Africa
Competitive Landscape
The competitive landscape of the recombinant cell culture supplements market is shaped significantly by key players such as Thermo Fisher Scientific Inc., Merck KGaA, Sartorius AG, Lonza Group AG, Corning Incorporated, Bio‑Techne Corporation, STEMCELL Technologies Inc., and Irvine Scientific. These firms dominate through extensive global manufacturing networks, broad supplement portfolios, and strong R&D investment that enable them to deliver high‑purity recombinant growth factors, cytokines and other defined media components. They consistently pursue strategic initiatives such as acquisitions, geographic expansion and collaborations to enhance their cell‑culture offering and reach emerging markets. Smaller niche firms and start‑ups also play a role, especially in tailored or emerging therapy‑specific segments, increasing competitive intensity. Overall, the market remains concentrated but dynamic, with differentiation driven by product quality, application specificity and regulatory compliance.
Key Player Analysis
- Merck KGaA
- Sartorius AG
- Thermo Fisher Scientific Inc.
- Corning Incorporated
- GE Healthcare
- STEMCELL Technologies Inc.
- Lonza Group AG
- Bio‑Techne Corporation
- BD Biosciences
- Irvine Scientific
Recent Developments
- In April 2025, InVitria launched Optibumin® 25, the first recombinant 25% human serum albumin for closed‑system use in cell culture.
- In October 2025, Qkine Ltd. launched its Cell Therapy Grade proteins portfolio-animal origin‑free recombinant growth factors and cytokines designed for cell therapy manufacturing.
- In August 2025, Sartorius Stedim Biotech entered a partnership with Nanotein Technologies, including a minority investment and exclusive global distribution for immune‑cell activator reagents used in cell culture.
- In June 2024, Dyadic International, Inc. entered a development and commercialization partnership with Proliant Health and Biologicals to bring animal‑free recombinant human serum albumin products to the cell culture supplements market.
Report Coverage
The research report offers an in-depth analysis based on Type, Application, End User and Region. It details leading market players, providing an overview of their business, product offerings, investments, revenue streams, and key applications. Additionally, the report includes insights into the competitive environment, SWOT analysis, current market trends, as well as the primary drivers and constraints. Furthermore, it discusses various factors that have driven market expansion in recent years. The report also explores market dynamics, regulatory scenarios, and technological advancements that are shaping the industry. It assesses the impact of external factors and global economic changes on market growth. Lastly, it provides strategic recommendations for new entrants and established companies to navigate the complexities of the market.
Future Outlook
- Adoption of advanced biologic therapies will continue to fuel demand for recombinant cell culture supplements as manufacturers scale up cell‑based production.
- Increased regulatory pressure to eliminate animal‑derived components will drive greater usage of defined, recombinant supplements across global bioprocessing platforms.
- Emerging markets will accelerate uptake of recombinant supplements as biopharmaceutical manufacturing and infrastructure investment expand in Asia Pacific, Latin America and MEA.
- Tailored supplement formulations designed for specific cell lines, gene therapies and tissue engineering will become more prevalent to meet diverse application needs.
- Contract development and manufacturing organizations (CDMOs) will increasingly source high‑performance recombinant supplements to support outsourced biologics production.
- Innovation in single‑use bioreactors, perfusion systems and automation will raise demand for high‑consistency supplements capable of delivering reproducible performance at scale.
- Growth in regenerative medicine and personalized cell therapies will open new opportunities for recombinant supplements formulated for stem‑cell expansion and differentiation.
- Competitive players will focus on strategic partnerships, acquisitions and geographic expansions to capture a larger share of the evolving supplement market.
- Cost pressures and the complexity of producing highpurity recombinant components will challenge suppliers to optimise manufacturing efficiency and reduce end‑user prices.
- Variability of cell culture systems and the need for process‑specific optimisation will drive demand for highly customised supplement solutions and support services.
Request a Free Sample
Fill in your details and we'll send you a free sample report.
- Sample data tables & charts
- Research methodology
Need a Custom Version of This Report?
Tailor the scope, geography, or segments to your exact requirements.
- Custom geography or segment scope
- Direct access to our analyst team
Frequently Asked Questions
What is the current market size for Recombinant Cell Culture Supplements Market, and what is its projected size in 2032?
At what Compound Annual Growth Rate is the Recombinant Cell Culture Supplements Market projected to grow between 2025 and 2032?
Which Recombinant Cell Culture Supplements Market segment held the largest share in 2024?
What are the primary factors fueling the growth of the Recombinant Cell Culture Supplements Market?
Who are the leading companies in the Recombinant Cell Culture Supplements Market?
Which region commanded the largest share of the Recombinant Cell Culture Supplements Market in 2024?
Table of Content
Chapter 1. Report Introduction
- 1.1 Report Description & Purpose
- 1.1.1 Report Title & Market Definition
- 1.1.2 Unique Selling Propositions (USP) & Key Differentiators
- 1.1.3 Value Proposition for Stakeholders
- 1.2 Research Objectives
- 1.2.1 Market Sizing Objectives (Volume & Revenue)
- 1.2.2 Segmentation Objectives
- 1.2.3 Competitive Intelligence Objectives
- 1.2.4 Forecast & Scenario Objectives
- 1.3 Report Scope
- 1.3.1 Recombinant Cell Culture Supplements Scope – Types & Subtypes Covered
- 1.3.2 Geographic Scope – Regions & Countries Covered
- 1.3.3 Historical Period, Base Year & Forecast Period (2024; forecast to 2032)
- 1.3.4 Inclusions & Exclusions
- 1.4 HS Code & Classification Framework
- 1.5 Currency, Units & Pricing Basis
- 1.6 Target Stakeholders
- 1.7 Limitations & Assumptions
Chapter 2. Executive Summary
- 2.1 Global Recombinant Cell Culture Supplements Market Snapshot
- 2.1.1 Market Size – Historical (2024) & Forecast (2024-2032) (2024: USD 832.2 million → 2032: USD 2150.48 million)
- 2.1.2 Volume & Revenue – Global Totals
- 2.1.3 Key Market Highlights – Top Five Facts
- 2.2 Recombinant Cell Culture Supplements Market Segmentation Snapshot
- 2.2.1 Market Split by Region – 2024 vs. 2032
- 2.3 Competitive Snapshot
- 2.3.1 Top 10 Players by Revenue Share – 2024
- 2.3.2 Top 10 Players by Volume Share – 2024
- 2.3.3 Recent Strategic Developments (18-Month Summary)
- 2.4 Key Investment Highlights & Strategic Conclusions
Chapter 3. Recombinant Cell Culture Supplements Market Dynamics & Industry Analysis
- 3.1 Market Overview & Context
- 3.1.1 Recombinant Cell Culture Supplements Market Position in the Broader Automotive Value Chain
- 3.1.2 OEM vs. Replacement Market Dynamics
- 3.1.3 Market Maturity & Development Stage by Region
- 3.2 Recombinant Cell Culture Supplements Market Drivers
- 3.3 Recombinant Cell Culture Supplements Market Restraints & Challenges
- 3.4 Recombinant Cell Culture Supplements Market Opportunities
- 3.5 Porter's Five Forces Analysis
- 3.5.1 Threat of New Entrants
- 3.5.2 Bargaining Power of Suppliers
- 3.5.3 Bargaining Power of Buyers
- 3.5.4 Threat of Substitutes
- 3.5.5 Competitive Rivalry – Intensity Assessment
- 3.6 Recombinant Cell Culture Supplements Value Chain Analysis
- 3.6.1 Upstream – Raw Material/Input Suppliers
- 3.6.1.1 Raw Material/Input 1
- 3.6.1.2 Raw Material/Input 2
- 3.6.1.3 Raw Material/Input 3
- 3.6.2 Midstream – Production/Manufacturing/Service Delivery
- 3.6.2.1 Production/Process Overview
- 3.6.2.2 Key Facility Locations & Capacity by Manufacturer
- 3.6.3 Downstream – Distribution & End Consumer
- 3.6.3.1 Primary Channel – B2B/OEM
- 3.6.3.2 Secondary Channels – Dealer, Retail, Online, Direct
- 3.6.4 Value Chain Profitability Analysis
- 3.6.1 Upstream – Raw Material/Input Suppliers
- 3.7 PESTEL Analysis
- 3.7.1 Political Factors
- 3.7.2 Economic Factors
- 3.7.3 Social Factors
- 3.7.4 Technological Factors
- 3.7.5 Environmental Factors
- 3.7.6 Legal Factors
- 3.8 Recombinant Cell Culture Supplements Supply Chain Analysis
- 3.8.1 Raw Material/Input Supply Risk Assessment
- 3.8.2 Manufacturing Concentration Risk (Geographic Exposure)
- 3.8.3 Trade Disruption Impact Analysis
- 3.9 Regulatory & Policy Landscape
Note: The regulatory and policy landscape section covers regulations based on their applicability to the market, Recombinant Cell Culture Supplements category, geography, and scope of the study. Only regulatory frameworks with a material impact on operations, compliance, trade, sustainability, or market access are analyzed in detail.
Chapter 4. Key Investment Pockets & Opportunity Analysis
- 4.1 Recombinant Cell Culture Supplements Market Attractiveness Analysis
- 4.1.1 By Region – Investment Attractiveness Matrix (Volume × CAGR)
- 4.2 Absolute Revenue Growth Opportunity
- 4.2.1 By Region – Absolute USD Growth Through 2032
- 4.3 Incremental Volume Opportunity
- 4.3.1 By Region – Incremental Volume Through 2032
- 4.3.2 Segment – Incremental Volume
- 4.4 Emerging Submarket Opportunity Deep Dive (Subject to Applicability)
- 4.5 Emerging Market Opportunity Scorecards
- 4.5.1 United States
- 4.5.2 Europe
- 4.5.3 Asia
- 4.5.4 Middle East & Africa
Note: Emerging Market Opportunity Scorecards will be included based on relevance and strategic importance. Regions listed are indicative and may vary depending on data availability and market dynamics.
Chapter 5. Recombinant Cell Culture Supplements Import-Export Analysis & Trade Flows
- 5.1 Global Trade Overview
- 5.1.1 Global Export Value by Country (2024)
- 5.1.2 Global Export Volume by Country (2024)
- 5.1.3 Global Import Value by Country (2024)
- 5.1.4 Global Import Volume by Country (2024)
- 5.1.5 Net Trade Balance by Country (2024)
- 5.2 Export Analysis – Segment
- 5.2.1 Type 1 (HS Code)
- 5.2.2 Type 2 (HS Code)
- 5.2.3 Type 3 (HS Code)
- 5.2.4 Type 4 (HS Code)
- 5.2.5 Type 5 (HS Code)
- 5.3 Import Analysis – Segment
- 5.3.1 Type 1 (HS Code)
- 5.3.2 Type 2 (HS Code)
- 5.3.3 Type 3 (HS Code)
- 5.3.4 Type 4 (HS Code)
- 5.3.5 Type 5 (HS Code)
- 5.4 Average Unit Trade Prices
- 5.4.1 Average Export Price – Segment & Country
- 5.4.2 Average Import Price – Segment & Source Country
- 5.4.3 Price Trends (2024)
- 5.5 Key Trade Route Analysis
- 5.5.1 Trade Route 1
- 5.5.2 Trade Route 2
- 5.5.3 Trade Route 3
- 5.5.4 Trade Route 4
- 5.5.5 Trade Route 5
- 5.6 Trade Policy Impact Assessment
- 5.6.1 US Anti-Dumping & Section 301 Tariffs
- 5.6.2 EU Customs Union Impact
- 5.6.3 Major Free Trade Agreements
- 5.6.4 USMCA Rules of Origin
Note: Trade policy analysis will be included only where relevant to the Recombinant Cell Culture Supplements market.
Chapter 6. Competitive Landscape & Company Benchmarking
- 6.1 Recombinant Cell Culture Supplements Market Concentration & Structure
- 6.1.1 Herfindahl-Hirschman Index (HHI) – vs. 2024
- 6.1.2 Tier 1, Tier 2 & Tier 3 Market Structure
- 6.1.3 Global, Regional & Local Player Dynamics
- 6.2 Recombinant Cell Culture Supplements Market Share Analysis – 2024
- 6.2.1 Global Revenue Share by Company
- 6.2.2 Global Volume Share by Company
- 6.2.3 Regional Revenue Share
- 6.2.4 Market Share Evolution ( vs. 2024)
- 6.2.5 OEM Segment Share by Company
- 6.2.6 Replacement Segment Share by Company
- 6.3 Production/Delivery Capacity & Facility Analysis
- 6.3.1 Global Installed Capacity
- 6.3.2 Capacity Utilization Rates
- 6.3.3 Production/Output Volume
- 6.3.4 Facility Locations & Capacity Map
- 6.3.5 Planned Capacity Additions
- 6.4 Recombinant Cell Culture Supplements Competitive Benchmarking Matrix
- 6.4.1 Revenue, Volume, CAGR & Profitability Comparison
- 6.4.2 Channel Revenue Mix
- 6.4.3 Geographic Revenue Exposure
- 6.4.4 R&D Intensity
- 6.4.5 Sustainability Maturity
- 6.5 Strategic Developments in Recombinant Cell Culture Supplements (Last 24 Months)
- 6.5.1 Mergers, Acquisitions & Divestments
- 6.5.2 New Recombinant Cell Culture Supplements Launches
- 6.5.3 Facility Expansions
- 6.5.4 Strategic Alliances, Joint Ventures & Partnerships
- 6.5.5 Distribution Expansion & Market Entry
- 6.5.6 Sustainability & ESG Initiatives
- 6.6 Competitive Strategy Mapping
- 6.6.1 Leader, Challenger, Follower & Niche Classification
- 6.6.2 Pricing Strategy Comparison
- 6.6.3 Channel Strategy Matrix
Note: Strategic developments are included based on their materiality and the availability of reliable information.
Chapter 7. Global Recombinant Cell Culture Supplements Market – By Distribution Channel
- 7.1 Segment Overview
- 7.1.1 Volume & Revenue Split by Channel (2024 & 2032)
- 7.1.2 Channel Mix Evolution (2024-2032)
Chapter 8. Regional Market Analysis – Global Overview
- 8.1 Global Regional Overview
- 8.1.1 Regional Volume Share
- 8.1.2 Regional Revenue Share
- 8.1.3 Regional Volume by Region
- 8.1.4 Regional Revenue by Region
- 8.1.5 Regional Forecast Through 2032
- 8.2 Cross-Regional Segment Analysis
- 8.2.1 By Distribution Channel
- 8.2.2 By Brand/Price Tier
Chapter 9. North America Recombinant Cell Culture Supplements Market
- 9.1 United States
- 9.2 Canada
- 9.3 Mexico
Chapter 10. Europe Recombinant Cell Culture Supplements Market
- 10.1 Germany
- 10.2 France
- 10.3 Italy
- 10.4 United Kingdom
- 10.5 Spain
- 10.6 Poland
- 10.7 Russia
- 10.8 Netherlands
- 10.9 Belgium
- 10.10 Sweden
- 10.11 Denmark
- 10.12 Norway
- 10.13 Rest of Europe
Chapter 11. Asia Pacific Recombinant Cell Culture Supplements Market
- 11.1 China
- 11.2 India
- 11.3 Japan
- 11.4 South Korea
- 11.5 Thailand
- 11.6 Indonesia
- 11.7 Vietnam
- 11.8 Malaysia
- 11.9 Australia
- 11.10 Rest of Asia Pacific
Chapter 12. Latin America Recombinant Cell Culture Supplements Market
- 12.1 Brazil
- 12.2 Argentina
- 12.3 Colombia
- 12.4 Chile
- 12.5 Rest of Latin America
Chapter 13. Middle East Recombinant Cell Culture Supplements Market
- 13.1 Saudi Arabia
- 13.2 United Arab Emirates
- 13.3 Turkey
- 13.4 Israel
- 13.5 Iran
- 13.6 Rest of the Middle East
Chapter 14. Africa Recombinant Cell Culture Supplements Market
- 14.1 South Africa
- 14.2 Egypt
- 14.3 Nigeria
- 14.4 Morocco
- 14.5 Rest of Africa
Chapter 15. Recombinant Cell Culture Supplements Company Profiles
- 15.1 [Company 01]
- 15.1.1 Company Overview
- 15.1.2 Key Management Personnel
- 15.1.3 Products & Services Portfolio
- 15.1.4 Financial Performance
- 15.1.5 Key Market Focus & Geographic Presence
- 15.1.6 Recent Developments & Strategic Initiatives
Note: The company profile list is preliminary and may change based on research findings, market developments, data availability, and client requirements.
Chapter 16. Appendices
- Appendix A – List of Abbreviations & Acronyms
- Appendix B – Industry Classification Code Reference – Full Series
- Appendix C – Production & Capacity Data Tables
- Appendix D – End-Use & Demand Base Tables
- Appendix E – Consumption & Replacement Rate Assumptions
- Appendix F – ASP Reference Tables
- Appendix G – Manufacturing & Facility Database
- Appendix H – Import-Export Data Tables
- Appendix I – Regulatory Summary Tables
- Appendix J – Primary Research Participant List (Anonymized)
- Appendix K – Primary Research Questionnaire Framework
- Appendix L – Data Sources & Bibliography
- Appendix M – Market Size Divergence & Source Comparison
Chapter 17. Research Methodology
- 17.1 Research Framework & Philosophy
- 17.2 Secondary Research – Sources, Hierarchy & Data Extraction
- 17.3 Data Modeling – Bottom-Up & Top-Down Market Sizing
- 17.4 Primary Research – Stakeholder Framework, LOI & Sample Sizes
- 17.5 Forecast Methodology – Regression, Scenario & Sensitivity Analysis
- 17.6 Quality Control – Four-Layer Validation Framework
- 17.7 Limitations & Standard Assumptions
- 17.8 Disclaimer
