
Official live feeds now underpin every in-play price
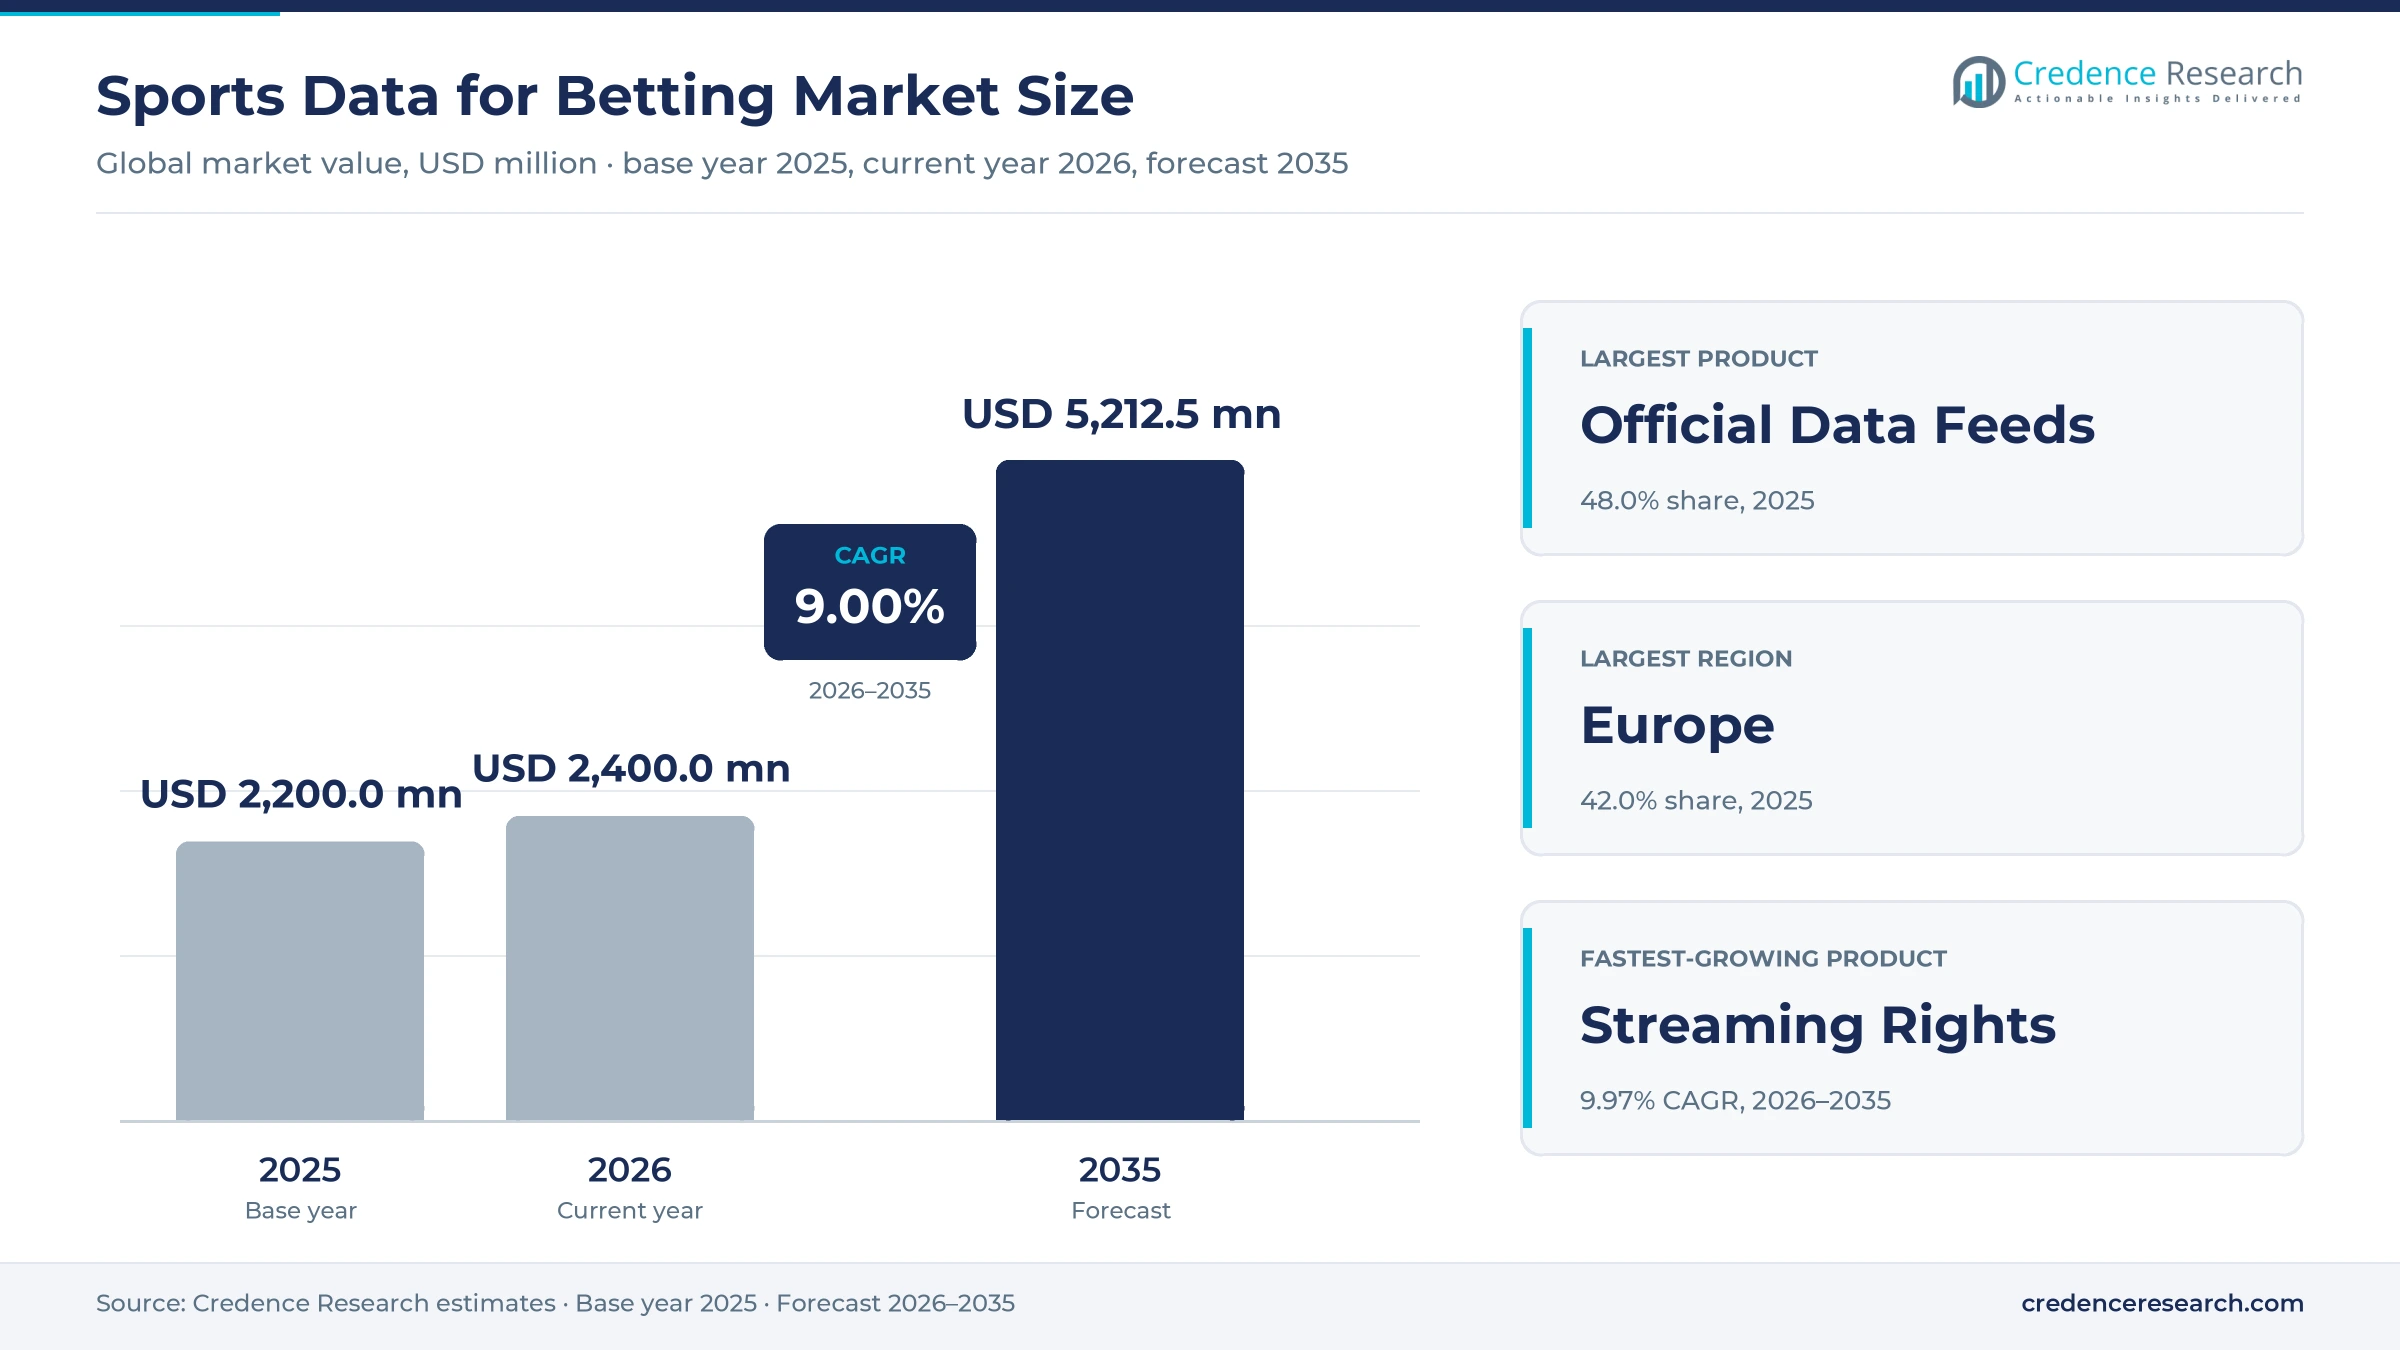
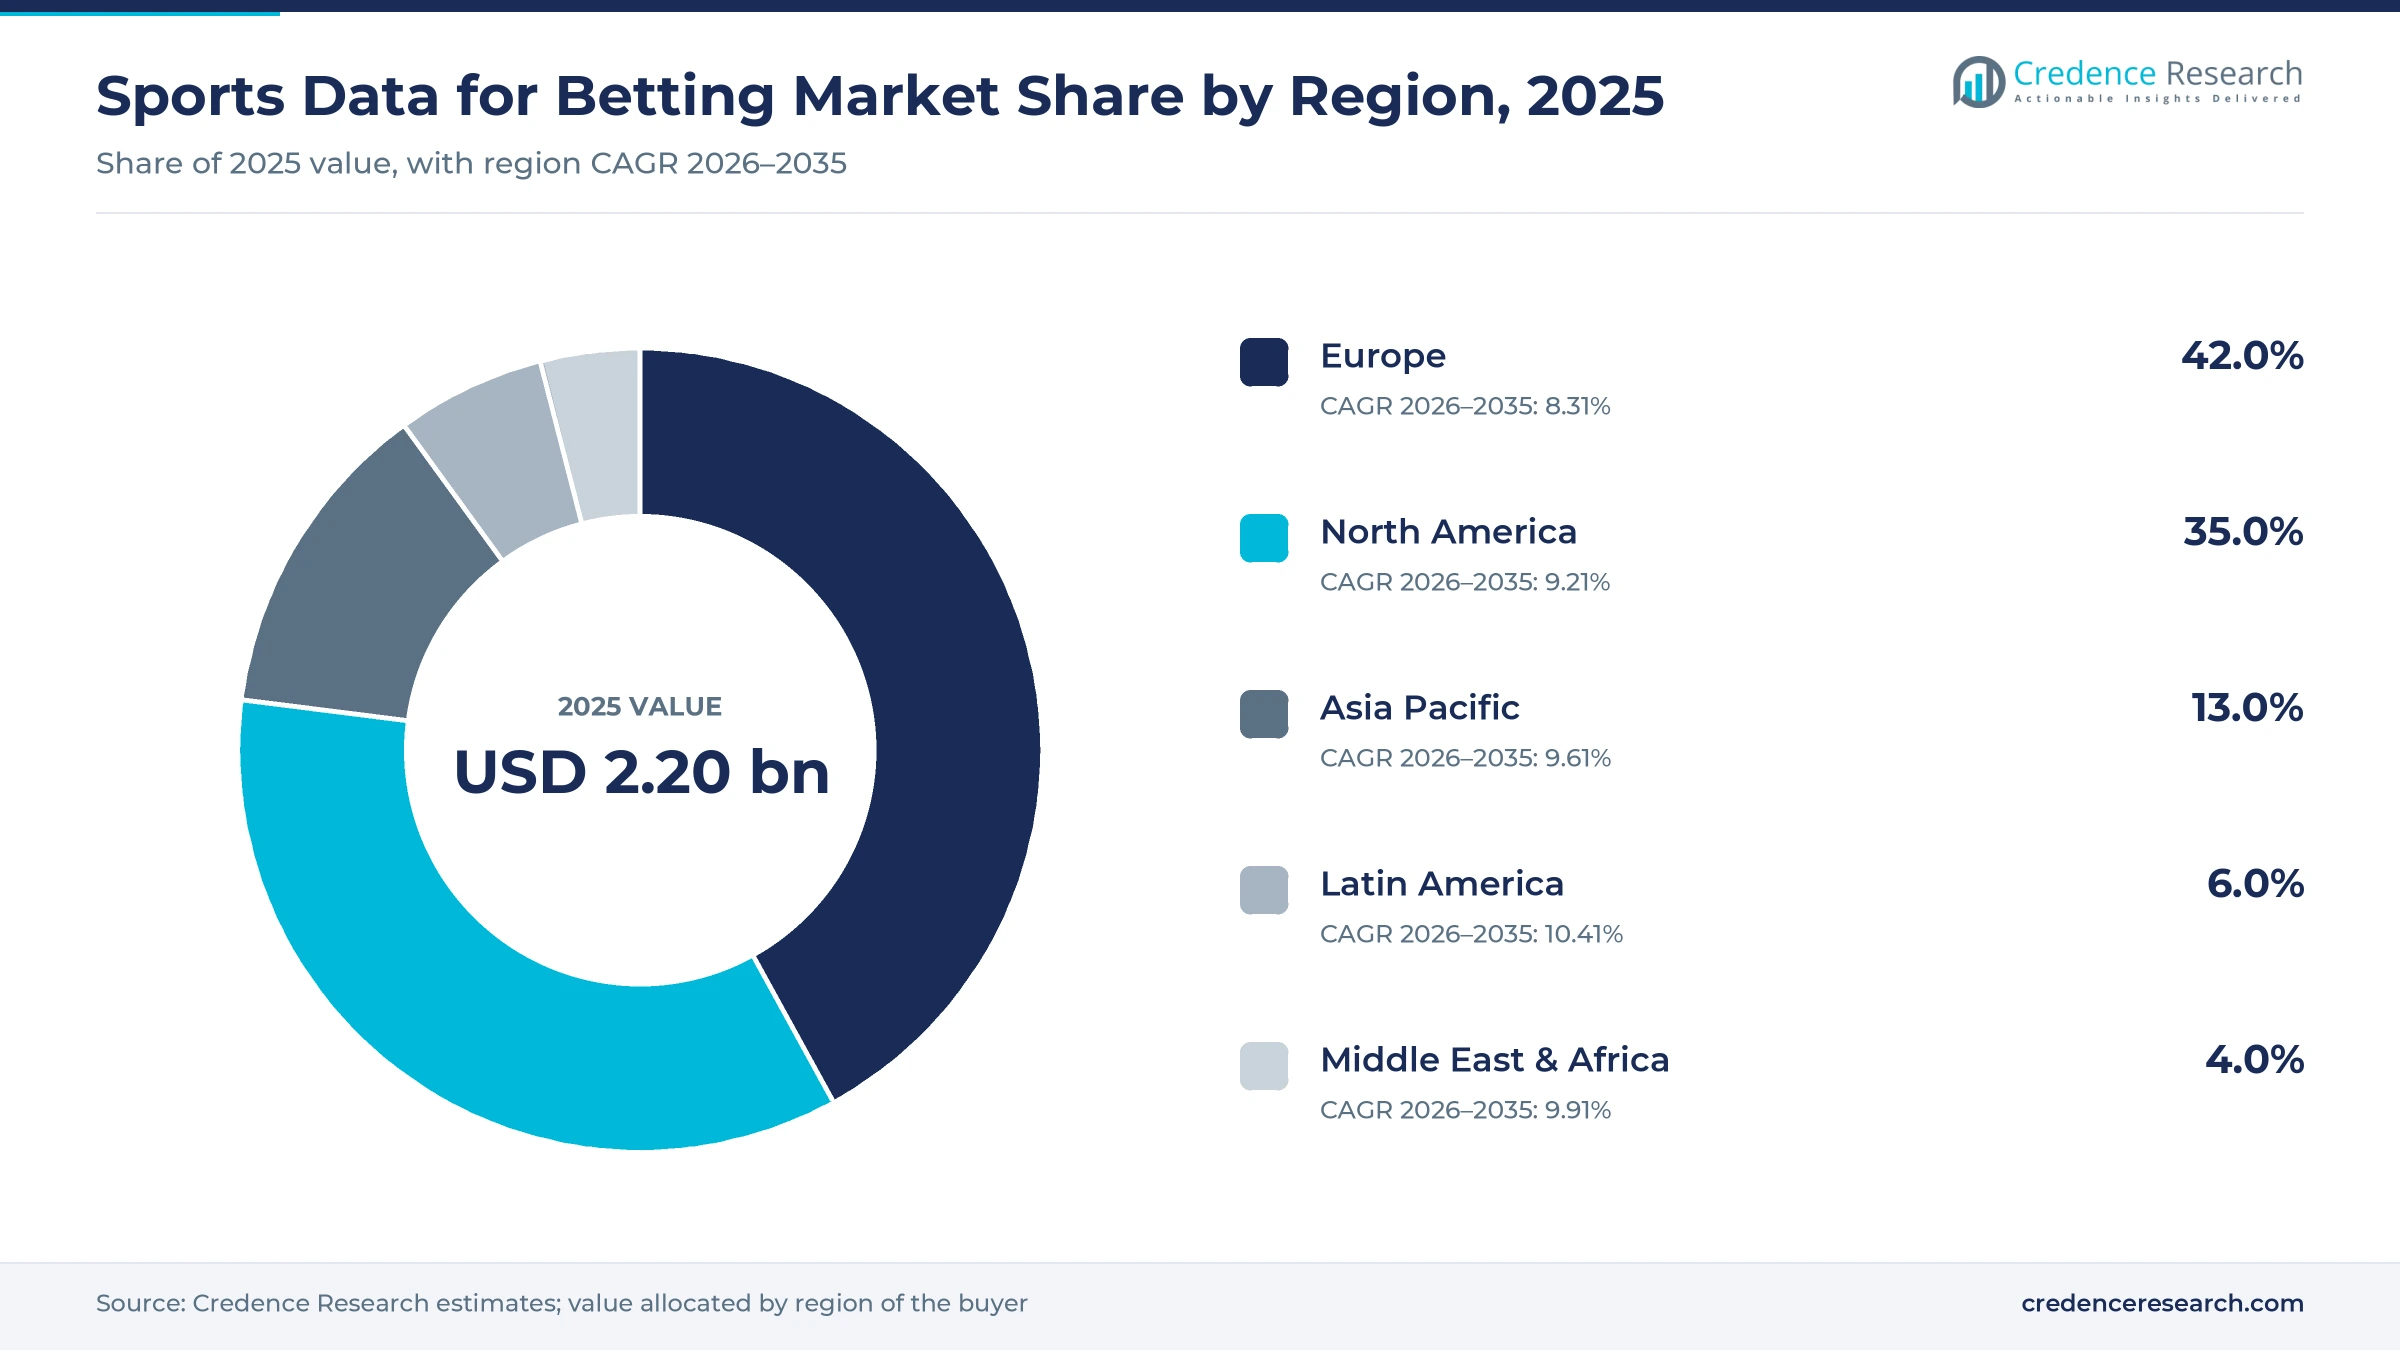
The global sports data for betting market was valued at USD 2.20 billion in 2025 and is projected to increase from USD 2.40 billion in 2026 to USD 5.21 billion by 2035, registering a CAGR of 9.00% during 2026–2035. Demand comes from licensed sportsbooks that need official live event and player data, odds and live video to price and settle in-play markets, and from media groups that add live statistics to coverage. Europe held the largest regional share, 42.0% in 2025, because the Premier League, the EFL and the Scottish leagues sell their betting rights through an exclusive supplier contract that runs to 2029. Latin America is the fastest-growing region at 10.41% a year as Brazil's licensed market completes its first years of regulated operation. A major commercial change is the move from text data feeds to video products that place live streams, micro markets and bet slips in one player. Integrity monitoring is also being sold together with data, as leagues ask suppliers to detect suspicious betting on their events.
What does the sports data for betting market include?
The market covers official live event and player data feeds, odds and trading services, betting streaming rights and integrity monitoring sold to sportsbooks and media companies. Buyers license these services from data suppliers that hold rights from leagues and federations, usually under multi-year contracts priced by sport, event volume and territory.
The scope excludes sportsbook platform software sold on its own, fan-facing statistics apps, team performance analysis for coaches and broadcast production. Value is counted as license and service fees paid by betting operators and media buyers, including fees that suppliers pass on to rights holders, but excluding betting stakes and operator revenue.
Sports Data for Betting Market Insights
- The market is valued at USD 2.20 billion in 2025 and is projected to reach USD 5.21 billion by 2035, growing at a 9.00% CAGR as live betting depends on official feeds.
- Europe led with 42.0% of 2025 value, while Genius Sports supplies official data from more than 4,000 U.K. football games a season in under one second.
- Official Data Feeds held 48.0% of 2025 value, and MLB named Sportradar the exclusive distributor of its ultra-low latency official data through 2032.
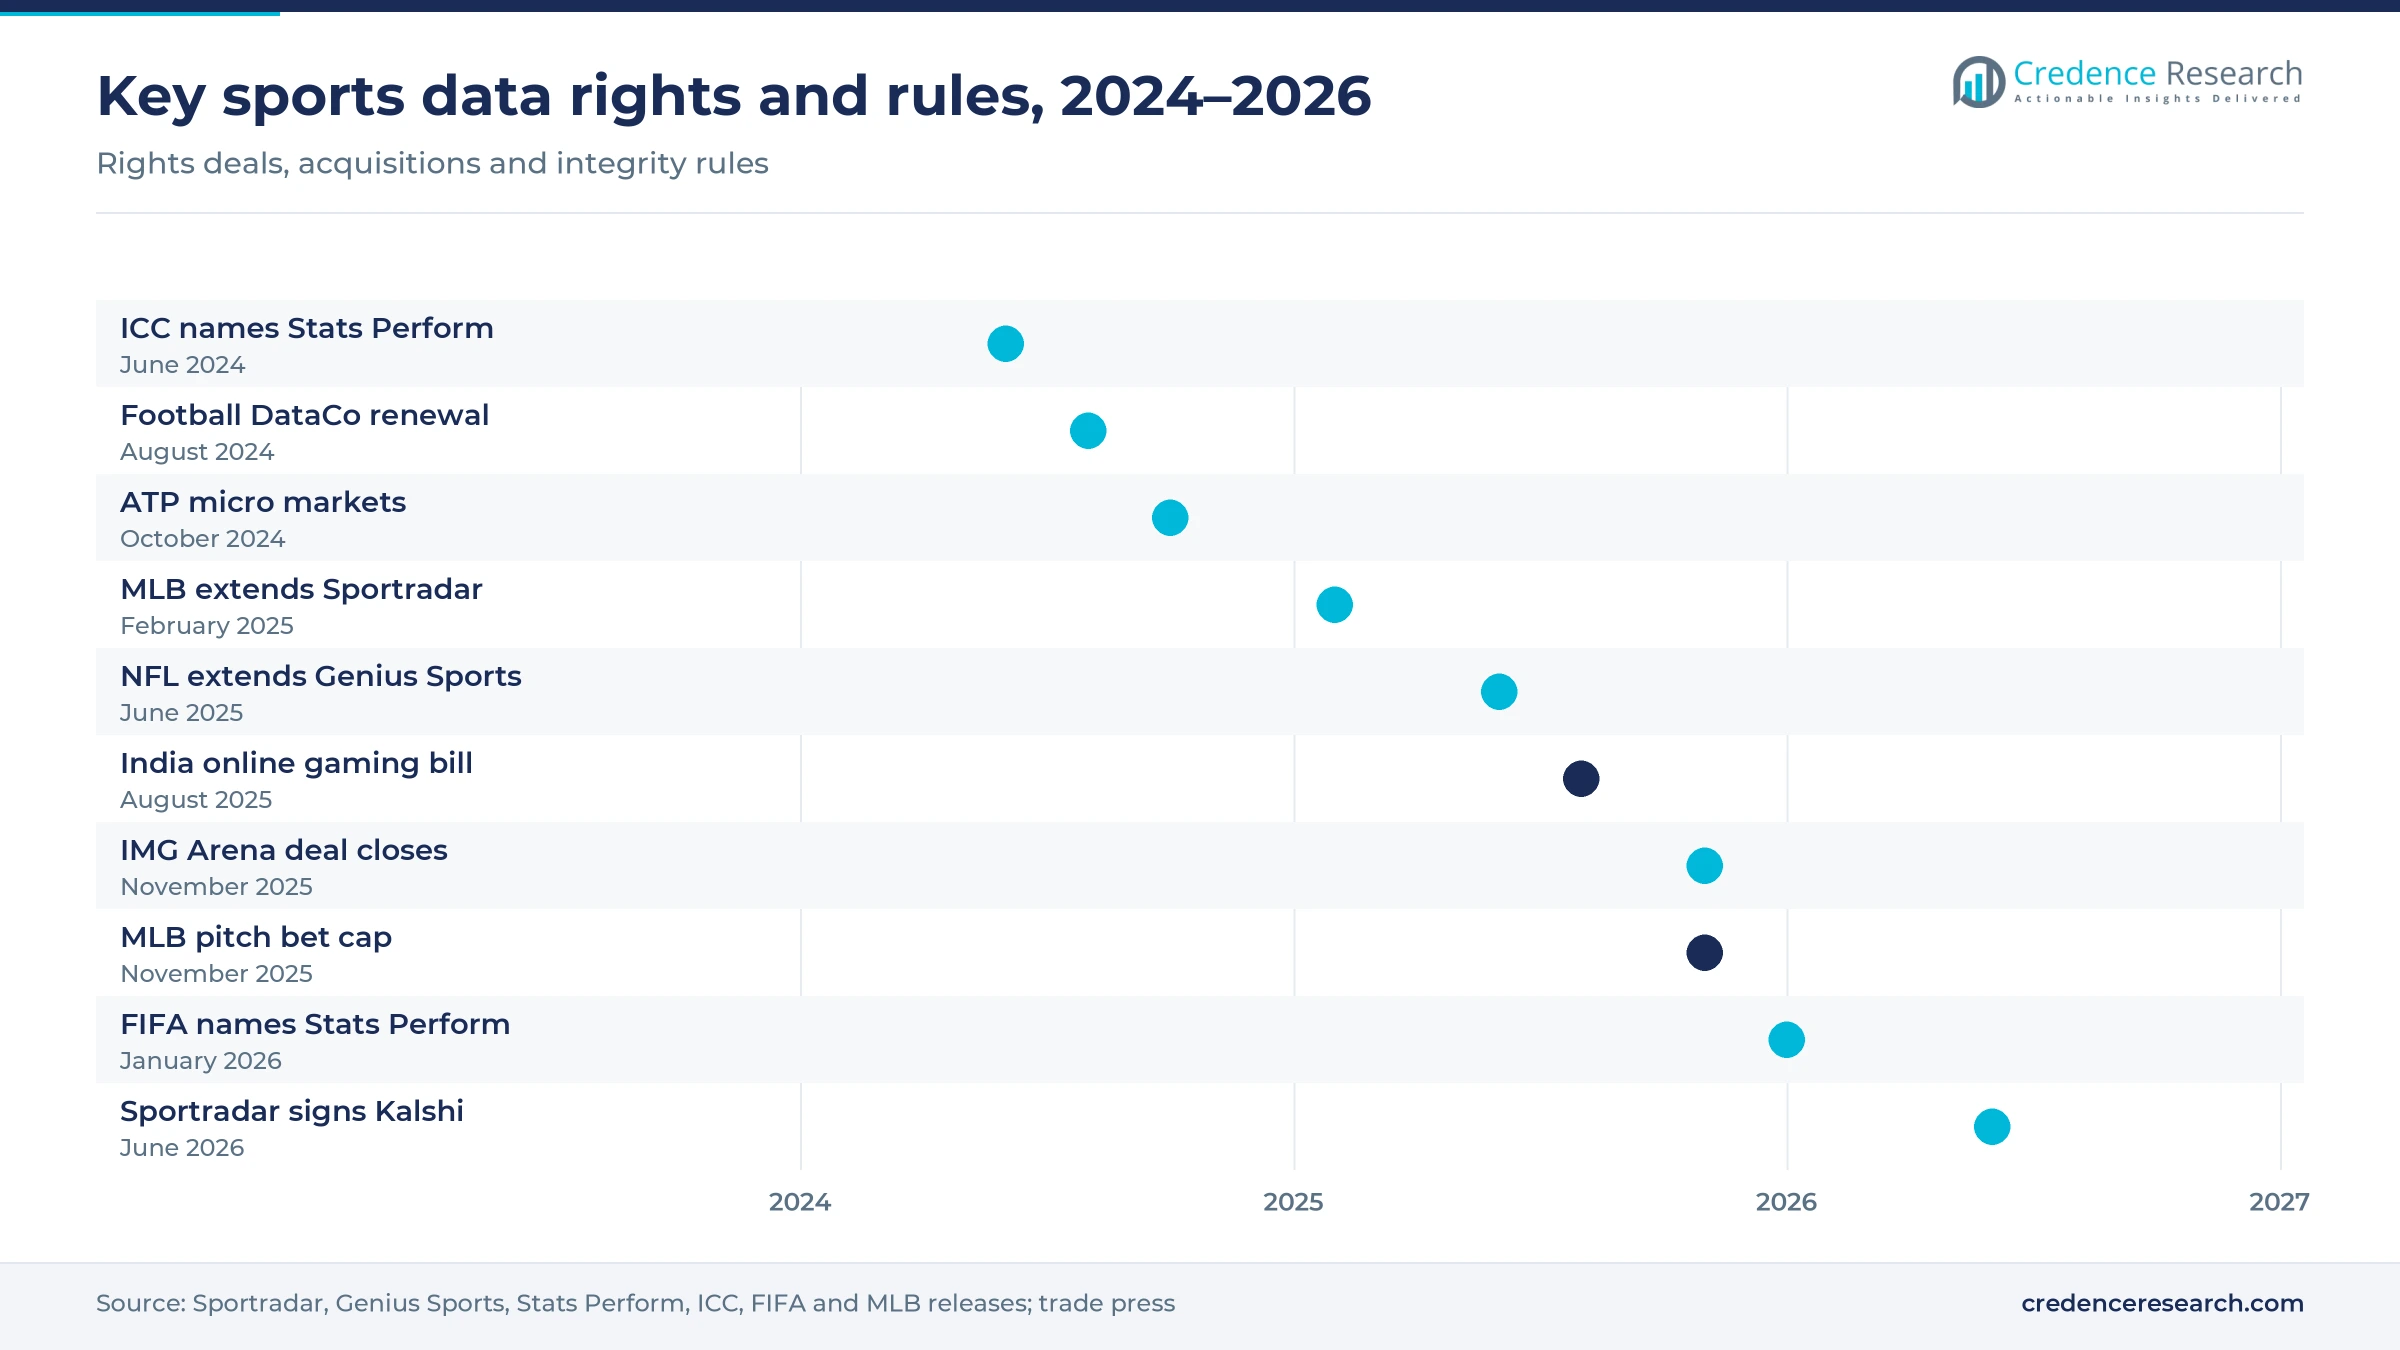
- Sportradar completed its IMG Arena acquisition in November 2025, adding more than 70 rights holders and about 29,000 streaming events a year.
- Prediction markets became data buyers in 2026, with Sportradar signing Kalshi on June 8 and Genius Sports signing Polymarket on Aug. 4.
Official feeds lead, streaming rights grow fastest
Why do official data feeds lead product value?
Based on product, the market is categorized into official data feeds, odds, streaming rights and integrity. Official Data Feeds led with 48.0% of 2025 value because sportsbooks need a verified live feed to price and settle every in-play market. Genius Sports delivers Premier League, EFL and SPFL data from stadium to sportsbook in under one second across more than 4,000 games a season, according to its Aug. 5, 2024 release. Streaming Rights grows fastest at 9.97% a year as live video moves inside betting apps. IMG Arena brought about 29,000 streaming events a year to Sportradar when that acquisition closed in November 2025.
Why does football lead sport value?
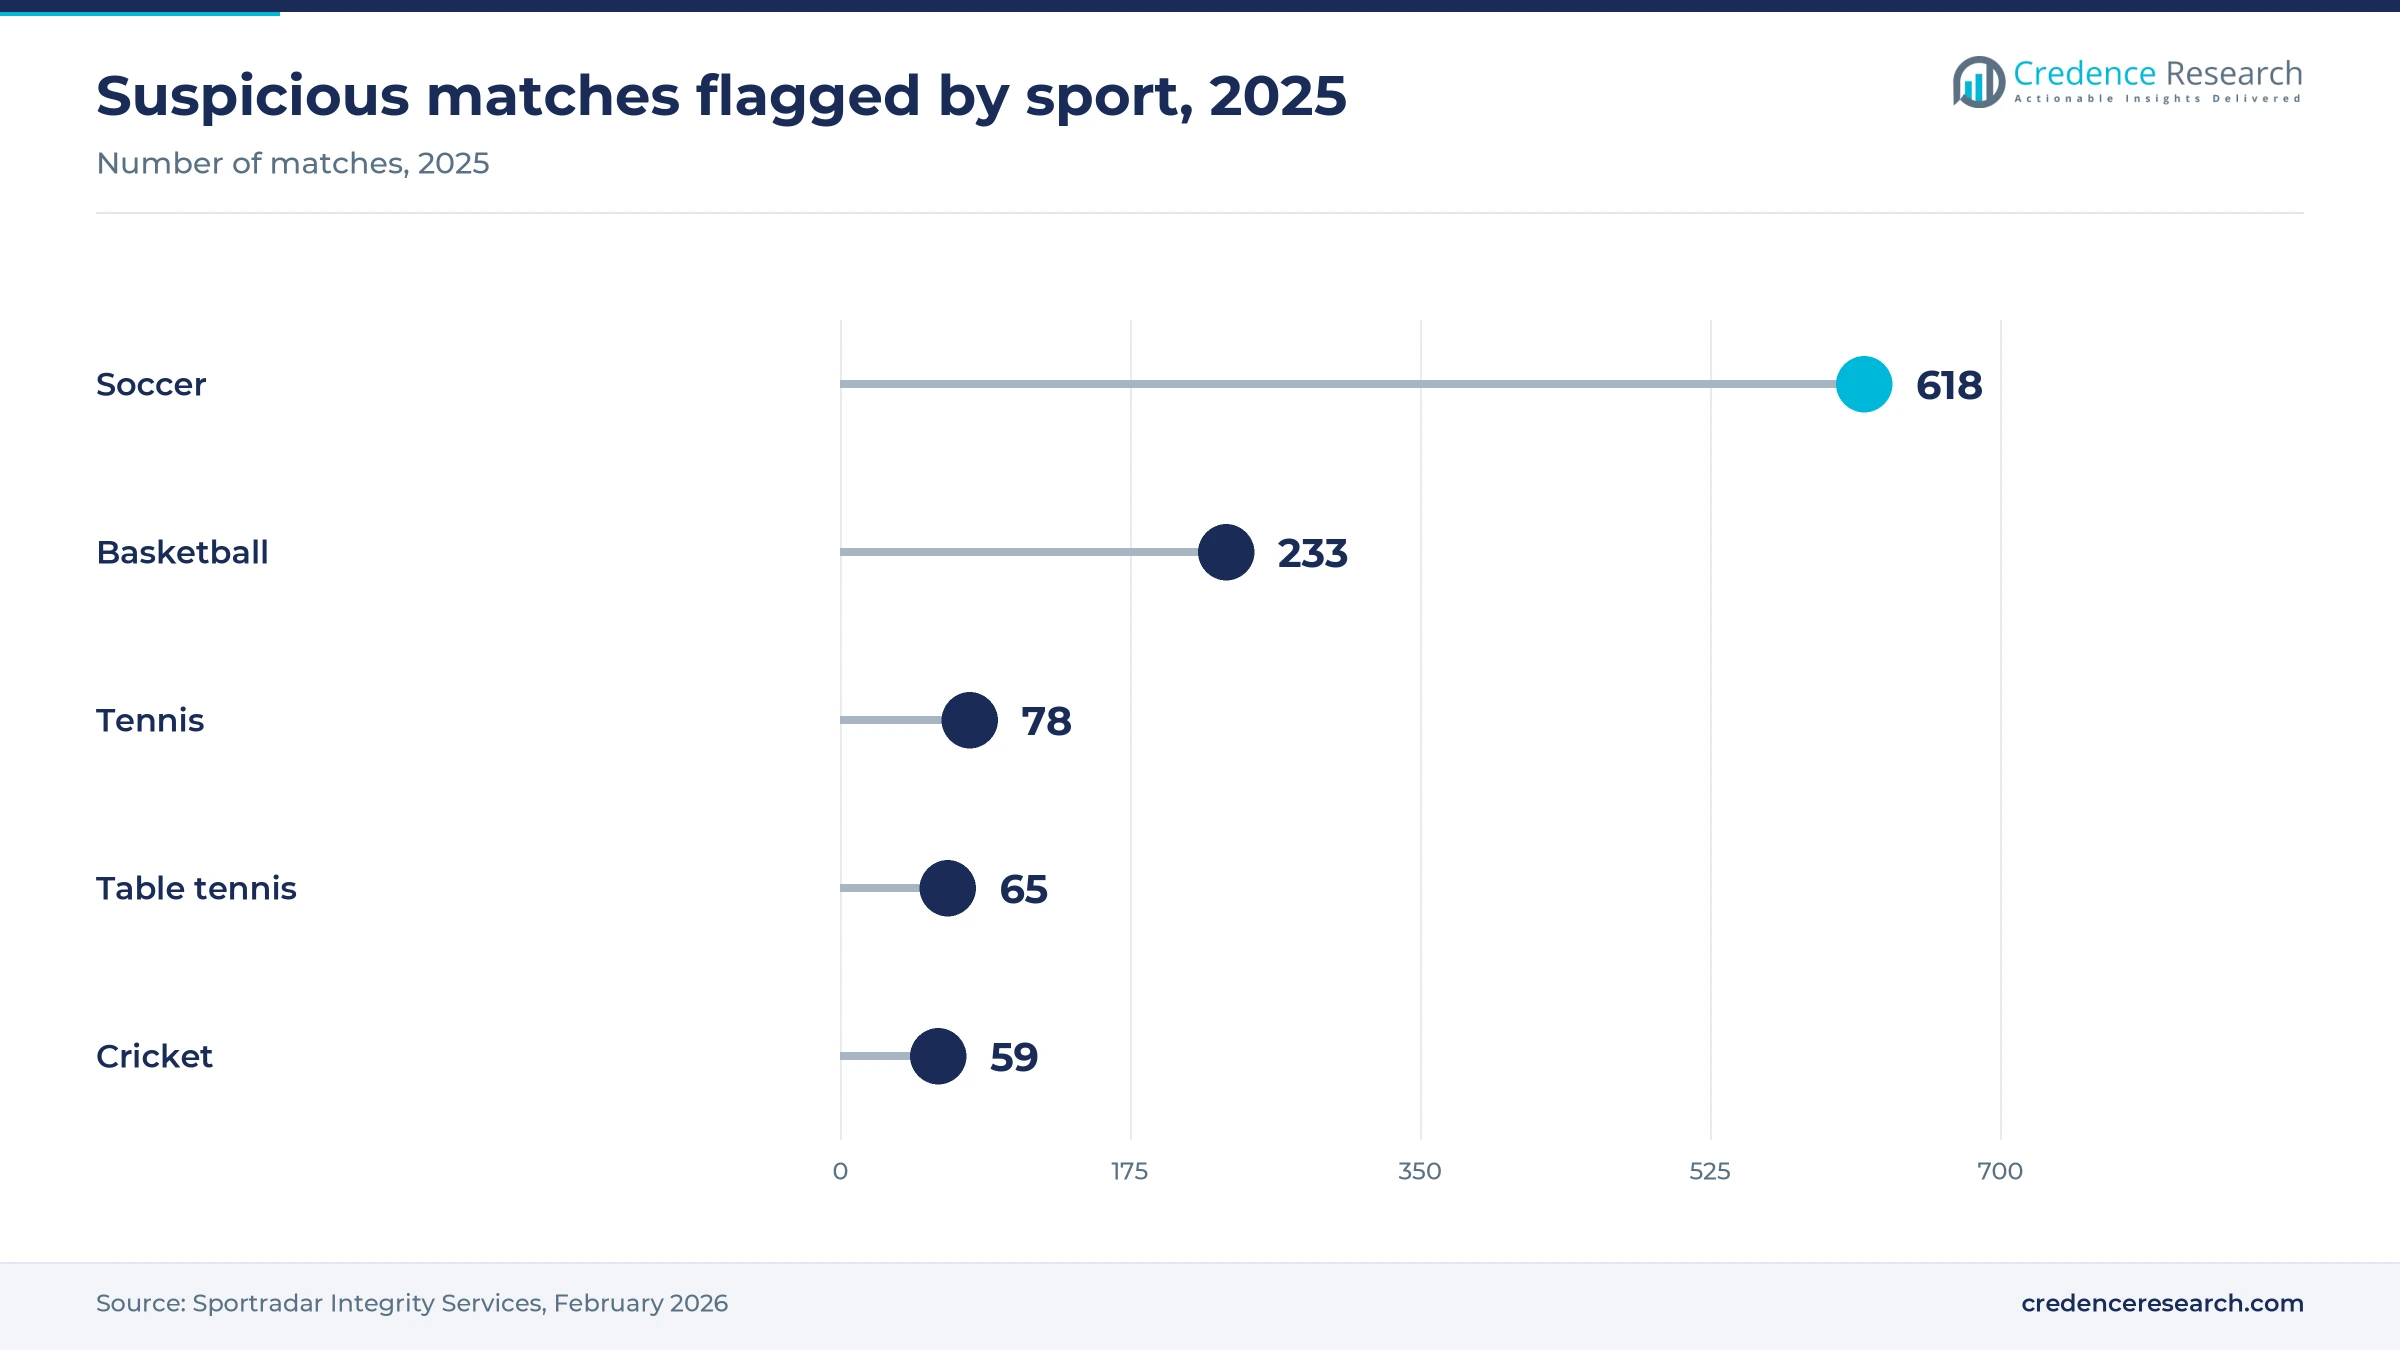
Based on sport, the market is categorized into football, U.S. sports, tennis and cricket. Football led with 46.0% of 2025 value because it has the largest global fixture list and the widest betting audience. Stats Perform streams nearly 20,000 professional football matches a year across 80 competitions, according to its Sept. 9, 2025 EstrelaBet announcement, and soccer accounted for 618 of the 1,116 suspicious matches Sportradar flagged in 2025. U.S. Sports grow fastest at 9.65% a year as leagues sign long exclusive deals. MLB extended Sportradar as exclusive distributor of its official data and audiovisual content through 2032 on Feb. 7, 2025.
Why do sportsbooks lead buyer value?
Based on buyer, the market is categorized into sportsbooks and media. Sportsbooks led with 82.0% of 2025 value because licensed operators pay for data, odds and streams in every regulated market they enter. Brazil alone had 79 licensed betting companies serving 25.2 million bettors in 2025, according to the Secretariat of Prizes and Bets in January 2026. Media buyers grow fastest at 9.90% a year as broadcasters add live statistics and odds to their coverage. Genius Sports powered the EA Sports Madden NFL Cast on Peacock on Thanksgiving night in 2025, an alternate broadcast built on official league data.
| Segment Group | Leading Sub-segment | Share, 2025 | Fastest-growing Sub-segment | CAGR, 2026–2035 |
|---|---|---|---|---|
| By Product | Official Data Feeds | 48.0% | Streaming Rights | 9.97% |
| By Sport | Football | 46.0% | U.S. Sports | 9.65% |
| By Buyer | Sportsbooks | 82.0% | Media | 9.90% |
Request a Free Sample
Fill in your details and we'll send you a free sample report.
- Sample data tables & charts
- Research methodology
Latency, in-play volume and integrity deals lift spend
Sportsbooks demand low-latency official player data
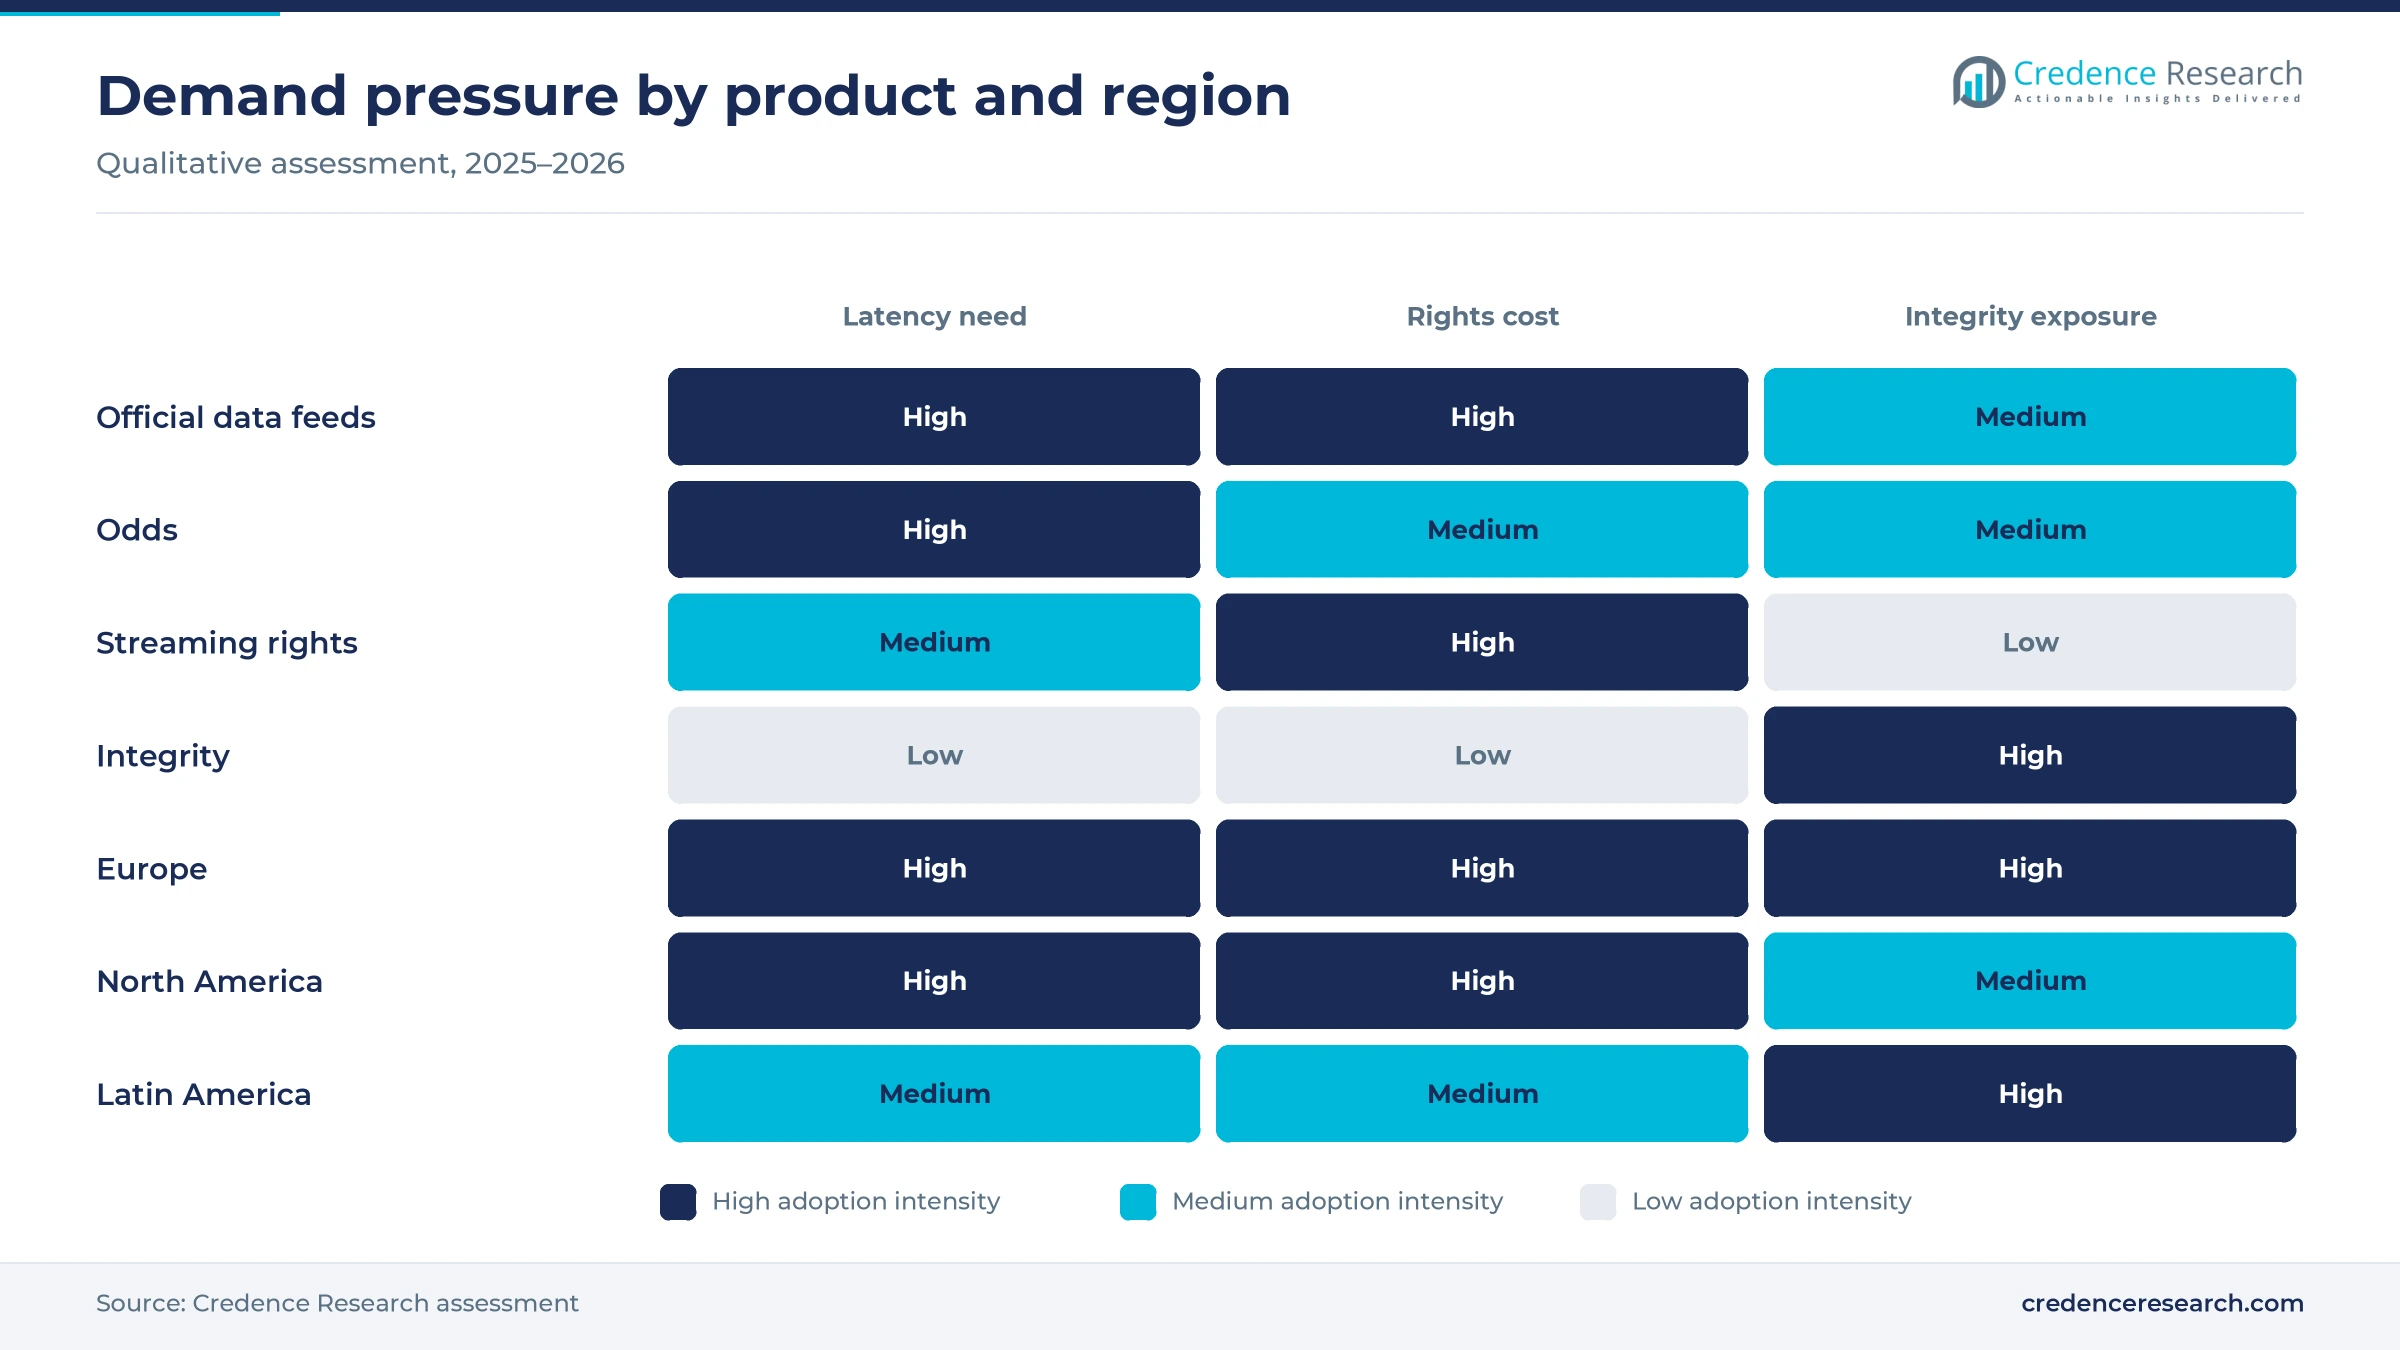
Sportsbooks are paying more for official, low-latency event and player data because every in-play price depends on knowing what happened first. Genius Sports said its Football DataCo renewal of Aug. 5, 2024 moves official data from stadium to sportsbook in under one second and adds exclusive player market data for bet builders from the 2025-26 season. MLB then named Sportradar the exclusive distributor of its ultra-low latency official data through 2032 on Feb. 7, 2025, reaching about 800 sportsbook clients. The NFL also extended Genius Sports as the exclusive distributor of its official data on June 11, 2025. In the Credence Research model this adds about 3.51 percentage points to annual growth to 2035.
In-play betting lifts real-time data consumption
In-play betting raises data consumption because each live match creates hundreds of short-lived markets that need a continuous feed. Optimove Insights found that 52% of U.S. sports wagers in 2024 were placed live and in-game, according to SBC Americas. Sportradar's ATP micro markets, launched in October 2024, add about 1,500 betting opportunities per tennis match, and the company planned similar markets for American football, baseball, basketball and ice hockey in 2025. U.S. commercial sports betting revenue also rose 22.6% to $16.9 billion in 2025, according to the American Gaming Association. In the Credence Research model this adds about 2.43 percentage points to annual growth to 2035.
Integrity monitoring and data licensing widen contracts
Integrity monitoring and data licensing are widening enterprise contracts because leagues and operators now buy detection services together with official data. Sportradar monitored more than 1,000,000 events across 70 sports in 2025, and suspicious matches flagged through its UFDS AI rose 56% year on year. The MLB extension of February 2025 also keeps Sportradar's Universal Fraud Detection System monitoring global betting on baseball. Stats Perform's FIFA agreement of January 2026 likewise adds integrity support for FIFA's integrity unit alongside data and streams. In the Credence Research model this adds about 1.62 percentage points to annual growth to 2035.
Newly regulated markets add licensed data buyers
Newly regulated markets are adding licensed buyers that must source data and streams from authorized suppliers. Brazil's regulated market produced BRL 37 billion in gross gaming revenue in 2025 from 79 licensed companies, according to the Secretariat of Prizes and Bets. In the UAE, Play971, the first platform licensed by the General Commercial Gaming Regulatory Authority, went live on Dec. 15, 2025 with Champions League, Premier League and cricket markets. South Africa's National Gambling Board also reported gross gambling revenue of R74.50 billion for the year to March 2025, up 25.6%, with betting at 69.8% of the total. As a result, Latin America is the fastest-growing region in the sports data for betting market.
Video products and prediction markets reshape supply
Shift from text feeds to streaming inside the bet slip
Suppliers are shifting from text feeds to video products that combine live streams, statistics and bet slips in one player. Genius Sports launched BetVision for Soccer on May 1, 2025 with a Touch-to-Bet feature across more than 120 competitions. It then extended BetVision to tennis with Infront on Jan. 22, 2026, covering the Australian Open and ITF events. Sportradar's IMG Arena acquisition, completed in November 2025, added about 38,000 official data events and 29,000 streaming events across 14 sports. This shift supports Streaming Rights, which grows at 9.97% a year, because operators pay more for streams that keep customers betting during the match.
Rise of prediction markets as official data buyers
Prediction markets are emerging as a new class of buyer for official data, odds and integrity services in the United States. Sportradar signed a multi-year global agreement with Kalshi on June 8, 2026, supplying official data, live odds and UFDS AI integrity services, with MLB, NHL, MLS and UFC among the covered rights. Genius Sports then signed Polymarket on Aug. 4, 2026 and Kalshi on Aug. 5, 2026, supplying official soccer data used to settle contracts, including Premier League and Serie A. Kalshi also joined Genius Sports' information-sharing processes, which restrict certain market types to guard against manipulation. As a result, suppliers now sell the same official feed to sportsbooks and event-contract platforms.
Global football tournaments open new rights packages
Global football tournaments are an opening because several federations are selling betting data and streaming rights as packages for the first time. FIFA named Stats Perform its first official betting data and betting streaming distributor in January 2026, covering all 104 matches of the 2026 World Cup and the 2027 Women's World Cup in Brazil. The agreement also includes thousands of FIFA+ member association matches each season. In Brazil, EstrelaBet signed for Opta stats markets and live streams on Sept. 9, 2025, with markets settled for more than 11,000 games a year. These packages widen the content that operators can sell around Football, which held 46.0% of 2025 value.
Cricket rights offer an opening in Asia and the Gulf
Cricket rights are an opening because the sport draws large betting audiences in South Asia, the Gulf and the U.K. The ICC named Stats Perform on June 5, 2024 to collect and distribute official ball-by-ball data and low-latency streams for all major men's and women's ICC events until 2027. Play971 in the UAE listed cricket among its first licensed markets in December 2025. Sportradar also flagged 59 suspicious cricket matches in 2025, which adds demand for integrity services from cricket boards. These rights support Asia Pacific, which held 13.0% of 2025 value and grows at 9.61% a year.
Integrity scandals, bans and illegal sites limit growth
Pitch-rigging case tightens micro-market limits
Integrity scandals are tightening limits on the fastest live markets that consume the most data. On Nov. 10, 2025, MLB and sportsbooks representing more than 98% of the U.S. market capped bets on individual pitches at $200 and removed them from parlays. The move followed the Nov. 9, 2025 indictment of Cleveland Guardians pitchers Emmanuel Clase and Luis Ortiz. As a result, suppliers of pitch-level feeds face lower stake volumes and must add monitoring to keep these markets open.
Rising suspicious alerts raise compliance costs
Rising suspicious betting alerts are raising compliance costs for suppliers and operators. The International Betting Integrity Association received 300 alerts in 2025, up 29% from 232 in 2024, with football at 110 and tennis at 74. Courtsiders also try to beat official feeds, and Wimbledon used undercover spotters for the first time in July 2025. Suppliers therefore spend more on in-venue scouts and betting monitoring to protect the value of official feeds.
India real-money gaming ban narrows Asian demand
India's ban on real-money online gaming narrows demand in a large cricket audience. Parliament passed the Promotion and Regulation of Online Gaming Bill 2025 in August 2025, prohibiting online money games, including paid fantasy contests, with jail terms of up to three years. As a result, data suppliers cannot sell to licensed domestic operators in India, and cricket rights revenue depends more on U.K., Gulf and other markets.
Illegal operators undercut licensed data buyers
Illegal operators undercut licensed sportsbooks that pay for official data, odds and streams. Brazil's Secretariat of Prizes and Bets and Anatel blocked more than 25,000 illegal betting addresses between October 2024 and December 2025, according to Teletime in January 2026. Unlicensed sites often use scraped scores and copied odds, which lowers the number of paying customers. Suppliers respond with watermarking, takedown work and integrity alerts shared with regulators.
Europe leads as Latin America grows fastest
| Region | Value, 2025 (USD billion) | Share, 2025 | CAGR, 2026–2035 |
|---|---|---|---|
| Europe | 0.92 | 42.0% | 8.31% |
| North America | 0.77 | 35.0% | 9.21% |
| Asia Pacific | 0.29 | 13.0% | 9.61% |
| Latin America | 0.13 | 6.0% | 10.41% |
| Middle East & Africa | 0.09 | 4.0% | 9.91% |
Europe leads on football rights and mature regulation
Europe held 42.0% of 2025 sports data for betting value and grows at 8.31% a year to 2035. The region leads because its football leagues sell exclusive betting data rights, and Genius Sports holds Premier League, EFL and SPFL data through the 2028-29 season. Gross gambling yield in Great Britain reached £16.8 billion in the year to March 2025, up 7.3%, according to the Gambling Commission. Europe also produced 35% of IBIA's 2025 alerts, which keeps integrity spending high.
North America grows on league deals and live betting
North America held 35.0% of 2025 sports data for betting value and grows at 9.21% a year. U.S. commercial sports betting revenue rose 22.6% to $16.9 billion in 2025, according to the American Gaming Association, which also counted igaming legal in seven states for operators that run online gambling products. The NFL renewed Genius Sports in June 2025 and MLB renewed Sportradar in February 2025, which secures official feeds.
Asia Pacific grows on cricket and tennis rights
Asia Pacific held 13.0% of 2025 sports data for betting value and grows at 9.61% a year. Stats Perform distributes official ICC data and streams until 2027, and Genius Sports offers BetVision streams from the Australian Open after its January 2026 Infront deal. However, India's August 2025 ban on real-money online gaming removes a large domestic market, so regional demand depends on Australia and other licensed markets.
Latin America is the fastest-growing region
Latin America held 6.0% of 2025 value and grows fastest at 10.41% a year. Brazil's licensed market produced BRL 37 billion in gross gaming revenue in 2025 from 79 companies and 25.2 million bettors, according to the Secretariat of Prizes and Bets. Stats Perform signed EstrelaBet in September 2025 for Opta stats markets and live football streams, which shows licensed operators buying premium feeds.
Middle East & Africa opens with new licensed sportsbooks
Middle East & Africa held 4.0% of 2025 value and grows at 9.91% a year. The UAE's first licensed sportsbook, Play971, went live on Dec. 15, 2025 under the General Commercial Gaming Regulatory Authority. In South Africa, gross gambling revenue reached R74.50 billion in the year to March 2025, with betting at 69.8% of the total, according to the National Gambling Board.
League renewals and acquisitions marked 2025 and 2026
| Development | Status and market relevance |
|---|---|
| In February 2025, MLB and Sportradar extended their exclusive data and audiovisual partnership through 2032, with MLB taking an equity stake. | Signed; secures ultra-low latency baseball data |
| In June 2025, the NFL extended Genius Sports as exclusive distributor of its official data to sportsbooks. | Signed; keeps NFL feeds with one supplier |
| In November 2025, Sportradar completed its acquisition of IMG Arena and its portfolio of more than 70 rights holders. | Completed; adds about 38,000 data and 29,000 streaming events |
| In January 2026, FIFA named Stats Perform its first official betting data and betting streaming distributor. | Signed; covers all 104 matches of the 2026 World Cup |
| In June 2026, Sportradar and Kalshi signed a multi-year global data and integrity agreement for prediction markets. | Live; opens a new buyer group |
Tracking, low-latency delivery and AI shape the feeds
- In-venue data capture uses trained scouts and computer vision, and Genius Sports tracks all 44 Premier League and EFL Championship teams, data that also feeds performance analytics for clubs.
- Low-latency delivery moves events from stadium to sportsbook in under one second, which narrows the gap that courtsiders try to exploit.
- Automated odds models price micro markets such as next pitch or next point, and Sportradar adds about 1,500 opportunities per ATP match.
- AI integrity monitoring scans betting patterns across more than 1,000,000 events a year, and Sportradar's UFDS AI raised flagged cases by 56% in 2025.
Need a Custom Version of This Report?
Tailor the scope, geography, or segments to your exact requirements.
- Custom geography or segment scope
- Direct access to our analyst team
Exclusive league rights decide competitive position
Competition in the sports data for betting market centers on exclusive league rights, latency, streaming coverage and integrity services. Sportradar holds MLB rights through 2032 and added more than 70 rights holders with IMG Arena in November 2025, giving it the widest event list. Genius Sports holds NFL and U.K. football rights and differentiates through BetVision video products. Stats Perform competes with Opta statistics, RunningBall data and Bet LiveStreams, and won FIFA and ICC rights. Swish Analytics, an authorized MLB data distributor since 2019, sells predictive products alongside analytics service providers. Suppliers that win rights renewals and add prediction market and media buyers will gain share, because sportsbooks rarely run two official feeds for the same league.
Companies profiled and their roles in this market
| Company | Type | Role in the market |
|---|---|---|
| Sportradar | Data and integrity supplier | MLB exclusive data to 2032, UFDS integrity monitoring and IMG Arena rights |
| Genius Sports | Data and streaming supplier | NFL and Football DataCo official data, BetVision streams for sportsbooks |
| Stats Perform | Data and streaming supplier | Opta and RunningBall data, FIFA and ICC betting data and streaming rights |
| IMG Arena | Rights portfolio, now part of Sportradar | About 38,000 data and 29,000 streaming events across 14 sports |
| Swish Analytics | Predictive data supplier | Authorized MLB data distributor with micro markets for Altenar since October 2024 |
Exclusive rights and integrity will decide share
Credence Research's view is that the sports data for betting market will be decided by who holds exclusive league rights and who can prove integrity, rather than by raw event counts. Sportradar, Genius Sports and Stats Perform renewed or won major rights between 2024 and 2026, which leaves fewer open contracts for smaller suppliers. However, the pitch-rigging case of November 2025 and rising IBIA alerts show that micro markets carry integrity risk. Suppliers that bundle data, video and monitoring and sell to prediction markets will gain share through 2035.
Supplier activity model checked against betting data
The report uses 2025 as the base year and forecasts to 2035. Market values come from the Credence Research model, built from supplier rights announcements, disclosed event volumes, licensed betting revenue published by regulators and industry bodies, and integrity statistics. Product, sport, buyer and regional splits are Credence Research estimates based on league rights locations, regulated betting revenue by region and in-play betting data. Company releases, regulator statements and trade press coverage were used to date events. No interviews or surveys were conducted for this edition of the report.
Live video and new buyers extend growth through 2035
The sports data for betting market is expected to grow from USD 2.40 billion in 2026 to USD 5.21 billion by 2035 as sportsbooks, media groups and prediction markets buy official live data, odds and streams. Official data feeds will remain the largest product after holding 48.0% of 2025 value, while streaming rights gain as video moves into betting apps. Europe will keep the largest share, and Latin America will grow fastest as Brazil's licensed market matures. Integrity scandals, the Indian ban and illegal operators will remain the main limits on growth through 2035.
Frequently Asked Questions
How big is the sports data for betting market?
Which product leads the market?
Which region leads the market?
Which region grows fastest?
Which product grows fastest?
Who are the main companies in the market?
How does in-play betting affect demand?
What limits market growth?
Table of Content
Chapter 1 Market Segmentation
- 1.1 Segmentation Framework
- 1.1.1 Product and Service Classification
- 1.1.2 Application and End-Use Classification
- 1.1.3 Technology and Solution Classification
- 1.1.4 Customer and Distribution Channel Classification
- 1.1.5 Geographic Segmentation
- 1.1.6 Market Segment Definitions and Boundaries
- 1.2 By Product
- 1.2.1 Official Data Feeds
- 1.2.2 Odds
- 1.2.3 Streaming Rights
- 1.2.4 Integrity
- 1.3 By Sport
- 1.3.1 Football
- 1.3.2 US Sports
- 1.3.3 Tennis
- 1.3.4 Cricket
- 1.4 By Buyer
- 1.4.1 Sportsbooks
- 1.4.2 Media
Chapter 2 Introduction
- 2.1 Report Objectives and Scope
- 2.2 Product Definition and Industry Terminology
- 2.3 Market Inclusions and Exclusions
- 2.4 Research Process
- 2.4.1 Primary Research and Expert Interviews
- 2.4.2 Secondary Research and Source Review
- 2.4.3 Top-Down and Bottom-Up Estimation
- 2.4.4 Data Triangulation and Verification
- 2.5 Market Size Measurement Basis
- 2.5.1 2025: USD 2.20 billion → 2035: USD 5.21 billion
- 2.6 Historical and Forecast Reference Periods
- 2.6.1 Historical Period: 2018-2025
- 2.6.2 Base Year: 2025
- 2.6.3 Forecast Period: 2025-2035
- 2.7 Research Assumptions and Limitations
Chapter 3 Executive Summary
- 3.1 Market Snapshot and Key Findings
- 3.2 Base-Year Market Size, 2025
- 3.3 Forecast Market Size, 2035
- 3.4 Revenue and Volume Growth Outlook
- 3.5 Key Demand and Supply Indicators
- 3.6 Leading Market Segments
- 3.7 Fastest-Growing Market Opportunities
- 3.8 Regional Performance Highlights
- 3.9 Technology and Industry Transformation
- 3.10 Competitive Landscape Summary
- 3.11 Analyst View and Strategic Implications
Chapter 4 Global Sports Data for Betting Market Trends and Developments
- 4.1 Historical Industry Development, 2018-2025
- 4.2 Recent Market Trends and Developments
- 4.3 Demand and Customer Behavior Trends
- 4.4 Technology and Product Innovation
- 4.5 Artificial Intelligence, Automation and Digitalization
- 4.6 Local Manufacturing and Supply Chain Realignment
- 4.7 Industry Partnerships, Mergers and Acquisitions
- 4.8 Sustainability and Circular Economy Developments
- 4.9 Government and Private Sector Investment Trends
- 4.10 Emerging Business Models and Commercialization
- 4.11 Industry Developments and Announcements
Chapter 5 Global Sports Data for Betting Market Production, Supply and Demand Analysis
- 5.1 Demand Trend and Consumption Analysis, 2018-2025
- 5.2 Demand Forecast, 2025-2035
- 5.3 Production and Output Trend, 2018-2025
- 5.4 Production and Output Forecast, 2025-2035
- 5.5 Installed Capacity and Capacity Utilization
- 5.6 Company-Wise Production Plants and Statistics
- 5.6.1 Installed Production Capacity
- 5.6.2 Actual Production
- 5.6.3 Planned Capacity and Expansion Targets
- 5.7 Supply Chain Structure and Procurement Trends
- 5.8 Supply-Demand Gap and Bottlenecks
- 5.9 Import Dependence and Sourcing Structure
- 5.10 Contract Manufacturing and Outsourcing
- 5.11 Regional Supply and Demand Concentration
Chapter 6 Global Sports Data for Betting Market Pricing Analysis
- 6.1 Pricing Structure and Measurement
- 6.2 Historical Pricing Trends, 2018-2025
- 6.3 Pricing Outlook, 2025-2035
- 6.4 Average Selling Price and Unit Economics
- 6.5 Pricing by Product and Market Segment
- 6.6 Geographic Pricing Differences
- 6.7 Key Input, Energy, Labor and Logistics Costs
- 6.8 Contract Pricing and Purchasing Models
- 6.9 Pricing Sensitivity and Competitive Positioning
- 6.10 Price, Margin and Profitability Implications
Chapter 7 Global Sports Data for Betting Market Dynamics
- 7.1 Market Growth Drivers
- 7.1.1 Demand-Side Drivers
- 7.1.2 Technology and Innovation Drivers
- 7.1.3 Infrastructure and Investment Drivers
- 7.1.4 Regulatory and Policy Drivers
- 7.2 Market Restraints
- 7.2.1 Cost and Affordability Constraints
- 7.2.2 Technology and Adoption Barriers
- 7.2.3 Supply Chain and Operational Constraints
- 7.3 Market Challenges
- 7.3.1 Competitive Pressure and Margin Erosion
- 7.3.2 Skills, Infrastructure and Implementation Gaps
- 7.4 Emerging Market Opportunities
- 7.5 Market Dynamics Impact and Time-Horizon Assessment
Chapter 8 Global Sports Data for Betting Value Chain Analysis
- 8.1 Industry Value Chain Overview
- 8.2 Upstream Suppliers and Critical Inputs
- 8.3 Technology and Component Providers
- 8.4 Manufacturing or Service Delivery
- 8.5 Distribution, Channel Partners and Integrators
- 8.6 Downstream Applications and End Users
- 8.7 Value Addition and Profit Pools
- 8.8 Vertical Integration and Outsourcing
- 8.9 Supplier Concentration and Risk
- 8.10 Supply Chain Localization and Resilience
Chapter 9 Global Sports Data for Betting Market Regulations and Policies
- 9.1 Relevant Laws, Standards and Compliance Frameworks
- 9.2 Product, Service, Safety and Quality Requirements
- 9.3 Government Policies, Incentives and Subsidies
- 9.4 Imports, Exports and Trade Barriers
- 9.5 Public Procurement and Local Content Requirements
- 9.6 Environmental and Sustainability Compliance
- 9.7 Data Protection, AI and Cybersecurity Compliance
- 9.8 Upcoming Policy Changes and Market Implications
Chapter 10 Global Sports Data for Betting Market Hotspots and Opportunities
- 10.1 Market Opportunity Mapping and Growth Hotspots
- 10.2 High-Growth Applications and Customer Groups
- 10.3 Underserved Markets and White-Space Opportunities
- 10.4 Emerging Technology and Product Opportunities
- 10.5 New Capacity and Investment Hotspots
- 10.6 Market Entry and Expansion Opportunities
- 10.7 Distribution and Partnership Opportunities
- 10.8 Near-Term and Long-Term Commercial Potential
- 10.9 Opportunity Attractiveness and Execution Risks
Chapter 11 Global Sports Data for Betting Market Outlook, 2025-2035
- 11.1 Market Size and Analysis
- 11.1.1 Revenue (Market Measurement: 2025: USD 2.20 billion → 2035: USD 5.21 billion)
- 11.1.2 Market Volume and Quantity Sold
- 11.1.3 Historical Market Size, 2018-2025
- 11.1.4 Base-Year Market Size, 2025
- 11.2 Market Forecast, 2025-2035
- 11.2.1 Revenue Forecast to 2035
- 11.2.2 Volume Forecast to 2035
- 11.2.3 CAGR and Year-on-Year Growth
- 11.2.4 Incremental Revenue Opportunity
- 11.3 Forecast Assumptions and Scenario Analysis
- 11.3.1 Base-Case Forecast
- 11.3.2 Optimistic and Conservative Scenarios
- 11.3.3 Technology, Pricing and Policy Sensitivities
- 11.4 Market Attractiveness and Growth Outlook
Chapter 12 Global Sports Data for Betting Market Segmentation and Outlook
- 12.1 Segmentation Summary and Market Shares, 2025
- 12.2 Largest and Fastest-Growing Segments
- 12.3 By Product - Market Size and Forecast, 2025-2035
- 12.3.1 Segment Definition and Scope
- 12.3.2 Historical Market Size, 2018-2025
- 12.3.3 Revenue Forecast, 2025-2035
- 12.3.4 Volume Forecast, 2025-2035
- 12.3.5 Base-Year Market Share, 2025
- 12.3.6 Segment CAGR and Growth Drivers
- 12.3.7 Subsegment Market Size and Forecast
- 12.3.7.1 Official Data Feeds
- 12.3.7.2 Odds
- 12.3.7.3 Streaming Rights
- 12.3.7.4 Integrity
- 12.3.8 Subsegment Pricing and Adoption Trends
- 12.3.9 Leading Suppliers and Competition
- 12.3.10 Regional Demand and Opportunities
- 12.4 By Sport - Market Size and Forecast, 2025-2035
- 12.4.1 Segment Definition and Scope
- 12.4.2 Historical Market Size, 2018-2025
- 12.4.3 Revenue Forecast, 2025-2035
- 12.4.4 Volume Forecast, 2025-2035
- 12.4.5 Base-Year Market Share, 2025
- 12.4.6 Segment CAGR and Growth Drivers
- 12.4.7 Subsegment Market Size and Forecast
- 12.4.7.1 Football
- 12.4.7.2 US Sports
- 12.4.7.3 Tennis
- 12.4.7.4 Cricket
- 12.4.8 Subsegment Pricing and Adoption Trends
- 12.4.9 Leading Suppliers and Competition
- 12.4.10 Regional Demand and Opportunities
- 12.5 By Buyer - Market Size and Forecast, 2025-2035
- 12.5.1 Segment Definition and Scope
- 12.5.2 Historical Market Size, 2018-2025
- 12.5.3 Revenue Forecast, 2025-2035
- 12.5.4 Volume Forecast, 2025-2035
- 12.5.5 Base-Year Market Share, 2025
- 12.5.6 Segment CAGR and Growth Drivers
- 12.5.7 Subsegment Market Size and Forecast
- 12.5.7.1 Sportsbooks
- 12.5.7.2 Media
- 12.5.8 Subsegment Pricing and Adoption Trends
- 12.5.9 Leading Suppliers and Competition
- 12.5.10 Regional Demand and Opportunities
- 12.6 Segment Growth Comparison
- 12.7 Segment Attractiveness and Priority Matrix
Chapter 13 Global Sports Data for Betting Geographic Market Outlook, 2025-2035
- 13.1 Regional Market Size and Share, 2025
- 13.2 Regional Market Forecast, 2025-2035
- 13.3 Regional Pricing, Production and Demand Differences
- 13.4 North America
- 13.4.1 United States
- 13.4.2 Canada
- 13.4.3 Mexico
- 13.5 Europe
- 13.5.1 Germany
- 13.5.2 France
- 13.5.3 Italy
- 13.5.4 United Kingdom
- 13.5.5 Spain
- 13.5.6 Poland
- 13.5.7 Russia
- 13.5.8 Netherlands
- 13.5.9 Belgium
- 13.5.10 Sweden
- 13.5.11 Denmark
- 13.5.12 Norway
- 13.5.13 Rest of Europe
- 13.6 Asia Pacific
- 13.6.1 China
- 13.6.2 India
- 13.6.3 Japan
- 13.6.4 South Korea
- 13.6.5 Thailand
- 13.6.6 Indonesia
- 13.6.7 Vietnam
- 13.6.8 Malaysia
- 13.6.9 Australia
- 13.6.10 Rest of Asia Pacific
- 13.7 Latin America
- 13.7.1 Brazil
- 13.7.2 Argentina
- 13.7.3 Colombia
- 13.7.4 Chile
- 13.7.5 Rest of Latin America
- 13.8 Middle East
- 13.8.1 Saudi Arabia
- 13.8.2 United Arab Emirates
- 13.8.3 Turkey
- 13.8.4 Israel
- 13.8.5 Iran
- 13.8.6 Rest of the Middle East
- 13.9 Africa
- 13.9.1 South Africa
- 13.9.2 Egypt
- 13.9.3 Nigeria
- 13.9.4 Morocco
- 13.9.5 Rest of Africa
- 13.10 Regional Investment, Policy and Supply Chain Differences
- 13.11 Regional Competitive Landscape
- 13.12 Geographic Growth Hotspots
Chapter 14 Global Sports Data for Betting Technology, Innovation and Sustainability Outlook
- 14.1 Technology Landscape and Maturity
- 14.2 Product, Process and Service Innovation
- 14.3 AI, Automation and Digital Tools in the Industry
- 14.4 Technology Adoption and Performance Benchmarking
- 14.5 Innovation Pipeline and R&D Investment
- 14.6 Patent and Intellectual Property Trends
- 14.7 Energy Efficiency and Resource Management
- 14.8 Sustainability, Recycling and Circularity
- 14.9 Technology Roadmap, 2025-2035
- 14.10 Risks of Obsolescence and Technology Substitution
Chapter 15 Global Sports Data for Betting Market Key Strategic Imperatives
- 15.1 Growth and Market Entry Priorities
- 15.2 High-Return Products and Segments
- 15.3 Pricing, Profitability and Cost Optimization
- 15.4 Technology Investment and Product Differentiation
- 15.5 Supply Chain Localization and Resilience
- 15.6 Distribution and Customer Acquisition
- 15.7 Partnership, Acquisition and Capacity Strategy
- 15.8 Regional Expansion Priorities
- 15.9 Short-, Medium- and Long-Term Actions
Chapter 16 Competition Outlook
- 16.1 Industry Competition Characteristics
- 16.2 Market Structure and Concentration
- 16.3 Market Share and Competitive Positioning, 2025
- 16.4 Company-Wise Revenue and Product Benchmarking
- 16.5 Production and Service Capacity Benchmarking
- 16.6 Technology, Pricing and Differentiation
- 16.7 Regional Footprint and Distribution Strength
- 16.8 Mergers, Acquisitions and Strategic Alliances
- 16.9 New Entrants and Competitive Threats
- 16.10 Porter's Five Forces and Industry Attractiveness
- 16.11 Competitive Outlook, 2025-2035
Chapter 17 Company Profiles
- 17.1 Company Coverage and Selection Criteria
- 17.2 Sportradar
- 17.2.1 Business Description
- 17.2.2 Company Ownership and Geographic Presence
- 17.2.3 Product and Service Portfolio
- 17.2.4 Manufacturing and Operating Footprint
- 17.2.5 Production Capacity and Expansion Plans
- 17.2.6 Financial Performance and Investment
- 17.2.7 Market Share and Competitive Position
- 17.2.8 Technology and Innovation Capabilities
- 17.2.9 Strategic Alliances or Partnerships
- 17.2.10 Recent Developments
- 17.2.11 Growth Strategy and Outlook
- 17.3 Genius Sports
- 17.4 Stats Perform
- 17.5 IMG Arena
- 17.6 Swish Analytics
- 17.7 Other Relevant Market Participants
Note: Every listed company is profiled on the structure shown under the first company. The company list is preliminary and may change based on research findings, market developments, data availability and client requirements.
Chapter 18 Disclaimer
- 18.1 Research and Forecast Disclaimer
- 18.2 Data Source and Estimation Limitations
Note: The depth of individual sections depends on data availability for this market. Volume, capacity, trade and other unit-based metrics are included where applicable.

