Injections hold volume while implants take the growth
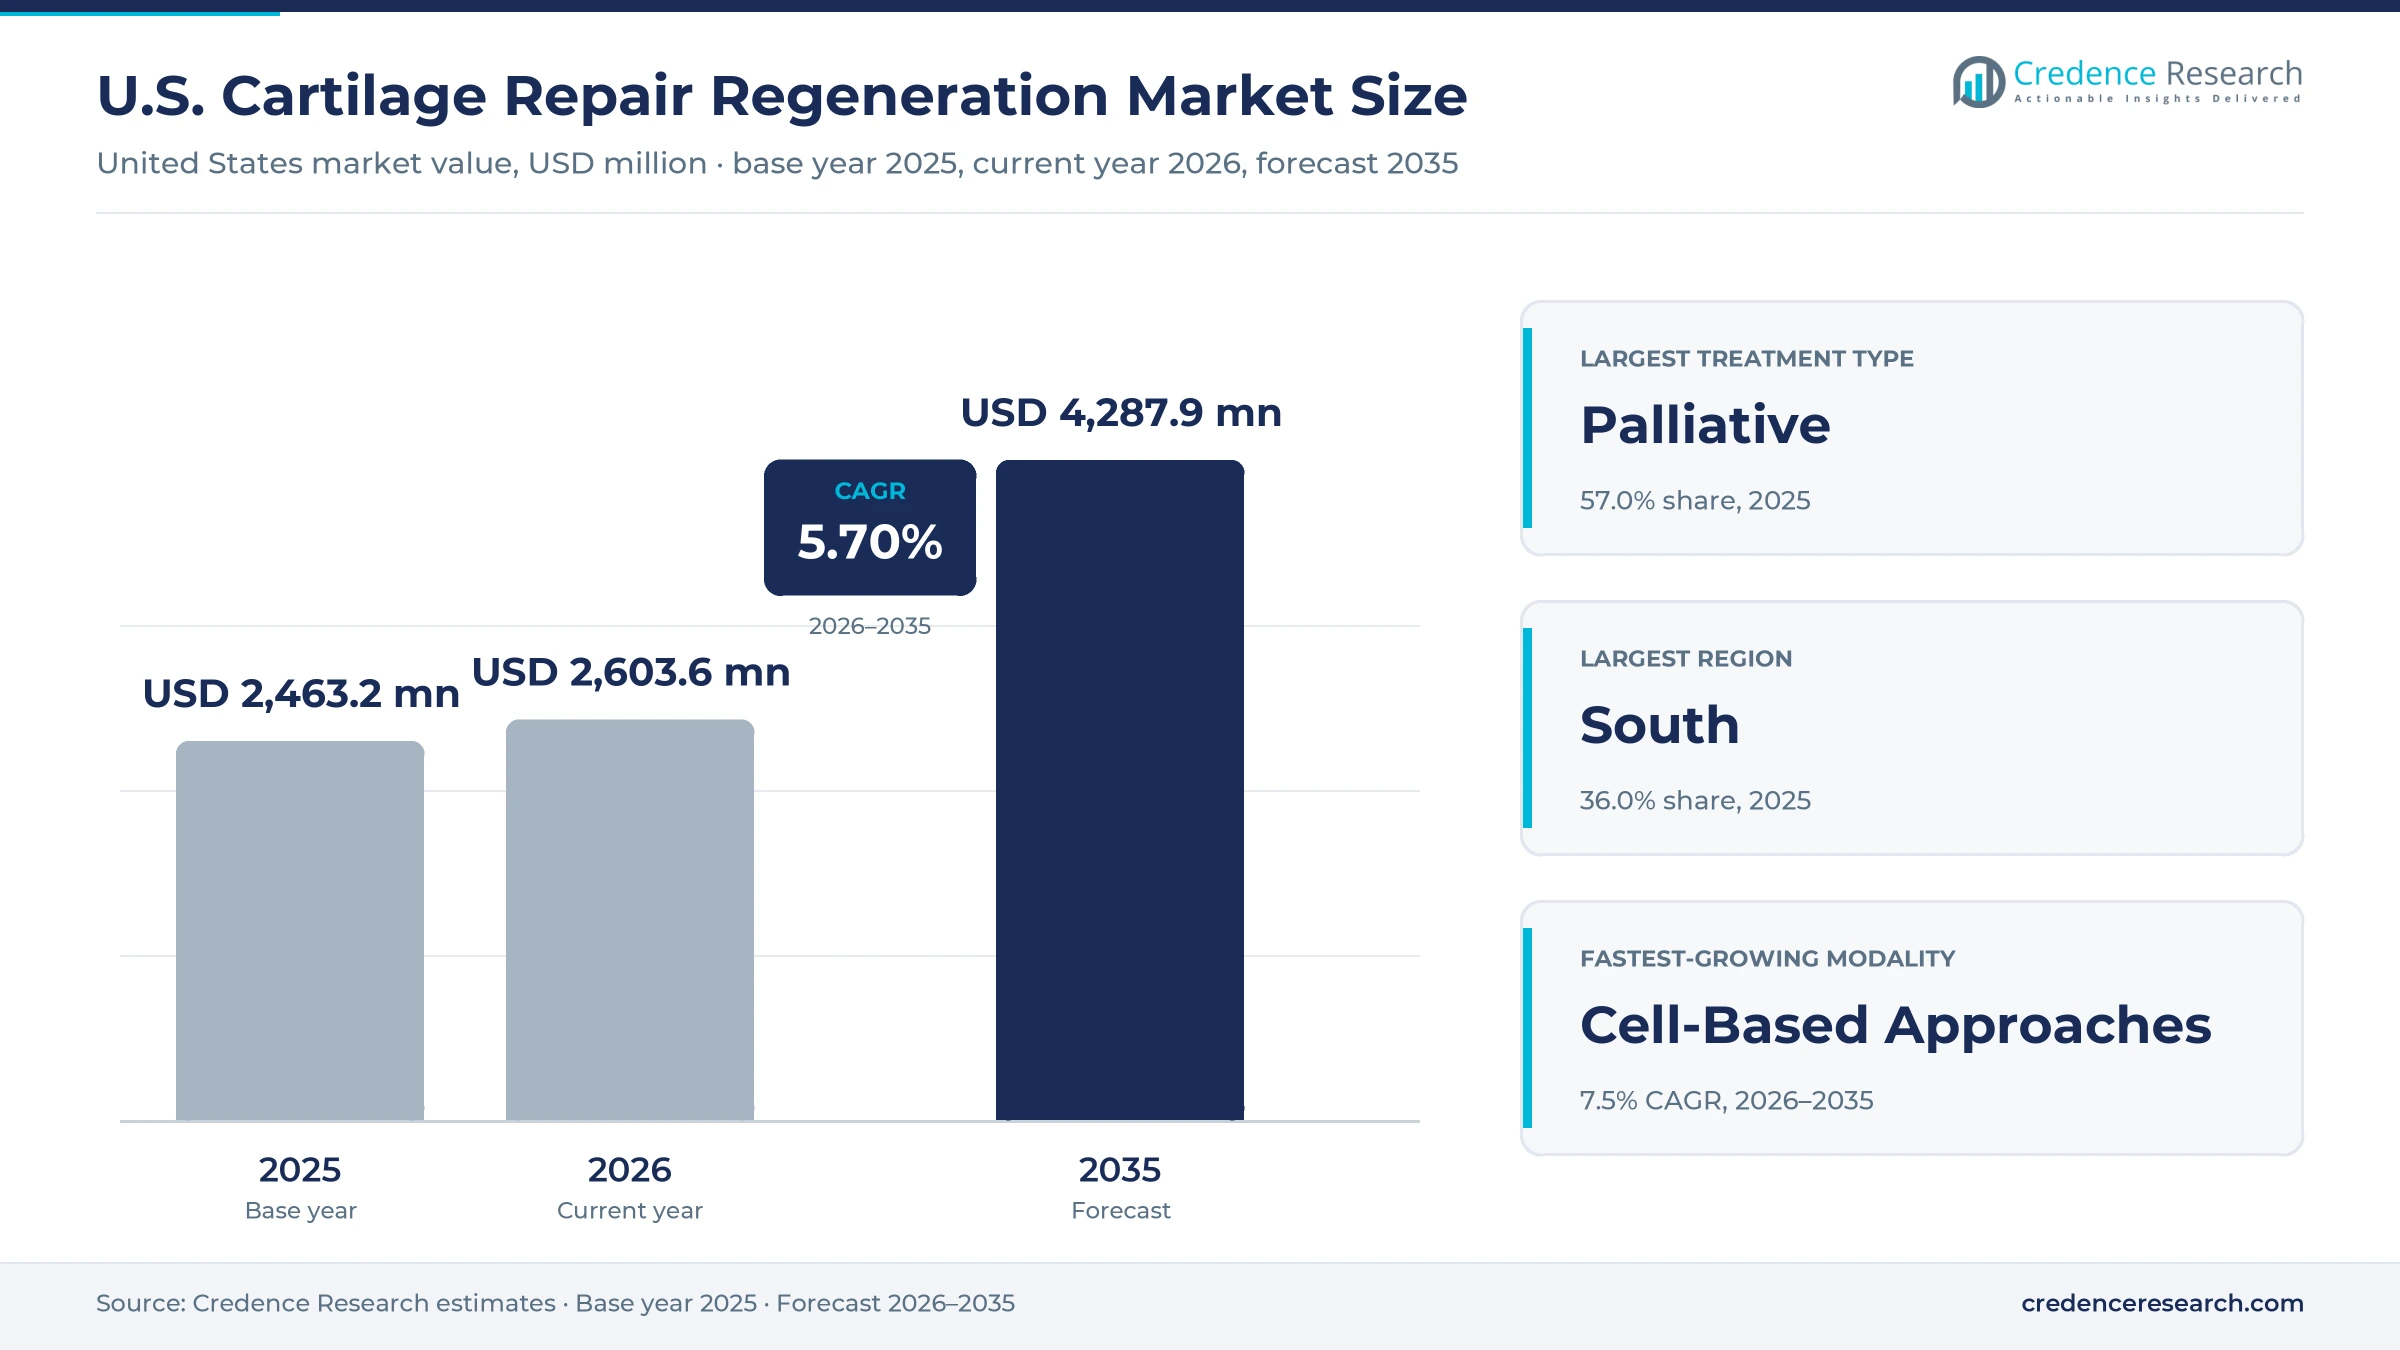
The U.S. cartilage repair regeneration market was valued at USD 2.46 billion in 2025 and is projected to increase from USD 2.60 billion in 2026 to USD 4.29 billion by 2035, registering a CAGR of 5.70% during 2026–2035. Demand comes from orthopedic and sports medicine surgeons who treat focal knee defects, older adults with osteoarthritis who receive hyaluronan injections, and hospitals and surgery centers that buy grafts, scaffolds and arthroscopic disposables. The South held the largest regional share, 36.0% in 2025, because it has the largest and fastest-growing population aged 65 and older, and it is also the fastest-growing region at 6.1% a year. Restorative care is gaining on palliative care, helped by the FDA’s August 2024 approval of arthroscopic delivery for autologous chondrocyte implants and by the aragonite scaffold approved in 2022 for knees with mild to moderate osteoarthritis. A hyaluronan scaffold has been under FDA review since its final filing in October 2025, which could add a third option.
Injections, grafts, scaffolds and cell implants for damaged joints
The estimate covers products used to relieve or restore damaged articular cartilage and fibrocartilage in the United States, including intra-articular hyaluronan injections, debridement and chondroplasty disposables, osteochondral and particulated allografts, extracellular matrix and scaffold implants, and autologous chondrocyte implants. It counts purchases by hospitals, ambulatory surgery centers and orthopedic practices.
The estimate excludes surgeon fees, total knee arthroplasty implants and oral or topical pain drugs. Cell implants and scaffolds move through manufacturers and tissue banks directly to the operating room, while injections are bought by practices and reimbursed under Medicare Part B drug codes, so payer rules shape both channels.
U.S. Cartilage Repair Regeneration Market Insights
- The U.S. cartilage repair regeneration market was valued at USD 2.46 billion in 2025 and is projected to reach USD 4.29 billion by 2035, registering a CAGR of 5.70% during 2026–2035.
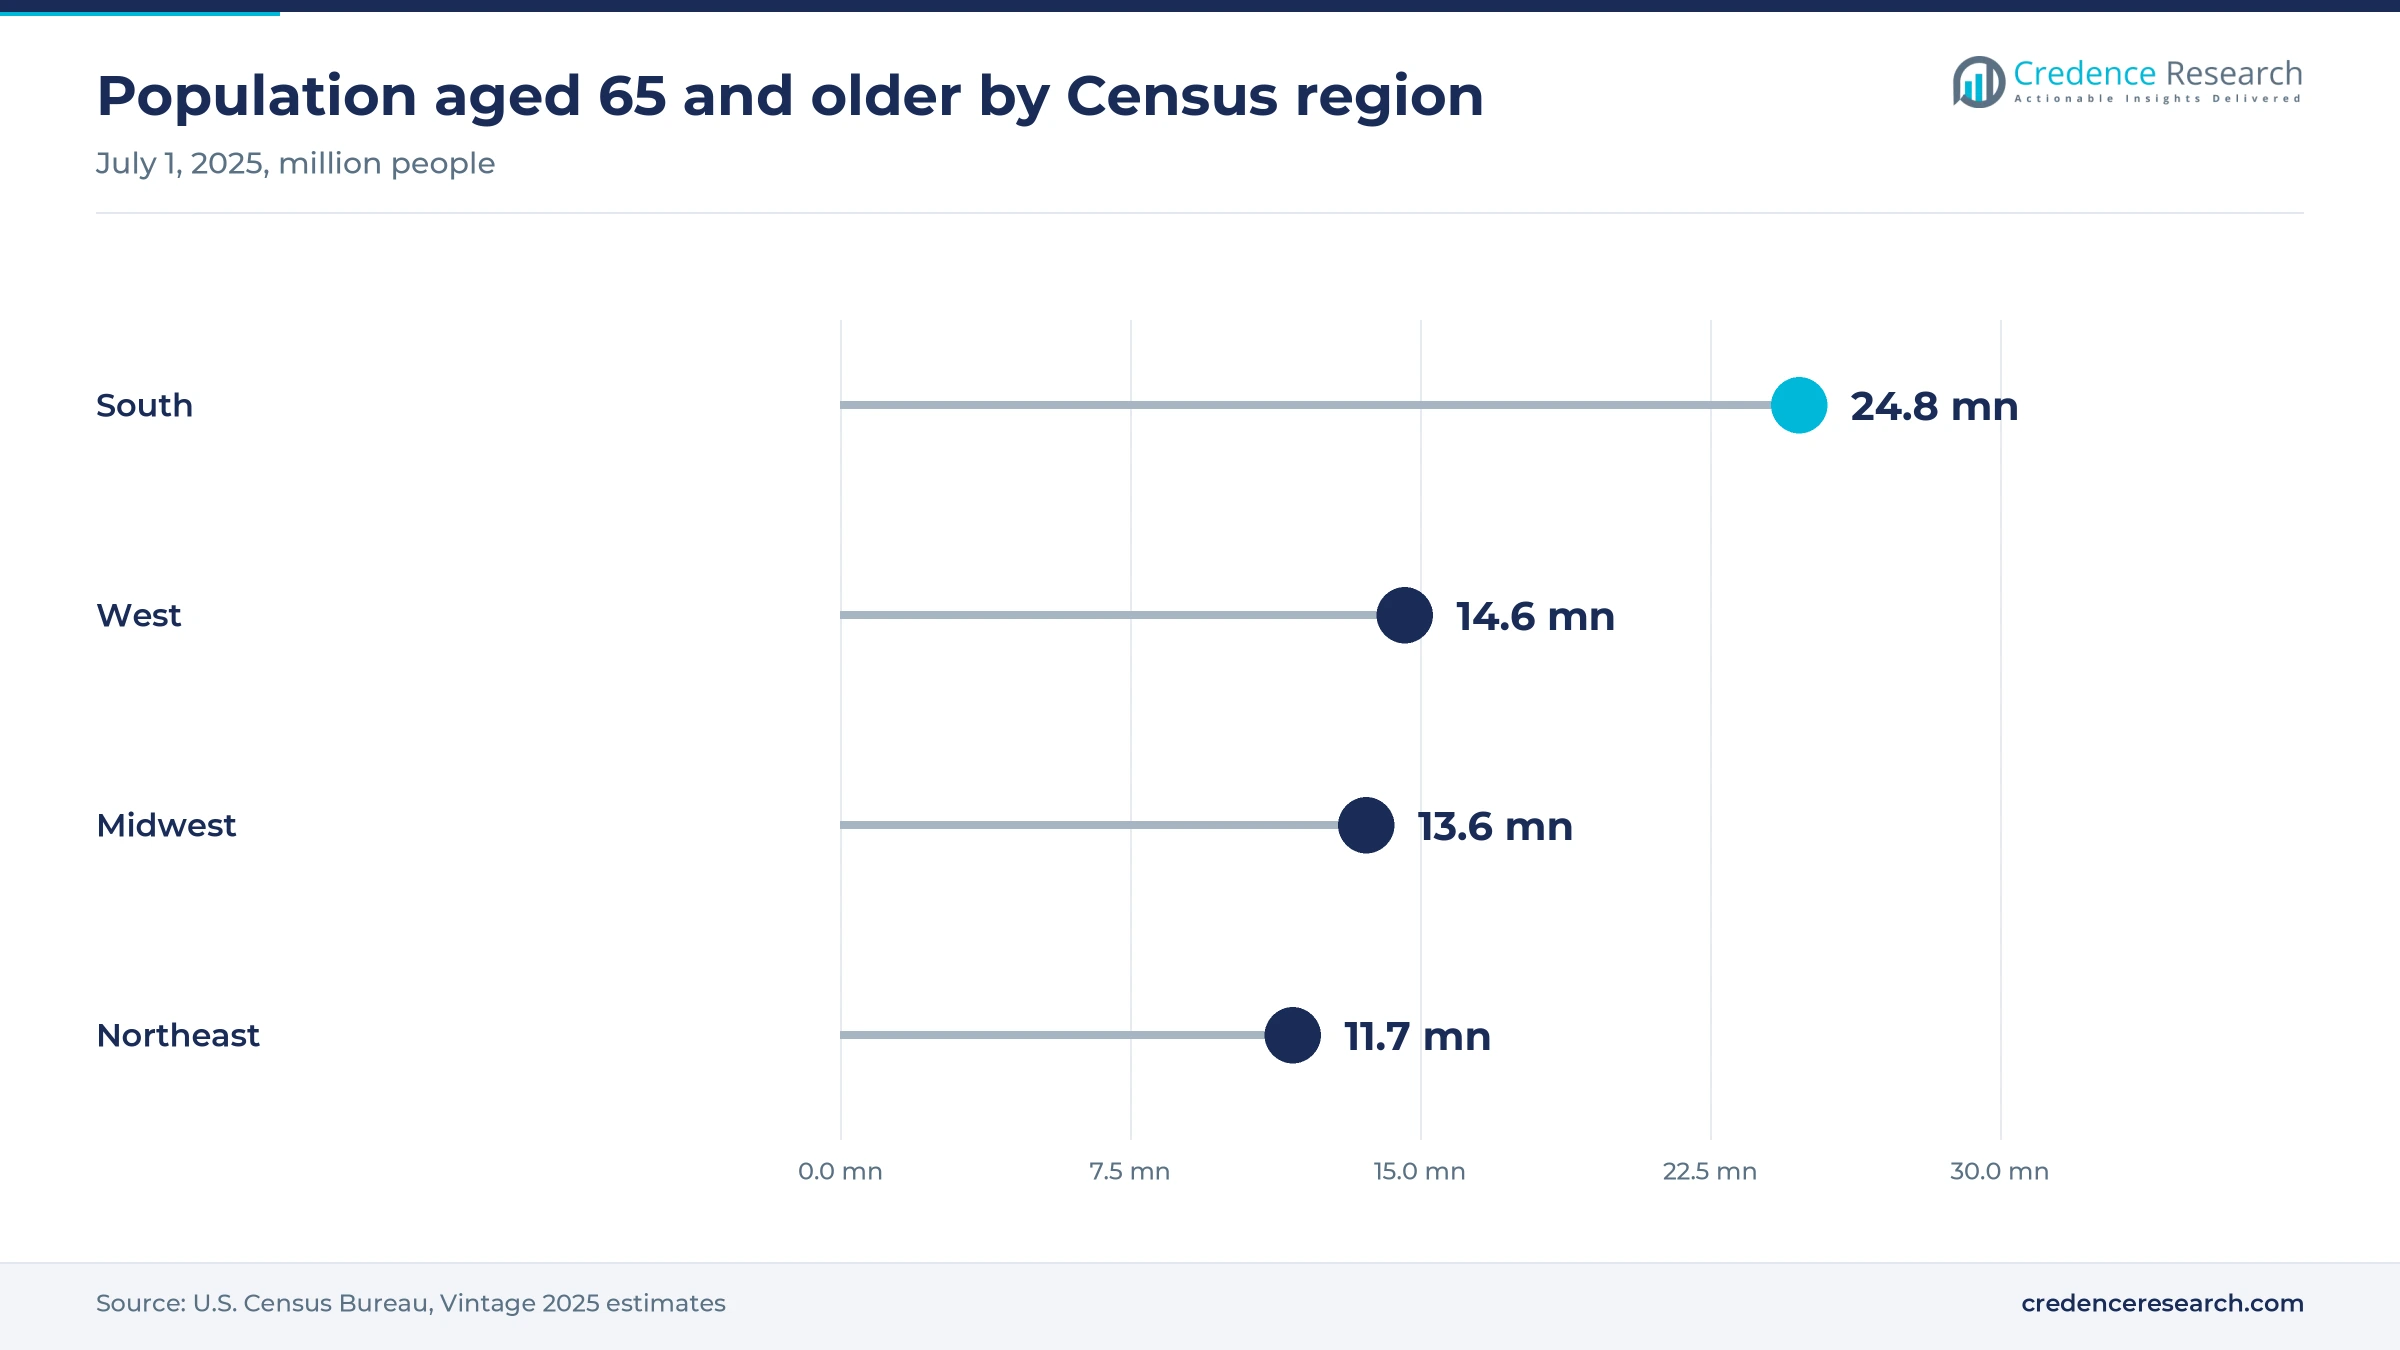
- The South held a 36.0% share of 2025 value, because its population aged 65 and older reached 24.8 million in 2025, the largest of the four regions.
- Palliative treatment led with a 57.0% share of 2025 value, because about 53.2 million U.S. adults have diagnosed arthritis and many receive injections first.
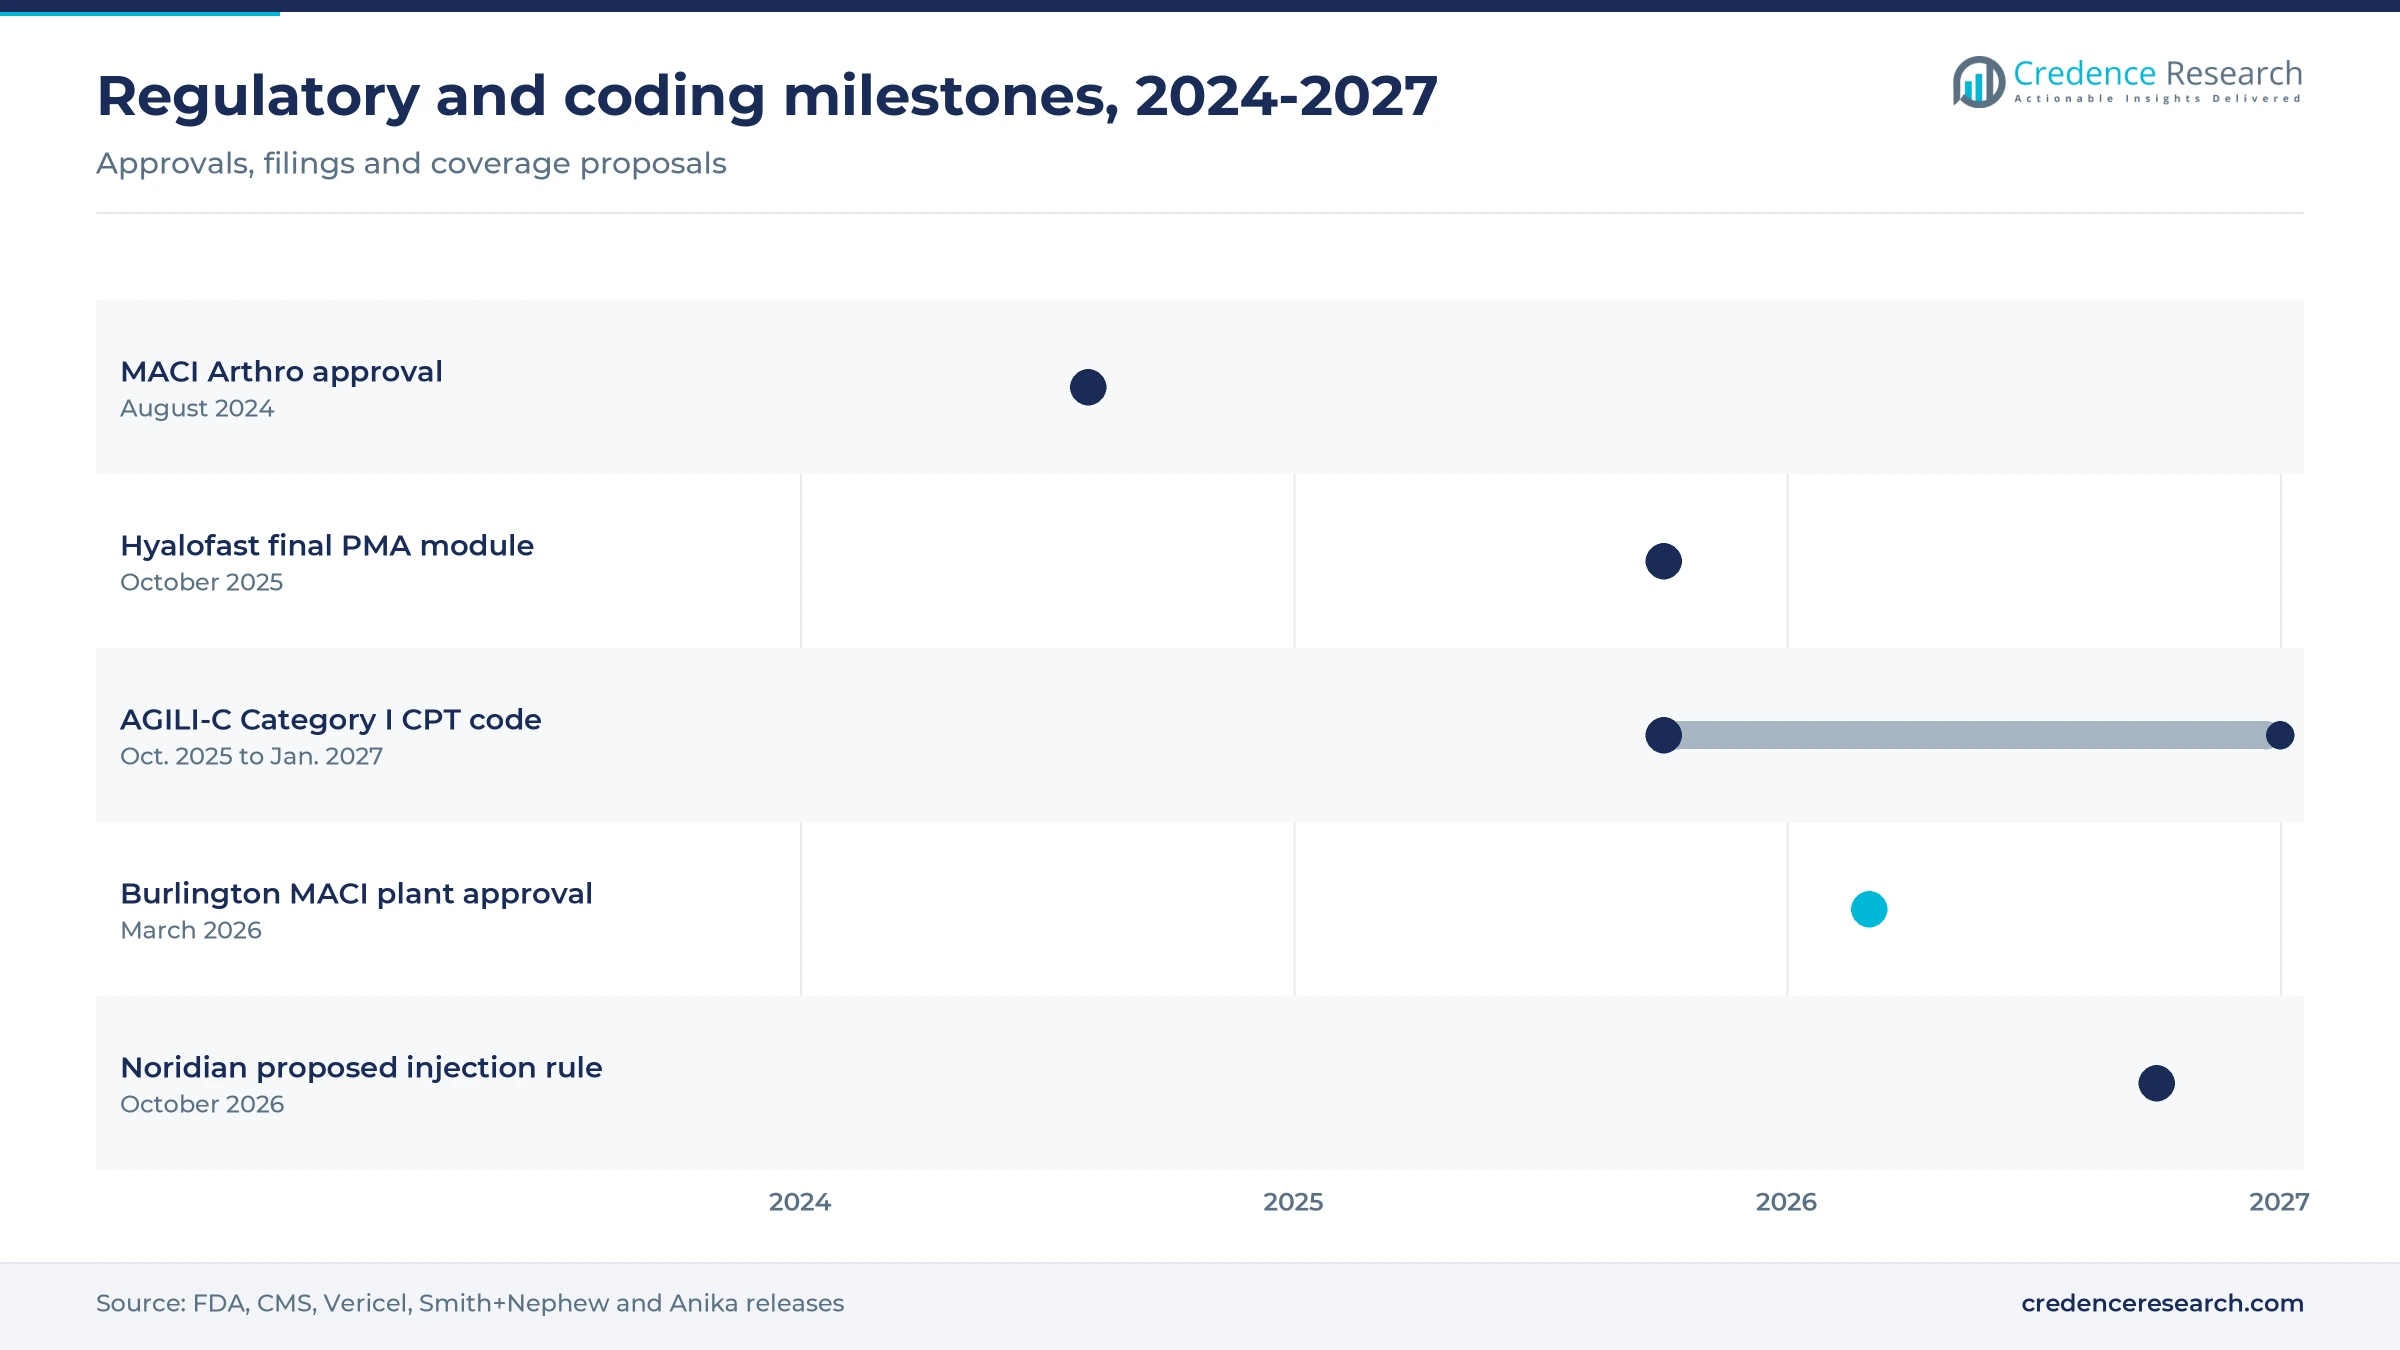
- Smith+Nephew said on Oct. 9, 2025, that a Category I CPT code for its CARTIHEAL AGILI-C implant takes effect on Jan. 1, 2027.
- Cell-based approaches grow fastest at 7.5% a year, as the FDA approved a new MACI manufacturing plant in Burlington, Massachusetts, in March 2026.
Palliative care leads as cell-based implants grow fastest
Non-cell products lead while cell-based implants grow fastest
Based on treatment modality, the market is categorized into non-cell-based approaches and cell-based approaches. Non-Cell-Based Approaches led with 82.0% of 2025 value, because off-the-shelf injections, allografts and scaffolds need one procedure, and the October 2026 CMS payment file lists 14 separate hyaluronan injection codes. Cell-Based Approaches grow fastest at 7.5% a year, as Vericel announced FDA approval on March 4, 2026, of its Burlington, Massachusetts, plant, with commercial MACI production planned from the second quarter of 2026. Growth in autologous cell therapies for joints remains limited by the biopsy, culture and second surgery each patient needs.
Palliative care leads while intrinsic repair grows fastest
Based on treatment type, the market is categorized into palliative and intrinsic repair stimulus treatments. Palliative treatment led with a 57.0% share of 2025 value, because viscosupplementation and debridement are offered to older adults, and the CDC found that 47.3% of adults aged 65 and older had diagnosed arthritis in 2019 to 2021. Intrinsic Repair Stimulus treatments grow fastest at 7.2% a year, as surgeons move from microfracture to grafts that rebuild tissue, and osteochondral allograft use rose 37.7% between 2010 and 2020 in the PearlDiver study discussed below.
Knees lead while ankle use grows fastest
Based on application, the market is categorized into knee, spine, ankle, hip and others. Knee procedures led with a 71.0% share of 2025 value, because both approved restorative products, MACI and AGILI-C, carry knee-only labels and MACI Arthro is indicated for knee defects of up to 4 square centimeters. Ankle applications grow fastest at 6.7% a year, as Vericel has started the MASCOT clinical study of MACI in the ankle. Spine is the most assumption-heavy estimate, because disc cartilage products remain largely investigational.
| Segment Group | Leading Sub-segment | Share, 2025 | Fastest-growing Sub-segment | CAGR, 2026–2035 |
|---|---|---|---|---|
| By Treatment Modality | Non-Cell-Based Approaches | 82.0% | Cell-Based Approaches | 7.5% |
| By Treatment Type | Palliative | 57.0% | Intrinsic Repair Stimulus | 7.2% |
| By Application | Knee | 71.0% | Ankle | 6.7% |
Medicare payment limits set the price floor for injections
Injection prices follow Medicare Part B payment limits, which CMS updates each quarter from reported average sales prices, so a single code change can move a whole product line. Single-injection products such as Monovisc and Gel-One carry the highest payment per visit, while multi-dose courses spread payment over three or more visits. Restorative implants sit on a different scale, because each MACI graft is grown for one patient. Price pressure falls hardest on undifferentiated injections, while implants compete on outcomes and coding.
| Product | Typical price or fee | Basis |
|---|---|---|
| Synvisc-One, single 48 mg injection | USD 288.53 per injection | CMS Part B payment limit, October 2026 |
| Durolane, single 60 mg injection | USD 378.84 per injection | CMS Part B payment limit, October 2026 |
| Gel-One, single injection | USD 524.06 per dose | CMS Part B payment limit, October 2026 |
| Monovisc, single injection | USD 626.14 per dose | CMS Part B payment limit, October 2026 |
| Euflexxa, three-injection course | USD 310.81 per course | CMS Part B payment limit, October 2026 |
| MACI autologous chondrocyte graft | More than USD 50,000 per graft | Orthoworld, December 2025 |
Request a Free Sample
Fill in your details and we'll send you a free sample report.
- Sample data tables & charts
- Research methodology
Arthritis, implant evidence and new coding lift demand
Arthritis in older adults keeps treatment volume high
Cartilage loss is a disease of age and wear, so the size of the older population sets the floor for treatment volume. About 53.2 million adults, or 21.2% of U.S. adults, had diagnosed arthritis in 2019 to 2021, according to the CDC. Prevalence rises steeply with age, and the Census Bureau counted 64.6 million residents aged 65 and older in 2025. These patients usually start with injections and debridement, which is why palliative treatment holds a 57.0% share. Injection makers gain steady volume from this base, while restorative implant makers gain only where defects are focal and the patient is young enough to benefit from rebuilt tissue.
Surgeons are moving away from microfracture
Surgeons are replacing microfracture, the long-time default for focal defects, with grafts and implants that restore hyaline-like tissue. A PearlDiver database study of 220,674 patients, published in the Journal of Cartilage and Joint Preservation in December 2024, found that microfracture fell 62.4% between 2010 and 2020. Osteochondral autograft use fell 53.9% over the same decade, while osteochondral allograft use rose 37.7%. Autologous chondrocyte implantation rose 11.2%, a change the authors did not find statistically significant. This shift moves spending from low-cost awls to allografts, scaffolds and cell implants, which carry far higher value per case. Tissue banks and implant makers gain most from the change.
Arthroscopic cell implants widen the surgeon base
Cell implants once required open knee surgery, which limited them to a small group of specialists. The FDA approved arthroscopic delivery of MACI in August 2024, and Vericel said in its Aug. 26, 2024, approval release that it would expand its target surgeon base from 5,000 to 7,000, including surgeons who perform most cartilage work arthroscopically. About 1,000 surgeons had been trained on MACI Arthro by February 2026, and the fourth quarter of 2025 had the most implanting surgeons since launch, according to Vericel’s SEC filing. A larger trained base turns cell implants from a referral procedure into routine sports medicine care, which supports the fastest growth of any treatment modality in the Credence Research estimate.
Long-term evidence and new coding favor implants
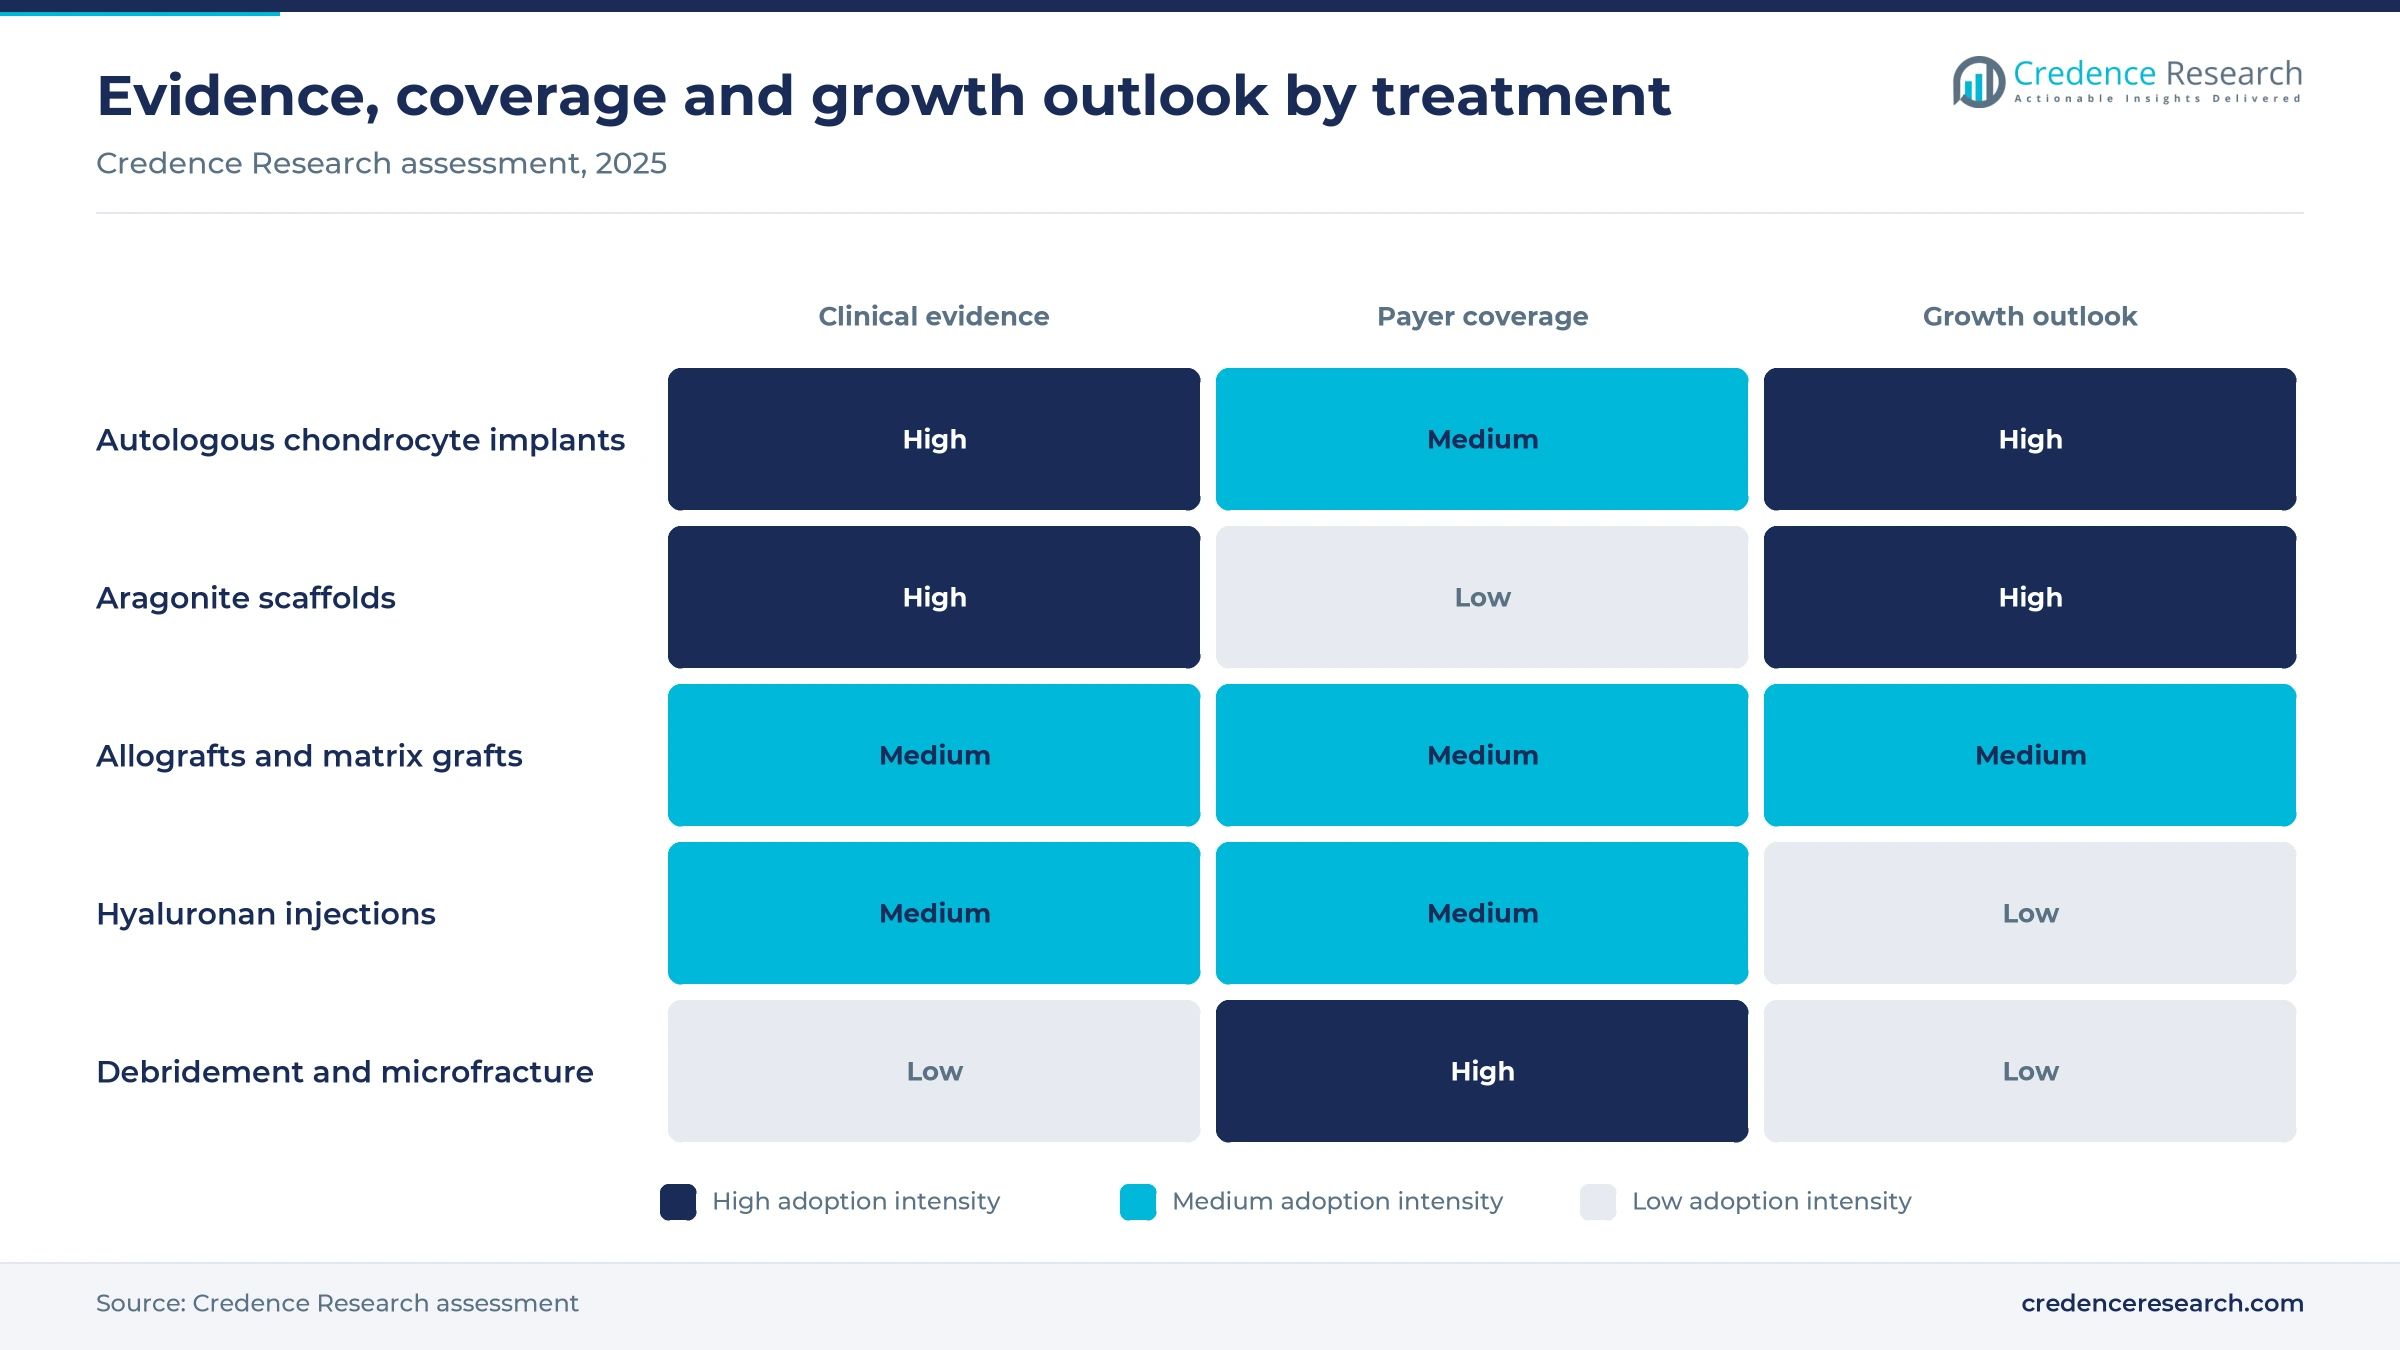
Payers and surgeons adopt restorative implants faster when long-term outcomes and billing are clear. Smith+Nephew reported an 87% reduction in the relative risk of total knee arthroplasty or osteotomy at four years for its AGILI-C implant compared with microfracture or debridement. Five-year data released on April 21, 2026, showed higher KOOS scores at all time points, including in patients with osteoarthritis. The American Medical Association panel created a Category I CPT code for the procedure, effective Jan. 1, 2027, the company said. Delaying knee replacements is the economic case these data make to payers, and coding lowers the billing risk for hospitals and surgery centers.
Single-stage grafts and synthetic implants move forward
Single-stage, off-the-shelf grafts are replacing two-step care
Surgeons are shifting toward single-stage grafts to avoid the biopsy and second surgery that cell implants need, creating openings for allograft and matrix products across knee, hip and ankle defects. Arthrex promotes AutoCart, a single-stage technique that mixes the patient’s own cartilage, collected with its GraftNet device, with BioCartilage extracellular matrix. Zimmer Biomet says its DeNovo NT particulated juvenile cartilage graft has been used since 2007 in the knee, hip, ankle and shoulder. Stryker lists ProChondrix CR as the cartilage repair graft in its biologics range. These grafts fit standard arthroscopy instruments, so surgery centers can add them without new capital. AGILI-C, approved by the FDA in 2022, is also a single-stage implant, Orthoworld noted in December 2025, although payer coverage for tissue grafts still varies by plan.
Synthetic implants are emerging in early clinical testing
Developers are moving toward synthetic implants that need no donor tissue or cell culture, aiming at patients whose defects reach the bone. Sparta Biomedical said in September 2024 that it had treated the first patients with Ormi, a titanium-based implant with a synthetic cartilage surface that holds FDA Breakthrough Device Designation, in a study in Colombia and the Dominican Republic. Hy2Care planned to start a U.S. investigational device trial of its CartRevive injectable hydrogel in 2026, Orthoworld reported in December 2025. NanoChon planned a first-in-human study of its 3D-printed ChondroGraft in Canada, and Askel plans a pivotal study of its COPLA implant after a 20-patient trial. None of these products is approved, so their effect on U.S. sales is unlikely before the 2030s.
Pending scaffold and cell approvals open a mid-decade window
Several late-stage products could give surgeons new options for patients whose microfracture fails, the group most exposed to repeat surgery. Anika filed the final module of its Hyalofast premarket approval application on Oct. 31, 2025, according to Anika, and the application remains under FDA review. Octane Medical finished enrolling 233 patients in its NOVOCART 3D trial at the end of 2023, while Geistlich expected results from a 234-patient Chondro-Gide trial at the end of 2026. Ocugen received FDA agreement in 2025 on a single confirmatory Phase 3 trial for NeoCart, which holds RMAT designation. Each approval would add a competitor to the two approved restorative products and lower the price premium surgeons face.
Ankle and hip defects open a second restorative market
Ankle and hip defects are an underserved opening, because both approved restorative products carry knee-only labels and surgeons treat other joints with off-label grafts. MACI Arthro, approved in August 2024, covers knee defects of up to 4 square centimeters, so Vericel has started the MASCOT study of MACI for talar cartilage defects, its February 2026 results noted. Arthrex sells a hip delivery system for BioCartilage, and Zimmer Biomet lists the ankle and hip among joints treated with DeNovo NT. Ankle applications grow at 6.7% a year in the Credence Research estimate, the fastest rate of any joint. An ankle label would let Vericel reach foot and ankle specialists beyond its 7,000 target knee surgeons, and young patients would gain an option before fusion or replacement.
Graft costs, mixed trials and injection pricing restrain
High graft costs keep cell implants out of reach for many
Cell implants carry a price that many patients and plans resist, because each graft is grown for one patient. A MACI graft costs more than USD 50,000, which limits patient access, Orthoworld reported in December 2025. Patients with high-deductible plans and smaller regional insurers are most exposed, because prior authorization and appeals can delay surgery by months. Lower-cost allografts and scaffolds win cases when coverage fails, which caps cell-based volume despite strong outcomes.
Mixed pivotal results slow new product approvals
Cartilage trials rely on patient-reported pain and function scores, which vary widely and suffer from dropouts. Anika’s Hyalofast trial missed both co-primary endpoints against microfracture, and KOOS pain favored the control arm by 8.11% in the primary analysis, a difference that was not statistically significant. Regentis put its Gelrin-C pivotal trial on hold after enrolling 47 patients, Orthoworld reported in December 2025. Developers with a single product are most exposed, because delays raise their funding needs before any revenue.
Payer rules and price cuts squeeze injection makers
Hyaluronan injections face tighter coverage and lower prices, which slows the largest palliative product group. Noridian proposed a Medicare coverage rule on Oct. 1, 2026, that would require failed corticosteroid injections and at least six months between series, according to CMS. Anika reported lower U.S. pricing for Monovisc and Orthovisc in its February 2026 results and expects modest further declines. Makers with only injection portfolios are most exposed, while practices may shift patients to self-pay injections.
Narrow labels exclude most arthritic knees
Most of the 53.2 million U.S. adults with diagnosed arthritis noted above fall outside the labels of the approved restorative products, which restricts the addressable pool. MACI Arthro is limited to focal full-thickness knee defects, as noted in the segment analysis, while diffuse osteoarthritis remains a palliative or replacement case. AGILI-C reaches mild to moderate osteoarthritis, but it was approved only in 2022 and its uptake is still early, Orthoworld noted. Implant makers therefore compete for a small pool of patients with focal defects.
The South leads on size and growth as retirees move in
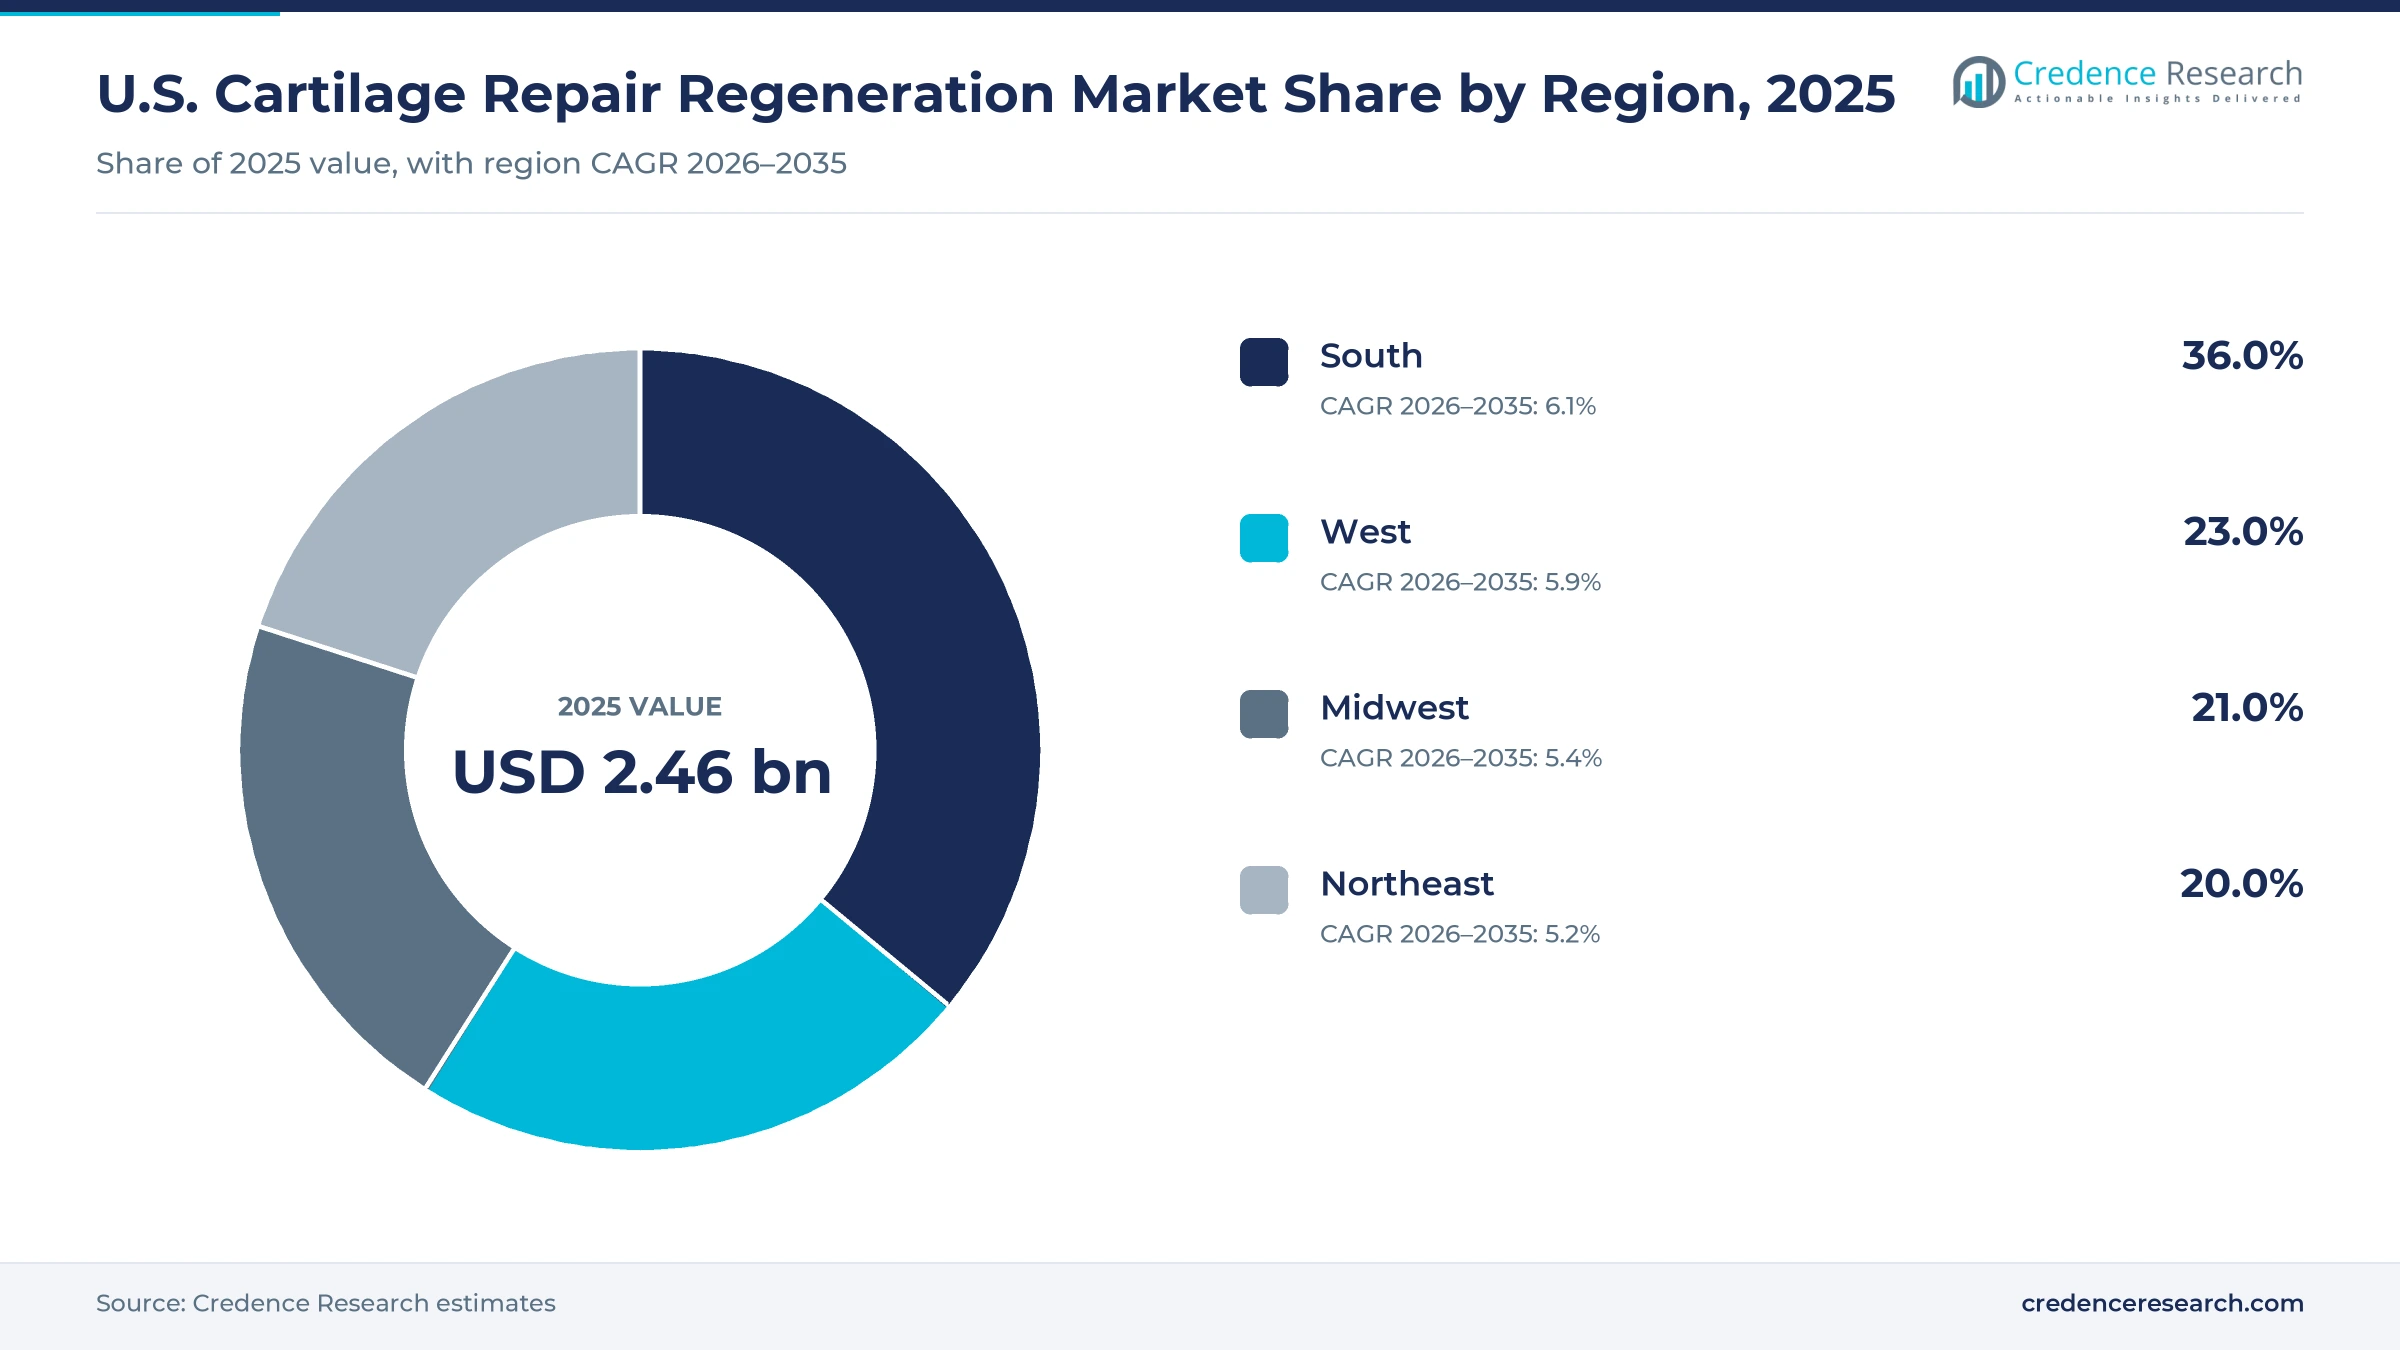
The U.S. cartilage repair regeneration market is split into the four Census regions, from the South, the largest and fastest-growing, to the Northeast. Regional shares and growth rates are Credence Research estimates based on Census data on the population aged 65 and older and the distribution of orthopedic surgery capacity.
| Region | Value, 2025 (USD billion) | Share, 2025 | CAGR, 2026–2035 |
|---|---|---|---|
| South | 0.89 | 36.0% | 6.1% |
| West | 0.57 | 23.0% | 5.9% |
| Midwest | 0.52 | 21.0% | 5.4% |
| Northeast | 0.49 | 20.0% | 5.2% |
The largest older population keeps the South in front
The South held a 36.0% share of 2025 value and grows fastest at 6.1% a year in the regional model. Its population aged 65 and older reached 24.8 million in 2025 and grew 17.5% between 2020 and 2025, faster than the national 16.2%, according to the Census Bureau. Retirees moving to Florida, Texas and the Carolinas add injection and debridement volume in fast-growing suburbs. Suppliers with large ambulatory surgery center networks in the region gain most of the new procedures.
Sports medicine volume lifts the West despite payer limits
The West held a 23.0% share of 2025 value and grows at 5.9% a year. Its population aged 65 and older reached 14.6 million in 2025, the Census Bureau reported, and active younger adults add focal sports injuries that suit restorative implants. The proposed Noridian injection rule covers California, Washington, Arizona and other Western states, so hyaluronan sales face tighter criteria there first. Credence Research expects restorative implants to offset that pressure, keeping the West slightly above the national rate.
An older Midwest relies on injections and value grafts
The Midwest held a 21.0% share of 2025 value and grows at 5.4% a year. Residents aged 65 and older made up about 19.5% of its population in 2025, above the national 18.9%, according to Census estimates. Older patients with diffuse osteoarthritis favor injections and debridement over focal implants, which keeps palliative products dominant. Smaller hospitals rely on general orthopedists, so suppliers with surgeon training programs and lower-cost allografts are best placed.
Dense academic centers anchor the Northeast
The Northeast held a 20.0% share of 2025 value and grows at 5.2% a year, the slowest rate in the regional model. About 20.1% of its residents were aged 65 and older in 2025, the highest share of any region, although its total population of 58.0 million grows slowly. Vericel grows and manufactures MACI in Massachusetts, and academic sports medicine centers in the region run many cartilage trials. Early access to new implants keeps value per case high, although public data do not measure that premium.
Plant approvals, filings and coding decisions mark 2025-26
| Development | Status and market relevance |
|---|---|
| In October 2025, Smith+Nephew announced that the AMA CPT Editorial Panel created a Category I code for procedures with its CARTIHEAL AGILI-C implant. | Coding decision, effective Jan. 1, 2027 |
| In October 2025, Anika Therapeutics submitted the final module of its premarket approval application for the Hyalofast scaffold. | Regulatory submission, under FDA review |
| In March 2026, Vericel received FDA approval for commercial MACI manufacturing at its new Burlington, Massachusetts, facility. | Approval completed, production planned from the second quarter of 2026 |
| In April 2026, Smith+Nephew released five-year clinical data for the CARTIHEAL AGILI-C implant against debridement or microfracture. | Clinical data release for an approved product |
| In October 2026, Noridian Healthcare Solutions proposed a Medicare coverage determination for hyaluronic acid knee injections. | Proposal, comment period closed Nov. 14, 2026 |
Chondrocytes, aragonite and hyaluronan scaffolds compete
- Autologous chondrocyte implants grow the patient’s own cartilage cells on a collagen membrane, which yields hyaline-like tissue but needs a biopsy and a second surgery.
- Aragonite scaffolds use a coral-derived biphasic implant that rebuilds cartilage and the bone beneath it in a single, off-the-shelf procedure.
- Particulated and matrix allografts deliver juvenile cartilage pieces or processed extracellular matrix into a defect, often combined with marrow stimulation during arthroscopy.
- Hyaluronan scaffolds and injections range from viscosupplements that relieve osteoarthritis pain to resorbable scaffolds that carry bone marrow concentrate into a defect.
Need a Custom Version of This Report?
Tailor the scope, geography, or segments to your exact requirements.
- Custom geography or segment scope
- Direct access to our analyst team
Vericel and Smith+Nephew lead approved restorative care
Competition is shaped by regulatory approval, surgeon training and coding rather than by price alone. Vericel holds the only FDA-approved autologous cell implant for knee cartilage and supports it with a dedicated sales force, custom arthroscopic instruments and a new Massachusetts plant. Smith+Nephew competes with a single-stage aragonite scaffold backed by five-year randomized data and a new procedure code. Arthrex, Zimmer Biomet and Stryker sell allografts and matrix grafts through their sports medicine and biologics sales teams, bundling them with arthroscopy hardware. Anika’s Monovisc and Orthovisc, sold in the U.S. through DePuy Synthes, compete with Sanofi’s Synvisc-One, Ferring’s Euflexxa and Bioventus’s injection line, where Medicare payment limits drive price. JRF Ortho supplies fresh osteochondral allografts to sports medicine surgeons. Pending approvals for Hyalofast and other scaffolds would bring new entrants to the restorative tier.
How is the supplier base organized?
Supply splits into a concentrated restorative tier and a crowded injection tier. Only two restorative products hold FDA approval for knee cartilage, Vericel’s MACI cell implant and Smith+Nephew’s AGILI-C scaffold, while Arthrex, Zimmer Biomet, Stryker and tissue banks such as JRF Ortho sell allografts and matrix grafts under tissue rules. Hyaluronan injections come from Sanofi, Bioventus, Anika and others under 14 Medicare codes. Entry barriers are biologics or premarket approval, surgeon training and coding. Margins sit in approved implants and cell therapy, while injections compete on price.
Companies profiled and their roles in this market
| Company | Type | Role in the market |
|---|---|---|
| Vericel Corporation | Cell therapy specialist | Sells MACI autologous chondrocyte implants, including arthroscopic MACI Arthro, for knee defects |
| Smith+Nephew | Sports medicine supplier | Sells the CARTIHEAL AGILI-C aragonite scaffold for knee cartilage and osteochondral defects |
| Arthrex | Sports medicine supplier | Sells BioCartilage extracellular matrix and AutoCart single-stage cartilage technique systems |
| Zimmer Biomet | Full-line orthopedic supplier | Sells DeNovo NT juvenile cartilage grafts and Gel-One hyaluronan injections |
| Sanofi | Pharmaceutical supplier | Sells Synvisc-One and Synvisc hylan injections for knee osteoarthritis pain |
| Ferring Pharmaceuticals | Pharmaceutical supplier | Sells the Euflexxa three-injection hyaluronan course for knee osteoarthritis in the U.S. |
| Bioventus | Orthobiologics specialist | Sells Durolane, Gelsyn-3 and Supartz FX hyaluronic acid injections |
| Anika Therapeutics | Hyaluronan specialist | Makes Monovisc and Orthovisc, sold in the U.S. through DePuy Synthes, and seeks Hyalofast approval |
| Stryker Corporation | Full-line orthopedic supplier | Sells ProChondrix CR cartilage repair grafts through its biologics portfolio |
| JRF Ortho | Tissue bank | Supplies fresh osteochondral allografts and other cartilage allografts to surgeons |
Why restorative implants outgrow injections
Credence Research’s view is that restorative implants will take a steadily larger part of spending, while injections hold volume but lose price in the U.S. cartilage repair regeneration market. Cell-based approaches grow fastest because arthroscopic delivery and new manufacturing capacity remove two of their past limits. The 2027 scaffold code matters as much as any approval, because hospitals adopt what they can bill. The largest uncertainty is the pipeline, since recent pivotal trials have missed endpoints, and the evidence on spine products is too thin to estimate with confidence.
Product data and payment files anchor the estimate
The report uses 2025 as the base year and forecasts to 2035. The 2025 value is the Credence Research model value, cross-checked against product-level evidence from company filings, Medicare Part B payment limits and HCPCS codes, FDA decisions and Census population data. Segment and regional splits are Credence Research estimates based on product labels, procedure trends published in peer-reviewed studies and the regional distribution of older adults. The analysis does not rely on interviews or surveys of any kind.
Restorative implants carry growth to 2035
The U.S. cartilage repair regeneration market is expected to grow from USD 2.60 billion in 2026 to USD 4.29 billion by 2035, a CAGR of 5.70%. Cell implants and single-stage scaffolds should gain most, helped by a wider trained surgeon base and the 2027 procedure code, while hyaluronan injections face stricter Medicare criteria and lower prices. Approvals for Hyalofast or other scaffolds would widen surgeon choice in the second half of the decade. Ankle indications and synthetic implants are the main sources of upside after 2030, although both still depend on trials that have not yet reported.
What decides the range of outcomes to 2035?
The base case assumes steady cell implant growth, gradual uptake of the new scaffold code and flat injection volume. The downside case follows wider adoption of strict Medicare injection criteria and further pipeline delays, which would leave growth to two approved implants. The upside case needs at least one scaffold or cell product approval before 2028 and payer coverage for ankle and hip use.
| Scenario | CAGR, 2026–2035 | Value, 2035 | What has to hold |
|---|---|---|---|
| Downside | 4.2% | USD 3.77 billion | Strict injection criteria spread nationally and pending scaffold approvals slip past 2030 |
| Base | 5.70% | USD 4.29 billion | Cell implants keep gaining surgeons and the 2027 scaffold code is adopted gradually |
| Upside | 7.2% | USD 4.87 billion | New scaffold or cell approvals arrive before 2028 and ankle indications win coverage |
Frequently Asked Questions
How big is the U.S. cartilage repair regeneration market?
What share of the market is knee cartilage repair?
Where does chondroplasty fit in this market?
How large is cell-free cartilage repair?
Which cartilage repair devices are FDA approved?
Which region leads the U.S. market?
What restrains growth in the market?
Who are the leading companies?
Table of Content
Chapter 1 Market Segmentation
- 1.1 Segmentation Framework
- 1.1.1 Product and Service Classification
- 1.1.2 Application and End-Use Classification
- 1.1.3 Technology and Solution Classification
- 1.1.4 Customer and Distribution Channel Classification
- 1.1.5 Geographic Segmentation
- 1.1.6 Market Segment Definitions and Boundaries
- 1.2 By Treatment Modality
- 1.2.1 Non-Cell-Based Approaches
- 1.2.2 Cell-Based Approaches
- 1.3 By Treatment Type
- 1.3.1 Palliative
- 1.3.2 Intrinsic Repair Stimulus
- 1.4 By Application
- 1.4.1 Knee
- 1.4.2 Hip
- 1.4.3 Ankle
- 1.4.4 Spine
- 1.4.5 Others
Chapter 2 Introduction
- 2.1 Report Objectives and Scope
- 2.2 Product Definition and Industry Terminology
- 2.3 Market Inclusions and Exclusions
- 2.4 Research Process
- 2.4.1 Primary Research and Expert Interviews
- 2.4.2 Secondary Research and Source Review
- 2.4.3 Top-Down and Bottom-Up Estimation
- 2.4.4 Data Triangulation and Verification
- 2.5 Market Size Measurement Basis
- 2.5.1 2025: USD 2.46 billion → 2035: USD 4.29 billion
- 2.6 Historical and Forecast Reference Periods
- 2.6.1 Historical Period: 2018-2025
- 2.6.2 Base Year: 2025
- 2.6.3 Forecast Period: 2025-2035
- 2.7 Research Assumptions and Limitations
Chapter 3 Executive Summary
- 3.1 Market Snapshot and Key Findings
- 3.2 Base-Year Market Size, 2025
- 3.3 Forecast Market Size, 2035
- 3.4 Revenue and Volume Growth Outlook
- 3.5 Key Demand and Supply Indicators
- 3.6 Leading Market Segments
- 3.7 Fastest-Growing Market Opportunities
- 3.8 Regional Performance Highlights
- 3.9 Technology and Industry Transformation
- 3.10 Competitive Landscape Summary
- 3.11 Analyst View and Strategic Implications
Chapter 4 U.S. Cartilage Repair Regeneration Market Trends and Developments
- 4.1 Historical Industry Development, 2018-2025
- 4.2 Recent Market Trends and Developments
- 4.3 Demand and Customer Behavior Trends
- 4.4 Technology and Product Innovation
- 4.5 Artificial Intelligence, Automation and Digitalization
- 4.6 Local Manufacturing and Supply Chain Realignment
- 4.7 Industry Partnerships, Mergers and Acquisitions
- 4.8 Sustainability and Circular Economy Developments
- 4.9 Government and Private Sector Investment Trends
- 4.10 Emerging Business Models and Commercialization
- 4.11 Industry Developments and Announcements
Chapter 5 U.S. Cartilage Repair Regeneration Market Production, Supply and Demand Analysis
- 5.1 Demand Trend and Consumption Analysis, 2018-2025
- 5.2 Demand Forecast, 2025-2035
- 5.3 Production and Output Trend, 2018-2025
- 5.4 Production and Output Forecast, 2025-2035
- 5.5 Installed Capacity and Capacity Utilization
- 5.6 Company-Wise Production Plants and Statistics
- 5.6.1 Installed Production Capacity
- 5.6.2 Actual Production
- 5.6.3 Planned Capacity and Expansion Targets
- 5.7 Supply Chain Structure and Procurement Trends
- 5.8 Supply-Demand Gap and Bottlenecks
- 5.9 Import Dependence and Sourcing Structure
- 5.10 Contract Manufacturing and Outsourcing
- 5.11 Regional Supply and Demand Concentration
Chapter 6 U.S. Cartilage Repair Regeneration Market Pricing Analysis
- 6.1 Pricing Structure and Measurement
- 6.2 Historical Pricing Trends, 2018-2025
- 6.3 Pricing Outlook, 2025-2035
- 6.4 Average Selling Price and Unit Economics
- 6.5 Pricing by Product and Market Segment
- 6.6 Geographic Pricing Differences
- 6.7 Key Input, Energy, Labor and Logistics Costs
- 6.8 Contract Pricing and Purchasing Models
- 6.9 Pricing Sensitivity and Competitive Positioning
- 6.10 Price, Margin and Profitability Implications
Chapter 7 U.S. Cartilage Repair Regeneration Market Dynamics
- 7.1 Market Growth Drivers
- 7.1.1 Demand-Side Drivers
- 7.1.2 Technology and Innovation Drivers
- 7.1.3 Infrastructure and Investment Drivers
- 7.1.4 Regulatory and Policy Drivers
- 7.2 Market Restraints
- 7.2.1 Cost and Affordability Constraints
- 7.2.2 Technology and Adoption Barriers
- 7.2.3 Supply Chain and Operational Constraints
- 7.3 Market Challenges
- 7.3.1 Competitive Pressure and Margin Erosion
- 7.3.2 Skills, Infrastructure and Implementation Gaps
- 7.4 Emerging Market Opportunities
- 7.5 Market Dynamics Impact and Time-Horizon Assessment
Chapter 8 U.S. Cartilage Repair Regeneration Value Chain Analysis
- 8.1 Industry Value Chain Overview
- 8.2 Upstream Suppliers and Critical Inputs
- 8.3 Technology and Component Providers
- 8.4 Manufacturing or Service Delivery
- 8.5 Distribution, Channel Partners and Integrators
- 8.6 Downstream Applications and End Users
- 8.7 Value Addition and Profit Pools
- 8.8 Vertical Integration and Outsourcing
- 8.9 Supplier Concentration and Risk
- 8.10 Supply Chain Localization and Resilience
Chapter 9 U.S. Cartilage Repair Regeneration Market Regulations and Policies
- 9.1 Relevant Laws, Standards and Compliance Frameworks
- 9.2 Product, Service, Safety and Quality Requirements
- 9.3 Government Policies, Incentives and Subsidies
- 9.4 Imports, Exports and Trade Barriers
- 9.5 Public Procurement and Local Content Requirements
- 9.6 Environmental and Sustainability Compliance
- 9.7 Upcoming Policy Changes and Market Implications
Chapter 10 U.S. Cartilage Repair Regeneration Market Hotspots and Opportunities
- 10.1 Market Opportunity Mapping and Growth Hotspots
- 10.2 High-Growth Applications and Customer Groups
- 10.3 Underserved Markets and White-Space Opportunities
- 10.4 Emerging Technology and Product Opportunities
- 10.5 New Capacity and Investment Hotspots
- 10.6 Market Entry and Expansion Opportunities
- 10.7 Distribution and Partnership Opportunities
- 10.8 Near-Term and Long-Term Commercial Potential
- 10.9 Opportunity Attractiveness and Execution Risks
Chapter 11 U.S. Cartilage Repair Regeneration Market Outlook, 2025-2035
- 11.1 Market Size and Analysis
- 11.1.1 Revenue (Market Measurement: 2025: USD 2.46 billion → 2035: USD 4.29 billion)
- 11.1.2 Market Volume and Quantity Sold
- 11.1.3 Historical Market Size, 2018-2025
- 11.1.4 Base-Year Market Size, 2025
- 11.2 Market Forecast, 2025-2035
- 11.2.1 Revenue Forecast to 2035
- 11.2.2 Volume Forecast to 2035
- 11.2.3 CAGR and Year-on-Year Growth
- 11.2.4 Incremental Revenue Opportunity
- 11.3 Forecast Assumptions and Scenario Analysis
- 11.3.1 Base-Case Forecast
- 11.3.2 Optimistic and Conservative Scenarios
- 11.3.3 Technology, Pricing and Policy Sensitivities
- 11.4 Market Attractiveness and Growth Outlook
Chapter 12 U.S. Cartilage Repair Regeneration Market Segmentation and Outlook
- 12.1 Segmentation Summary and Market Shares, 2025
- 12.2 Largest and Fastest-Growing Segments
- 12.3 By Treatment Modality - Market Size and Forecast, 2025-2035
- 12.3.1 Segment Definition and Scope
- 12.3.2 Historical Market Size, 2018-2025
- 12.3.3 Revenue Forecast, 2025-2035
- 12.3.4 Volume Forecast, 2025-2035
- 12.3.5 Base-Year Market Share, 2025
- 12.3.6 Segment CAGR and Growth Drivers
- 12.3.7 Subsegment Market Size and Forecast
- 12.3.7.1 Non-Cell-Based Approaches
- 12.3.7.2 Cell-Based Approaches
- 12.3.8 Subsegment Pricing and Adoption Trends
- 12.3.9 Leading Suppliers and Competition
- 12.3.10 Regional Demand and Opportunities
- 12.4 By Treatment Type - Market Size and Forecast, 2025-2035
- 12.4.1 Segment Definition and Scope
- 12.4.2 Historical Market Size, 2018-2025
- 12.4.3 Revenue Forecast, 2025-2035
- 12.4.4 Volume Forecast, 2025-2035
- 12.4.5 Base-Year Market Share, 2025
- 12.4.6 Segment CAGR and Growth Drivers
- 12.4.7 Subsegment Market Size and Forecast
- 12.4.7.1 Palliative
- 12.4.7.2 Intrinsic Repair Stimulus
- 12.4.8 Subsegment Pricing and Adoption Trends
- 12.4.9 Leading Suppliers and Competition
- 12.4.10 Regional Demand and Opportunities
- 12.5 By Application - Market Size and Forecast, 2025-2035
- 12.5.1 Segment Definition and Scope
- 12.5.2 Historical Market Size, 2018-2025
- 12.5.3 Revenue Forecast, 2025-2035
- 12.5.4 Volume Forecast, 2025-2035
- 12.5.5 Base-Year Market Share, 2025
- 12.5.6 Segment CAGR and Growth Drivers
- 12.5.7 Subsegment Market Size and Forecast
- 12.5.7.1 Knee
- 12.5.7.2 Hip
- 12.5.7.3 Ankle
- 12.5.7.4 Spine
- 12.5.7.5 Others
- 12.5.8 Subsegment Pricing and Adoption Trends
- 12.5.9 Leading Suppliers and Competition
- 12.5.10 Regional Demand and Opportunities
- 12.6 Segment Growth Comparison
- 12.7 Segment Attractiveness and Priority Matrix
Chapter 13 U.S. Cartilage Repair Regeneration End-Use and Application Market Outlook
- 13.1 End-Use Industry and Customer Demand Structure
- 13.2 Leading Applications and Customer Groups
- 13.3 End-Use Market Size, Share and Forecast
- 13.4 Major End-Use Industry Deep Dives
- 13.4.1 Customer Requirements and Use Cases
- 13.4.2 Demand and Replacement Cycles
- 13.4.3 Technical and Regulatory Considerations
- 13.4.4 Purchasing and Procurement Models
- 13.4.5 Leading Vendors and Distribution Channels
- 13.4.6 Forecast and Commercial Opportunities
- 13.5 Emerging Applications and Cross-Segment Demand
- 13.6 End-Use Industry Investment Priorities
Chapter 14 U.S. Cartilage Repair Regeneration Geographic Market Outlook, 2025-2035
- 14.1 Domestic Market Distribution and Demand Clusters
- 14.2 State- or Province-Wise Market Size and Forecast, 2025-2035
- 14.3 City and Metropolitan Market Outlook
- 14.4 Industrial, Manufacturing and Commercial Clusters
- 14.5 Geographic Concentration of Key End Users
- 14.6 Local Pricing and Purchasing Differences
- 14.7 Domestic Production Facilities and Capacity Map
- 14.8 Local Infrastructure and Project Pipeline
- 14.9 State-Level Policy and Incentive Differences
- 14.10 Subnational Investment Hotspots and Opportunities
- 14.11 Distribution and Logistics Networks
- 14.12 Domestic Competitive Footprint
Chapter 15 U.S. Cartilage Repair Regeneration Technology, Innovation and Sustainability Outlook
- 15.1 Technology Landscape and Maturity
- 15.2 Product, Process and Service Innovation
- 15.3 AI, Automation and Digital Tools in the Industry
- 15.4 Technology Adoption and Performance Benchmarking
- 15.5 Innovation Pipeline and R&D Investment
- 15.6 Patent and Intellectual Property Trends
- 15.7 Energy Efficiency and Resource Management
- 15.8 Sustainability, Recycling and Circularity
- 15.9 Technology Roadmap, 2025-2035
- 15.10 Risks of Obsolescence and Technology Substitution
Chapter 16 U.S. Cartilage Repair Regeneration Market Key Strategic Imperatives
- 16.1 Growth and Market Entry Priorities
- 16.2 High-Return Products and Segments
- 16.3 Pricing, Profitability and Cost Optimization
- 16.4 Technology Investment and Product Differentiation
- 16.5 Supply Chain Localization and Resilience
- 16.6 Distribution and Customer Acquisition
- 16.7 Partnership, Acquisition and Capacity Strategy
- 16.8 Regional Expansion Priorities
- 16.9 Short-, Medium- and Long-Term Actions
Chapter 17 Competition Outlook
- 17.1 Industry Competition Characteristics
- 17.2 Market Structure and Concentration
- 17.3 Market Share and Competitive Positioning, 2025
- 17.4 Company-Wise Revenue and Product Benchmarking
- 17.5 Production and Service Capacity Benchmarking
- 17.6 Technology, Pricing and Differentiation
- 17.7 Regional Footprint and Distribution Strength
- 17.8 Mergers, Acquisitions and Strategic Alliances
- 17.9 New Entrants and Competitive Threats
- 17.10 Porter's Five Forces and Industry Attractiveness
- 17.11 Competitive Outlook, 2025-2035
Chapter 18 Company Profiles
- 18.1 Company Coverage and Selection Criteria
- 18.2 Vericel Corporation
- 18.2.1 Business Description
- 18.2.2 Company Ownership and Geographic Presence
- 18.2.3 Product and Service Portfolio
- 18.2.4 Manufacturing and Operating Footprint
- 18.2.5 Production Capacity and Expansion Plans
- 18.2.6 Financial Performance and Investment
- 18.2.7 Market Share and Competitive Position
- 18.2.8 Technology and Innovation Capabilities
- 18.2.9 Strategic Alliances or Partnerships
- 18.2.10 Recent Developments
- 18.2.11 Growth Strategy and Outlook
- 18.3 Smith+Nephew
- 18.4 Arthrex
- 18.5 Zimmer Biomet
- 18.6 Sanofi
- 18.7 Ferring Pharmaceuticals
- 18.8 Bioventus
- 18.9 Anika Therapeutics
- 18.10 Stryker Corporation
- 18.11 JRF Ortho
- 18.12 Other Relevant Market Participants
Note: Every listed company is profiled on the structure shown under the first company. The company list is preliminary and may change based on research findings, market developments, data availability and client requirements.
Chapter 19 Disclaimer
- 19.1 Research and Forecast Disclaimer
- 19.2 Data Source and Estimation Limitations
Note: The depth of individual sections depends on data availability for this market. Volume, capacity, trade and other unit-based metrics are included where applicable.