Discreet online buying and mass retail widen device sales
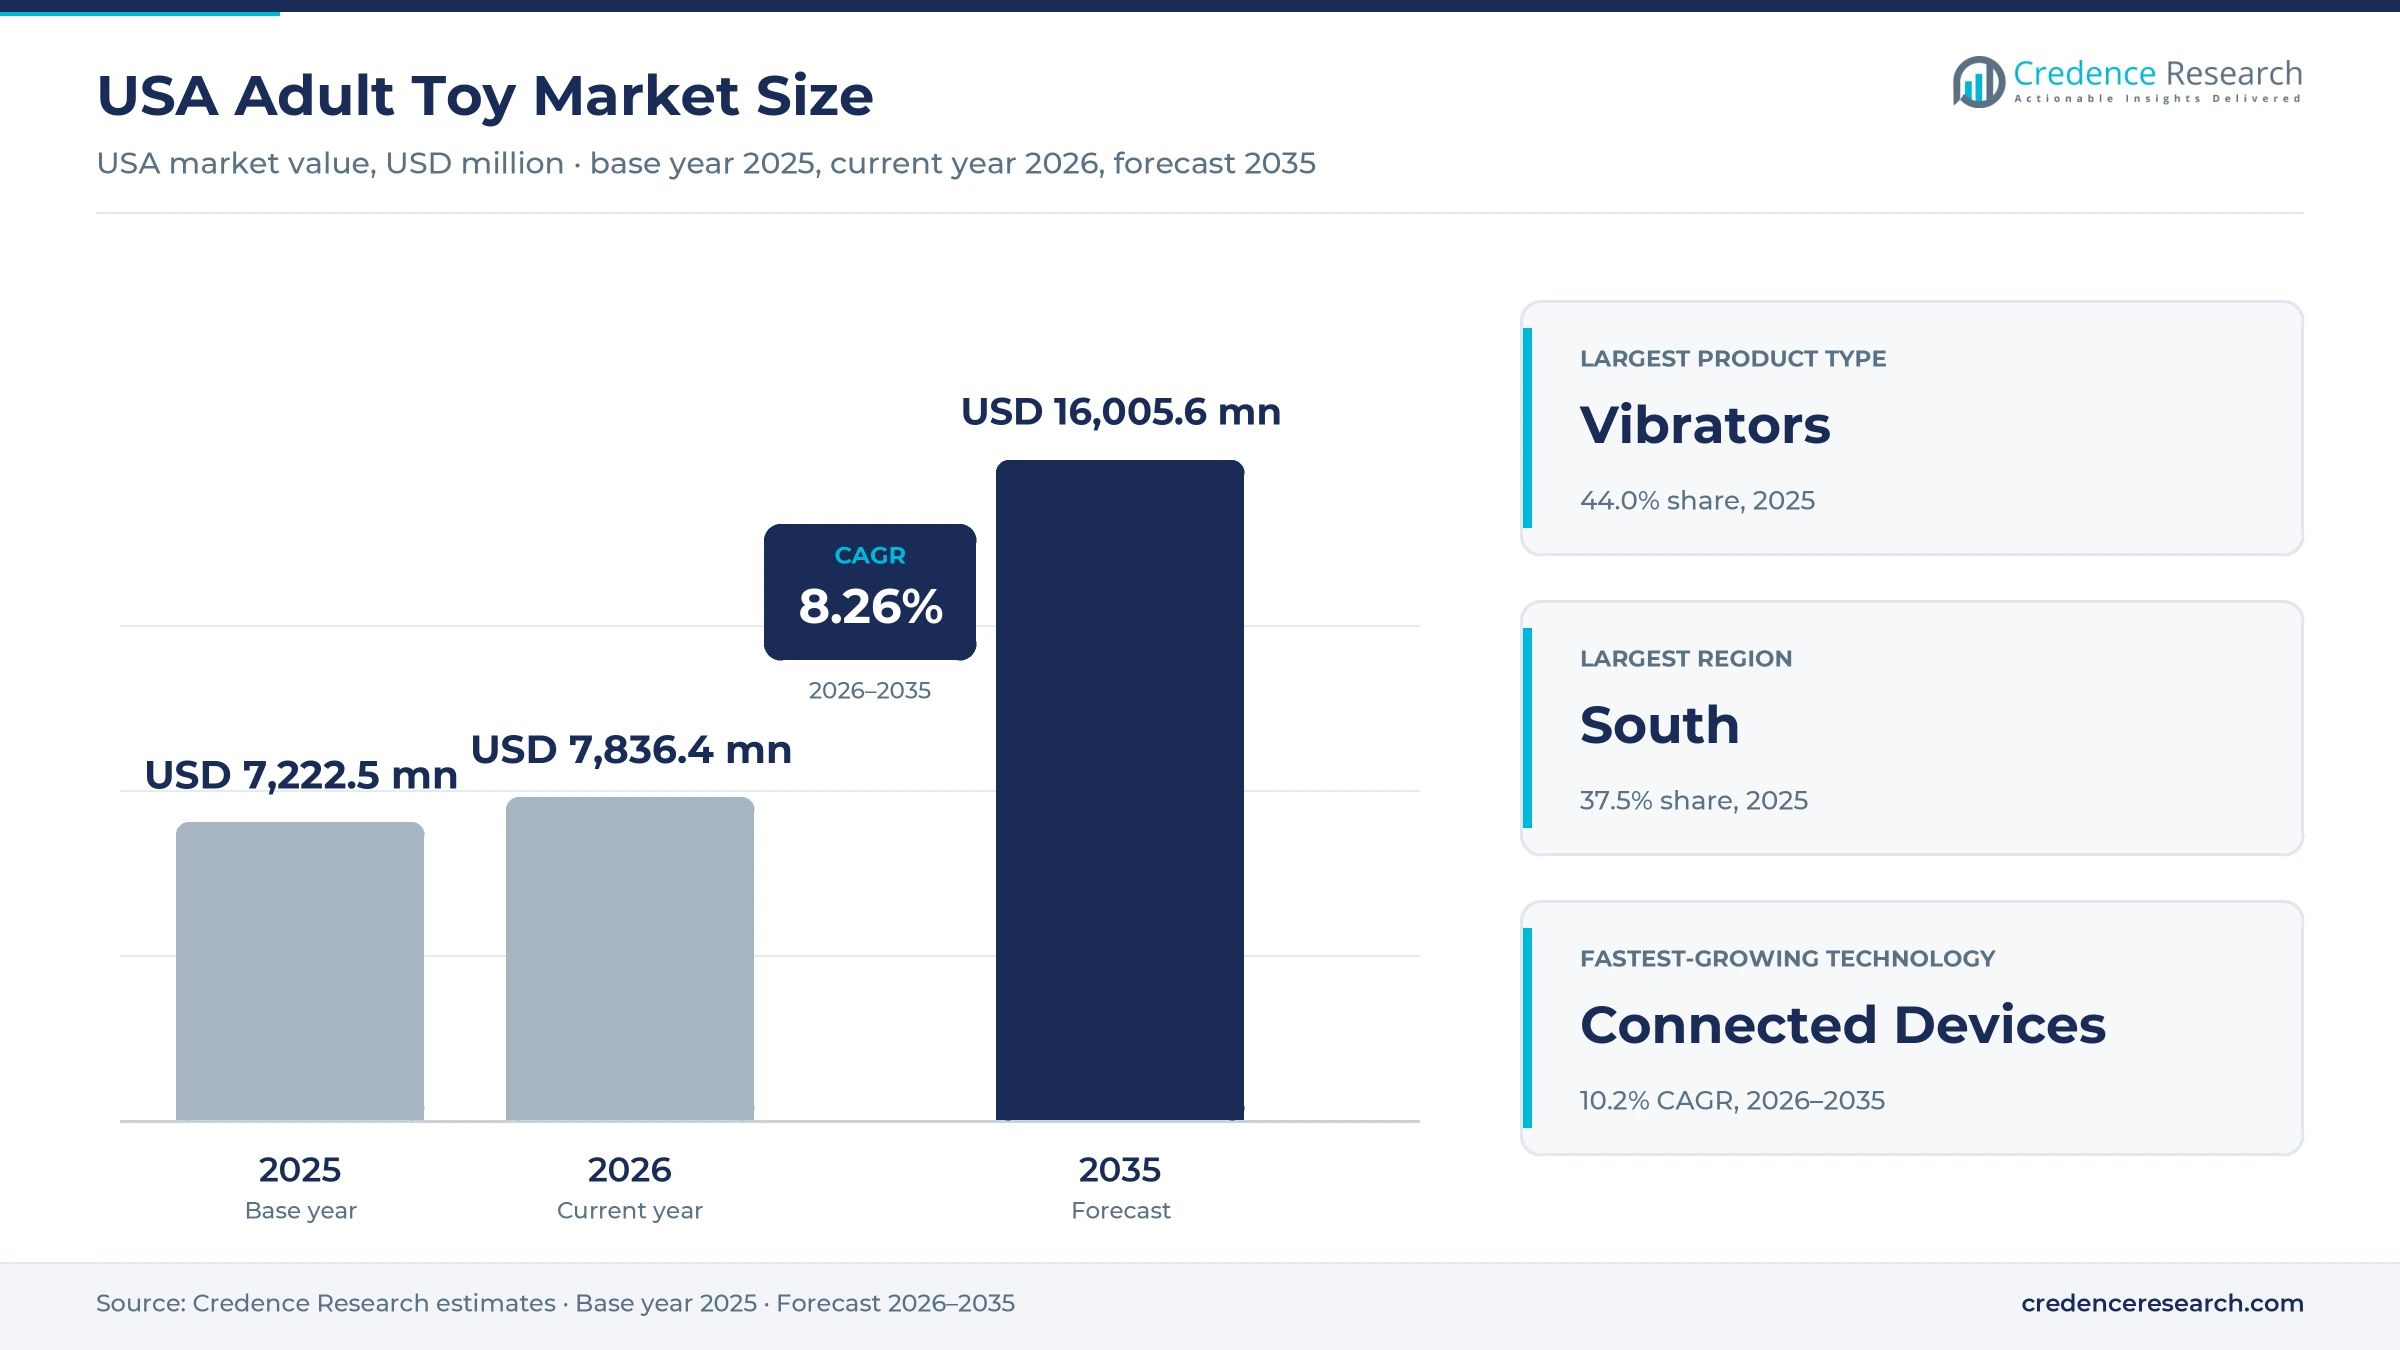
The USA adult toy market was valued at USD 7.22 billion in 2025 and is projected to increase from USD 7.84 billion in 2026 to USD 16.01 billion by 2035, registering a CAGR of 8.26% during 2026–2035. Demand rests on discreet online ordering, a steady move toward rechargeable and app-linked devices, and wider use across age groups and identities. The South held the largest regional share, 37.5% in 2025, and it is also the fastest-growing region at 8.5% a year because its adult population is growing faster than the rest of the country. Vibrators account for the largest share of product value, while connected devices grow fastest as couples and long-distance partners adopt app control. Mainstream retailers now place devices beside condoms and lubricants, which reduces the stigma that once confined sales to specialty stores. Import economics changed on Aug. 29, 2025, when duty-free de minimis treatment ended for low-value parcels from all countries.
Personal devices, dolls and care items bought by adults for sexual wellness
The market counts consumer spending on vibrators, male masturbators, non-vibrating devices and dolls, couples devices and accessories, together with toy cleaners, storage cases, chargers and lubricants sold in device bundles. Adults buy these products through brand websites and marketplaces, specialty adult stores, mass retailers and drugstores, and home parties or membership programs, almost always for private use.
Standalone condoms and lubricants sold outside device bundles are outside the scope, as are FDA-cleared therapeutic devices prescribed for sexual dysfunction, lingerie and adult media. The value chain runs from silicone, electronics and battery suppliers through contract manufacturers, mostly in China, to brand owners, distributors, retailers and finally to consumers.
USA Adult Toy Market Insights
- The USA adult toy market grows from USD 7.22 billion in 2025 to USD 16.01 billion by 2035 at an 8.26% CAGR as online buying and mainstream retail widen access.
- The South held the largest regional share at 37.5% in 2025 and grows fastest at 8.5% a year, as its population grew 6.0% from 2020 to 2025.
- Vibrators led with 44.0% of 2025 value, while connected devices are the fastest-growing technology at 10.2% a year.
- Duty-free de minimis entry ended for all countries on Aug. 29, 2025, which raised the cost of shipping single orders from overseas warehouses.
- Church & Dwight lists Trojan vibrators among its personal care brands, which places devices inside a large consumer health distribution system.
Vibrators lead as connected devices and mass retail grow
Vibrators hold the largest share as male devices grow fastest
Based on product type, the market is categorized into vibrators, male masturbators, non-vibrating devices and dolls, and couples devices and accessories. Vibrators led with 44.0% of 2025 value because they are the most widely used device type, and Indiana University researchers found that about 53% of women aged 18 to 60 had used one. Male Masturbators grow fastest at 8.8% a year as reusable strokers reach mass marketplaces, where TENGA lists its Geo Coral model on Walmart.com at USD 37.99. Dolls carry high unit prices but are bought rarely, so that group grows more slowly than devices bought as repeat purchases.
Solo use leads while care products grow fastest
Based on application, the market is categorized into solo pleasure, partnered pleasure and product care and complementary use. Solo Pleasure led with 56.0% of 2025 value because most devices are designed for individual use, and a November 2025 study in the journal Menopause found that women aged 60 and older used sex toys much more during masturbation than during partnered sex. Product Care and Complementary Use grows fastest at 9.1% a year as cleaners and lubricants are sold with each device. The FDA cleared a silicone-based personal lubricant from Ansella Therapeutics as a Class II device on Dec. 12, 2025, which shows how closely this adjacent category is regulated.
Standalone devices lead as connected models grow fastest
Based on technology, the market is categorized into passive products, standalone powered devices and connected devices. Standalone Powered Devices led with 51.0% of 2025 value because rechargeable vibrators and air-pulse stimulators work without an app, which suits buyers who prefer not to share personal data. Connected Devices grow fastest at 10.2% a year as remote control lets partners use one device together across distance, and Lovense says it serves about 20 million customers worldwide, according to BleepingComputer. Passive products keep entry prices low, but they lose share as buyers trade up to powered designs.
Online sellers lead as mass retailers grow fastest
Based on distribution channel, the market is categorized into e-commerce and DTC, specialty adult retail, mass retail and drugstores, and membership and event sales. E-Commerce and DTC led with 52.0% of 2025 value because buyers value private delivery and a wide range, and brand sites let makers keep more of each sale. Mass Retail and Drugstores grow fastest at 9.2% a year as general retailers stock devices beside condoms and lubricants, and Target sells the LELO SONA Cruise stimulator at USD 76.99. Specialty stores keep a loyal base, and Adam & Eve counted 103 franchise stores in 24 states in June 2023.
| Segment Group | Leading Sub-segment | Share, 2025 | Fastest-growing Sub-segment | CAGR, 2026–2035 |
|---|---|---|---|---|
| By Product Type | Vibrators | 44.0% | Male Masturbators | 8.8% |
| By Application | Solo Pleasure | 56.0% | Product Care and Complementary Use | 9.1% |
| By Technology | Standalone Powered Devices | 51.0% | Connected Devices | 10.2% |
| By Distribution Channel | E-Commerce and DTC | 52.0% | Mass Retail and Drugstores | 9.2% |
Device prices run from USD 12 to above USD 130
Pricing is set per device, and the tier a product falls into follows the motor, material and connectivity built into it. Entry items such as small vibrating rings sell through mass retailers for little more than a condom pack, while mid-range rechargeable stimulators sit near USD 75 to USD 100 at Target and brand stores. Premium silicone devices with app control or wearable designs list above USD 120. Tariffs on Chinese-made goods in 2025 pressed hardest on the mid and premium tiers, where most devices are imported, and brands that tried visible surcharges saw buyers walk away. Retailers protect conversion with bundles and promotions rather than higher list prices.
| Product or tier | Typical price or fee | Basis |
|---|---|---|
| Vibrating ring, entry tier (Trojan Vibrations 2-in-1 ring) | USD 12.09 | Walmart lists, November 2026 |
| Reusable male stroker (TENGA Geo Coral) | USD 37.99 | Walmart marketplace lists, November 2026 |
| Rechargeable clitoral stimulator (LELO SONA Cruise) | USD 76.99 | Target lists, November 2026 |
| Lipstick-style vibrator (LELO MIA 3) | USD 99 recommended retail | LELO launch release, June 2024 |
| Wearable couples vibrator (Dame Eva) | USD 129 | Equinox shop lists, November 2026 |
| App-connected wearable vibrator (Lovense Lush 4) | USD 138 | Headshop.com lists, November 2026 |
Request a Free Sample
Fill in your details and we'll send you a free sample report.
- Sample data tables & charts
- Research methodology
Online privacy, premium devices and wider use lift demand
Discreet digital commerce widens access to devices
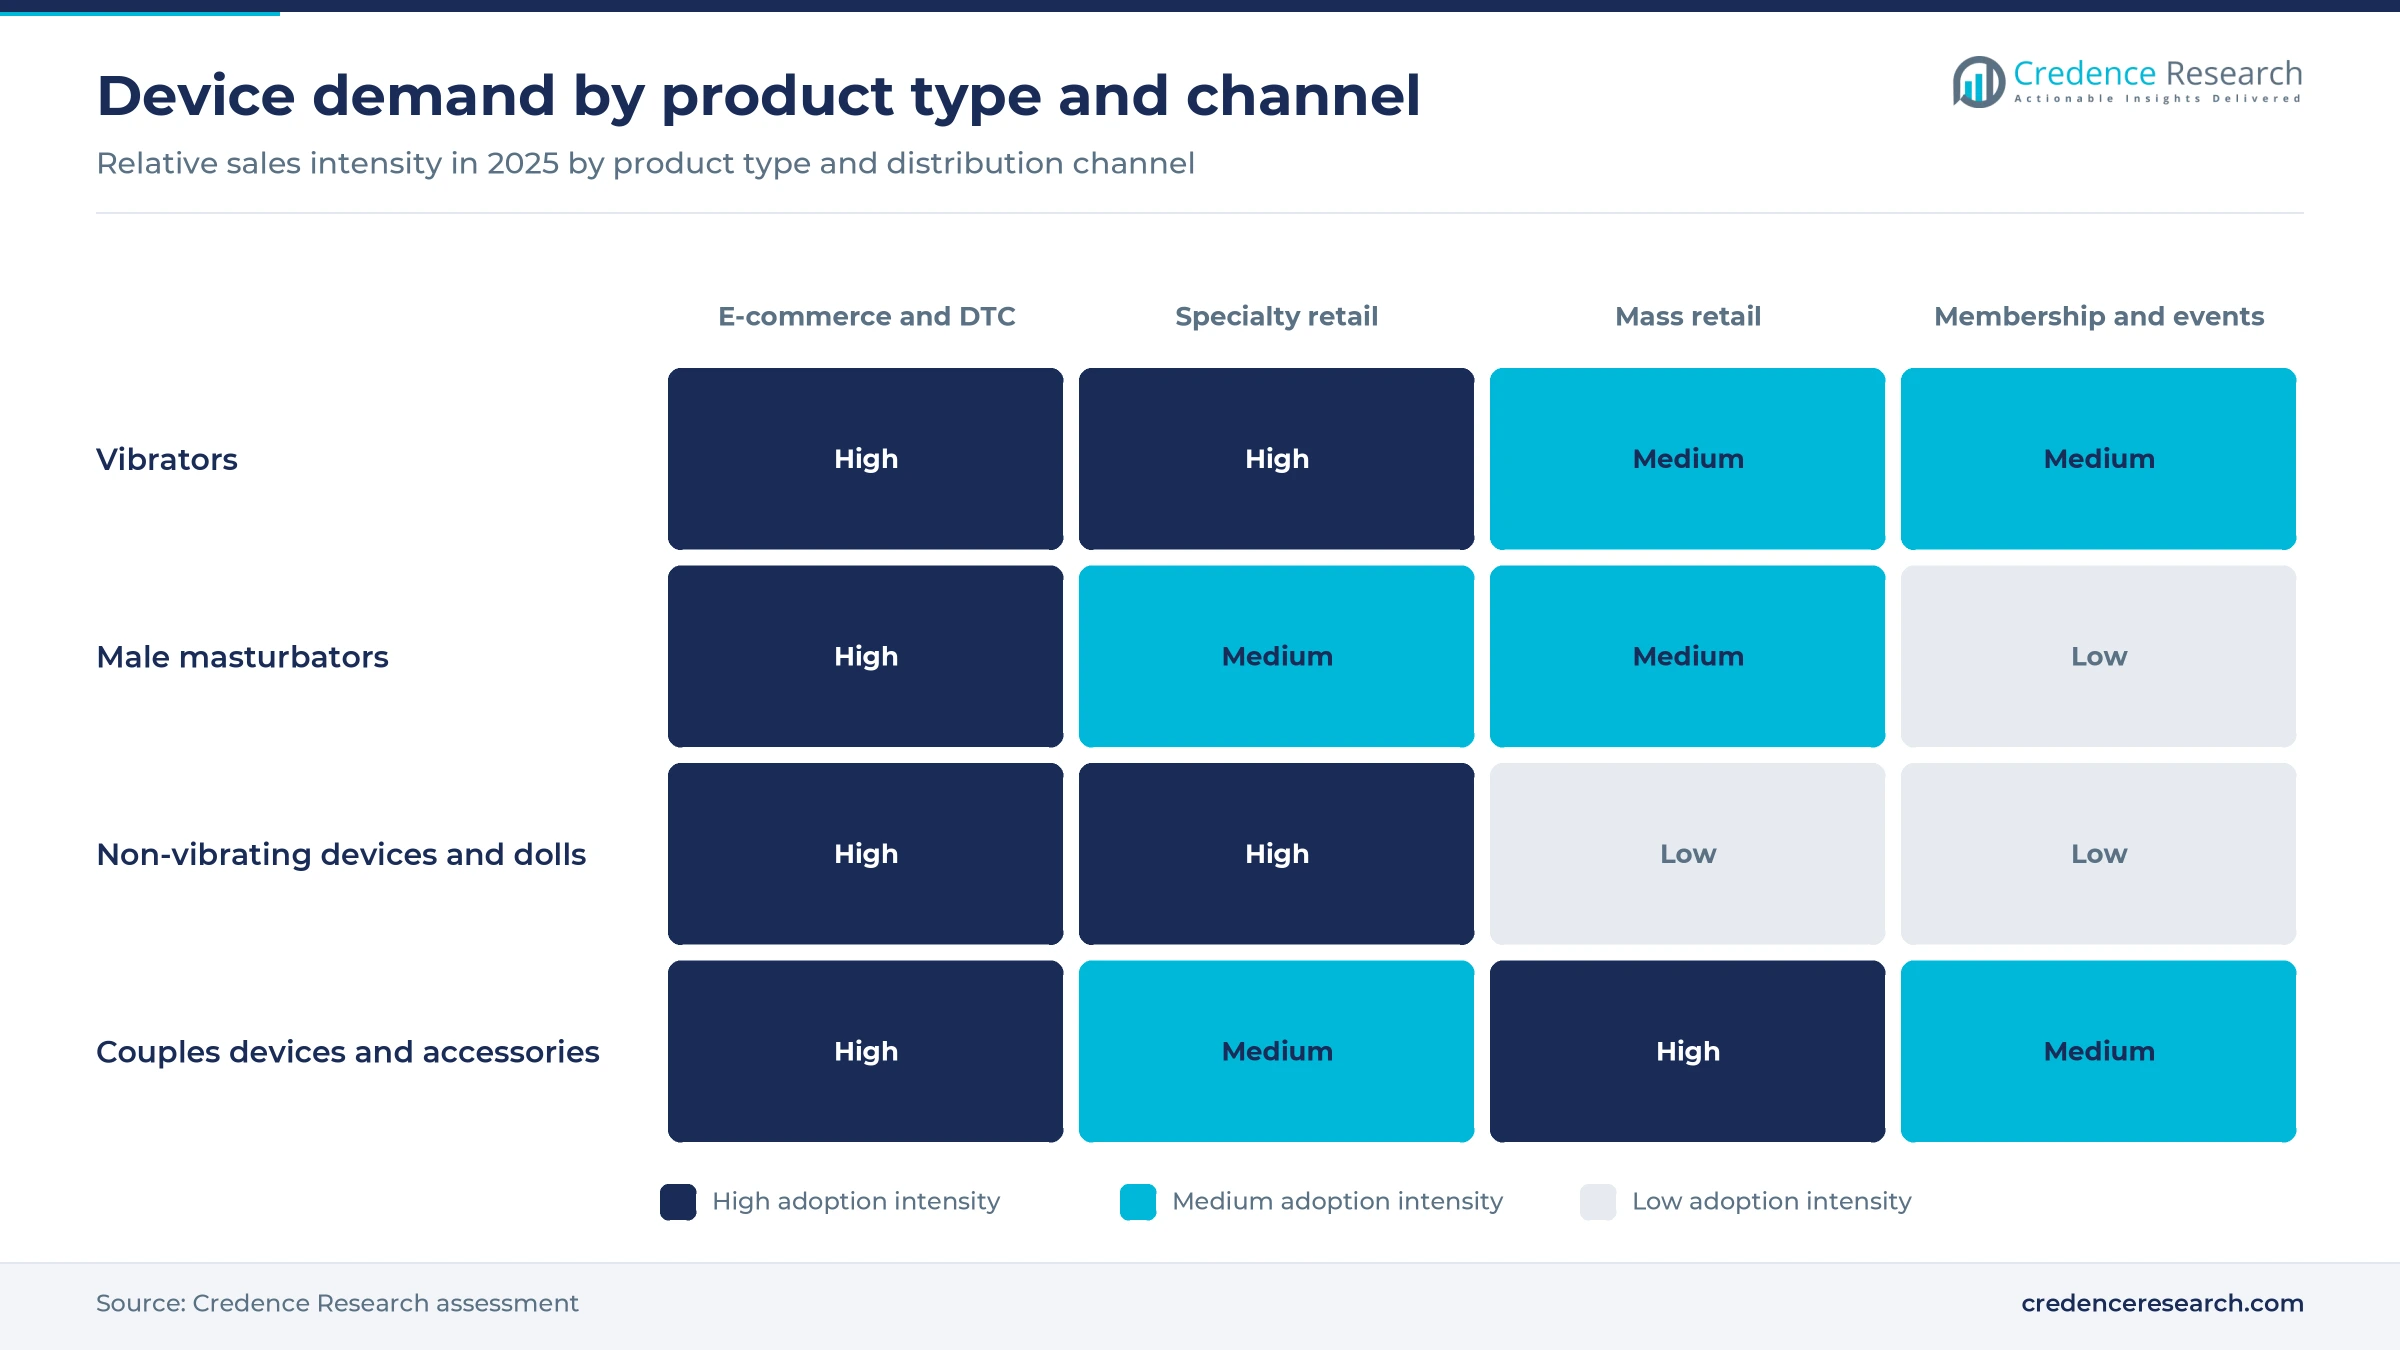
Online ordering remains the main route into the category because it removes the discomfort of a store visit and offers a far wider range. The Census Bureau estimated that e-commerce accounted for 17.1% of all U.S. retail sales in the second quarter of 2026. E-commerce and DTC held 52.0% of 2025 device value, roughly three times that national average, because privacy matters more here than in most categories. Adam & Eve describes AdamEve.com as the largest adult-themed online retailer and runs franchise stores as a second channel. Brands that sell direct also collect reviews and repeat-purchase data, which lowers the cost and risk of launching new models.
Technology-led premiumization raises the price per device
Buyers are moving from battery-powered novelty items to rechargeable silicone devices with stronger motors, quieter operation and longer warranties, which lifts spending per purchase. Brookstone lists the LELO SONA 3 sonic stimulator at a regular price of USD 119, while wearable and app-connected models list higher still, as the price table shows. Connected devices, the fastest-growing technology at 10.2% a year, sit at the top of this price ladder because they add firmware, apps and remote control. Premium makers gain most from the shift, since buyers who trade up to a rechargeable device rarely return to entry products.
Broader adult participation enlarges the buyer base
Device use has spread well beyond a niche group, and the change shows in academic and industry survey data. Indiana University researchers reported in 2009 that about 53% of women and 45% of men aged 18 to 60 had used a vibrator. A web survey of more than 1,000 adults sponsored by Adam & Eve in April 2024 found that 38% of women and 34% of men owned a sex toy. A November 2025 study of more than 3,000 women aged 60 and older, published in Menopause, found that 38.7% of those with partnered sex used toys at least sometimes. Older adults and men are therefore where most first-time buyers are likely to come from through 2035.
Health and beauty retailers bring devices into the mainstream
Devices are moving into the same aisles as condoms, lubricants and personal care, which reaches shoppers who would never enter a specialty store. Church & Dwight's 2025 annual report lists Trojan condoms, lubricants and vibrators among its personal care brands, which puts devices into the distribution system of a large consumer health company. Erewhon, the Los Angeles wellness grocer, began selling maude products in November 2024. Walmart lists the entry Trojan ring from the price table close to the price of a condom pack, on the same site as everyday goods. Mass retail and drugstores grow faster than any other channel at 9.2% a year. This wellness positioning also helps brands win mainstream shelf space alongside personal lubricants and other intimate care lines.
Compact designs and retailer exclusives reshape ranges
Shift to compact, travel-ready rechargeable designs
Product ranges are shifting toward small, discreet devices that look like everyday accessories and charge by USB. LELO launched the MIA 3 lipstick-style vibrator in New York on June 18, 2024, promoting near-silent operation. Womanizer launched Snap on Nov. 2, 2026, its smallest model at 2.28 by 1.57 by 1.22 inches, with a charging case and a five-year warranty. Standalone powered devices of this kind held 51.0% of 2025 value, which shows that buyers still prefer devices that work without an app. Makers that combine small size with long warranties can therefore hold prices even as online and marketplace discounting spreads.
Rise of retailer and brand co-developed editions
Retailers are asking brands for exclusive editions and kits so they can compete on more than price. Adam & Eve and Lovehoney Group launched exclusive coral editions of two Lovehoney Group couples and wand vibrators in November 2026, together with a 24-item advent calendar holding products from Lovehoney Group couples-device and Womanizer lines. Adam & Eve described the calendar as its most premium holiday offering, and it can sell such editions both online and through its franchise stores. CalExotics added three Pleasure Kits on Nov. 6, 2026, positioning the all-in-one sets, such as a Lust kit built around a 10-function rechargeable bullet, as gift-ready products for the holidays. Exclusive editions protect retail margins because shoppers cannot compare them directly with marketplace listings, so co-development is likely to spread to other large sellers.
Midlife and menopause care opens a clinical-adjacent niche
Older adults are an underserved buyer group, and products framed around comfort and sexual health can reach them through health channels. The Menopause study cited above points to growing toy use among U.S. women aged 60 and older. FDA rules under 21 CFR 884.5960 classify genital vibrators labeled for therapeutic use in sexual dysfunction as Class II devices exempt from premarket notification, which offers a defined path for health-positioned products. The Ansella lubricant clearance noted above shows that care products can also earn FDA standing. Brands that pair devices with care products and clinical language can reach buyers through pharmacies and telehealth.
Domestic production can shorten exposed supply chains
U.S. assembly and fulfillment are an opening because import costs became unstable in 2025. Dame said in May 2025 that its devices are mostly made in China but that it also makes many products in the United States, and that both lines were hit by tariffs. Doc Johnson, based in North Hollywood, California, shows that domestic production at scale already exists. The 2025 tariff swings described below showed how quickly landed costs can move. Suppliers that can make passive products and accessories locally will likely win male pleasure product and private-label orders from retailers seeking steadier costs and shorter reorder times.
Tariffs, parcel duties and data risks squeeze brands
Tariffs on Chinese-made devices raise landed costs
Tariffs raised landed costs sharply in 2025 because most devices are assembled in China. Executive orders from February to April 2025 imposed combined tariffs of 145% on Chinese products before a May 2025 agreement cut the combined rate to 30%, according to a Mondaq summary of the action. Dame said checkout completions fell 30% after it added a USD 5 tariff surcharge, and it needed more than double its planned inventory budget. Smaller brands carry this risk most, so they spread production and hold more stock.
The end of de minimis entry raises costs for direct sellers
The end of duty-free de minimis entry raised costs for brands that shipped single orders from overseas warehouses. U.S. Customs and Border Protection guidance says goods of all countries lost duty-free de minimis treatment on Aug. 29, 2025, under an executive order issued on July 30, 2025. Direct sellers that relied on low-value parcels now pay duties and brokerage on each order, which narrows margins on entry devices. Brands with U.S. stock and domestic fulfillment avoid this cost, which favors larger sellers.
Connected device security flaws erode buyer trust
Connected devices carry data security risks that can damage trust across the whole category. Researchers reported two flaws in the Lovense platform on March 26, 2025, one exposing private email addresses and one allowing account takeover, and BleepingComputer reported that both were confirmed fixed only on July 30, 2025. The four-month gap between report and confirmed fix drew wide press coverage. Buyers who fear exposure choose standalone devices instead, so connected brands must fund security audits and publish clear data policies.
No federal material standard leaves safety to brand claims
No federal standard sets material or chemical limits for these devices, which leaves buyers to rely on brand claims. A Duke University study reported in August 2023 in Microplastics and Nanoplastics found phthalates in all four sex toys it tested, chemicals that are strictly limited in children's toys. Church & Dwight notes that electrical products such as its Trojan vibrators fall under the Radiation Control provisions of the federal FDCA, a rule that covers electronics rather than materials. Brands that publish independent test results can turn this gap into an advantage.
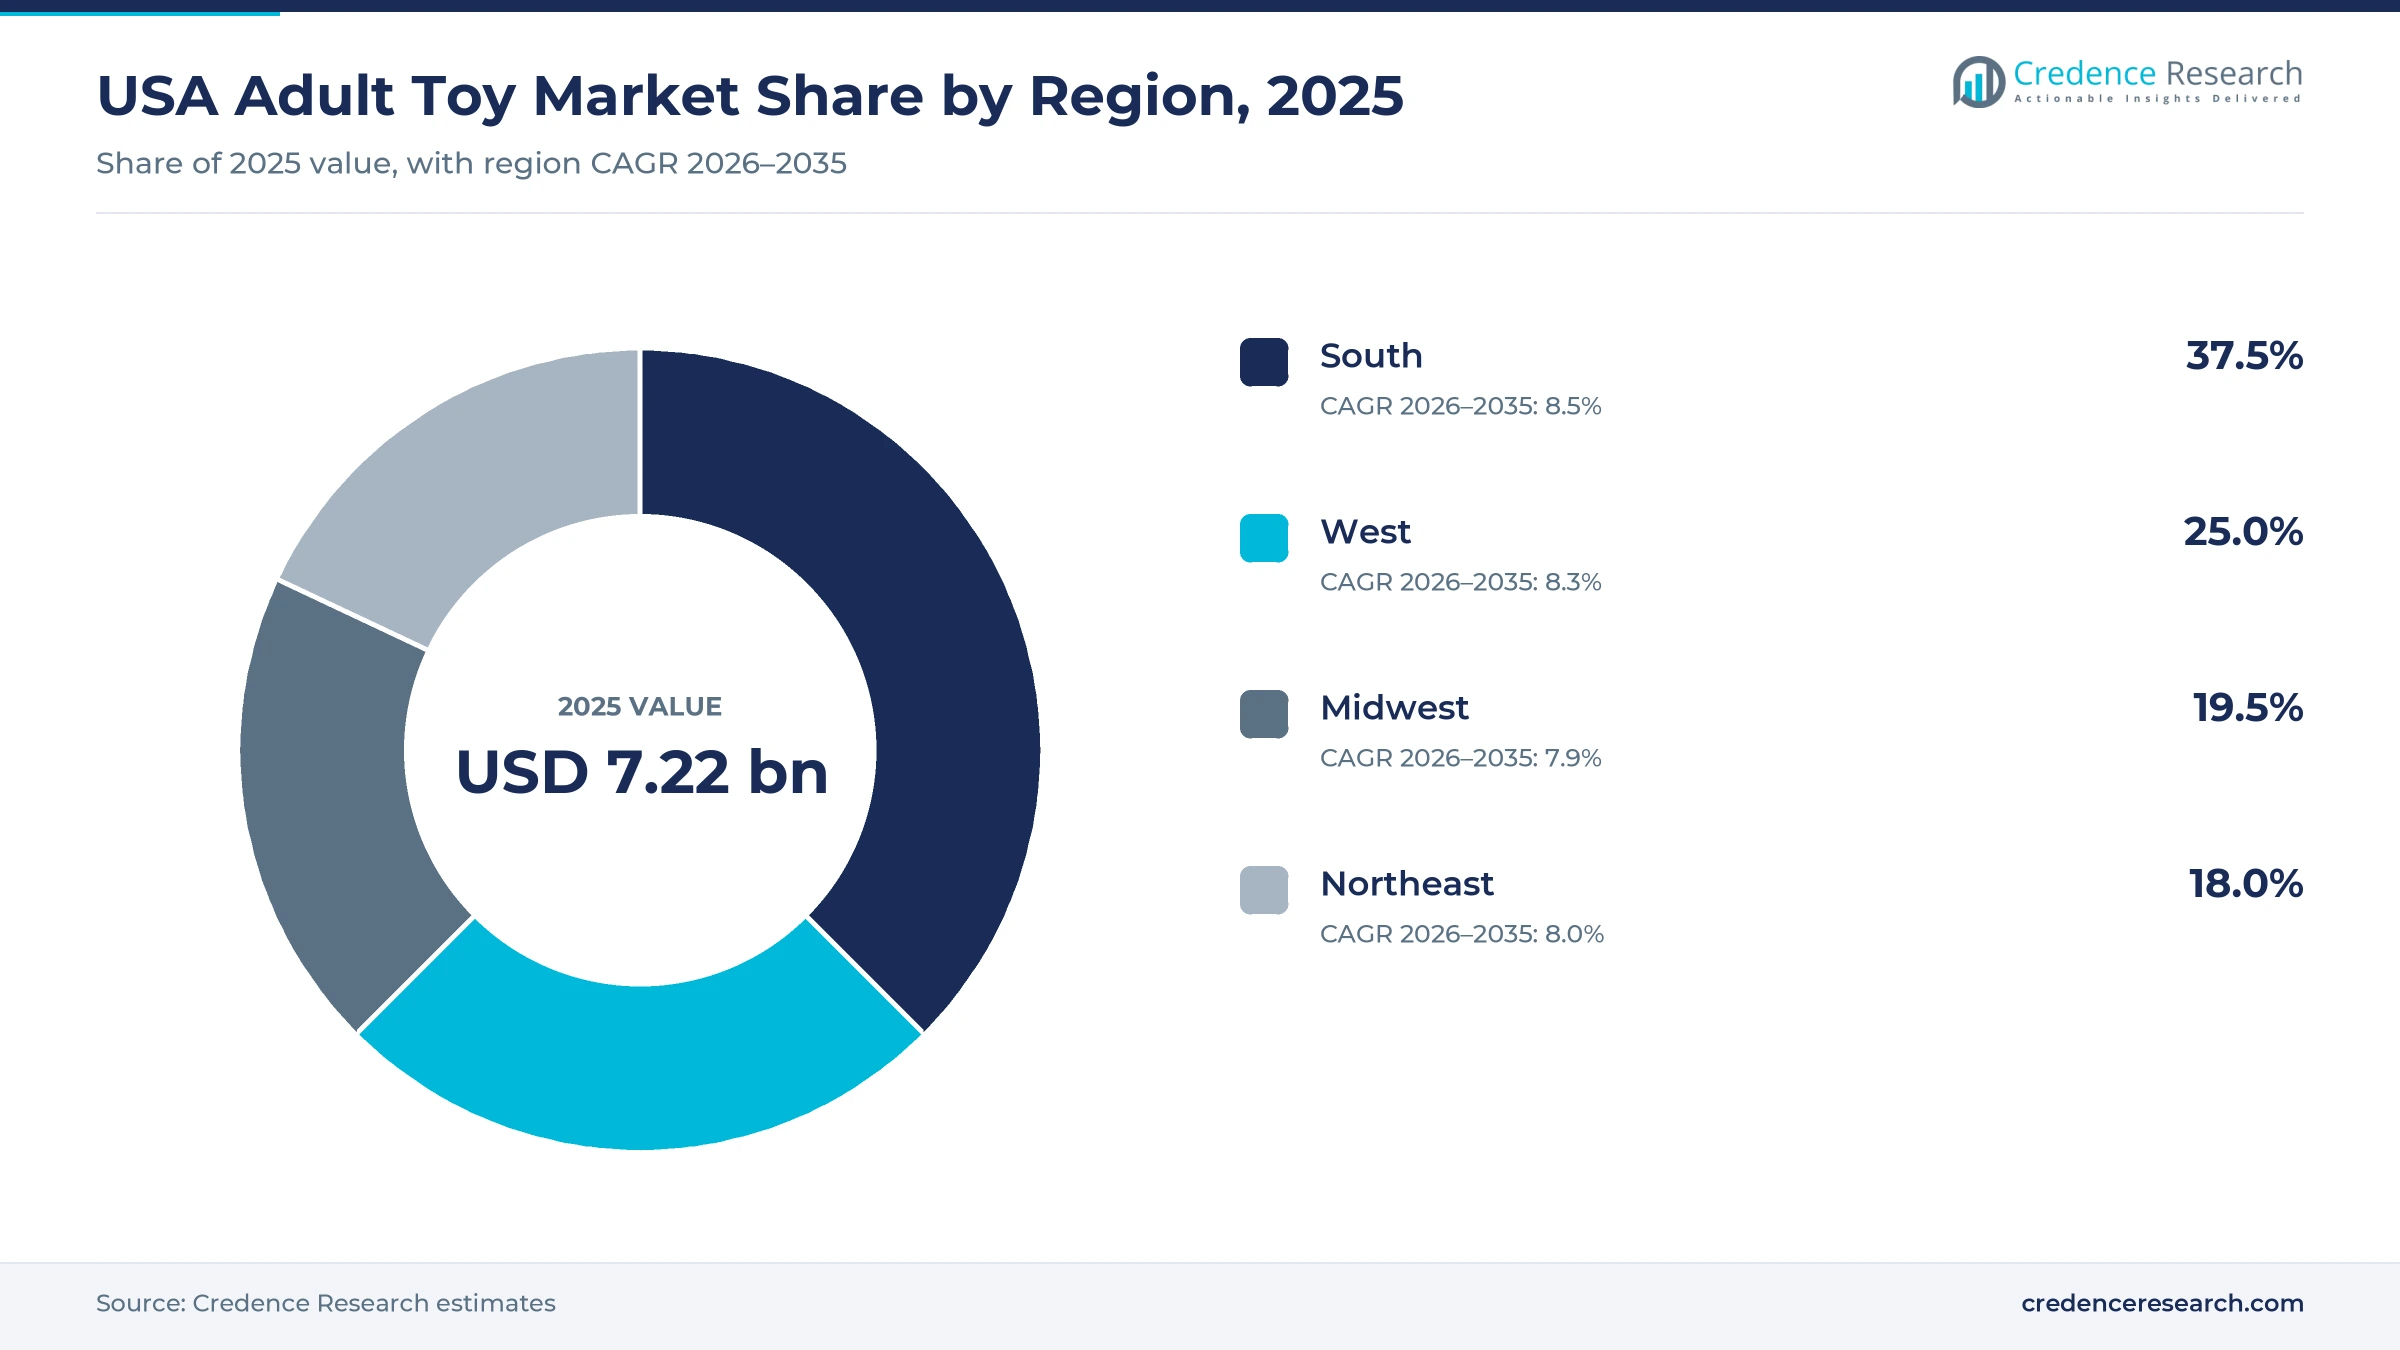
The South leads on population growth and store networks
| Region | Value, 2025 (USD billion) | Share, 2025 | CAGR, 2026–2035 |
|---|---|---|---|
| South | 2.71 | 37.5% | 8.5% |
| West | 1.81 | 25.0% | 8.3% |
| Midwest | 1.41 | 19.5% | 7.9% |
| Northeast | 1.30 | 18.0% | 8.0% |
The South leads as its adult population grows fastest
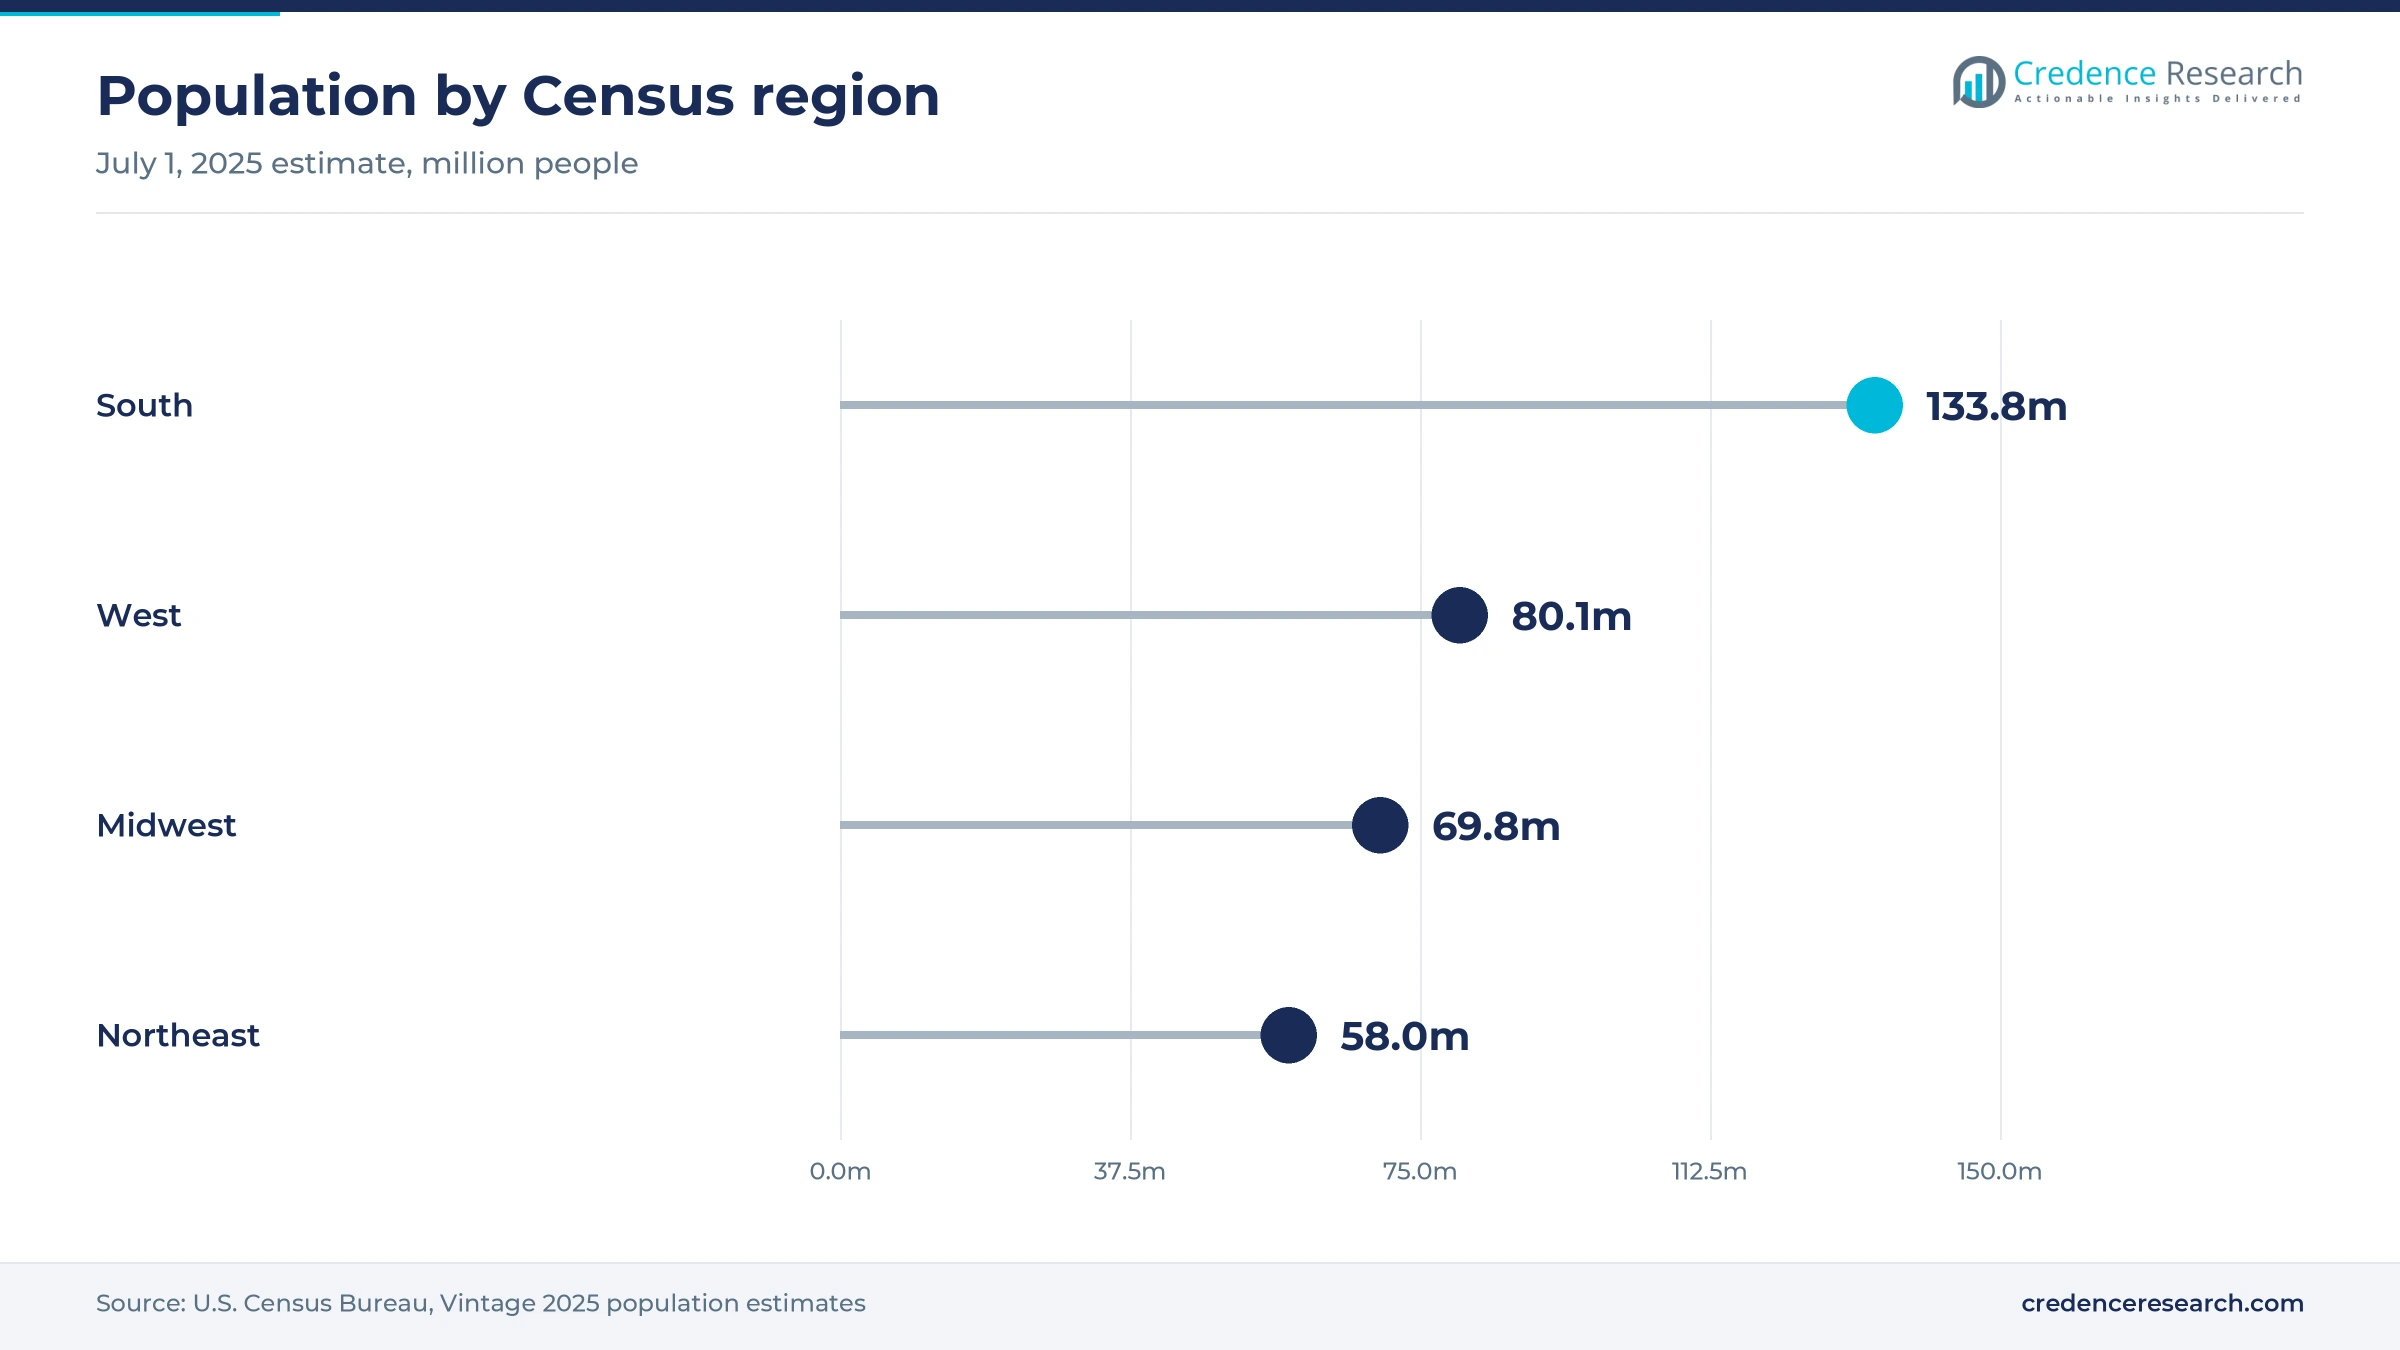
The South held 37.5% of 2025 value and grows at 8.5% a year, the fastest of the four regions. The Census Bureau estimates its 2025 population at 133.8 million, and the region grew 6.0% from 2020 to 2025, nearly double the national 3.1%. Alabama is the exception, since its ban on selling devices marketed for genital stimulation has been enforced since the state supreme court upheld it on Sept. 11, 2009, so Alabama buyers rely on online orders.
The West spends more per buyer on premium brands
The West held 25.0% of 2025 value and grows at 8.3% a year, a share above its weight in the U.S. population in 2025, based on Census Bureau estimates. Higher incomes in coastal metros support premium and wellness-branded devices, and the Erewhon launch of maude products in Los Angeles shows how wellness grocers now carry the category. The region also hosts domestic makers such as Doc Johnson in North Hollywood, which keeps short supply lines to western retailers.
The Midwest relies on mass retail and online orders
The Midwest held 19.5% of 2025 value and grows at 7.9% a year, the slowest of the four regions. Its population rose only 0.35% in 2025 to 69.8 million, according to Census Bureau estimates, which limits the number of new buyers. Smaller cities have fewer specialty stores, so mass retailers, drugstores and online sellers carry a larger part of sales. Entry and mid-range devices therefore make up more of regional spending than in the coastal regions.
The Northeast grows through higher spending per buyer
The Northeast held 18.0% of 2025 value and grows at 8.0% a year. Its population of 58.0 million grew just 0.18% in 2025, the slowest of any region according to Census Bureau estimates, so value growth depends on higher spending per buyer. Its value share sits above its roughly 17% population share because dense cities support boutiques and fast delivery. Church & Dwight, which sells Trojan vibrators nationally alongside non-latex condoms and other sexual health lines, is headquartered in Ewing, New Jersey.
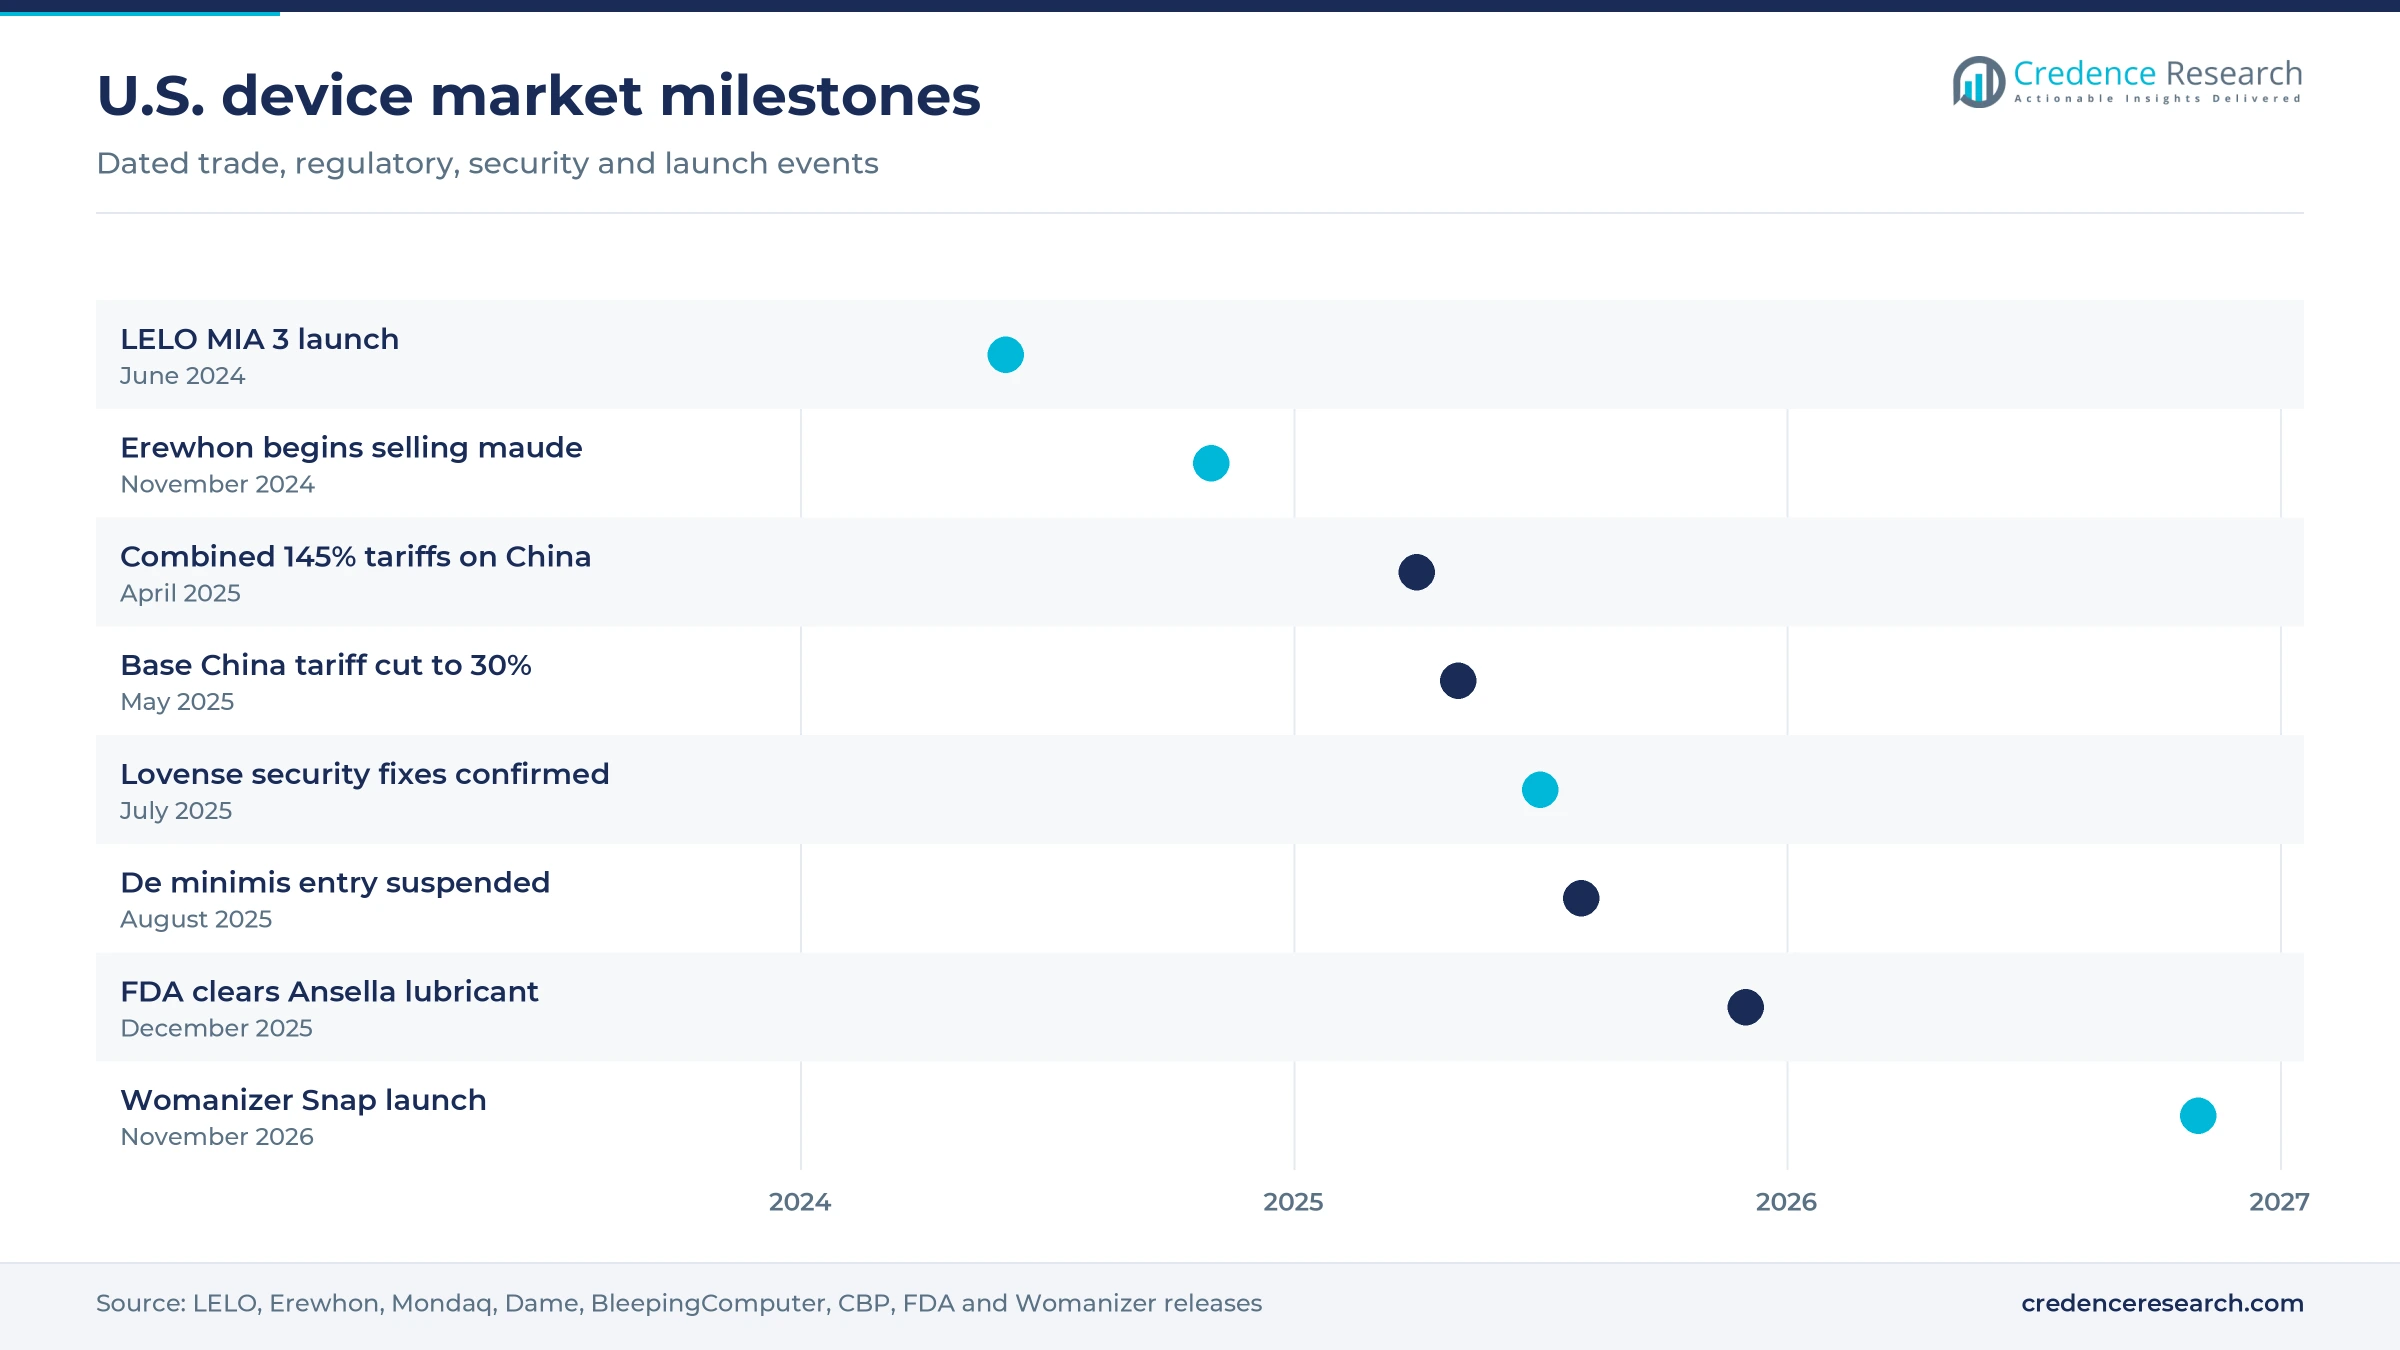
Launches, security fixes and retail deals, 2024 to 2026
| Development | Status and market relevance |
|---|---|
| In June 2024, LELO launched the MIA 3 lipstick-style vibrator at a recommended retail price of USD 99. | Launched; compact premium format |
| In November 2024, Erewhon began selling maude sexual wellness products in its Los Angeles stores. | Rolled out; wellness grocery channel |
| In July 2025, Lovense completed fixes for two account security flaws first reported in March 2025. | Fixed; connected device security |
| In November 2026, Womanizer launched Snap, its smallest model, with a charging case and a five-year warranty. | Launched; travel-ready premium device |
| In November 2026, Adam & Eve and Lovehoney Group launched exclusive coral device editions and a holiday advent calendar. | Launched; retailer-exclusive editions |
Air-pulse, sonic and app control set product tiers
- Air-pulse stimulation uses pressure waves instead of direct vibration, and Womanizer builds its Pleasure Air Technology into models as small as the 2026 Snap.
- Sonic motors move low-frequency sound waves through the device, which LELO uses in its SONA line to set a premium price tier.
- Bluetooth and app control let partners adjust a device from a phone or from another city, and they also create the data security duties that connected brands must meet.
- Sealed silicone and USB charging give waterproof, easy-to-clean bodies that suit personal massagers for women and reduce battery waste for buyers.
Need a Custom Version of This Report?
Tailor the scope, geography, or segments to your exact requirements.
- Custom geography or segment scope
- Direct access to our analyst team
Brand owners, franchise chains and health firms compete
Competition turns on who owns the buyer relationship online and who controls shelf space in stores. PHE Inc. runs AdamEve.com and the Adam & Eve franchise chain, and it partners with brand owners on exclusive editions. LELO, Lovehoney Group with Womanizer and its couples-device brands, and Lovense compete in premium powered and connected devices, while TENGA leads in reusable male devices sold through marketplaces. Church & Dwight uses the Trojan name to place entry vibrators in mass retail and drugstores. Dame Products and maude position devices as wellness products for beauty and grocery channels. Doc Johnson and CalExotics supply wide catalogs to specialty stores through distributors. Price competition is sharpest in entry devices on marketplaces, while premium brands compete on design, warranties and trust in materials and data handling.
Brand owners, distributors and retailers form three tiers
The U.S. supply side has three distinct tiers with different economics. Brand owners such as LELO, Lovehoney Group, Dame and maude design products and mostly contract manufacturing in China, as Dame confirmed for its own devices in May 2025, while Doc Johnson and CalExotics also run large catalogs for wholesale. Distributors such as Nalpac supply independent stores with catalogs from many brands. Retail is split among large online sellers, franchise chains such as Adam & Eve and general retailers. Margins are highest for brands that sell direct, and entry barriers rise sharply for powered and connected devices that need firmware, testing and warranty support.
Companies profiled and their roles in this market
| Company | Type | Role in the market |
|---|---|---|
| PHE Inc. / Adam & Eve | Online retailer and franchisor | Launched exclusive device editions with Lovehoney Group in November 2026 |
| LELO | Premium device brand | Sells SONA stimulators at Target and launched MIA 3 in June 2024 |
| Doc Johnson Enterprises | Domestic maker and wholesaler | Headquartered in North Hollywood, California |
| Lovehoney Group | Device brand owner (Womanizer and couples brands) | Launched Womanizer Snap in November 2026 |
| Church & Dwight / Trojan | Consumer health company | Sells Trojan vibrators alongside condoms and lubricants |
| Lovense | Connected device brand | Fixed account security flaws in July 2025 |
| CalExotics | Device maker and wholesaler | Added three Pleasure Kits in November 2026 |
| TENGA | Male device brand | Sells reusable strokers through the Walmart.com marketplace |
| Dame Products | Wellness device brand | Tested and removed a tariff surcharge in May 2025 |
| Maude | Intimate wellness brand | Entered Erewhon stores in Los Angeles in November 2024 |
Mainstream shelves, not new technology alone, carry growth
Credence Research's view is that U.S. device spending will grow mainly because the category is moving onto mainstream shelves and into wellness language, not because of new technology alone. Online buying remains the base, but mass retailers, drugstores and grocers now reach shoppers who never visited specialty stores. Trade costs are the main risk, since most devices are made in China and de minimis relief has ended. The strongest positions belong to brands that combine trusted materials, secure apps, U.S. inventory and retail partnerships, because they can hold prices when import costs swing.
Adult buyer counts and shelf prices anchor the estimate
The report uses 2025 as the base year and 2026 to 2035 as the forecast period. Market values come from the Credence Research model, which builds spending from Census Bureau adult population estimates, published survey data on device ownership and use, and current shelf prices at major retailers. Segment and regional splits are Credence Research estimates built from Census Bureau population and retail data, FDA device classifications, U.S. Customs and Border Protection guidance, company filings and announcements, academic studies and retailer price lists. No interviews or primary surveys were conducted for this edition.
Device spending doubles as buyers trade up to 2035
The USA adult toy market is expected to grow from USD 7.84 billion in 2026 to USD 16.01 billion by 2035 at an 8.26% CAGR. Online sellers will stay the main channel, while mass retailers and drugstores gain ground as devices sit beside condoms and lubricants. Connected devices will grow fastest if makers keep data secure, and care products will rise with every device sold. The South will add the most new buyers as its population grows. By 2035, more U.S. adults are likely to buy devices through the same stores and apps they use for other health and beauty products.
Trade costs and mainstream shelf space set the 2035 range
The range of outcomes depends on how tariffs on Chinese-made devices settle and on how far general retailers expand their device ranges. A downside case assumes renewed high tariffs, a serious connected device data breach and slower mass retail adoption. The base case assumes steady online growth and gradual shelf gains in drugstores and big-box stores. An upside case needs stable trade costs, wider health-channel positioning for older buyers and faster trading up to premium devices.
| Scenario | CAGR, 2026–2035 | Value, 2035 | What has to hold |
|---|---|---|---|
| Downside | 6.5% | USD 13.77 billion | Tariffs rise again, a data breach hits trust and mass retailers hold back |
| Base | 8.26% | USD 16.01 billion | Online sales keep growing and drugstores and big-box stores add shelf space gradually |
| Upside | 9.7% | USD 17.97 billion | Trade costs settle, health channels reach older buyers and premium devices spread |
Frequently Asked Questions
How big is the USA adult toy market?
Which product type leads U.S. device spending?
Which U.S. region leads the market?
Which technology grows fastest?
How did tariffs affect U.S. device prices?
Are adult devices regulated by the FDA?
Who are the key companies in the USA adult toy market?
What do adult devices cost in the United States?
Table of Content
Chapter 1 Market Segmentation
- 1.1 Segmentation Framework
- 1.1.1 Product and Service Classification
- 1.1.2 Application and End-Use Classification
- 1.1.3 Technology and Solution Classification
- 1.1.4 Customer and Distribution Channel Classification
- 1.1.5 Geographic Segmentation
- 1.1.6 Market Segment Definitions and Boundaries
- 1.2 By Product Type
- 1.2.1 Vibrators
- 1.2.2 Male Masturbators
- 1.2.3 Non-Vibrating Devices and Dolls
- 1.2.4 Couples Devices and Accessories
- 1.3 By Application
- 1.3.1 Solo Pleasure
- 1.3.2 Partnered Pleasure
- 1.3.3 Product Care and Complementary Use
- 1.4 By Technology
- 1.4.1 Passive Products
- 1.4.2 Standalone Powered Devices
- 1.4.3 Connected Devices
Chapter 2 Introduction
- 2.1 Report Objectives and Scope
- 2.2 Product Definition and Industry Terminology
- 2.3 Market Inclusions and Exclusions
- 2.4 Research Process
- 2.4.1 Primary Research and Expert Interviews
- 2.4.2 Secondary Research and Source Review
- 2.4.3 Top-Down and Bottom-Up Estimation
- 2.4.4 Data Triangulation and Verification
- 2.5 Market Size Measurement Basis
- 2.5.1 2025: USD 7.22 billion → 2035: USD 16.01 billion
- 2.6 Historical and Forecast Reference Periods
- 2.6.1 Historical Period: 2018-2025
- 2.6.2 Base Year: 2025
- 2.6.3 Forecast Period: 2025-2035
- 2.7 Research Assumptions and Limitations
Chapter 3 Executive Summary
- 3.1 Market Snapshot and Key Findings
- 3.2 Base-Year Market Size, 2025
- 3.3 Forecast Market Size, 2035
- 3.4 Revenue and Volume Growth Outlook
- 3.5 Key Demand and Supply Indicators
- 3.6 Leading Market Segments
- 3.7 Fastest-Growing Market Opportunities
- 3.8 Regional Performance Highlights
- 3.9 Technology and Industry Transformation
- 3.10 Competitive Landscape Summary
- 3.11 Analyst View and Strategic Implications
Chapter 4 USA Adult Toy Market Trends and Developments
- 4.1 Historical Industry Development, 2018-2025
- 4.2 Recent Market Trends and Developments
- 4.3 Demand and Customer Behavior Trends
- 4.4 Technology and Product Innovation
- 4.5 Artificial Intelligence, Automation and Digitalization
- 4.6 Local Manufacturing and Supply Chain Realignment
- 4.7 Industry Partnerships, Mergers and Acquisitions
- 4.8 Sustainability and Circular Economy Developments
- 4.9 Government and Private Sector Investment Trends
- 4.10 Emerging Business Models and Commercialization
- 4.11 Industry Developments and Announcements
Chapter 5 USA Adult Toy Market Production, Supply and Demand Analysis
- 5.1 Demand Trend and Consumption Analysis, 2018-2025
- 5.2 Demand Forecast, 2025-2035
- 5.3 Production and Output Trend, 2018-2025
- 5.4 Production and Output Forecast, 2025-2035
- 5.5 Installed Capacity and Capacity Utilization
- 5.6 Company-Wise Production Plants and Statistics
- 5.6.1 Installed Production Capacity
- 5.6.2 Actual Production
- 5.6.3 Planned Capacity and Expansion Targets
- 5.7 Supply Chain Structure and Procurement Trends
- 5.8 Supply-Demand Gap and Bottlenecks
- 5.9 Import Dependence and Sourcing Structure
- 5.10 Contract Manufacturing and Outsourcing
- 5.11 Regional Supply and Demand Concentration
Chapter 6 USA Adult Toy Market Pricing Analysis
- 6.1 Pricing Structure and Measurement
- 6.2 Historical Pricing Trends, 2018-2025
- 6.3 Pricing Outlook, 2025-2035
- 6.4 Average Selling Price and Unit Economics
- 6.5 Pricing by Product and Market Segment
- 6.6 Geographic Pricing Differences
- 6.7 Key Input, Energy, Labor and Logistics Costs
- 6.8 Contract Pricing and Purchasing Models
- 6.9 Pricing Sensitivity and Competitive Positioning
- 6.10 Price, Margin and Profitability Implications
Chapter 7 USA Adult Toy Market Dynamics
- 7.1 Market Growth Drivers
- 7.1.1 Demand-Side Drivers
- 7.1.2 Technology and Innovation Drivers
- 7.1.3 Infrastructure and Investment Drivers
- 7.1.4 Regulatory and Policy Drivers
- 7.2 Market Restraints
- 7.2.1 Cost and Affordability Constraints
- 7.2.2 Technology and Adoption Barriers
- 7.2.3 Supply Chain and Operational Constraints
- 7.3 Market Challenges
- 7.3.1 Competitive Pressure and Margin Erosion
- 7.3.2 Skills, Infrastructure and Implementation Gaps
- 7.4 Emerging Market Opportunities
- 7.5 Market Dynamics Impact and Time-Horizon Assessment
Chapter 8 USA Adult Toy Value Chain Analysis
- 8.1 Industry Value Chain Overview
- 8.2 Upstream Suppliers and Critical Inputs
- 8.3 Technology and Component Providers
- 8.4 Manufacturing or Service Delivery
- 8.5 Distribution, Channel Partners and Integrators
- 8.6 Downstream Applications and End Users
- 8.7 Value Addition and Profit Pools
- 8.8 Vertical Integration and Outsourcing
- 8.9 Supplier Concentration and Risk
- 8.10 Supply Chain Localization and Resilience
Chapter 9 USA Adult Toy Market Regulations and Policies
- 9.1 Relevant Laws, Standards and Compliance Frameworks
- 9.2 Product, Service, Safety and Quality Requirements
- 9.3 Government Policies, Incentives and Subsidies
- 9.4 Imports, Exports and Trade Barriers
- 9.5 Public Procurement and Local Content Requirements
- 9.6 Environmental and Sustainability Compliance
- 9.7 Upcoming Policy Changes and Market Implications
Chapter 10 USA Adult Toy Market Hotspots and Opportunities
- 10.1 Market Opportunity Mapping and Growth Hotspots
- 10.2 High-Growth Applications and Customer Groups
- 10.3 Underserved Markets and White-Space Opportunities
- 10.4 Emerging Technology and Product Opportunities
- 10.5 New Capacity and Investment Hotspots
- 10.6 Market Entry and Expansion Opportunities
- 10.7 Distribution and Partnership Opportunities
- 10.8 Near-Term and Long-Term Commercial Potential
- 10.9 Opportunity Attractiveness and Execution Risks
Chapter 11 USA Adult Toy Market Outlook, 2025-2035
- 11.1 Market Size and Analysis
- 11.1.1 Revenue (Market Measurement: 2025: USD 7.22 billion → 2035: USD 16.01 billion)
- 11.1.2 Market Volume and Quantity Sold
- 11.1.3 Historical Market Size, 2018-2025
- 11.1.4 Base-Year Market Size, 2025
- 11.2 Market Forecast, 2025-2035
- 11.2.1 Revenue Forecast to 2035
- 11.2.2 Volume Forecast to 2035
- 11.2.3 CAGR and Year-on-Year Growth
- 11.2.4 Incremental Revenue Opportunity
- 11.3 Forecast Assumptions and Scenario Analysis
- 11.3.1 Base-Case Forecast
- 11.3.2 Optimistic and Conservative Scenarios
- 11.3.3 Technology, Pricing and Policy Sensitivities
- 11.4 Market Attractiveness and Growth Outlook
Chapter 12 USA Adult Toy Market Segmentation and Outlook
- 12.1 Segmentation Summary and Market Shares, 2025
- 12.2 Largest and Fastest-Growing Segments
- 12.3 By Product Type - Market Size and Forecast, 2025-2035
- 12.3.1 Segment Definition and Scope
- 12.3.2 Historical Market Size, 2018-2025
- 12.3.3 Revenue Forecast, 2025-2035
- 12.3.4 Volume Forecast, 2025-2035
- 12.3.5 Base-Year Market Share, 2025
- 12.3.6 Segment CAGR and Growth Drivers
- 12.3.7 Subsegment Market Size and Forecast
- 12.3.7.1 Vibrators
- 12.3.7.2 Male Masturbators
- 12.3.7.3 Non-Vibrating Devices and Dolls
- 12.3.7.4 Couples Devices and Accessories
- 12.3.8 Subsegment Pricing and Adoption Trends
- 12.3.9 Leading Suppliers and Competition
- 12.3.10 Regional Demand and Opportunities
- 12.4 By Application - Market Size and Forecast, 2025-2035
- 12.4.1 Segment Definition and Scope
- 12.4.2 Historical Market Size, 2018-2025
- 12.4.3 Revenue Forecast, 2025-2035
- 12.4.4 Volume Forecast, 2025-2035
- 12.4.5 Base-Year Market Share, 2025
- 12.4.6 Segment CAGR and Growth Drivers
- 12.4.7 Subsegment Market Size and Forecast
- 12.4.7.1 Solo Pleasure
- 12.4.7.2 Partnered Pleasure
- 12.4.7.3 Product Care and Complementary Use
- 12.4.8 Subsegment Pricing and Adoption Trends
- 12.4.9 Leading Suppliers and Competition
- 12.4.10 Regional Demand and Opportunities
- 12.5 By Technology - Market Size and Forecast, 2025-2035
- 12.5.1 Segment Definition and Scope
- 12.5.2 Historical Market Size, 2018-2025
- 12.5.3 Revenue Forecast, 2025-2035
- 12.5.4 Volume Forecast, 2025-2035
- 12.5.5 Base-Year Market Share, 2025
- 12.5.6 Segment CAGR and Growth Drivers
- 12.5.7 Subsegment Market Size and Forecast
- 12.5.7.1 Passive Products
- 12.5.7.2 Standalone Powered Devices
- 12.5.7.3 Connected Devices
- 12.5.8 Subsegment Pricing and Adoption Trends
- 12.5.9 Leading Suppliers and Competition
- 12.5.10 Regional Demand and Opportunities
- 12.6 Segment Growth Comparison
- 12.7 Segment Attractiveness and Priority Matrix
Chapter 13 USA Adult Toy End-Use and Application Market Outlook
- 13.1 End-Use Industry and Customer Demand Structure
- 13.2 Leading Applications and Customer Groups
- 13.3 End-Use Market Size, Share and Forecast
- 13.4 Major End-Use Industry Deep Dives
- 13.4.1 Customer Requirements and Use Cases
- 13.4.2 Demand and Replacement Cycles
- 13.4.3 Technical and Regulatory Considerations
- 13.4.4 Purchasing and Procurement Models
- 13.4.5 Leading Vendors and Distribution Channels
- 13.4.6 Forecast and Commercial Opportunities
- 13.5 Emerging Applications and Cross-Segment Demand
- 13.6 End-Use Industry Investment Priorities
Chapter 14 USA Adult Toy Geographic Market Outlook, 2025-2035
- 14.1 Domestic Market Distribution and Demand Clusters
- 14.2 State- or Province-Wise Market Size and Forecast, 2025-2035
- 14.3 City and Metropolitan Market Outlook
- 14.4 Industrial, Manufacturing and Commercial Clusters
- 14.5 Geographic Concentration of Key End Users
- 14.6 Local Pricing and Purchasing Differences
- 14.7 Domestic Production Facilities and Capacity Map
- 14.8 Local Infrastructure and Project Pipeline
- 14.9 State-Level Policy and Incentive Differences
- 14.10 Subnational Investment Hotspots and Opportunities
- 14.11 Distribution and Logistics Networks
- 14.12 Domestic Competitive Footprint
Chapter 15 USA Adult Toy Technology, Innovation and Sustainability Outlook
- 15.1 Technology Landscape and Maturity
- 15.2 Product, Process and Service Innovation
- 15.3 AI, Automation and Digital Tools in the Industry
- 15.4 Technology Adoption and Performance Benchmarking
- 15.5 Innovation Pipeline and R&D Investment
- 15.6 Patent and Intellectual Property Trends
- 15.7 Energy Efficiency and Resource Management
- 15.8 Sustainability, Recycling and Circularity
- 15.9 Technology Roadmap, 2025-2035
- 15.10 Risks of Obsolescence and Technology Substitution
Chapter 16 USA Adult Toy Market Key Strategic Imperatives
- 16.1 Growth and Market Entry Priorities
- 16.2 High-Return Products and Segments
- 16.3 Pricing, Profitability and Cost Optimization
- 16.4 Technology Investment and Product Differentiation
- 16.5 Supply Chain Localization and Resilience
- 16.6 Distribution and Customer Acquisition
- 16.7 Partnership, Acquisition and Capacity Strategy
- 16.8 Regional Expansion Priorities
- 16.9 Short-, Medium- and Long-Term Actions
Chapter 17 Competition Outlook
- 17.1 Industry Competition Characteristics
- 17.2 Market Structure and Concentration
- 17.3 Market Share and Competitive Positioning, 2025
- 17.4 Company-Wise Revenue and Product Benchmarking
- 17.5 Production and Service Capacity Benchmarking
- 17.6 Technology, Pricing and Differentiation
- 17.7 Regional Footprint and Distribution Strength
- 17.8 Mergers, Acquisitions and Strategic Alliances
- 17.9 New Entrants and Competitive Threats
- 17.10 Porter's Five Forces and Industry Attractiveness
- 17.11 Competitive Outlook, 2025-2035
Chapter 18 Company Profiles
- 18.1 Company Coverage and Selection Criteria
- 18.2 PHE Inc. / Adam & Eve
- 18.2.1 Business Description
- 18.2.2 Company Ownership and Geographic Presence
- 18.2.3 Product and Service Portfolio
- 18.2.4 Manufacturing and Operating Footprint
- 18.2.5 Production Capacity and Expansion Plans
- 18.2.6 Financial Performance and Investment
- 18.2.7 Market Share and Competitive Position
- 18.2.8 Technology and Innovation Capabilities
- 18.2.9 Strategic Alliances or Partnerships
- 18.2.10 Recent Developments
- 18.2.11 Growth Strategy and Outlook
- 18.3 LELO
- 18.4 Doc Johnson Enterprises
- 18.5 Lovehoney Group
- 18.6 Church & Dwight / Trojan
- 18.7 Lovense
- 18.8 CalExotics
- 18.9 TENGA
- 18.10 Dame Products
- 18.11 Maude
- 18.12 Other Relevant Market Participants
Note: Every listed company is profiled on the structure shown under the first company. The company list is preliminary and may change based on research findings, market developments, data availability and client requirements.
Chapter 19 Disclaimer
- 19.1 Research and Forecast Disclaimer
- 19.2 Data Source and Estimation Limitations
Note: The depth of individual sections depends on data availability for this market. Volume, capacity, trade and other unit-based metrics are included where applicable.