Deferred mattress purchases set up a U.S. replacement wave
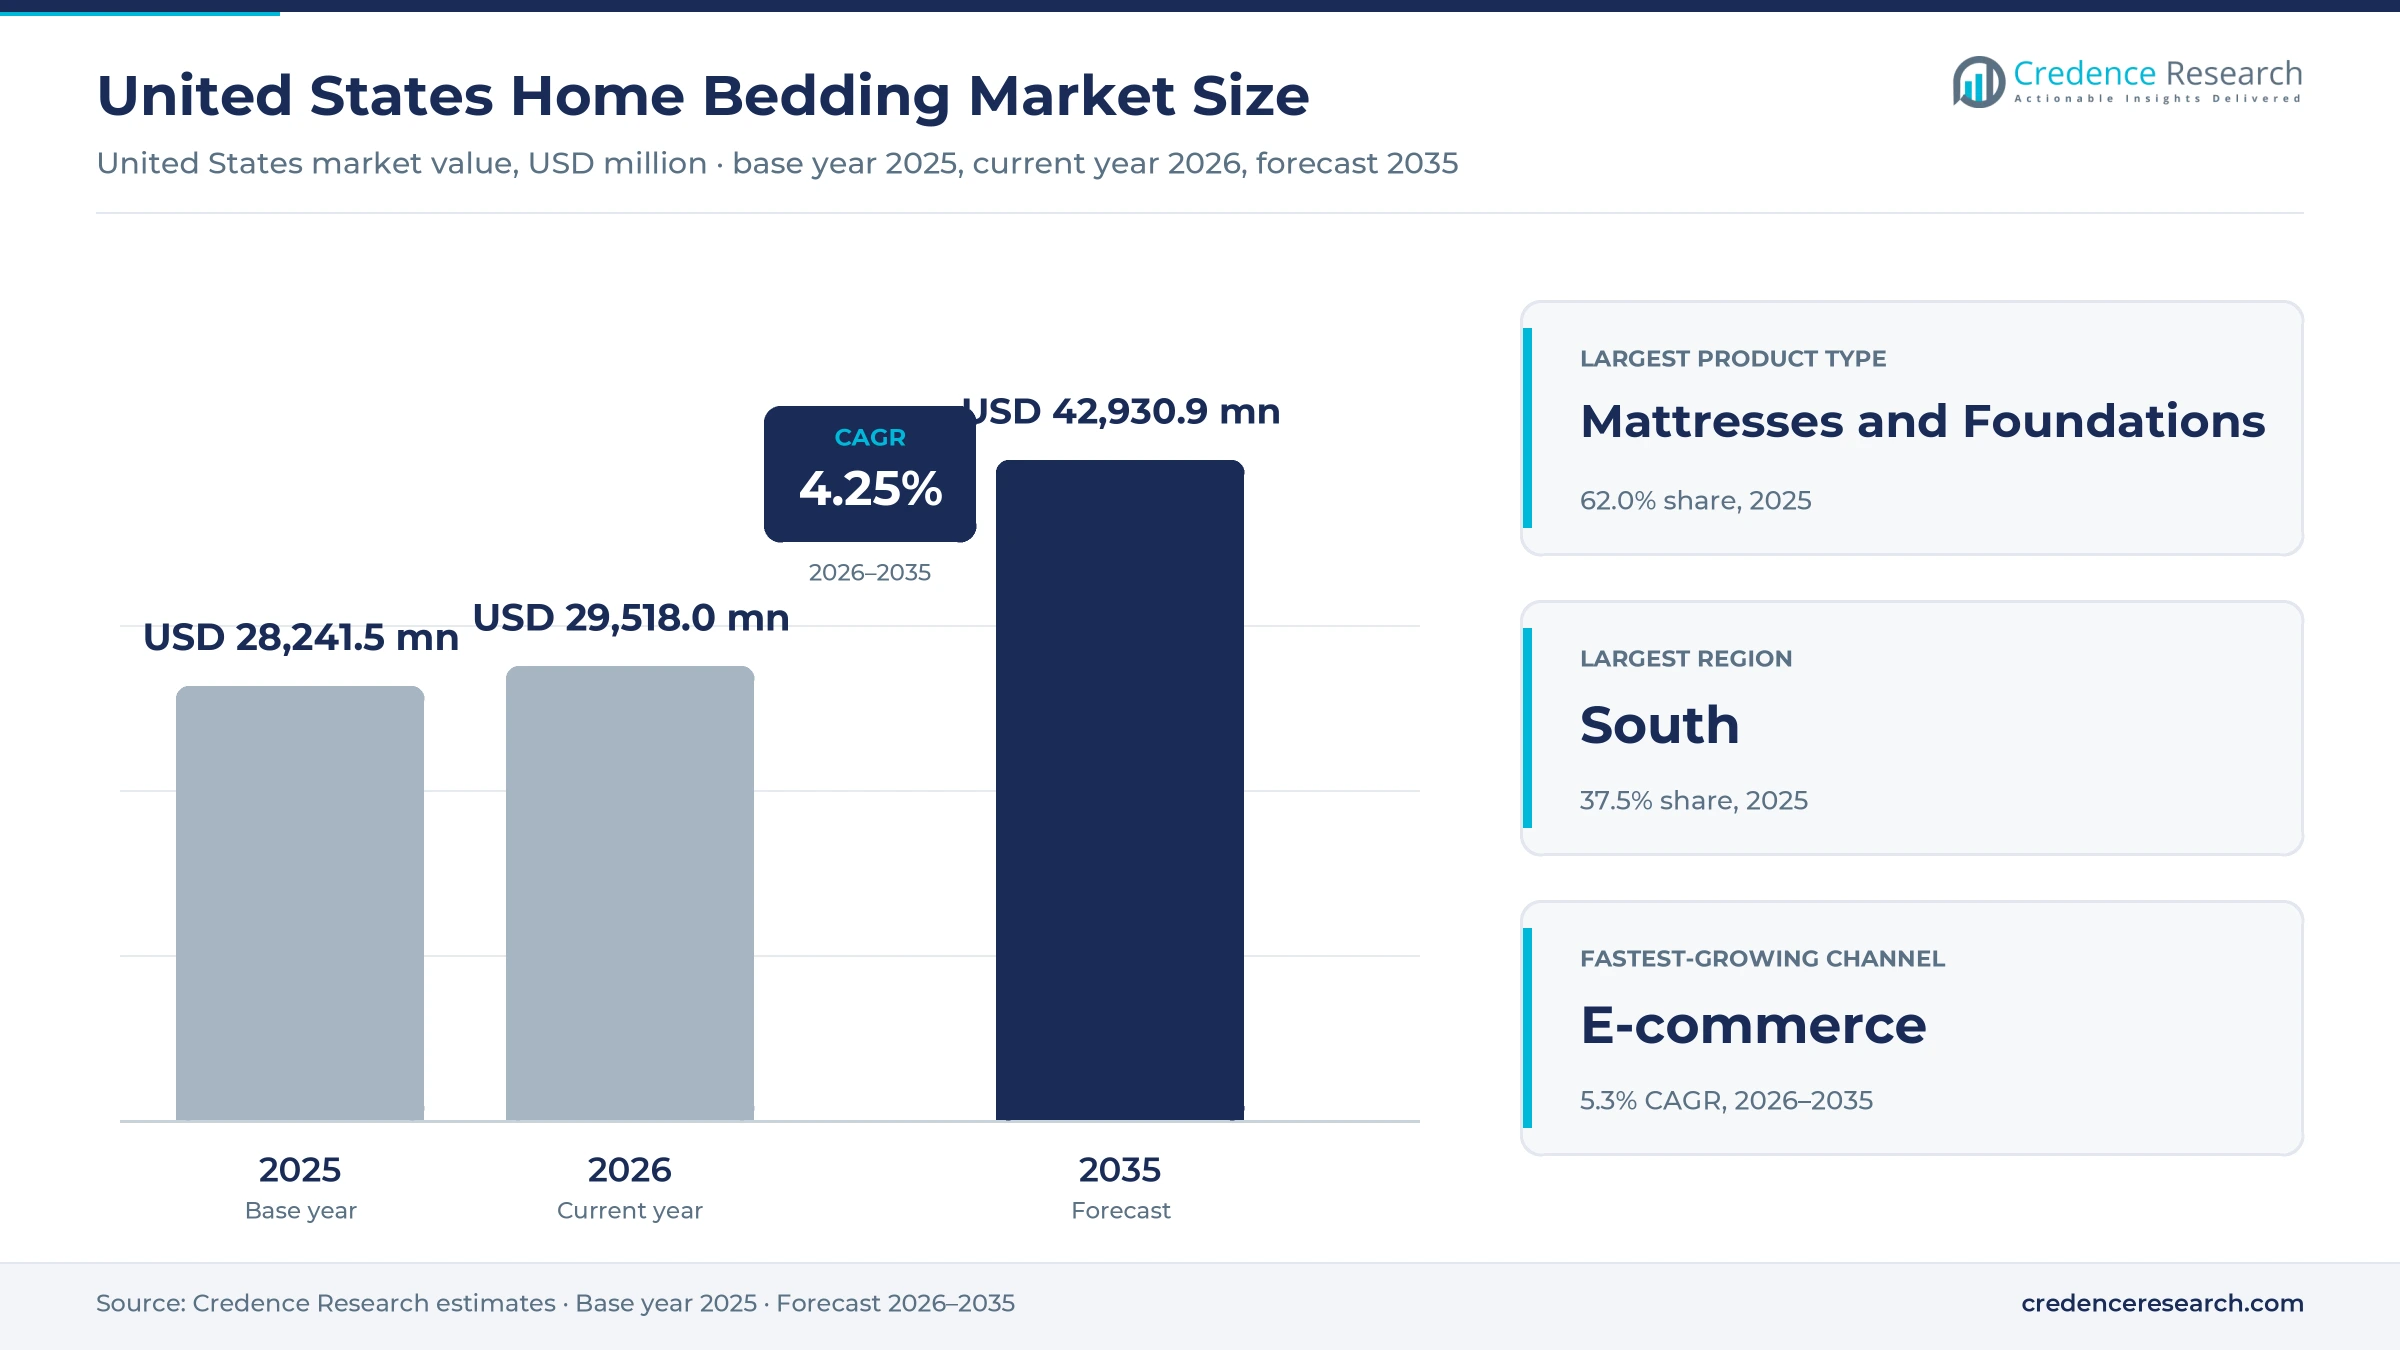
The United States home bedding market was valued at USD 28.24 billion in 2025 and is projected to increase from USD 29.52 billion in 2026 to USD 42.93 billion by 2035, registering a CAGR of 4.25% during 2026–2035. Spending is driven by households that postponed mattress purchases during a weak 2025, by new apartments and homes that need fully furnished bedrooms, and by shoppers who research online and then buy in stores, showrooms or marketplaces. The South held the largest regional share, 37.5% in 2025, and it is also the fastest-growing region at 4.6% a year because most new homes are completed there. Mattresses and foundations take most of the value, while protectors and pillows grow faster as buyers add accessories to each bed. Retail structure changed in February 2025, when the leading mattress maker completed its purchase of the largest specialty mattress chain.
Mattresses, linens, pillows and protectors bought for household beds
The market counts household spending on mattresses and foundations, sheets, pillowcases, duvet covers, comforters, quilts and blankets, pillows and other fill products, and mattress protectors, pads and toppers. Households buy them as single items, coordinated bedding sets or complete sleep system bundles through specialty mattress stores, department, mass and club retailers, and online stores of brands and marketplaces.
Bedding sold to hotels, hospitals, dormitories and other institutions is outside the scope, as are bed frames, headboards and adjustable bases sold without a mattress. The value chain runs from foam, spring, cotton and fiber suppliers through mattress makers and textile mills to brand owners, retailers and finally to households.
United States Home Bedding Market Insights
- The United States home bedding market grows from USD 28.24 billion in 2025 to USD 42.93 billion by 2035 at a 4.25% CAGR as mattress replacement recovers from a weak 2025.
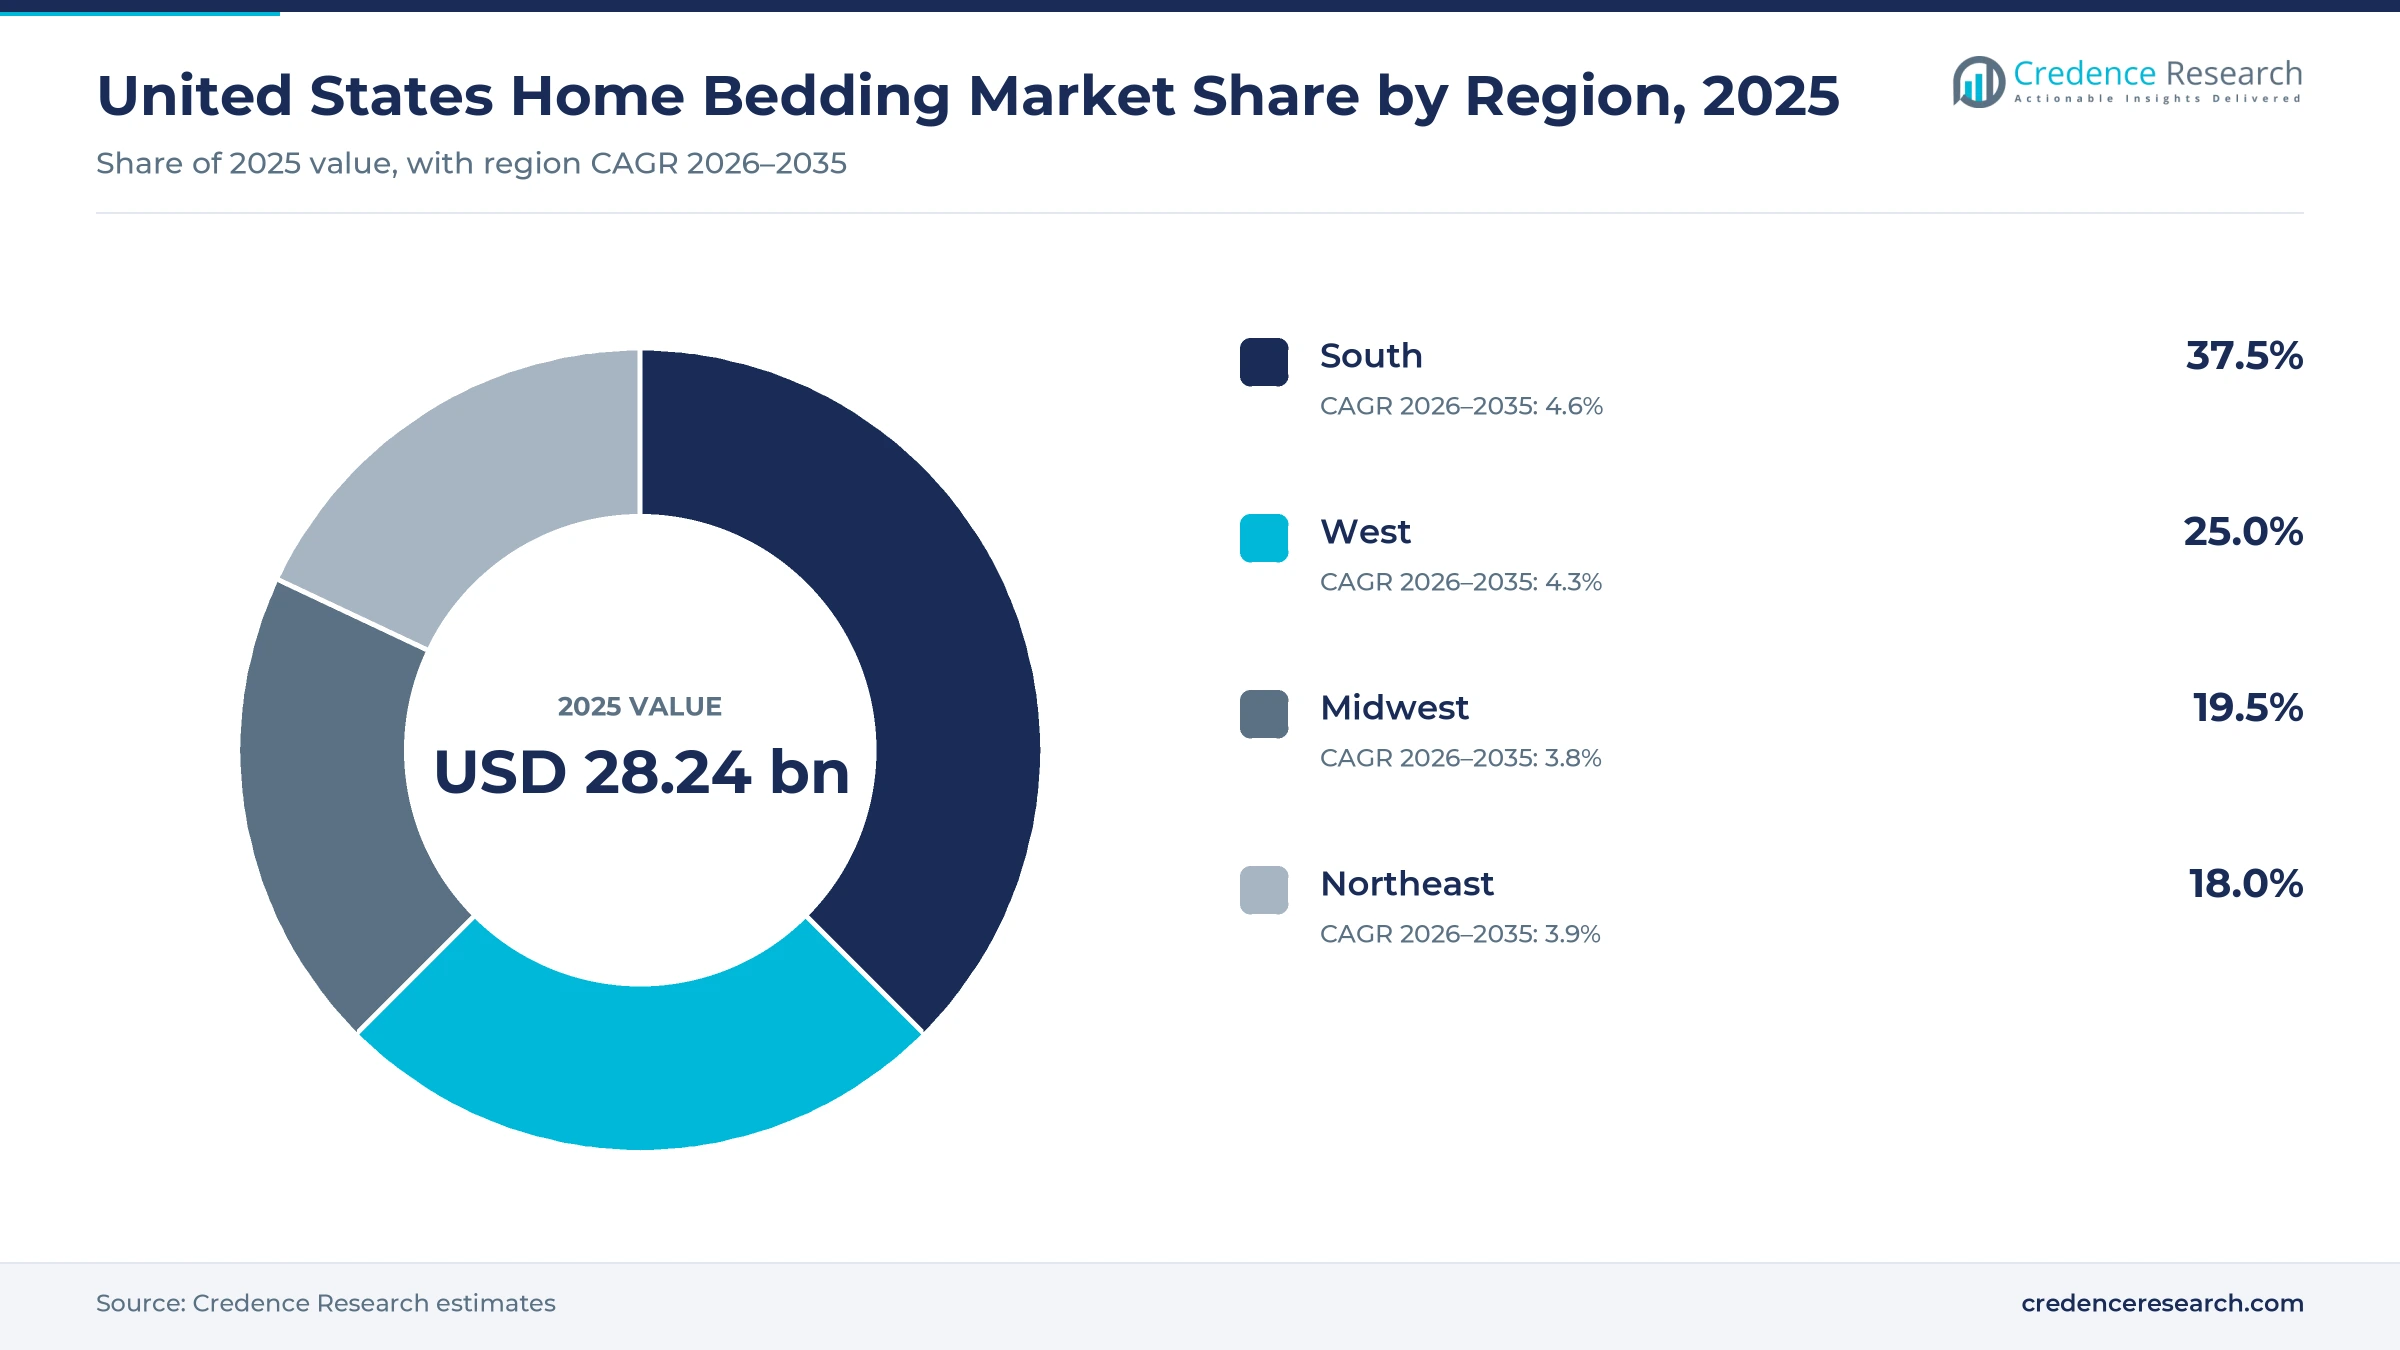
- The South held the largest regional share at 37.5% in 2025 and grows fastest at 4.6% a year, as most new U.S. housing units are completed there.
- Mattresses and foundations led with 62.0% of 2025 value, while mattress surface protection grows fastest at 5.4% a year.
- ISPA reported that U.S. mattress unit shipments fell 13.2% in 2025 while average selling prices rose, which leaves a backlog of delayed replacements.
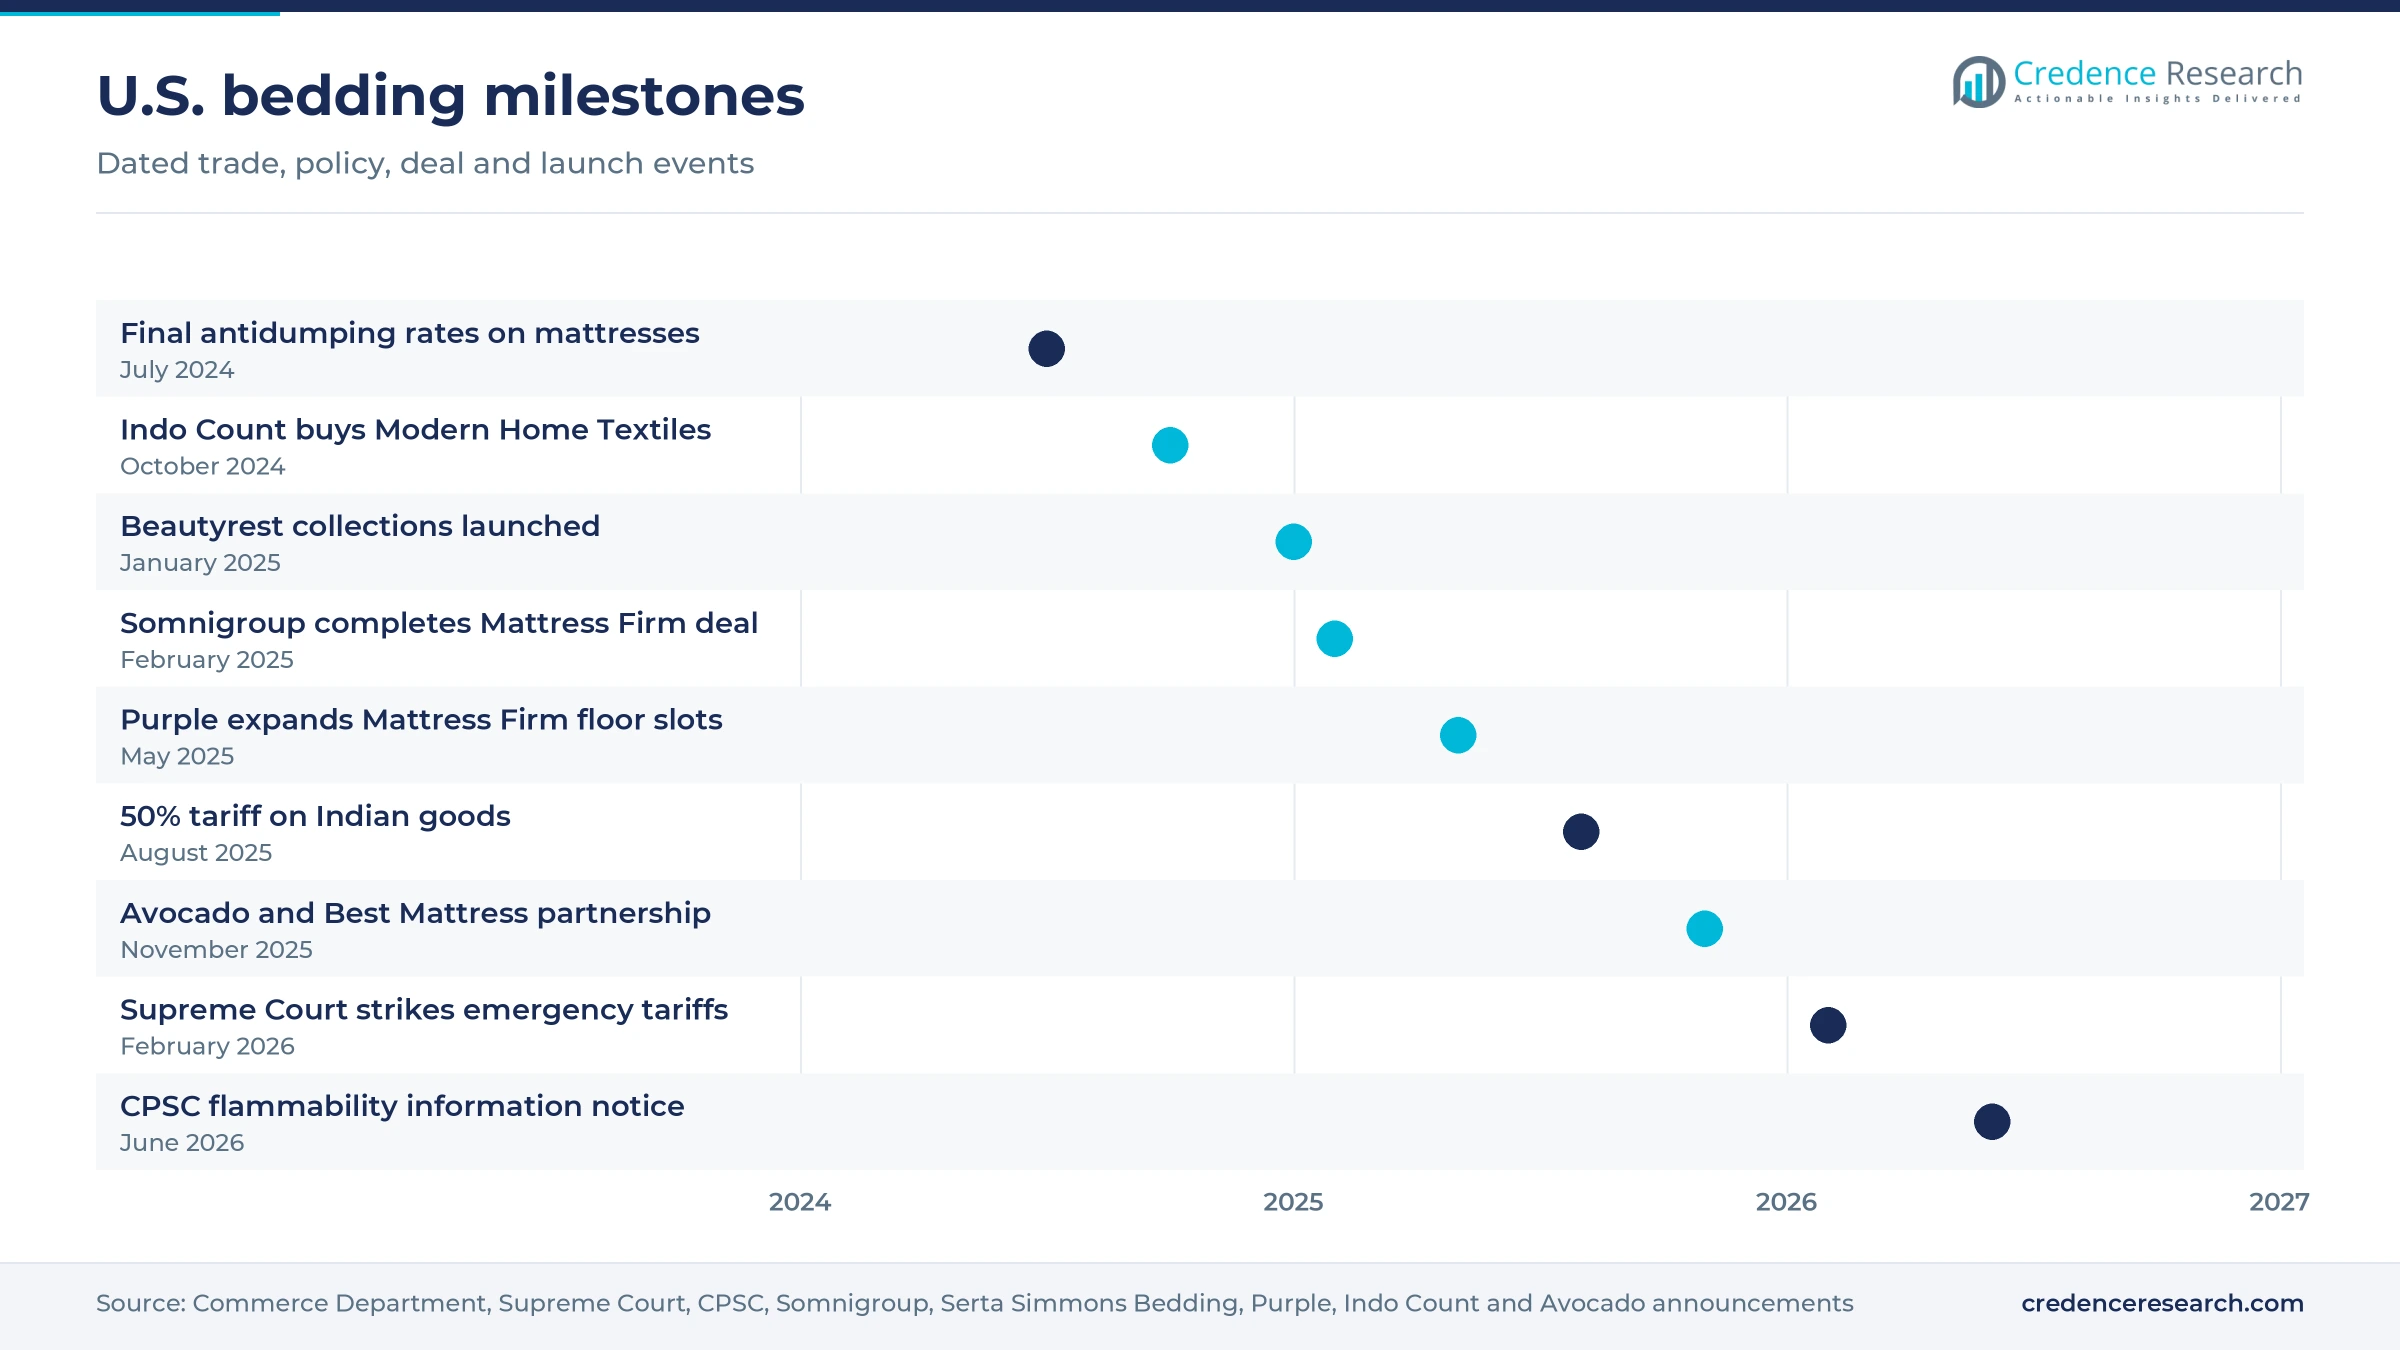
- Somnigroup completed its acquisition of Mattress Firm on Feb. 5, 2025, joining the largest mattress maker with the largest specialty chain.
Mattresses lead as protectors and online orders grow fastest
Mattresses hold the largest share as protectors grow fastest
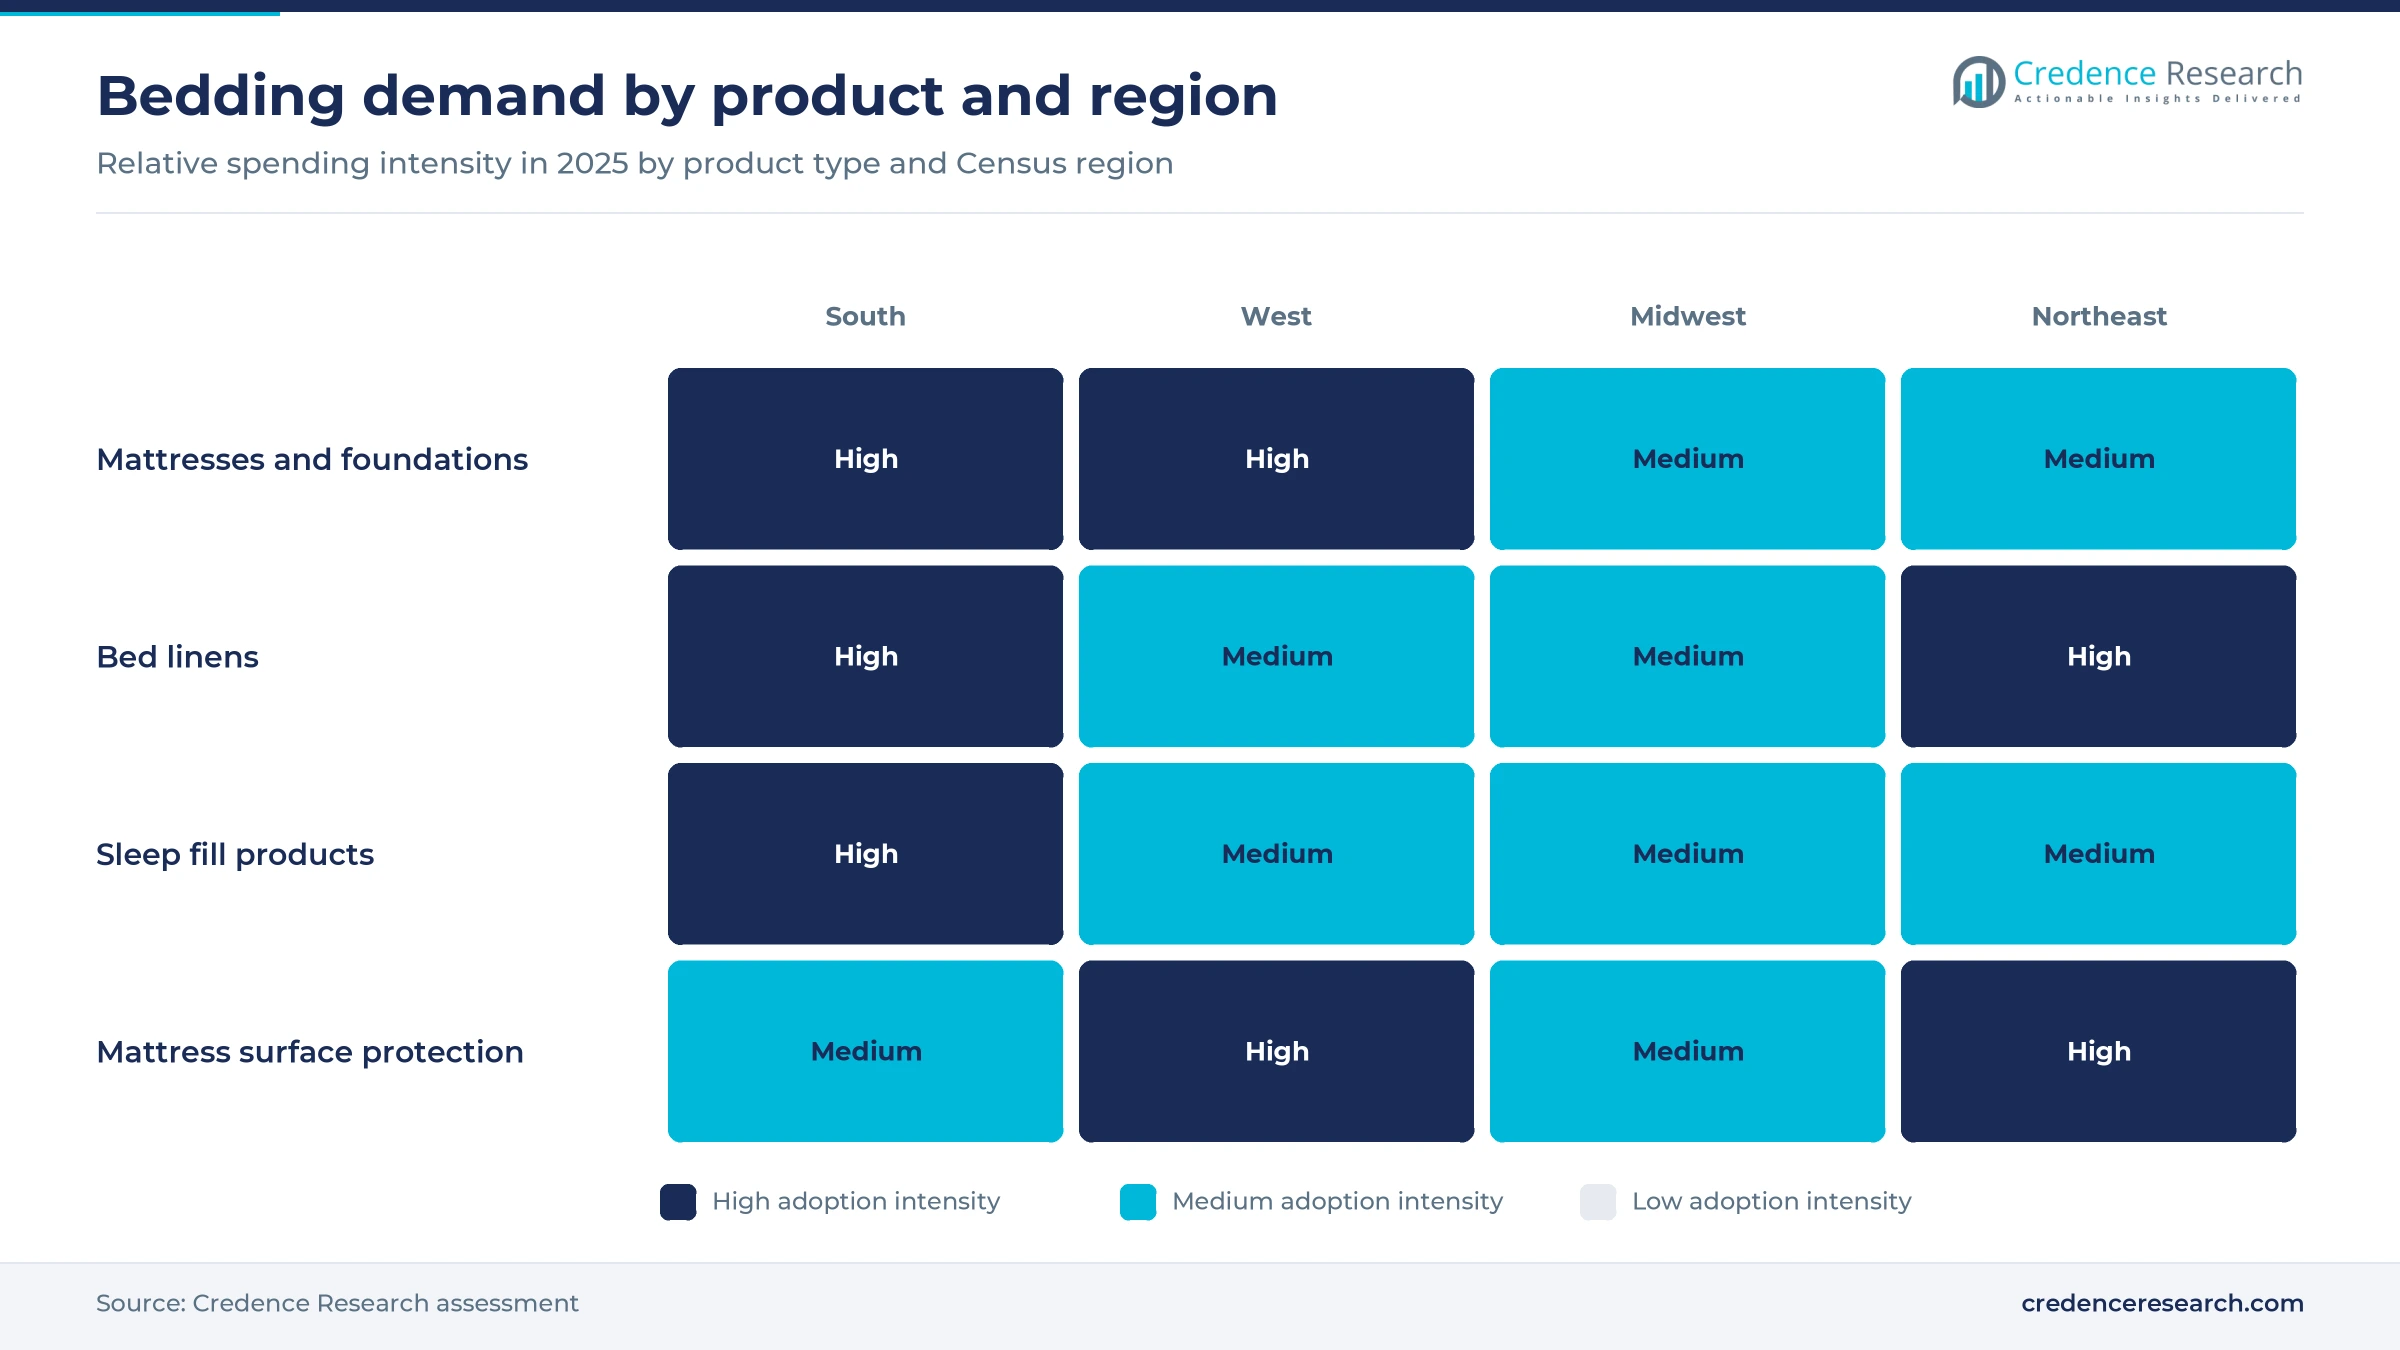
Based on product type, the market is categorized into mattresses and foundations, bed linens, sleep fill products and mattress surface protection. Mattresses and Foundations led with 62.0% of 2025 value because one mattress costs more than years of linens, and ISPA reported that average selling prices rose in 2025 as buyers chose larger sizes. Mattress Surface Protection grows fastest at 5.4% a year as protectors become a standard add-on to protect warranties, and Saatva lists a waterproof queen pad at USD 165. American Textile Company calls its AllerEase line the leading allergen bedding brand and planned significant added capacity in 2025. Suppliers of pads and protectors therefore gain from every mattress sale.
Routine replacement leads while new bedrooms grow fastest
Based on purchase occasion, the market is categorized into routine replacement, new bedroom setup and seasonal refresh. Routine Replacement led with 58.0% of 2025 value because most beds are bought to replace a worn one, and the 13.2% fall in 2025 unit shipments reported by ISPA shows how many households delayed that decision. New Bedroom Setup grows fastest at 4.9% a year as multifamily housing starts rose 18% in 2025, according to the Census Bureau and HUD. Those apartments reach completion through 2026 and 2027, when each one needs beds, linens and pillows at once.
Owner households lead as renters grow fastest
Based on customer type, the market is categorized into owner-occupier households, renter households and second-home households. Owner-occupier Households led with 66.0% of 2025 value because the Census Bureau counted 86.9 million owner households in the third quarter of 2025, and owners buy larger beds and premium mattresses more often. Renter Households grow fastest at 4.7% a year as the 46.2 million renter households counted in the same survey move more often and furnish new units. Renters favor boxed mattresses, value sets and delivery to apartments, so online and mass channels capture most of this growth.
Specialty stores lead as e-commerce grows fastest
Based on distribution channel, the market is categorized into specialty stores, mass and club retail and e-commerce. Specialty Stores led with 42.0% of 2025 value because shoppers still test mattresses before paying for them, and Mattress Firm alone operates more than 2,300 stores. E-commerce grows fastest at 5.3% a year, as online sales reached 17.1% of all U.S. retail sales in the second quarter of 2026, according to the Census Bureau. Sheets, pillows and protectors move online first because they ship easily, which leaves specialty stores most reliant on mattresses.
| Segment Group | Leading Sub-segment | Share, 2025 | Fastest-growing Sub-segment | CAGR, 2026–2035 |
|---|---|---|---|---|
| By Product Type | Mattresses and Foundations | 62.0% | Mattress Surface Protection | 5.4% |
| By Purchase Occasion | Routine Replacement | 58.0% | New Bedroom Setup | 4.9% |
| By Customer Type | Owner-occupier Households | 66.0% | Renter Households | 4.7% |
| By Distribution Channel | Specialty Stores | 42.0% | E-commerce | 5.3% |
Queen mattress prices run from USD 249 to above USD 4,000
U.S. bedding pricing is anchored by the queen mattress, and the price tier a household chooses there usually sets its spending on linens and protectors too. Economy foam beds sell at fixed low prices in mass and furniture chains, while specialty and direct brands list higher prices and then discount through frequent promotions, as the Saatva Classic shows. Adjustable smart beds sit at the top and are sold mostly through brand showrooms. Accessories carry wide margins, so retailers bundle them with a mattress to protect the value of each sale. Sleep Number said in November 2025 that it will tie price points to customer value in 2026.
| Product or tier | Typical price or fee | Basis |
|---|---|---|
| Economy foam mattress, queen (IKEA ÅSBYGDA) | USD 249 | IKEA lists, November 2026 |
| Mid-market hybrid mattress, queen (IKEA ÅNNELAND) | USD 649 | IKEA lists, November 2026 |
| Premium innerspring mattress, queen (Saatva Classic) | USD 2,229 list, USD 1,895 on promotion | Saatva lists, November 2026 |
| Smart adjustable bed, queen (Sleep Number Comfort Mode to top collection) | USD 1,799 to USD 4,312 starting prices | Sleep Number lists, November 2026 |
| Waterproof mattress pad, queen (Saatva) | USD 165 | Saatva lists, November 2026 |
Request a Free Sample
Fill in your details and we'll send you a free sample report.
- Sample data tables & charts
- Research methodology
Replacement, new bedrooms and digital shopping lift demand
Delayed mattress replacements build pent-up demand
Replacement is the largest source of demand, and households postponed it in 2025, which creates a backlog for the next few years. ISPA reported on July 15, 2026 that U.S. mattress unit shipments fell 13.2% in 2025 and that market value fell 6.5%, while average selling prices rose. The decline came even though the association's fall 2024 forecast had expected 2025 units to rise 1.5%, so the gap reflects deferred purchases more than lost need. Somnigroup assumed a flat U.S. market in its February 2026 guidance but said Mattress Firm same-store sales turned positive after Feb. 11, 2026. Retailers with stock and financing ready will capture the first wave of returning replacement buyers.
New apartments and homes need fully furnished bedrooms
New households and new housing units create demand for complete bedrooms, from the mattress to sheets and pillows. Single-family starts fell 6.9% in 2025 while multifamily starts rose, according to Census Bureau and HUD data released on Feb. 18, 2026, so more first beds will be bought by renters in 2026 and 2027. Existing-home sales totaled 4.061 million in 2025, the lowest annual level since 1995, according to the National Association of Realtors, which held back moves that usually trigger new purchases. The South's population grew from 2020 to 2025 at nearly double the national rate of 3.1%, according to the Census Bureau. Suppliers of value bedding sets gain most when these moves resume.
Online research shifts sales toward digital channels
Shoppers now start bedding purchases online, which shifts sales toward marketplaces and brand websites and changes how stores are used. The Census Bureau estimated U.S. e-commerce sales at USD 340.2 billion in the second quarter of 2026. Digital brands now add stores as showrooms, and Saatva opened a 4,574-square-foot viewing room in Scottsdale, Arizona on Feb. 14, 2025, the first of its 2025 openings. Purple reported a 7.0% rise in comparable showroom sales in the first quarter of 2026, its third straight positive quarter, and Sleep Number began an HSN home-shopping trial in November 2025. Brands that link online reviews with in-person trial win the highest conversion.
Retail consolidation widens national distribution
Consolidation in mattress retail is giving the largest makers direct control of shelf space and pushing smaller brands into wholesale deals. Tempur Sealy completed its acquisition of Mattress Firm on Feb. 5, 2025 and took the name Somnigroup International, while agreeing to sell 73 Mattress Firm stores and 103 Sleep Outfitters locations. Tempur Sealy brands and private labels reached a low-60% share of Mattress Firm sales by the end of 2025, according to Somnigroup. Purple expanded its Mattress Firm agreement on May 6, 2025 to a minimum of 12,000 mattress slots across more than 2,300 stores. Independent brands now need such wholesale deals or their own showrooms to stay visible to buyers.
Larger beds, onshore fill and certified materials gain
Larger sizes and step-up features lift prices per bed
Prices per bed are rising because buyers choose larger sizes and more features even while they buy fewer units. ISPA attributed the higher 2025 average unit values to a shift toward larger mattress sizes and to pricing discipline, as noted in the drivers. Serta Simmons Bedding launched new Beautyrest and Beautyrest World Class collections on Jan. 28, 2025, marking the brand's 100th anniversary with step-up features at every price point. Sleep Number chief executive Linda Findley said in November 2025 that the fastest growth in premium adjustable beds is at the lower end of the premium range. Somnigroup said its 2025 Sealy Posturepedic launch shipped more than 65,000 additional floor samples to stores. Mid-priced premium beds, rather than the most expensive models, therefore carry the price trend.
Onshore pillow and fill production rises near buyers
Fill products and linens are moving closer to U.S. retailers as importers hedge against tariffs and long shipping times. Indo Count took a majority stake in Fluvitex USA of Columbus, Ohio in September 2024, adding capacity for 5 million pillows and 1.5 million quilts a year. It bought Modern Home Textiles of Phoenix, Arizona on Oct. 14, 2024, adding 8 million pillows a year. Welspun said in June 2024 that it would invest USD 12.5 million to add manufacturing at its Grove City, Ohio center, with 70 new jobs, for pillows, mattress pads and comforters. Retailers gain faster restocking from these plants, while bulky fill products avoid ocean freight.
Certified natural materials open a premium niche
Certified organic and natural bedding is an opening because a growing group of buyers pays more for verified materials. Avocado Green Mattress, a certified B Corporation with GOTS and OEKO-TEX certifications, reported more than 560 retail doors across the United States in November 2025. It added Best Mattress, an 18-store specialty retailer in Utah and Nevada, as a partner on Nov. 18, 2025, which shows that natural brands now reach regional chains. Saatva also sells eco-friendly and organic cotton bedding next to its made-to-order mattresses. Suppliers with audited fiber chains can therefore win shelf space that price-led imports cannot.
Sleep system bundles open higher-value sales
Bundles of a mattress, adjustable base, pillows and protectors are an opening because they raise the value of each sale and reduce price comparison on a single item. Serta Simmons Bedding added four baselogic adjustable base models for retailers from March 1, 2025, built to pair with its Beautyrest and Serta mattresses. Sleep Number sells its beds as complete systems, with queen collections starting at USD 1,799, which links the category to connected furniture. Somnigroup plans to launch Stearns & Foster at Mattress Firm in the second half of 2026, adding another premium system line. Retailers that sell the full bed set rather than the mattress alone earn more per customer.
Tariff swings, duties and weak premium demand test suppliers
Tariff swings on imported linens raise costs
Imported cotton sheets face unstable tariffs, which makes pricing hard for retailers and private-label buyers. India supplied 45% of imported U.S. cotton sheets in the first 11 months of 2025, according to U.S. government figures reported by Home Textiles Today, a period that included a 50% U.S. tariff on Indian goods from Aug. 27, 2025. A cut to 18% was announced on Feb. 2, 2026, and the Supreme Court struck down the emergency tariffs on Feb. 20, 2026. Buyers respond by spreading orders across countries and holding more stock.
Antidumping duties limit low-cost mattress imports
Trade cases have raised the cost of imported mattresses and pushed buyers back toward domestic plants. Commerce set final antidumping rates of 4.61% to 344.70% on July 16, 2024 for mattresses from India, Kosovo, Mexico and Spain, after earlier orders on other countries. Imports from these four countries and Indonesia, covered by the same investigations, reached about USD 979 million in 2022. Importers that relied on low-cost boxed mattresses must now find new sources or pay higher duties, which narrows the economy tier.
Weak premium demand forces cost cuts
Premium bed makers face weak demand when households delay large purchases, and some have cut spending to protect cash. Sleep Number reported 11 straight quarters of falling sales in November 2025 and had cut marketing spending by 32% in the second and third quarters, according to the Minnesota Star Tribune. The company also closed underperforming stores during the third quarter of 2025. Lower marketing reduces store traffic, so premium brands must win back buyers with simpler ranges and clearer prices.
Flammability compliance adds fixed costs for importers
Every mattress and mattress pad sold in the United States must pass federal smoldering and open-flame tests, which adds testing, labeling and recordkeeping costs. The Consumer Product Safety Commission published a notice on June 18, 2026 to renew its information rules under 16 CFR 1632 and 1633, with the current collection expiring Oct. 31, 2026. Small importers carry these fixed costs on fewer units than large makers, which favors established suppliers.
The South leads as most new homes are finished there
| Region | Value, 2025 (USD billion) | Share, 2025 | CAGR, 2026–2035 |
|---|---|---|---|
| South | 10.59 | 37.5% | 4.6% |
| West | 7.06 | 25.0% | 4.3% |
| Midwest | 5.51 | 19.5% | 3.8% |
| Northeast | 5.08 | 18.0% | 3.9% |
The South leads as most new homes are finished there
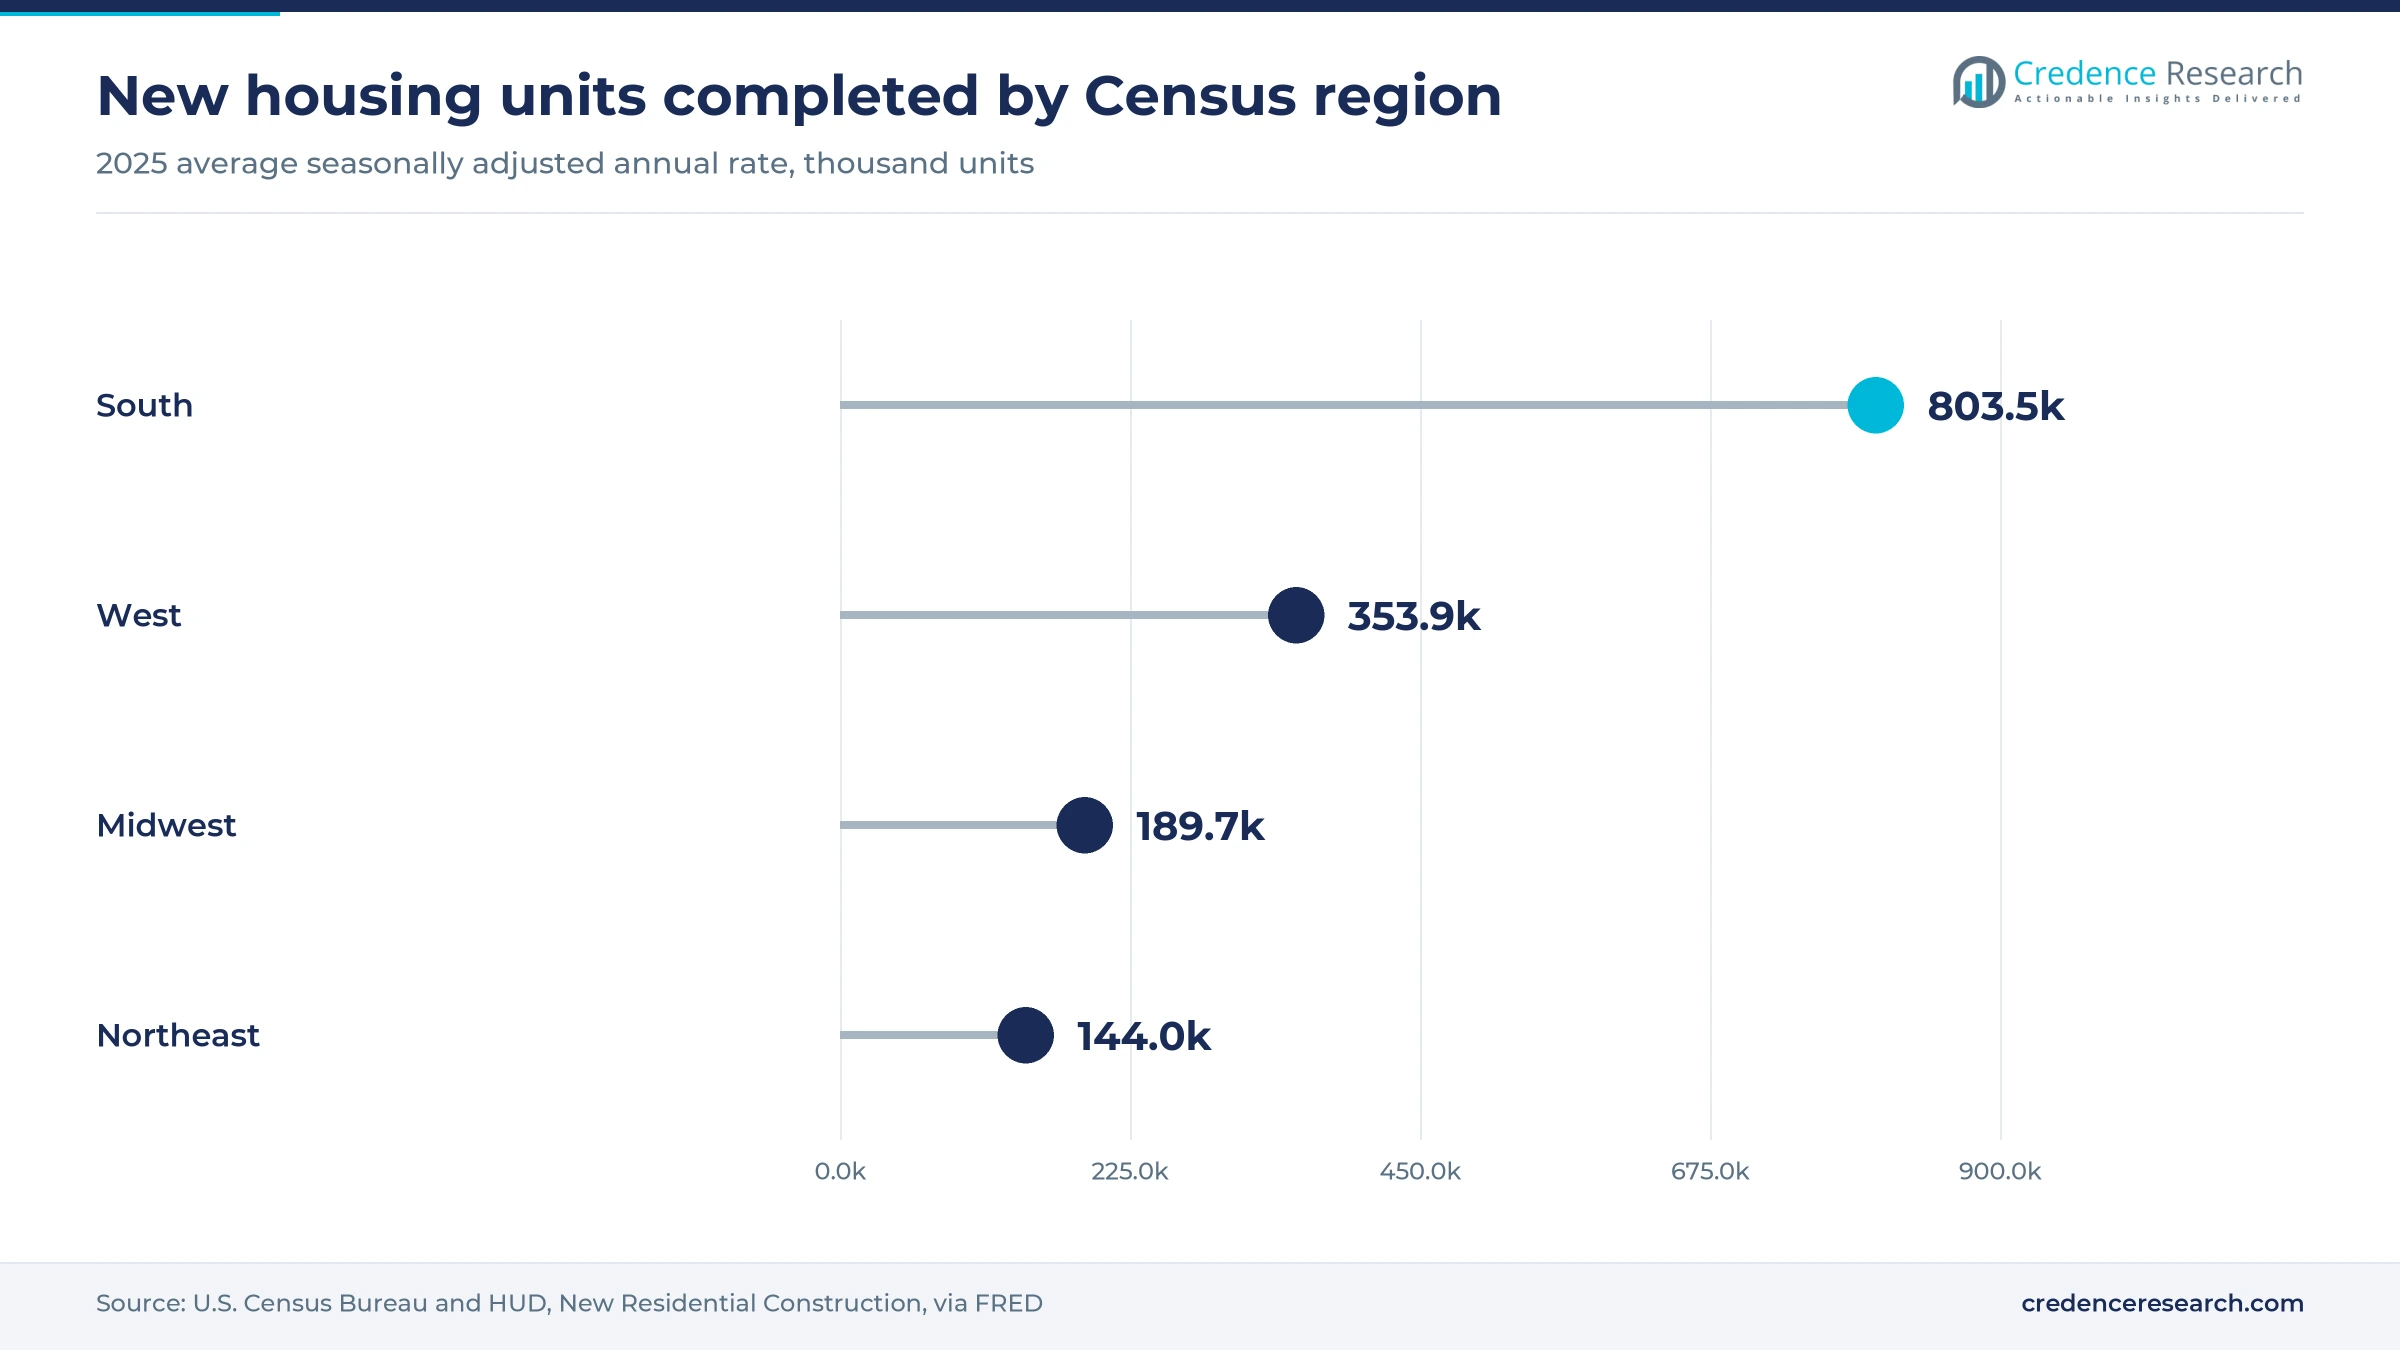
The South held 37.5% of 2025 value and grows at 4.6% a year, the fastest of the four regions. New housing completions in the South averaged an annual rate of 803,500 units in 2025, more than half of the national 1.49 million, according to Census Bureau and HUD data compiled by the St. Louis Fed. Each finished home or apartment needs beds and linens, and population growth adds steady replacement demand. Specialty chains, mass retailers and showrooms all compete for these new households.
The West pays more for premium and natural beds
The West held a 25.0% share of 2025 value and grows at 4.3% a year. Completions in the West averaged an annual rate of 353,900 units in 2025, down from 387,800 in 2024, according to the same Census Bureau and HUD series. Buyers in large coastal metros lean toward premium and certified natural mattresses, and Saatva and Avocado both expanded in Arizona, Utah and Nevada in 2025. Indo Count's Phoenix pillow plant also serves western retailers from inside the region.
The Midwest relies on replacement and value tiers
The Midwest held a 19.5% share of 2025 value and grows at 3.8% a year, the slowest of the four regions. Completions in the Midwest fell to an annual rate of 189,700 units in 2025 from 221,900 in 2024, according to Census Bureau and HUD data, so growth depends on replacement rather than new bedrooms. Mass and club stores carry a large share of sales, and the region hosts the Ohio pillow and bedding plants of Indo Count and Welspun.
The Northeast adds new units in dense cities
The Northeast held an 18.0% share of 2025 value and grows at 3.9% a year. It was the only region where completions rose in 2025, to an annual rate of 144,000 units from 133,500 in 2024, according to Census Bureau and HUD data. Smaller apartments favor compact mattresses, delivery and online ordering of linens and protectors. American Textile Company, based near Pittsburgh, makes polyester-filled pillows and private-label bedding in the region.
Retail deals and new collections marked 2025 and 2026
| Development | Status and market relevance |
|---|---|
| In January 2025, Serta Simmons Bedding launched new Beautyrest and Beautyrest World Class mattress collections. | Launched; floor models shipped in February and March 2025 |
| In February 2025, Tempur Sealy completed its acquisition of Mattress Firm and became Somnigroup International. | Completed; maker and largest specialty chain combined |
| In May 2025, Purple Innovation expanded its commercial relationship with Somnigroup and Mattress Firm. | Signed; at least 12,000 mattress slots in more than 2,300 stores |
| In November 2025, Avocado Green Mattress partnered with Best Mattress in Utah and Nevada. | Signed; adds 18 specialty stores for certified natural beds |
| In April 2026, Purple Innovation reported early traction for its Purple Royale mattress at Mattress Firm. | Rolling out; premium line on national specialty floors |
Sleep systems and allergen barriers reshape U.S. products
- Hybrid and pocketed-coil construction combines springs with foam or latex layers, and it now spans the market from mid-market IKEA beds to premium Beautyrest models.
- Adjustable bases and smart beds let buyers change position or firmness, which turns a mattress into a sleep system with a higher price.
- Allergen barrier and waterproof fabrics protect mattresses and pillows from dust mites and spills, and they keep warranties valid.
- Foam and fiber fill engineering shapes pillows, toppers and memory foam mattresses that ship compressed in a box, which cuts freight costs for online sellers.
Need a Custom Version of This Report?
Tailor the scope, geography, or segments to your exact requirements.
- Custom geography or segment scope
- Direct access to our analyst team
Vertical mattress groups and linen mills split the market
Competition turns on who controls the store floor and who supplies the linens and accessories that follow each mattress. Somnigroup owns Tempur-Pedic, Sealy and Stearns & Foster and sells them through Mattress Firm, which gives it the largest specialty footprint. Serta Simmons Bedding competes with Serta and Beautyrest collections across specialty and furniture stores. Sleep Number sells smart adjustable beds in its own showrooms, while Purple and Saatva combine online sales with showrooms and wholesale floors, and Avocado Green Mattress competes on certified natural materials. In linens and fill, Welspun Living and Indo Count supply sheets, pillows and quilts to large retailers, and American Textile Company leads in allergen protection and private-label pillows. WestPoint Home sells sheets, blankets, pillows and mattress pads online. Price competition is sharpest in sheets and boxed mattresses, while premium beds are won on brand and in-store trial.
Vertical mattress groups and global textile mills form two tiers
The U.S. supply side splits into two tiers with different economics. Mattress makers such as Somnigroup, Serta Simmons Bedding, Sleep Number, Purple and Saatva run U.S. plants, because bulky beds are costly to ship and must meet federal flammability rules, and several also own stores. Linens and fill come mostly from mills in India, China and Pakistan, including Welspun and Indo Count, which also run U.S. plants. Margins are highest where brands control the store floor and sell accessories with each bed, while private-label linen suppliers compete on cost. Brand trust, store access and testing costs are the main barriers to entry.
Companies profiled and their roles in this market
| Company | Type | Role in the market |
|---|---|---|
| Somnigroup International | Mattress maker and retailer | Completed its Mattress Firm acquisition in February 2025 |
| Serta Simmons Bedding | Mattress maker | Launched Beautyrest collections and baselogic adjustable bases in 2025 |
| Sleep Number Corporation | Smart bed maker and retailer | Simplifies its assortment and pricing in 2026 under a new CEO |
| Purple Innovation | Mattress maker, online and showrooms | Expanded its Mattress Firm floor presence from May 2025 |
| Welspun Living | Home textile maker | Adds pillow and comforter production in Grove City, Ohio |
| Indo Count Industries | Bed linen and fill maker | Owns pillow plants in Columbus, Ohio and Phoenix, Arizona |
| American Textile Company | Pillow and protector maker | Leads allergen bedding with AllerEase and makes private-label pillows |
| WestPoint Home | Bedding and bath textile brand | Sells sheets, blankets, pillows and mattress pads online |
| Saatva | Direct mattress brand with viewing rooms | Opened a Scottsdale viewing room in February 2025 |
| Avocado Green Mattress | Certified natural mattress brand | Reached more than 560 retail doors by November 2025 |
Pent-up replacement, not new households, carries growth
Credence Research's view is that U.S. bedding will grow mainly through the return of delayed mattress replacements rather than through new households. Units fell sharply in 2025 while prices held, so many households are using beds longer than usual and will return to stores as confidence improves. Consolidation gives the largest makers more control of the store floor, which raises the bar for independent brands. The strongest positions belong to suppliers that pair a trusted mattress brand with accessories, bundles and U.S. production, because they protect margins when tariffs and promotions squeeze prices.
Household counts and shelf prices anchor the estimate
The report uses 2025 as the base year and 2026 to 2035 as the forecast period. Market values come from the Credence Research model, which builds spending from household counts, typical replacement cycles for mattresses and linens and published shelf prices. Segment and regional splits are Credence Research estimates built from Census Bureau housing and retail data, International Sleep Products Association releases, Commerce Department trade determinations, company announcements and filings, and retailer price lists. No interviews or primary surveys were conducted for this edition.
Bedding spend recovers as delayed replacements return
The United States home bedding market is expected to grow from USD 29.52 billion in 2026 to USD 42.93 billion by 2035 at a 4.25% CAGR. Replacement buying should recover first, followed by new bedroom demand as recently started apartments are completed. Protectors, pillows and online sales will gain share, while specialty stores remain the main route for premium mattresses. The South will add the most new buyers as housing construction concentrates there. By 2035, more households are likely to buy a complete sleep system in one purchase rather than a mattress alone.
The timing of the replacement rebound sets the 2035 range
The range of outcomes depends on when delayed mattress replacements return and on how tariff rules for imported linens settle. A downside case assumes weak housing turnover, renewed tariffs on Indian and Chinese textiles and continued trading down. The base case assumes a gradual return of replacement buying from 2026 and steady growth of online sales. An upside case needs lower mortgage rates that lift home sales and a faster rise in sleep system bundles, which would raise spending per bed.
| Scenario | CAGR, 2026–2035 | Value, 2035 | What has to hold |
|---|---|---|---|
| Downside | 3.0% | USD 38.35 billion | Housing turnover stays low, linen tariffs rise again and buyers trade down |
| Base | 4.25% | USD 42.93 billion | Replacement buying returns gradually and online sales keep gaining share |
| Upside | 5.2% | USD 46.78 billion | Home sales recover with lower rates and sleep system bundles spread quickly |
Frequently Asked Questions
How big is the United States home bedding market?
Which product type leads U.S. bedding spending?
Which U.S. region leads the market?
Why did U.S. mattress sales fall in 2025?
Which distribution channel grows fastest?
How do tariffs affect U.S. bedding prices?
Who are the key companies in the United States home bedding market?
What does a queen mattress cost in the United States?
Table of Content
Chapter 1 Market Segmentation
- 1.1 Segmentation Framework
- 1.1.1 Product and Service Classification
- 1.1.2 Application and End-Use Classification
- 1.1.3 Technology and Solution Classification
- 1.1.4 Customer and Distribution Channel Classification
- 1.1.5 Geographic Segmentation
- 1.1.6 Market Segment Definitions and Boundaries
- 1.2 By Product Type
- 1.2.1 Mattresses and Foundations
- 1.2.2 Bed Linens
- 1.2.3 Sleep Fill Products
- 1.2.4 Mattress Surface Protection
- 1.3 By Purchase Occasion
- 1.3.1 Routine Replacement
- 1.3.2 New Bedroom Setup
- 1.3.3 Seasonal Refresh
- 1.4 By Customer Type
- 1.4.1 Owner-occupier Households
- 1.4.2 Renter Households
- 1.4.3 Second-home Households
Chapter 2 Introduction
- 2.1 Report Objectives and Scope
- 2.2 Product Definition and Industry Terminology
- 2.3 Market Inclusions and Exclusions
- 2.4 Research Process
- 2.4.1 Primary Research and Expert Interviews
- 2.4.2 Secondary Research and Source Review
- 2.4.3 Top-Down and Bottom-Up Estimation
- 2.4.4 Data Triangulation and Verification
- 2.5 Market Size Measurement Basis
- 2.5.1 2025: USD 28.24 billion → 2035: USD 42.93 billion
- 2.6 Historical and Forecast Reference Periods
- 2.6.1 Historical Period: 2018-2025
- 2.6.2 Base Year: 2025
- 2.6.3 Forecast Period: 2025-2035
- 2.7 Research Assumptions and Limitations
Chapter 3 Executive Summary
- 3.1 Market Snapshot and Key Findings
- 3.2 Base-Year Market Size, 2025
- 3.3 Forecast Market Size, 2035
- 3.4 Revenue and Volume Growth Outlook
- 3.5 Key Demand and Supply Indicators
- 3.6 Leading Market Segments
- 3.7 Fastest-Growing Market Opportunities
- 3.8 Regional Performance Highlights
- 3.9 Technology and Industry Transformation
- 3.10 Competitive Landscape Summary
- 3.11 Analyst View and Strategic Implications
Chapter 4 United States Home Bedding Market Trends and Developments
- 4.1 Historical Industry Development, 2018-2025
- 4.2 Recent Market Trends and Developments
- 4.3 Demand and Customer Behavior Trends
- 4.4 Technology and Product Innovation
- 4.5 Artificial Intelligence, Automation and Digitalization
- 4.6 Local Manufacturing and Supply Chain Realignment
- 4.7 Industry Partnerships, Mergers and Acquisitions
- 4.8 Sustainability and Circular Economy Developments
- 4.9 Government and Private Sector Investment Trends
- 4.10 Emerging Business Models and Commercialization
- 4.11 Industry Developments and Announcements
Chapter 5 United States Home Bedding Market Production, Supply and Demand Analysis
- 5.1 Demand Trend and Consumption Analysis, 2018-2025
- 5.2 Demand Forecast, 2025-2035
- 5.3 Production and Output Trend, 2018-2025
- 5.4 Production and Output Forecast, 2025-2035
- 5.5 Installed Capacity and Capacity Utilization
- 5.6 Company-Wise Production Plants and Statistics
- 5.6.1 Installed Production Capacity
- 5.6.2 Actual Production
- 5.6.3 Planned Capacity and Expansion Targets
- 5.7 Supply Chain Structure and Procurement Trends
- 5.8 Supply-Demand Gap and Bottlenecks
- 5.9 Import Dependence and Sourcing Structure
- 5.10 Contract Manufacturing and Outsourcing
- 5.11 Regional Supply and Demand Concentration
Chapter 6 United States Home Bedding Market Pricing Analysis
- 6.1 Pricing Structure and Measurement
- 6.2 Historical Pricing Trends, 2018-2025
- 6.3 Pricing Outlook, 2025-2035
- 6.4 Average Selling Price and Unit Economics
- 6.5 Pricing by Product and Market Segment
- 6.6 Geographic Pricing Differences
- 6.7 Key Input, Energy, Labor and Logistics Costs
- 6.8 Contract Pricing and Purchasing Models
- 6.9 Pricing Sensitivity and Competitive Positioning
- 6.10 Price, Margin and Profitability Implications
Chapter 7 United States Home Bedding Market Dynamics
- 7.1 Market Growth Drivers
- 7.1.1 Demand-Side Drivers
- 7.1.2 Technology and Innovation Drivers
- 7.1.3 Infrastructure and Investment Drivers
- 7.1.4 Regulatory and Policy Drivers
- 7.2 Market Restraints
- 7.2.1 Cost and Affordability Constraints
- 7.2.2 Technology and Adoption Barriers
- 7.2.3 Supply Chain and Operational Constraints
- 7.3 Market Challenges
- 7.3.1 Competitive Pressure and Margin Erosion
- 7.3.2 Skills, Infrastructure and Implementation Gaps
- 7.4 Emerging Market Opportunities
- 7.5 Market Dynamics Impact and Time-Horizon Assessment
Chapter 8 United States Home Bedding Value Chain Analysis
- 8.1 Industry Value Chain Overview
- 8.2 Upstream Suppliers and Critical Inputs
- 8.3 Technology and Component Providers
- 8.4 Manufacturing or Service Delivery
- 8.5 Distribution, Channel Partners and Integrators
- 8.6 Downstream Applications and End Users
- 8.7 Value Addition and Profit Pools
- 8.8 Vertical Integration and Outsourcing
- 8.9 Supplier Concentration and Risk
- 8.10 Supply Chain Localization and Resilience
Chapter 9 United States Home Bedding Market Regulations and Policies
- 9.1 Relevant Laws, Standards and Compliance Frameworks
- 9.2 Product, Service, Safety and Quality Requirements
- 9.3 Government Policies, Incentives and Subsidies
- 9.4 Imports, Exports and Trade Barriers
- 9.5 Public Procurement and Local Content Requirements
- 9.6 Environmental and Sustainability Compliance
- 9.7 Upcoming Policy Changes and Market Implications
Chapter 10 United States Home Bedding Market Hotspots and Opportunities
- 10.1 Market Opportunity Mapping and Growth Hotspots
- 10.2 High-Growth Applications and Customer Groups
- 10.3 Underserved Markets and White-Space Opportunities
- 10.4 Emerging Technology and Product Opportunities
- 10.5 New Capacity and Investment Hotspots
- 10.6 Market Entry and Expansion Opportunities
- 10.7 Distribution and Partnership Opportunities
- 10.8 Near-Term and Long-Term Commercial Potential
- 10.9 Opportunity Attractiveness and Execution Risks
Chapter 11 United States Home Bedding Market Outlook, 2025-2035
- 11.1 Market Size and Analysis
- 11.1.1 Revenue (Market Measurement: 2025: USD 28.24 billion → 2035: USD 42.93 billion)
- 11.1.2 Market Volume and Quantity Sold
- 11.1.3 Historical Market Size, 2018-2025
- 11.1.4 Base-Year Market Size, 2025
- 11.2 Market Forecast, 2025-2035
- 11.2.1 Revenue Forecast to 2035
- 11.2.2 Volume Forecast to 2035
- 11.2.3 CAGR and Year-on-Year Growth
- 11.2.4 Incremental Revenue Opportunity
- 11.3 Forecast Assumptions and Scenario Analysis
- 11.3.1 Base-Case Forecast
- 11.3.2 Optimistic and Conservative Scenarios
- 11.3.3 Technology, Pricing and Policy Sensitivities
- 11.4 Market Attractiveness and Growth Outlook
Chapter 12 United States Home Bedding Market Segmentation and Outlook
- 12.1 Segmentation Summary and Market Shares, 2025
- 12.2 Largest and Fastest-Growing Segments
- 12.3 By Product Type - Market Size and Forecast, 2025-2035
- 12.3.1 Segment Definition and Scope
- 12.3.2 Historical Market Size, 2018-2025
- 12.3.3 Revenue Forecast, 2025-2035
- 12.3.4 Volume Forecast, 2025-2035
- 12.3.5 Base-Year Market Share, 2025
- 12.3.6 Segment CAGR and Growth Drivers
- 12.3.7 Subsegment Market Size and Forecast
- 12.3.7.1 Mattresses and Foundations
- 12.3.7.2 Bed Linens
- 12.3.7.3 Sleep Fill Products
- 12.3.7.4 Mattress Surface Protection
- 12.3.8 Subsegment Pricing and Adoption Trends
- 12.3.9 Leading Suppliers and Competition
- 12.3.10 Regional Demand and Opportunities
- 12.4 By Purchase Occasion - Market Size and Forecast, 2025-2035
- 12.4.1 Segment Definition and Scope
- 12.4.2 Historical Market Size, 2018-2025
- 12.4.3 Revenue Forecast, 2025-2035
- 12.4.4 Volume Forecast, 2025-2035
- 12.4.5 Base-Year Market Share, 2025
- 12.4.6 Segment CAGR and Growth Drivers
- 12.4.7 Subsegment Market Size and Forecast
- 12.4.7.1 Routine Replacement
- 12.4.7.2 New Bedroom Setup
- 12.4.7.3 Seasonal Refresh
- 12.4.8 Subsegment Pricing and Adoption Trends
- 12.4.9 Leading Suppliers and Competition
- 12.4.10 Regional Demand and Opportunities
- 12.5 By Customer Type - Market Size and Forecast, 2025-2035
- 12.5.1 Segment Definition and Scope
- 12.5.2 Historical Market Size, 2018-2025
- 12.5.3 Revenue Forecast, 2025-2035
- 12.5.4 Volume Forecast, 2025-2035
- 12.5.5 Base-Year Market Share, 2025
- 12.5.6 Segment CAGR and Growth Drivers
- 12.5.7 Subsegment Market Size and Forecast
- 12.5.7.1 Owner-occupier Households
- 12.5.7.2 Renter Households
- 12.5.7.3 Second-home Households
- 12.5.8 Subsegment Pricing and Adoption Trends
- 12.5.9 Leading Suppliers and Competition
- 12.5.10 Regional Demand and Opportunities
- 12.6 Segment Growth Comparison
- 12.7 Segment Attractiveness and Priority Matrix
Chapter 13 United States Home Bedding End-Use and Application Market Outlook
- 13.1 End-Use Industry and Customer Demand Structure
- 13.2 Leading Applications and Customer Groups
- 13.3 End-Use Market Size, Share and Forecast
- 13.4 Major End-Use Industry Deep Dives
- 13.4.1 Customer Requirements and Use Cases
- 13.4.2 Demand and Replacement Cycles
- 13.4.3 Technical and Regulatory Considerations
- 13.4.4 Purchasing and Procurement Models
- 13.4.5 Leading Vendors and Distribution Channels
- 13.4.6 Forecast and Commercial Opportunities
- 13.5 Emerging Applications and Cross-Segment Demand
- 13.6 End-Use Industry Investment Priorities
Chapter 14 United States Home Bedding Geographic Market Outlook, 2025-2035
- 14.1 Domestic Market Distribution and Demand Clusters
- 14.2 State- or Province-Wise Market Size and Forecast, 2025-2035
- 14.3 City and Metropolitan Market Outlook
- 14.4 Industrial, Manufacturing and Commercial Clusters
- 14.5 Geographic Concentration of Key End Users
- 14.6 Local Pricing and Purchasing Differences
- 14.7 Domestic Production Facilities and Capacity Map
- 14.8 Local Infrastructure and Project Pipeline
- 14.9 State-Level Policy and Incentive Differences
- 14.10 Subnational Investment Hotspots and Opportunities
- 14.11 Distribution and Logistics Networks
- 14.12 Domestic Competitive Footprint
Chapter 15 United States Home Bedding Technology, Innovation and Sustainability Outlook
- 15.1 Technology Landscape and Maturity
- 15.2 Product, Process and Service Innovation
- 15.3 AI, Automation and Digital Tools in the Industry
- 15.4 Technology Adoption and Performance Benchmarking
- 15.5 Innovation Pipeline and R&D Investment
- 15.6 Patent and Intellectual Property Trends
- 15.7 Energy Efficiency and Resource Management
- 15.8 Sustainability, Recycling and Circularity
- 15.9 Technology Roadmap, 2025-2035
- 15.10 Risks of Obsolescence and Technology Substitution
Chapter 16 United States Home Bedding Market Key Strategic Imperatives
- 16.1 Growth and Market Entry Priorities
- 16.2 High-Return Products and Segments
- 16.3 Pricing, Profitability and Cost Optimization
- 16.4 Technology Investment and Product Differentiation
- 16.5 Supply Chain Localization and Resilience
- 16.6 Distribution and Customer Acquisition
- 16.7 Partnership, Acquisition and Capacity Strategy
- 16.8 Regional Expansion Priorities
- 16.9 Short-, Medium- and Long-Term Actions
Chapter 17 Competition Outlook
- 17.1 Industry Competition Characteristics
- 17.2 Market Structure and Concentration
- 17.3 Market Share and Competitive Positioning, 2025
- 17.4 Company-Wise Revenue and Product Benchmarking
- 17.5 Production and Service Capacity Benchmarking
- 17.6 Technology, Pricing and Differentiation
- 17.7 Regional Footprint and Distribution Strength
- 17.8 Mergers, Acquisitions and Strategic Alliances
- 17.9 New Entrants and Competitive Threats
- 17.10 Porter's Five Forces and Industry Attractiveness
- 17.11 Competitive Outlook, 2025-2035
Chapter 18 Company Profiles
- 18.1 Company Coverage and Selection Criteria
- 18.2 Somnigroup International
- 18.2.1 Business Description
- 18.2.2 Company Ownership and Geographic Presence
- 18.2.3 Product and Service Portfolio
- 18.2.4 Manufacturing and Operating Footprint
- 18.2.5 Production Capacity and Expansion Plans
- 18.2.6 Financial Performance and Investment
- 18.2.7 Market Share and Competitive Position
- 18.2.8 Technology and Innovation Capabilities
- 18.2.9 Strategic Alliances or Partnerships
- 18.2.10 Recent Developments
- 18.2.11 Growth Strategy and Outlook
- 18.3 Serta Simmons Bedding
- 18.4 Sleep Number Corporation
- 18.5 Purple Innovation
- 18.6 Welspun Living
- 18.7 Indo Count Industries
- 18.8 American Textile Company
- 18.9 WestPoint Home
- 18.10 Saatva
- 18.11 Avocado Green Mattress
- 18.12 Other Relevant Market Participants
Note: Every listed company is profiled on the structure shown under the first company. The company list is preliminary and may change based on research findings, market developments, data availability and client requirements.
Chapter 19 Disclaimer
- 19.1 Research and Forecast Disclaimer
- 19.2 Data Source and Estimation Limitations
Note: The depth of individual sections depends on data availability for this market. Volume, capacity, trade and other unit-based metrics are included where applicable.