
What Is PUE? How Data Center Energy Efficiency Is Measured
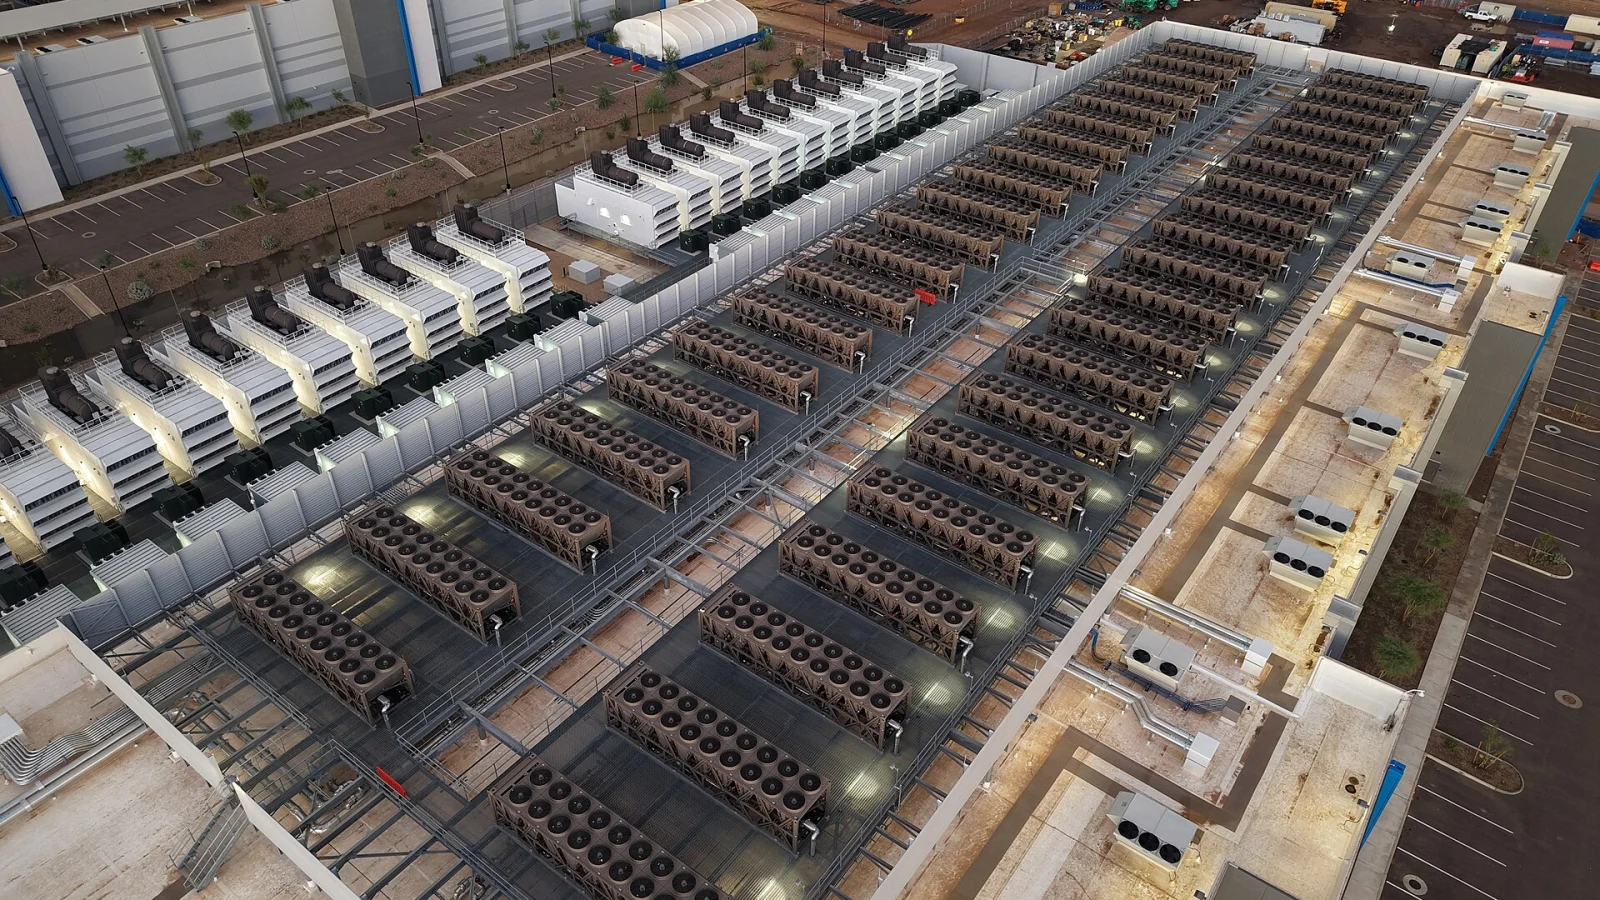
Power usage effectiveness (PUE) is the standard measure of data center energy efficiency. It divides the total energy a facility draws over a year by the energy delivered to its IT equipment, meaning servers, storage and network gear. A perfect score of 1.0 would mean every kilowatt-hour reaches computing hardware, while a PUE of 1.5 means the site spends an extra half kilowatt-hour on cooling, power conversion, lighting and other overhead for each kilowatt-hour of IT work. The metric is defined in ISO/IEC 30134-2 and is now mandatory to report in the European Union. It measures infrastructure overhead, not how much useful computing the IT equipment delivers.
How the PUE formula turns energy into a ratio
PUE compares two meter readings taken over the same period. The numerator is total facility energy, which The Green Grid defines as everything the site consumes at its utility inputs. That includes power delivery equipment such as switchgear, uninterruptible power supplies (UPS), batteries, generators and power distribution units, cooling equipment such as chillers, cooling towers, pumps and computer room air handlers, and other loads such as lighting. The denominator is IT equipment energy, which covers compute, storage and network hardware plus supporting devices such as KVM switches and monitors used to run the hall.
The Green Grid introduced PUE and its inverse, data center infrastructure efficiency (DCiE), in 2007, and its consolidated guidance appears in the white paper PUE, A Comprehensive Examination of the Metric, published in October 2012. Because the ratio expresses overhead per unit of IT energy, small differences in the decimal carry large differences in energy. A site running an average IT load of 10 MW for a full year uses 87,600 MWh of IT energy. At a PUE of 1.54 it spends roughly 47,300 MWh more on overhead, while at 1.09 the overhead falls to about 7,900 MWh. That gap of about 39,400 MWh a year flows into electricity bills, grid requests and plant sizing.
Where the meters sit changes the reported number
The same building can report different PUE values depending on where IT energy is measured. The Green Grid sets three measurement levels for that reading. Level 1 reads IT load at the UPS output at least once a month. Level 2 reads it at the output of power distribution units at least once a day. Level 3 reads it at each individual piece of IT equipment at least once every 15 minutes. Total facility energy is metered at the utility inputs in all three cases.
The choice matters because any loss between the meter and the server is counted as IT energy. At Level 1, transformer and distribution losses downstream of the UPS sit in the denominator, which flatters the result. At Level 3, those losses move into overhead, so an honest Level 3 figure can look worse than a loosely metered Level 1 figure for an identical building.
ISO/IEC 30134-2 specifies PUE as a key performance indicator and defines three measurement categories, PUE1 for basic, PUE2 for intermediate and PUE3 for advanced resolution. Its second edition, dated January 2026, replaces the 2016 edition and revises the rules for recording total and IT energy over 12 months, an approach that rules out a single snapshot on a cool day. The standard also states that the 30134 series sets no limits or targets for any indicator, leaving thresholds to regulators and buyers.
Colocation tenants face a further boundary problem, since they rarely control the meters for the whole building. For that case The Green Grid defines partial PUE (pPUE), the total energy inside a defined boundary, such as a single data hall, divided by the IT energy inside that boundary. A pPUE tracks one zone well but is not comparable with a whole-site PUE.
Industry averages have stalled near 1.5
The longest-running view of the installed base comes from the Uptime Institute's annual operator survey. Its Global Data Center Survey 2025 reports a weighted average annual PUE of 1.54 from 681 respondents, the sixth consecutive year in which the figure has barely changed. The survey average fell from 2.50 in 2007 to 1.98 in 2011 and 1.58 in 2018, rose to 1.67 in 2019, and has stayed between 1.54 and 1.59 since 2020.
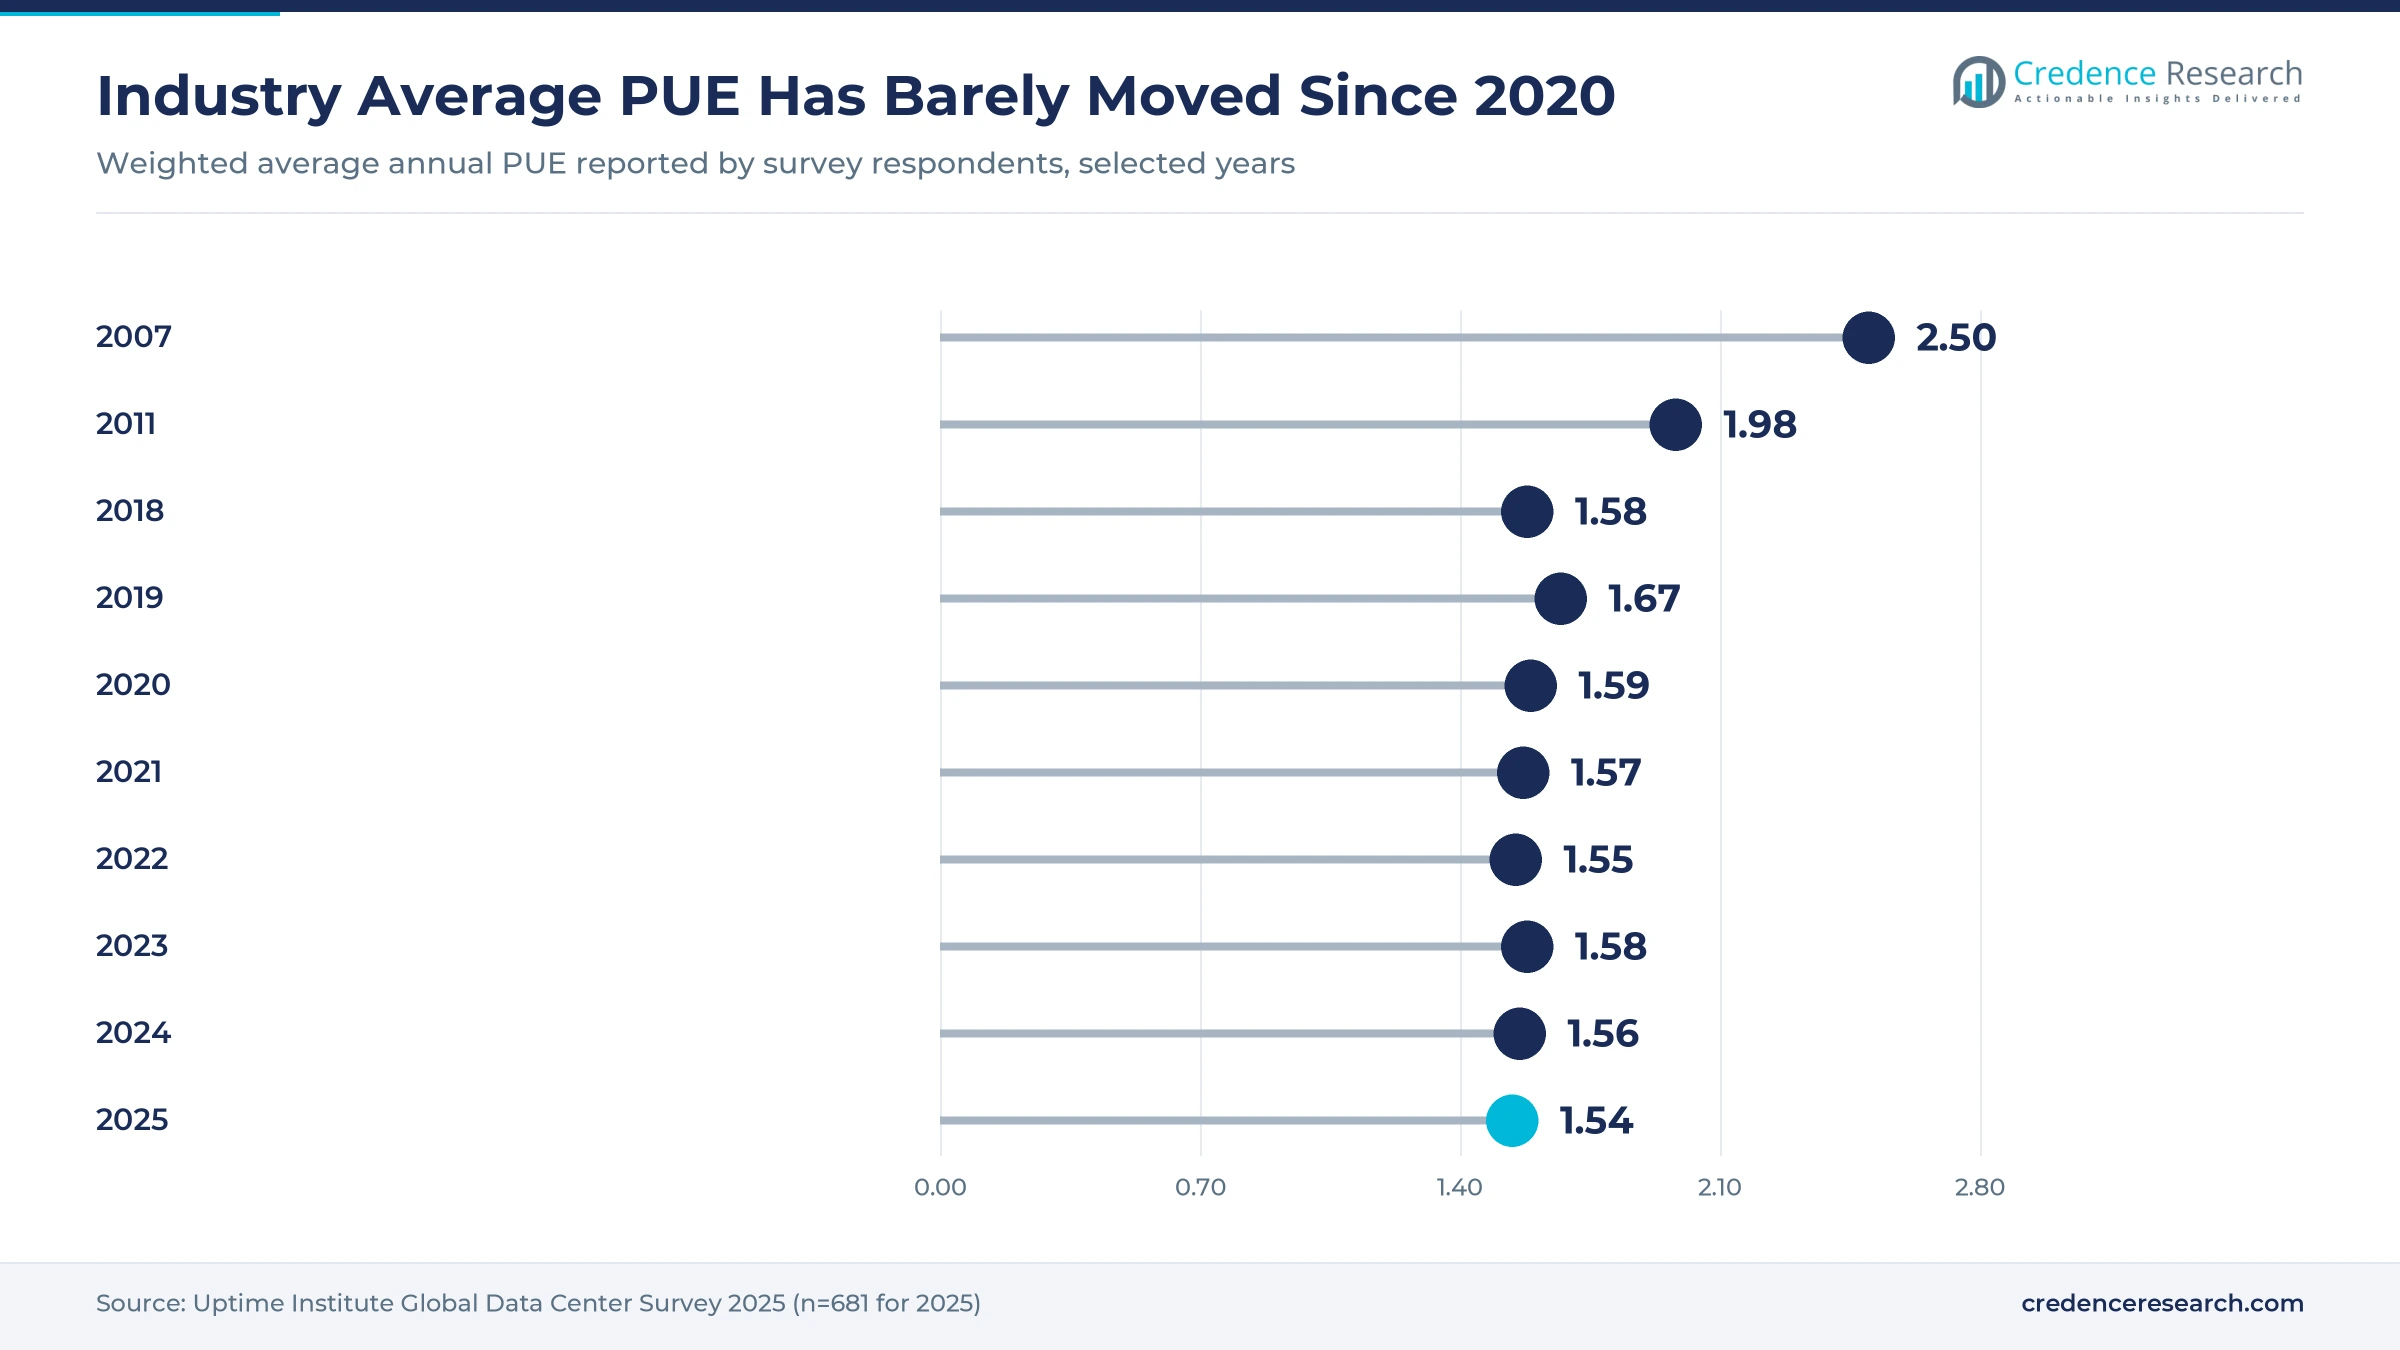
The plateau reflects the age and location of the installed base more than a lack of known techniques. Uptime reports that 27.5% of respondents work in facilities that are 16 years old or older, and that upgrades to such sites often carry a weak business case while strong demand keeps them in service longer. Climate adds a second constraint, because hot or humid regions limit the most efficient heat rejection methods. Uptime expects the average to move slowly, if at all, over the next few years.
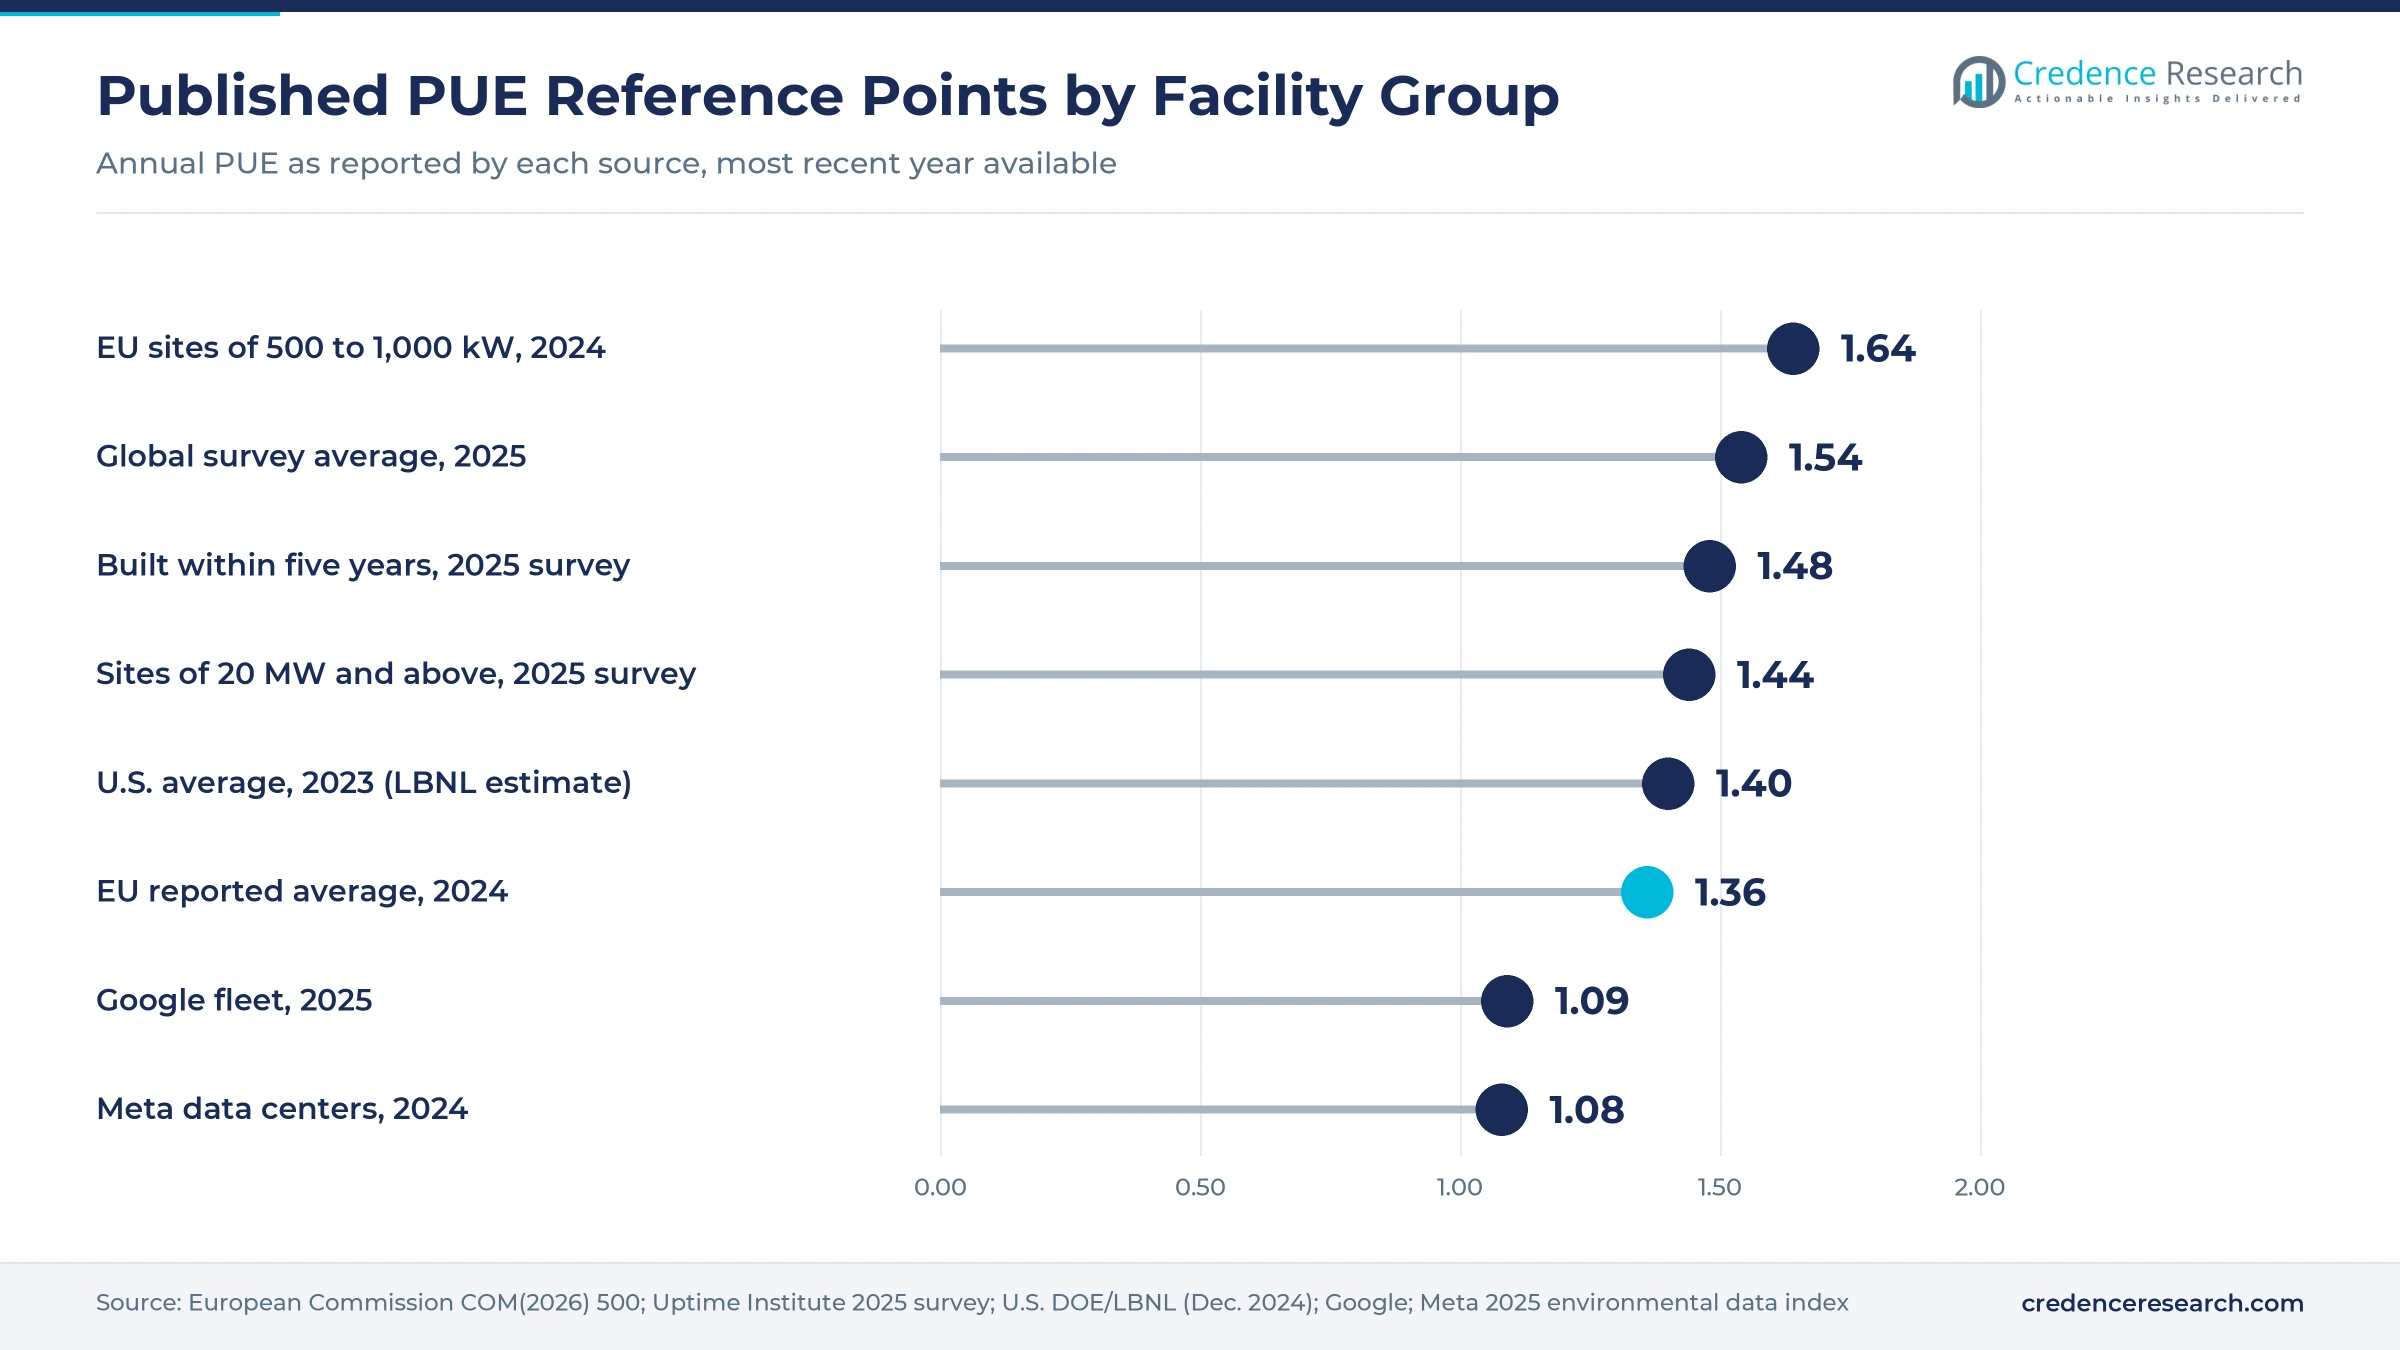
Facilities commissioned within five years of the survey average 1.48, sites of 20 MW and above average 1.44, and 15% of respondents report a PUE of 1.3 or better, a level many new facilities in high-latitude North America and Europe reach. Measurement discipline is also slipping slightly, with 74% of respondents tracking PUE in 2025 compared with 76% in 2024. Roughly a quarter of operators therefore cannot say what their overhead is, which limits their ability to justify efficiency spending.
Hyperscale fleets report PUE close to 1.1
The largest cloud operators publish figures far below the survey average because they design purpose-built campuses, run them at high utilization and control both IT hardware and facility systems. Google reports a fleet-wide trailing 12-month PUE of 1.09 for 2025, covering all large-scale data centers once they reach stable operation, in all seasons and including all sources of overhead. Google compares its overhead of 0.09 with the 0.54 implied by the Uptime average and describes the result as 83% less overhead energy. Its campus figures for the fourth quarter of 2025 range from 1.04 to 1.14 on a trailing basis, while a newer campus in Mesa, Arizona, without a full year of data posted quarterly values of 1.22 and 1.28 in the first half of 2026. That spread shows how far climate and ramp-up can move one site inside a standardized fleet.
Meta's 2025 environmental data index lists a data center PUE of 1.08 for each year from 2022 through 2024. Both companies publish annualized figures and explain the calculation, which makes a low headline number credible.
The U.S. Department of Energy's 2024 United States Data Center Energy Usage Report, prepared by Lawrence Berkeley National Laboratory, models an average U.S. PUE that fell from 1.6 in 2014 to 1.4 in 2023. The report notes that these modeled values assume systems run as designed, so actual PUE is likely higher. The report attributes most of the improvement to the shift of servers into hyperscale and colocation facilities, which averaged below 1.4 by 2023 and housed about 74% of servers. It projects an average between 1.15 and 1.35 by 2028, driven by further consolidation and the growth of liquid-cooled AI servers. Infrastructure built for that consolidation is assessed in the green data center market report.
Europe made PUE reporting mandatory in 2024
The European Union turned PUE from a voluntary benchmark into a reporting duty. Commission Delegated Regulation (EU) 2024/1364 of March 14, 2024, adopted under the Energy Efficiency Directive, applies to operators with an installed IT power demand of at least 500 kW. Operators had to report by Sept. 15, 2024, then by May 15, 2025, and annually after that, each time covering the previous calendar year. The regulation defines PUE as total energy consumption divided by IT equipment energy consumption, calculated with the category 1 methodology of the EN 50600-4-2 standard. Results are published only in aggregate at member state and EU level, with averages weighted by total energy consumption.
The Commission's report on the energy efficiency of EU data centres, COM(2026) 500 of Sept. 21, 2026, states that 770 data centers reported in the first period, about 36% of those estimated to be covered, and that 681 supplied PUE values judged reliable. The average reported PUE for 2024 was 1.3625, with national averages ranging from 1.15 to 1.66. Smaller facilities of 500 kW to 1,000 kW averaged 1.64, and roughly half of reporting sites exceed a recommended PUE baseline of 1.5, a WUE baseline of 0.4, or both. The report describes values below 1.2 as excellent and notes that Germany's Energy Efficiency Act sets long-term targets of 1.2 to 1.3, while the industry's Climate Neutral Data Centre Pact targets 1.3 for new sites in cool climates and 1.4 in warmer regions by 2030.
The EU average for 2024 sits well below the 2025 global survey figure, but the two are not like-for-like. The EU sample excludes sites below 500 kW, covers about a third of eligible facilities, weights results by energy use and keeps only data judged reliable, all of which likely tilt it toward large, well-metered buildings. The Commission adds that climatic variation is not the main factor behind the spread in reported values, which points instead to facility age, size and operating practice.
The commercial consequence is that PUE is moving from a marketing figure toward a compliance input. The Commission proposed a common EU rating scheme on Sept. 21, 2026, and plans a proposal on minimum performance standards in the second quarter of 2027, with the report naming PUE, water usage effectiveness and renewable energy among candidate thresholds. Owners of small and older European sites, the group with the weakest scores, face the greatest exposure if a threshold near 1.5 is adopted.
What PUE leaves out
PUE measures how much energy the building adds around IT equipment, not whether the IT equipment does useful work efficiently. The Green Grid warns that cutting IT load, for example through server virtualization, can raise PUE because fixed cooling and power overhead stays the same while the denominator shrinks, even though total energy falls. An operator that consolidates servers can therefore be penalized by its own headline metric.
The boundary between IT and facility also shifts with cooling technology. The Green Grid notes that some cooling technologies place pumps, blowers and heat exchangers inside IT equipment and says that energy must be accounted for, so moving heat removal between the server and the facility plant can change the ratio without a matching change in total energy. That effect, and the wider trade-offs between cooling methods, are examined in the earlier post on air cooling and liquid cooling in high-density data centers.
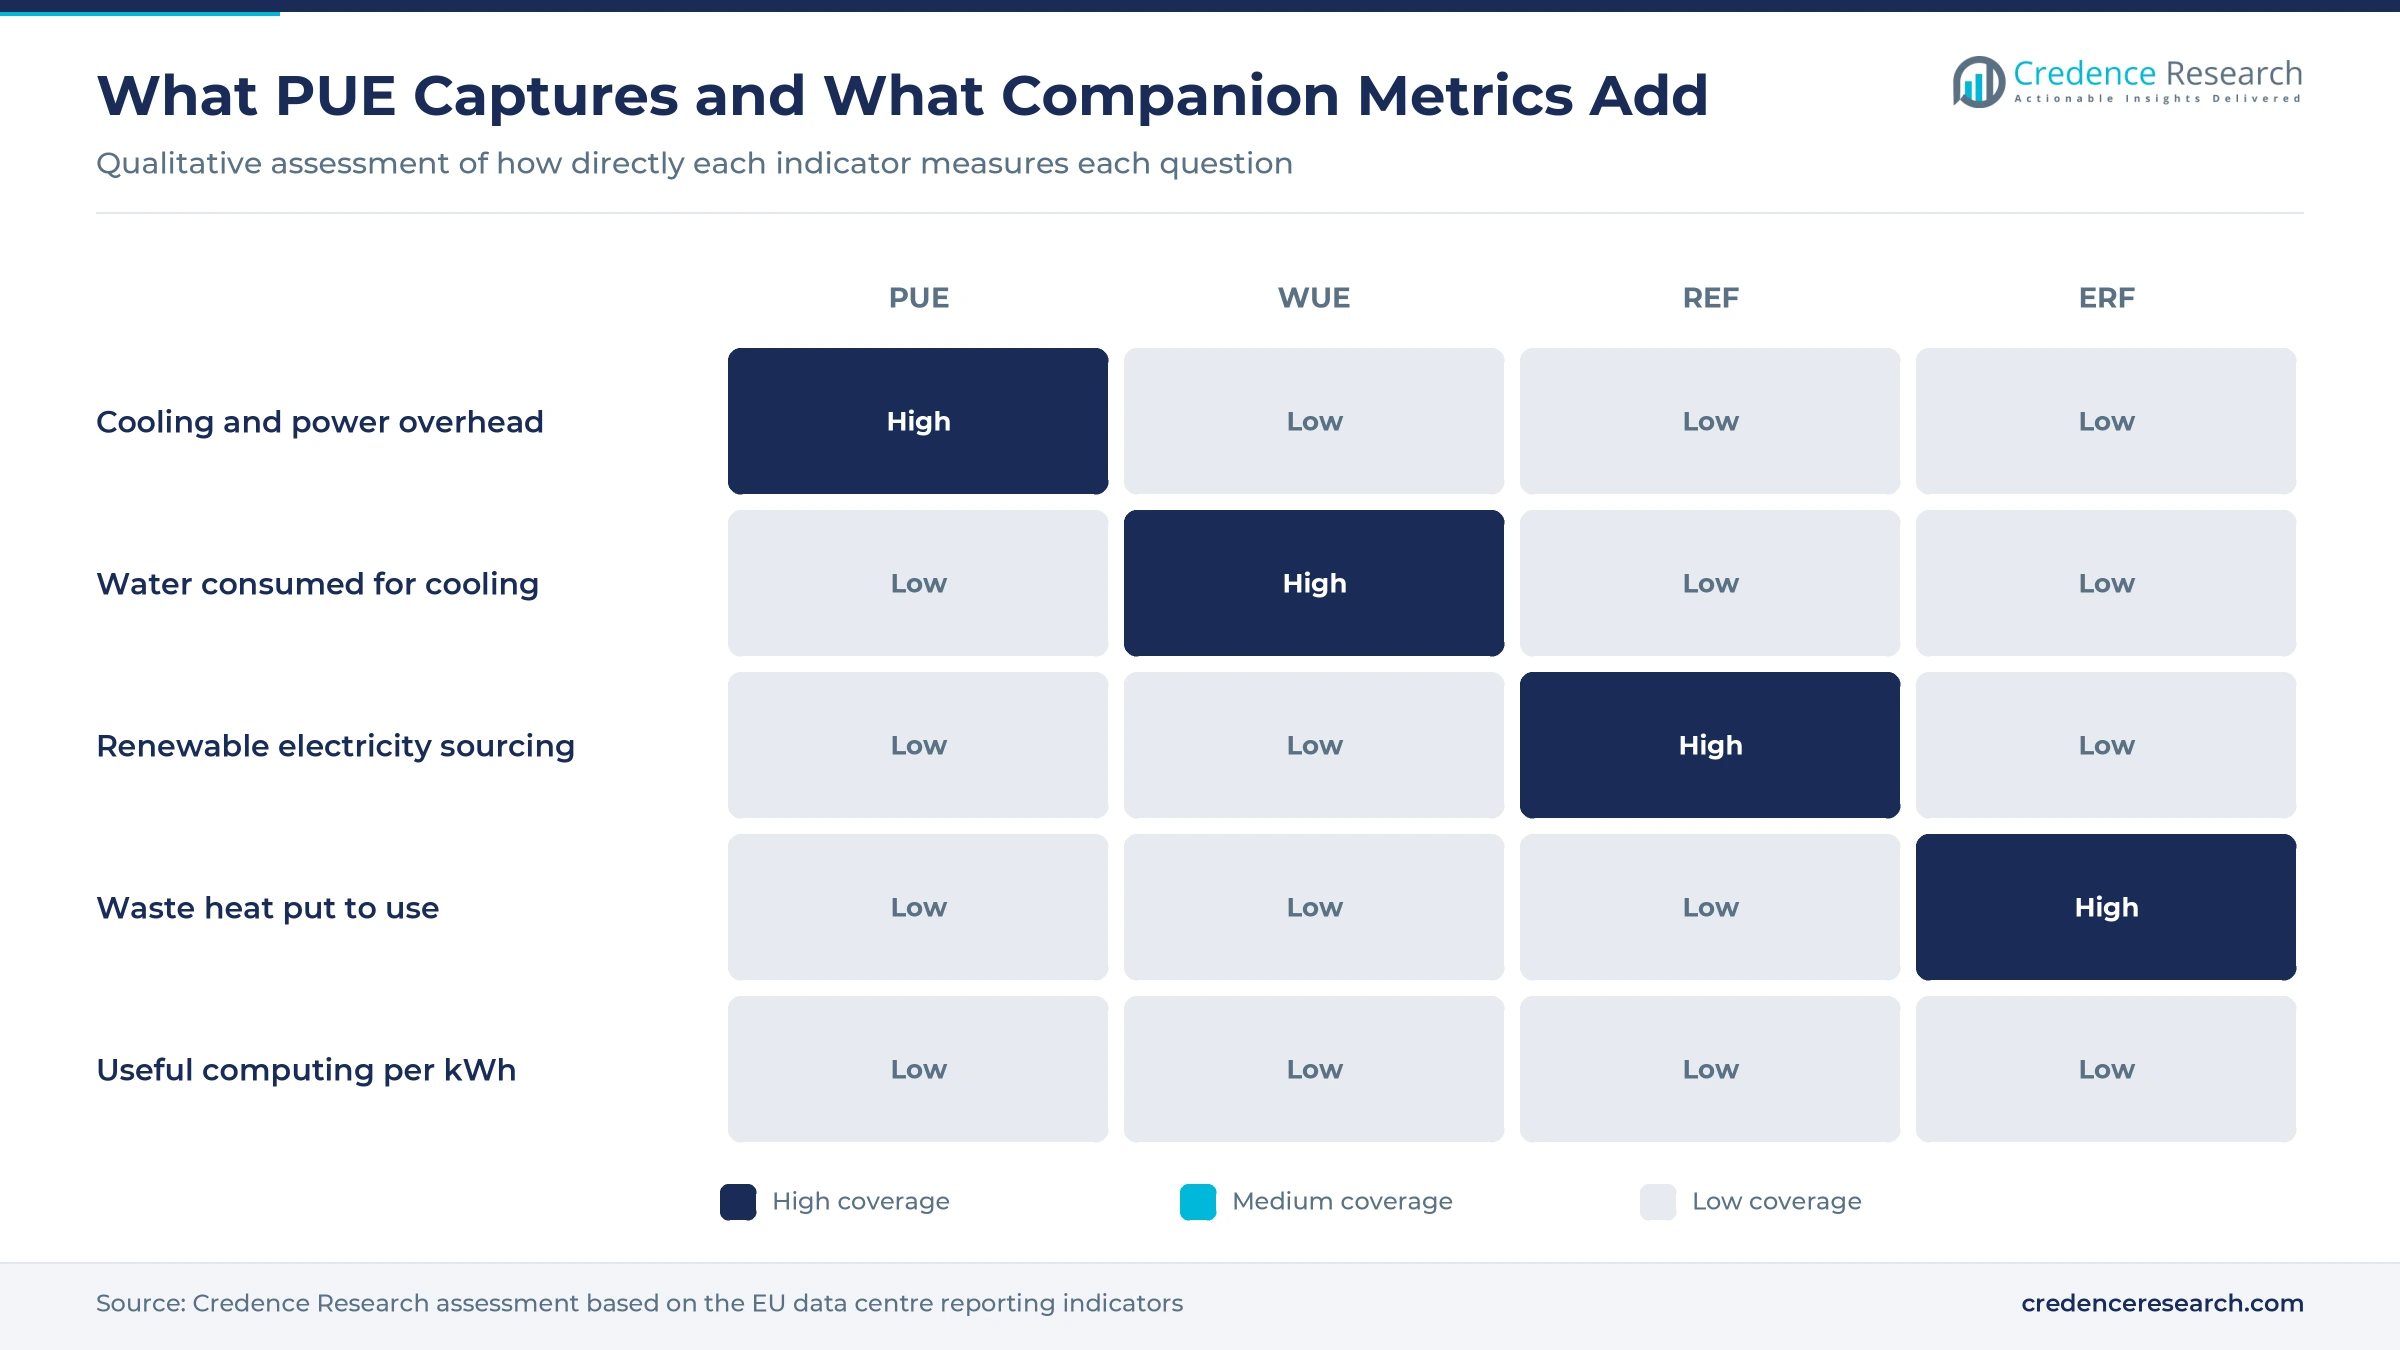
PUE is also silent on water, carbon and heat reuse. The LBNL modeling notes that economizers, adiabatic cooling and dry coolers can all lower PUE, yet adiabatic systems save energy by evaporating water, so a low PUE can coincide with high water use. The EU scheme therefore collects companion indicators alongside PUE, including water usage effectiveness (WUE), the renewable energy factor (REF) and the energy reuse factor (ERF). In the first EU reporting period the weighted REF was 0.86 and more than 70% of sites matched all of their electricity with renewable supply, yet only 67 data centers reported any waste heat reuse. Meta, for comparison, reports an annual WUE of 0.19 liters of water withdrawn per kWh of IT energy for 2024.
Practical levers that lower PUE
Because PUE is an overhead ratio, improvement comes from shrinking the energy spent between the utility meter and the server and from removing heat with less mechanical work. Four levers account for most of the gap between legacy sites and new builds.
- Power conversion losses are the first target, and LBNL's model assumes UPS efficiencies of 77% to 85% in small edge, branch and small business sites against 90% to 99% in hyperscale and AI facilities. Every percentage point lost in conversion appears directly as overhead, which is why UPS topology and loading are central to the data center UPS market analysis.
- Cooling plant and economizer hours come next, since raising supply temperatures and using outside air or dry coolers for more hours of the year reduces the hours that chillers and compressors must run. Equipment choices for that shift are covered in the data center cooling market report.
- Utilization matters because fixed overhead spread across a fuller hall lowers the ratio, so capacity planning that avoids stranded power improves PUE without any equipment change.
- Measurement and control close the loop, because operators cannot manage what roughly a quarter of them do not track. Metering at the PDU or server level, combined with monitoring software, reveals losses that monthly utility bills hide, a function examined in the data center infrastructure management market report.
Older halls may lack the floor space or structural capacity for new plant, warm climates cap economizer hours, and higher supply temperatures must stay within the thermal envelope that the IT equipment supports. Small sites, where LBNL assumes the lowest UPS efficiencies, also report the weakest EU average, at 1.64.
How to read a PUE claim
A single PUE figure is only as useful as the method behind it. Colocation buyers, investors and engineers can test any claim on six points.
- Period comes first, since only an annual figure covering all seasons follows the ISO/IEC 30134-2 approach, unlike a quarterly reading or a design target.
- Measurement point shows whether IT energy is metered at the UPS output, the PDU or the server input, and coarser points produce lower numbers.
- Boundary reveals whether the figure covers the whole site or only a partial PUE for one hall that excludes shared plant.
- Load level matters because a new campus at low occupancy will report a higher PUE than it will at steady state, as the quarterly swings at newer hyperscale campuses show.
- Climate separates cool regions with long economizer seasons from hot, humid ones, though climate alone does not explain the EU spread.
- Companion metrics such as WUE, renewable sourcing and heat reuse show whether a low PUE is hiding a water or carbon cost.
Answers to these questions turn PUE from a marketing number into a planning input. Facility energy budgets, grid connection requests and the electrical design work covered in the data center power management market report all start from an assumed overhead ratio, so an optimistic PUE carried into a design understates the power a site will actually need. With EU reporting now annual and minimum standards under preparation, the operators best placed are those that can show a metered, 12-month figure, explain what drives it and set out how it will change as their halls fill.
Go deeper with our research
- Green Data Center Market Size, Share, Growth and Forecast 2032
- Data Center Uninterruptable Power Supply Market Size and Forecast 2032
- Data Center Cooling Market Size, Growth and Forecast, 2032
- Data Center Infrastructure Management Market Size and Forecast 2032
- Data Center Power Management Market Size, Share & Forecast 2032