
Green Hydrogen vs. Blue Hydrogen: Production and Commercial Trade-offs
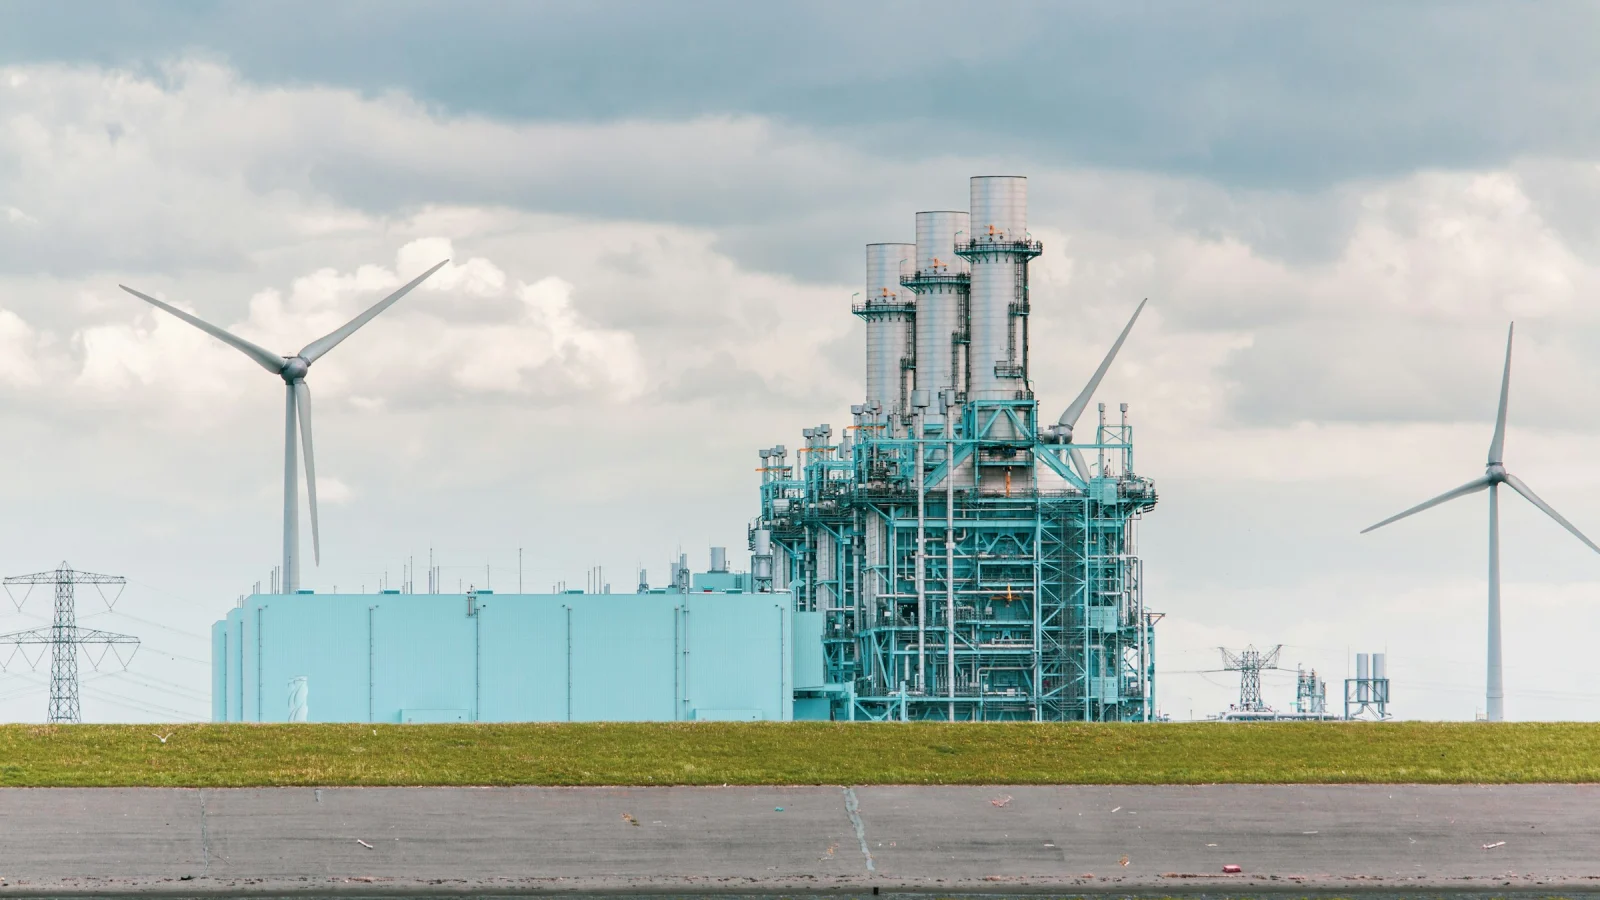
Green hydrogen is made by splitting water in an electrolyzer powered by renewable electricity. Blue hydrogen is made from natural gas through steam methane reforming or autothermal reforming, with the resulting carbon dioxide captured and stored. Both aim to replace grey hydrogen, the unabated fossil product that still supplies almost all of the world's roughly 100 million tonnes a year. The trade-off is clear in outline. Green hydrogen can approach zero production emissions but costs more and depends on cheap, plentiful clean power. Blue hydrogen uses mature, large-scale plants and is usually cheaper where gas is cheap, but its climate value depends on capture rates, upstream methane leakage and access to CO2 storage.
How each type of hydrogen is produced
The color labels describe production routes, not different molecules. Green and blue hydrogen are chemically identical; what differs is the energy source, emissions profile, capital structure and regulatory treatment.
Blue hydrogen: reforming natural gas with carbon capture
Most hydrogen today comes from steam methane reforming (SMR). According to the U.S. Department of Energy's Hydrogen Program, SMR reacts methane with high-temperature steam at 700°C to 1,000°C and 3 to 25 bar over a catalyst, producing hydrogen, carbon monoxide and a small amount of carbon dioxide. A water-gas shift reaction then converts the carbon monoxide and steam into more hydrogen and CO2, and pressure swing adsorption removes CO2 and impurities to leave nearly pure hydrogen. The DOE states that 95% of hydrogen produced in the United States is made by natural gas reforming in large central plants.
Blue hydrogen adds carbon capture to this process. In a conventional SMR, CO2 leaves the plant in two streams: a concentrated process stream from the shift reaction and a dilute flue gas stream from burning gas to heat the reformer. Capturing only the concentrated stream is relatively simple, but it leaves a large share of emissions untreated. Autothermal reforming (ATR) supplies heat inside the reactor by partially oxidizing the feed with oxygen, which concentrates most of the CO2 in one stream and makes higher capture rates easier to engineer. The captured CO2 must then be compressed, transported and injected into geological storage, which links every blue project to the carbon capture and storage service market and its pipeline and permitting timelines.
Green hydrogen: electrolysis with renewable power
Green hydrogen uses electricity to split water into hydrogen and oxygen. The DOE describes three main electrolyzer families:
- Alkaline electrolyzers use a liquid alkaline solution of potassium hydroxide or sodium hydroxide and typically operate at about 60°C to 90°C. They are the most established design.
- Proton exchange membrane (PEM) electrolyzers use a solid plastic membrane that allows only protons to pass and typically operate at about 70°C to 90°C.
- Solid oxide electrolyzers (SOECs) use a solid ceramic electrolyte that conducts oxide ions and operate at about 650°C to 850°C. They can use heat, including from nuclear plants or industrial processes, to reduce the electricity needed.
Developments across these technologies are tracked in the hydrogen electrolyzer market.
Lifecycle emissions: capture rates and methane leakage
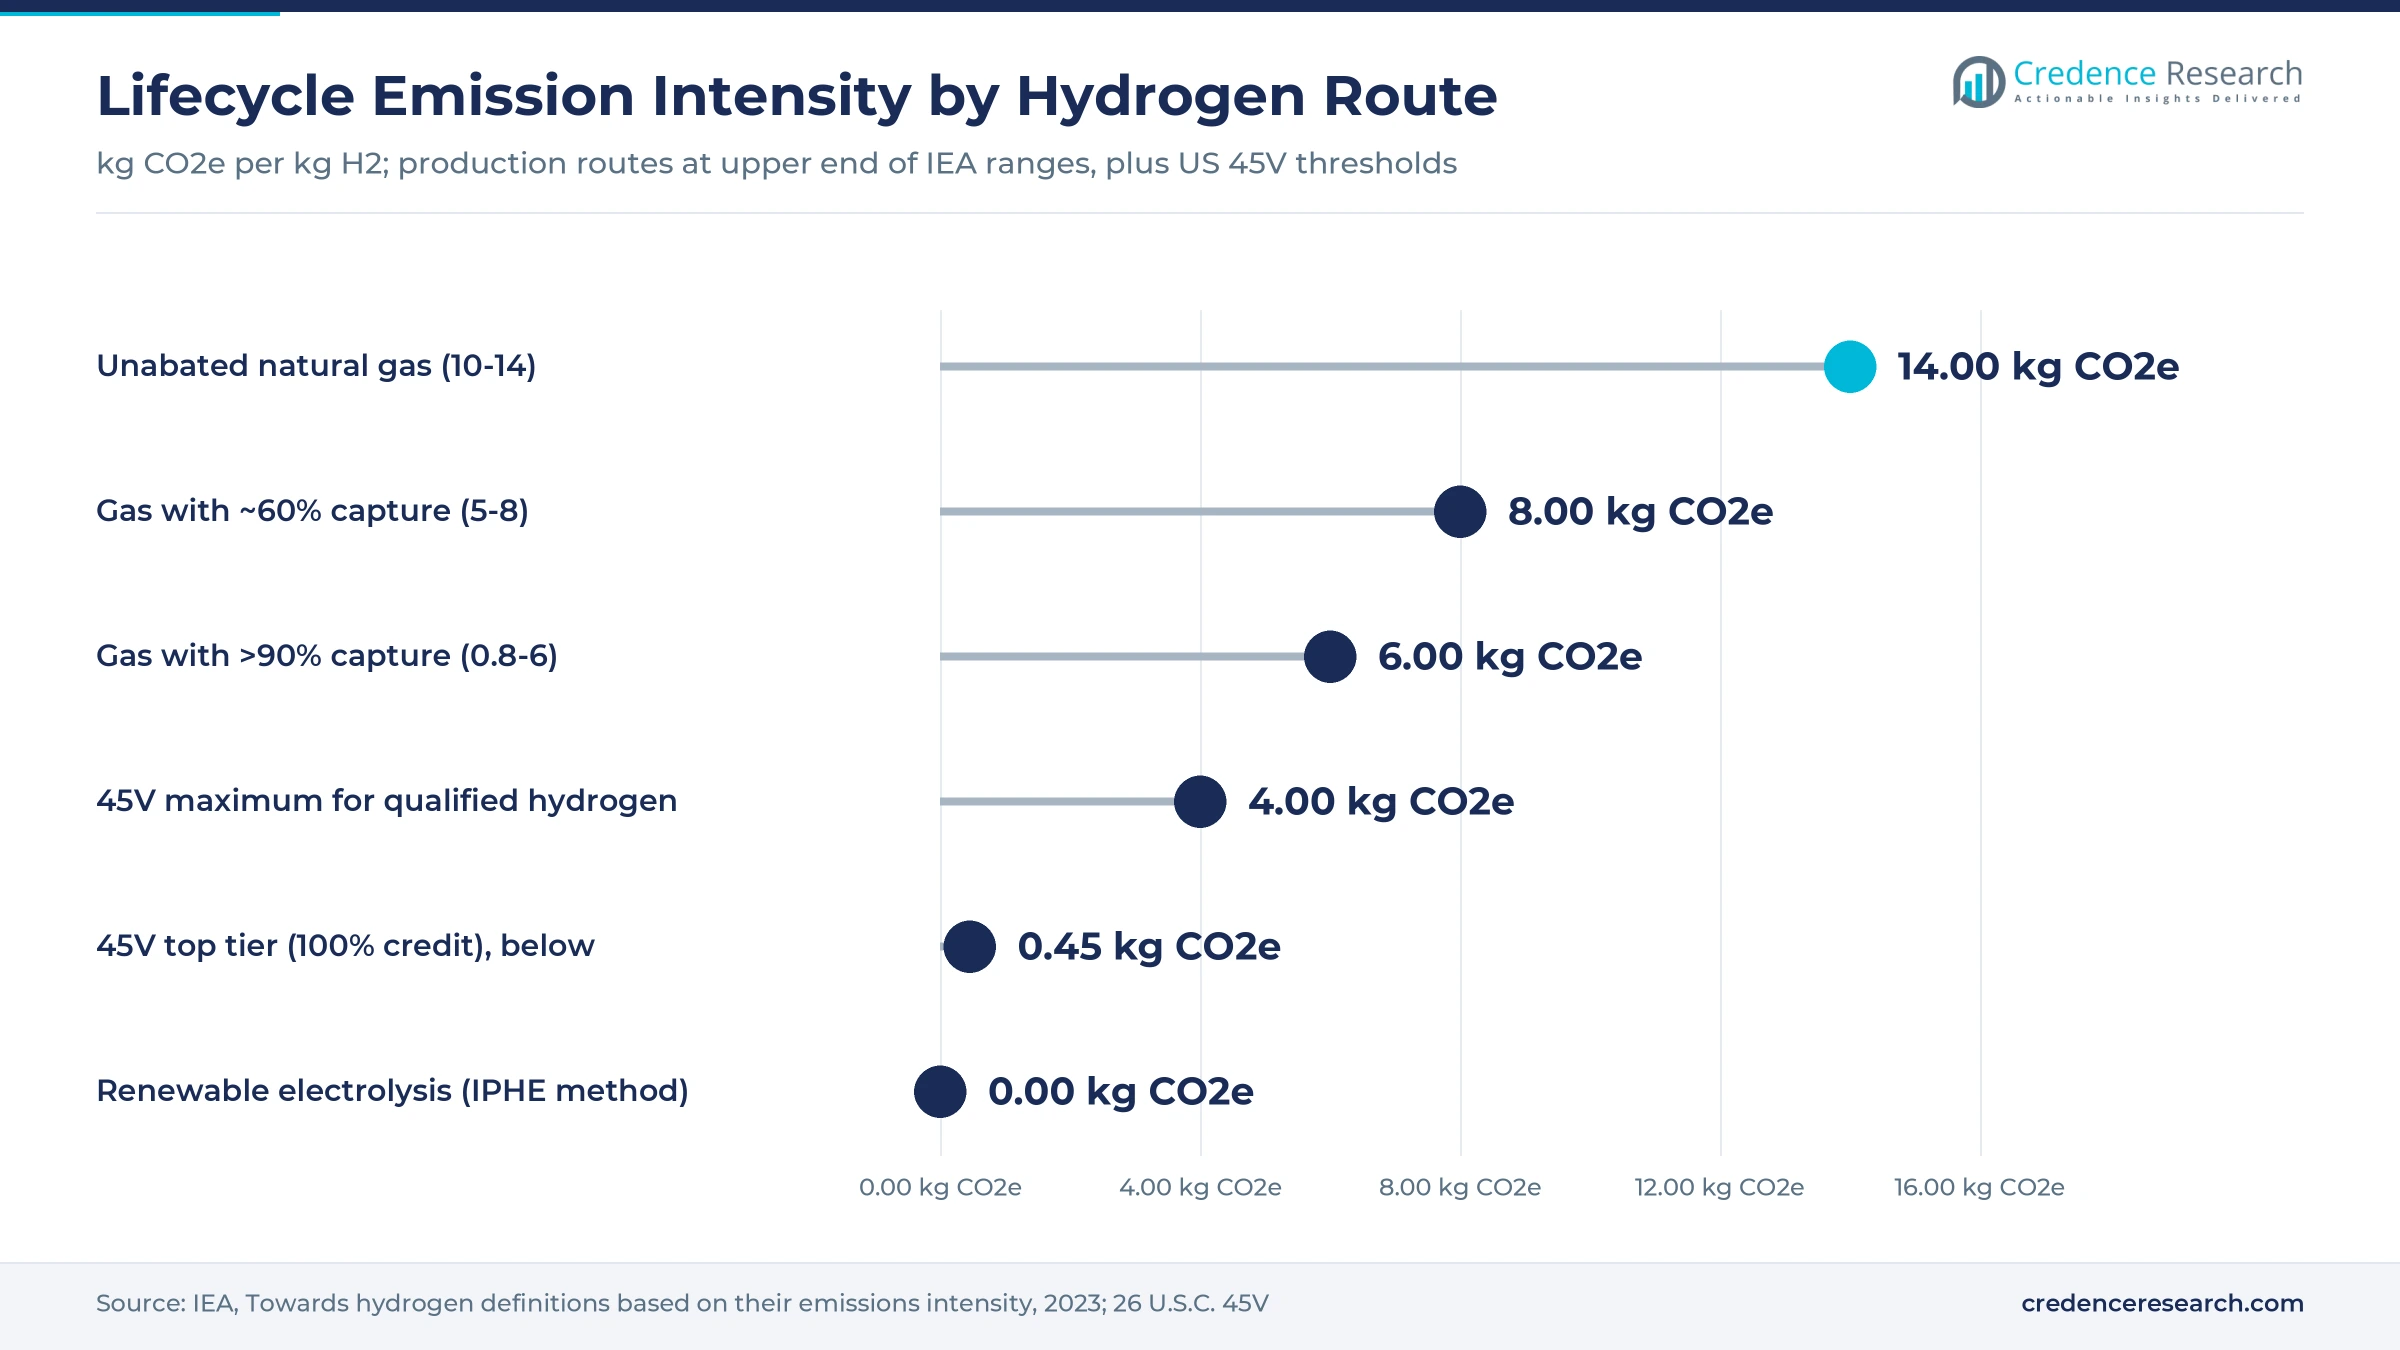
The climate case for each route rests on lifecycle emissions, usually measured in kilograms of CO2 equivalent per kilogram of hydrogen (kg CO2e/kg H2) from the wellhead or power source to the plant gate. The IEA's 2023 report on hydrogen definitions puts unabated natural gas-based hydrogen at 10 to 14 kg CO2e/kg H2, of which upstream and midstream emissions contribute 1 to 5 kg. Unabated fossil production can reach up to 27 kg CO2e/kg H2 depending on those upstream emissions.
Carbon capture lowers that figure, but by how much depends on design. The IEA estimates that retrofitting existing plants to capture CO2 from feedstock-related gas use achieves roughly 60% capture and results in 5 to 8 kg CO2e/kg H2. Capture rates above 90% require advanced configurations that the IEA noted in 2023 were not yet operating, and would result in 0.8 to 6 kg CO2e/kg H2.
The width of that last range is the methane problem. At high capture rates, upstream and midstream emissions from producing and transporting natural gas account for 0.7 to 5 kg CO2e/kg H2, so they dominate the total. Two blue hydrogen plants with identical capture equipment can therefore have very different footprints depending on where their gas comes from.
Green hydrogen faces a parallel issue on the power side. The IEA assigns renewable electrolysis 0 kg CO2e/kg H2 under the International Partnership for Hydrogen and Fuel Cells in the Economy methodology, which treats solar, wind, hydro and geothermal power as zero-emission. Electrolyzers drawing grid electricity are different: their emissions vary greatly between hours, depending on which generator meets the additional demand. An electrolyzer running on a fossil-heavy grid can produce hydrogen with a higher footprint than grey hydrogen.
How regulators define clean and low-carbon hydrogen
The color labels have no legal meaning; tax codes and market rules use emission-based definitions instead.
United States: Section 45V and the clean hydrogen standard
Under Section 45V of the Internal Revenue Code, qualified clean hydrogen must be produced with lifecycle emissions of no more than 4 kg CO2e/kg H2, measured well-to-gate. The credit scales with emission intensity. Hydrogen at 2.5 to 4 kg earns 20% of the base amount, 1.5 to 2.5 kg earns 25%, 0.45 to 1.5 kg earns 33.4% and below 0.45 kg earns 100%. The base amount is $0.60 per kilogram, adjusted for inflation, and is multiplied by five for facilities that meet prevailing wage and apprenticeship requirements. The 2025 budget law, Public Law 119-21, moved the deadline for starting construction from 2033 to before Jan. 1, 2028.
The final Treasury and IRS regulations, published Jan. 10, 2025, require producers to calculate emissions with the 45VH2-GREET model. For electrolysis using grid power, the regulations set three tests for the energy attribute certificates that producers buy. The clean generator must have begun commercial operation no more than 36 months before the hydrogen facility, the power must come from the same region and it must be matched annually until 2030 and hourly from 2030. The DOE's separate Clean Hydrogen Production Standard, issued in June 2023, sets a target of 4.0 kg CO2e/kg H2 on a well-to-gate basis.
In practice, the top tier is very hard for blue hydrogen to reach because upstream methane alone can exceed 0.45 kg. Well-designed blue projects with low-leakage gas compete for the lower tiers, while renewable electrolysis meeting the power-sourcing rules targets the full credit.
European Union: RFNBOs and low-carbon hydrogen
The EU defines two categories. Renewable hydrogen, classed as a renewable fuel of non-biological origin (RFNBO), is governed by two delegated acts adopted in June 2023. According to the European Commission, these acts require RFNBO hydrogen to achieve at least 70% greenhouse gas emissions savings. Producers must source power from new renewable capacity and produce hydrogen when and where renewable electricity is available. Existing renewable installations can supply long-term power purchase agreements until Jan. 1, 2028. The rules apply to domestic and imported hydrogen alike, and the EU targets at least 42% of industrial hydrogen from RFNBOs by 2030, rising to 60% in 2035.
Low-carbon hydrogen, which covers gas with carbon capture, is defined in a separate delegated act adopted on July 8, 2025. The Commission states that it must reach a threshold of 70% greenhouse gas emissions savings relative to unabated fossil fuels. The IEA's policy summary of the act notes that it includes a default upstream emission value for natural gas, that electrolysis using nuclear electricity is not yet included and that the Commission must assess region-specific default values by July 2028.
Production cost drivers for green and blue hydrogen
The cost gap remains the main barrier. IRENA's 2020 cost reduction study found that green hydrogen cost two to three times more than blue hydrogen. More recent IEA work frames the gap against grey hydrogen. The IEA's Global Hydrogen Review 2025 states that renewable hydrogen can be between 1.5 and 7 times more expensive than unabated fossil hydrogen. The 2024 edition projected that the cost of renewable hydrogen would fall to $2 to $9 per kilogram by 2030, narrowing the gap with unabated fossil production from $1.5 to $8 per kilogram to $1 to $3 per kilogram. The IEA's Global Hydrogen Review 2026 expects low-emissions hydrogen to remain more costly than fossil-based hydrogen in most parts of the world, apart from China, where renewable hydrogen could become cost-competitive by 2030.
For green hydrogen, the main cost drivers are:
- Electricity price. Power is the largest operating input, so sites with low-cost wind, solar or hydro hold a structural advantage.
- Capacity factor. An electrolyzer running a few thousand hours a year spreads its capital cost over less output. Hybrid wind-solar sites, storage and grid backup raise utilization but add cost or complicate compliance with hourly matching rules.
- Electrolyzer capital cost. The IEA's 2025 review put the 2024 cost of an electrolyzer manufactured and installed outside China at $2,000 to $2,600 per kilowatt, against $600 to $1,200 per kilowatt in China. Scale and manufacturing learning are expected to lower costs, a dynamic covered in the electrolysis hydrogen generation market analysis.
For blue hydrogen, the drivers are different:
- Natural gas price. Gas is both feedstock and fuel, so regional gas prices largely set production costs. The IEA's 2025 review notes that carbon capture is likely to be more competitive in the near term in regions with cheaper gas, such as the United States and the Middle East.
- CO2 transport and storage. A project needs a pipeline or shipping route to a permitted storage site, and fees for that service. Where storage is unavailable, blue hydrogen is not an option.
- Capture rate. Higher capture requires more equipment, oxygen supply for ATR and extra energy, which raises cost per kilogram.
Current production mix and project pipeline
Low-emissions hydrogen of either type remains a small share of supply. The IEA's 2025 review found that hydrogen production reached almost 100 million tonnes in 2024, using 290 billion cubic meters of natural gas and 90 million tonnes of coal equivalent, while less than 1% came from low-emissions technologies. The 2026 review reports that global demand surpassed 100 million tonnes in 2025 and that low-emissions production grew 20% to almost 1 million tonnes. It expects low-emissions hydrogen to exceed 1% of global production for the first time in 2026.
Both pathways are growing from that small base. Installed electrolysis capacity doubled in 2025 to more than 4 GW, according to the 2026 review, and some large carbon capture-based projects in North America have reached final investment decisions. The pipeline is contracting, though. Announced low-emissions production for 2030 has shrunk to 27 million tonnes, and committed projects plus those with strong potential fell from 10 million tonnes to just above 6 million tonnes compared with the previous review. The IEA also reports that offtake agreements remain insufficient to unlock large-scale investment. The broader trajectory of renewable supply is followed in the green hydrogen market report.
Water and land requirements
Both routes consume water, and the differences are smaller than often assumed. A 2026 DOE program record on water use in hydrogen production sets the stoichiometric minimum for electrolysis at 2.36 gallons of water per kilogram of hydrogen. Direct on-site consumption ranges from 2.4 gallons with dry cooling to 8 gallons with conventional cooling towers for PEM electrolysis. The same record estimates 2.1 gallons per kilogram for SMR without capture and 6.4 gallons with capture, because carbon capture adds cooling and process water demand.
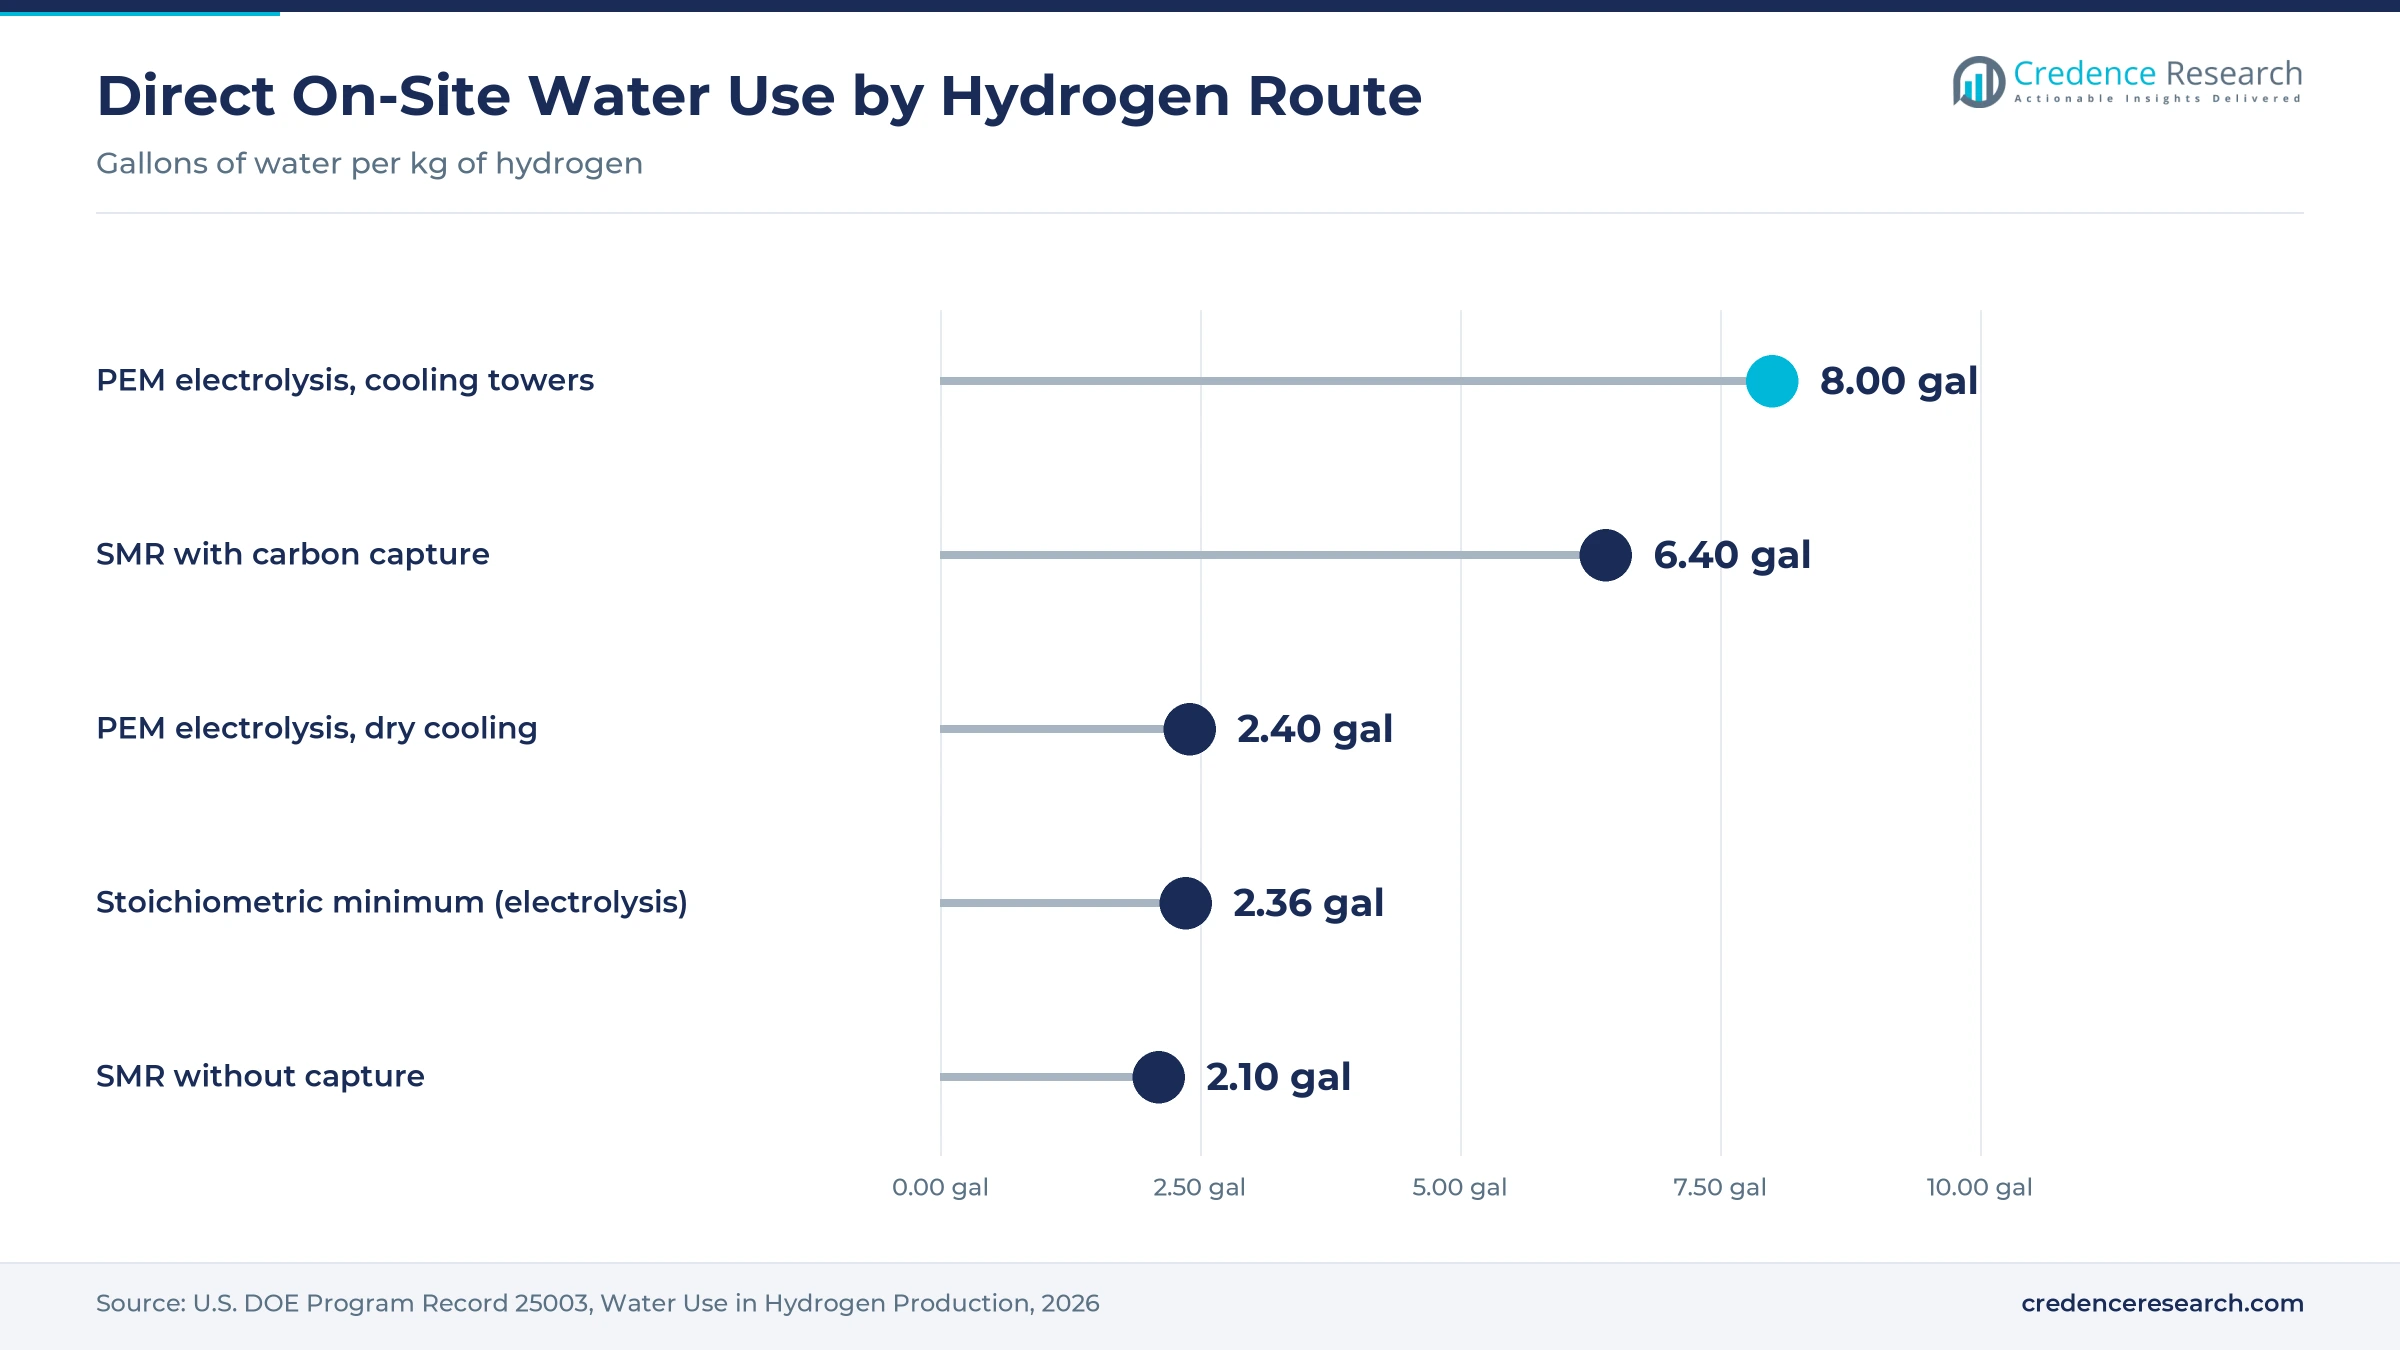
Cooling design matters as much as technology choice, and siting matters most. IRENA's 2023 water report calls for careful consideration of water use in water-scarce areas. Land needs follow the energy source. A green hydrogen plant needs a large renewable generation footprint, whether co-located or contracted through the grid. A blue plant occupies an industrial site but depends on gas supply and CO2 pipeline corridors.
Where each route makes commercial sense
Geography decides much of the choice. Blue hydrogen fits regions with low-cost gas, existing reforming assets, credible methane controls and accessible geological storage; the IEA points to the United States and the Middle East. Green hydrogen fits regions with abundant low-cost renewable power and domestic electrolyzer manufacturing. China, which the IEA says accounts for 65% of installed and committed electrolysis capacity, is the leading example.
End uses shape the choice as well:
- Refining. Refineries already consume large volumes of grey hydrogen for hydrotreating and hydrocracking, often from on-site SMRs. Adding capture to existing units or contracting low-emissions supply is a direct substitution, and EU demand measures target this sector. The petroleum refining hydrogen market is a likely early buyer for both routes.
- Ammonia. Ammonia plants run continuously and need steady hydrogen supply. Blue hydrogen matches that profile, while green projects need storage or firm power to avoid production swings.
- Steel. Hydrogen-based direct reduced iron needs large volumes of hydrogen at low cost. Green hydrogen supports the deepest emission cuts, but projects depend on power prices, and blending hydrogen with natural gas offers a transition path.
Key risks for green and blue hydrogen projects
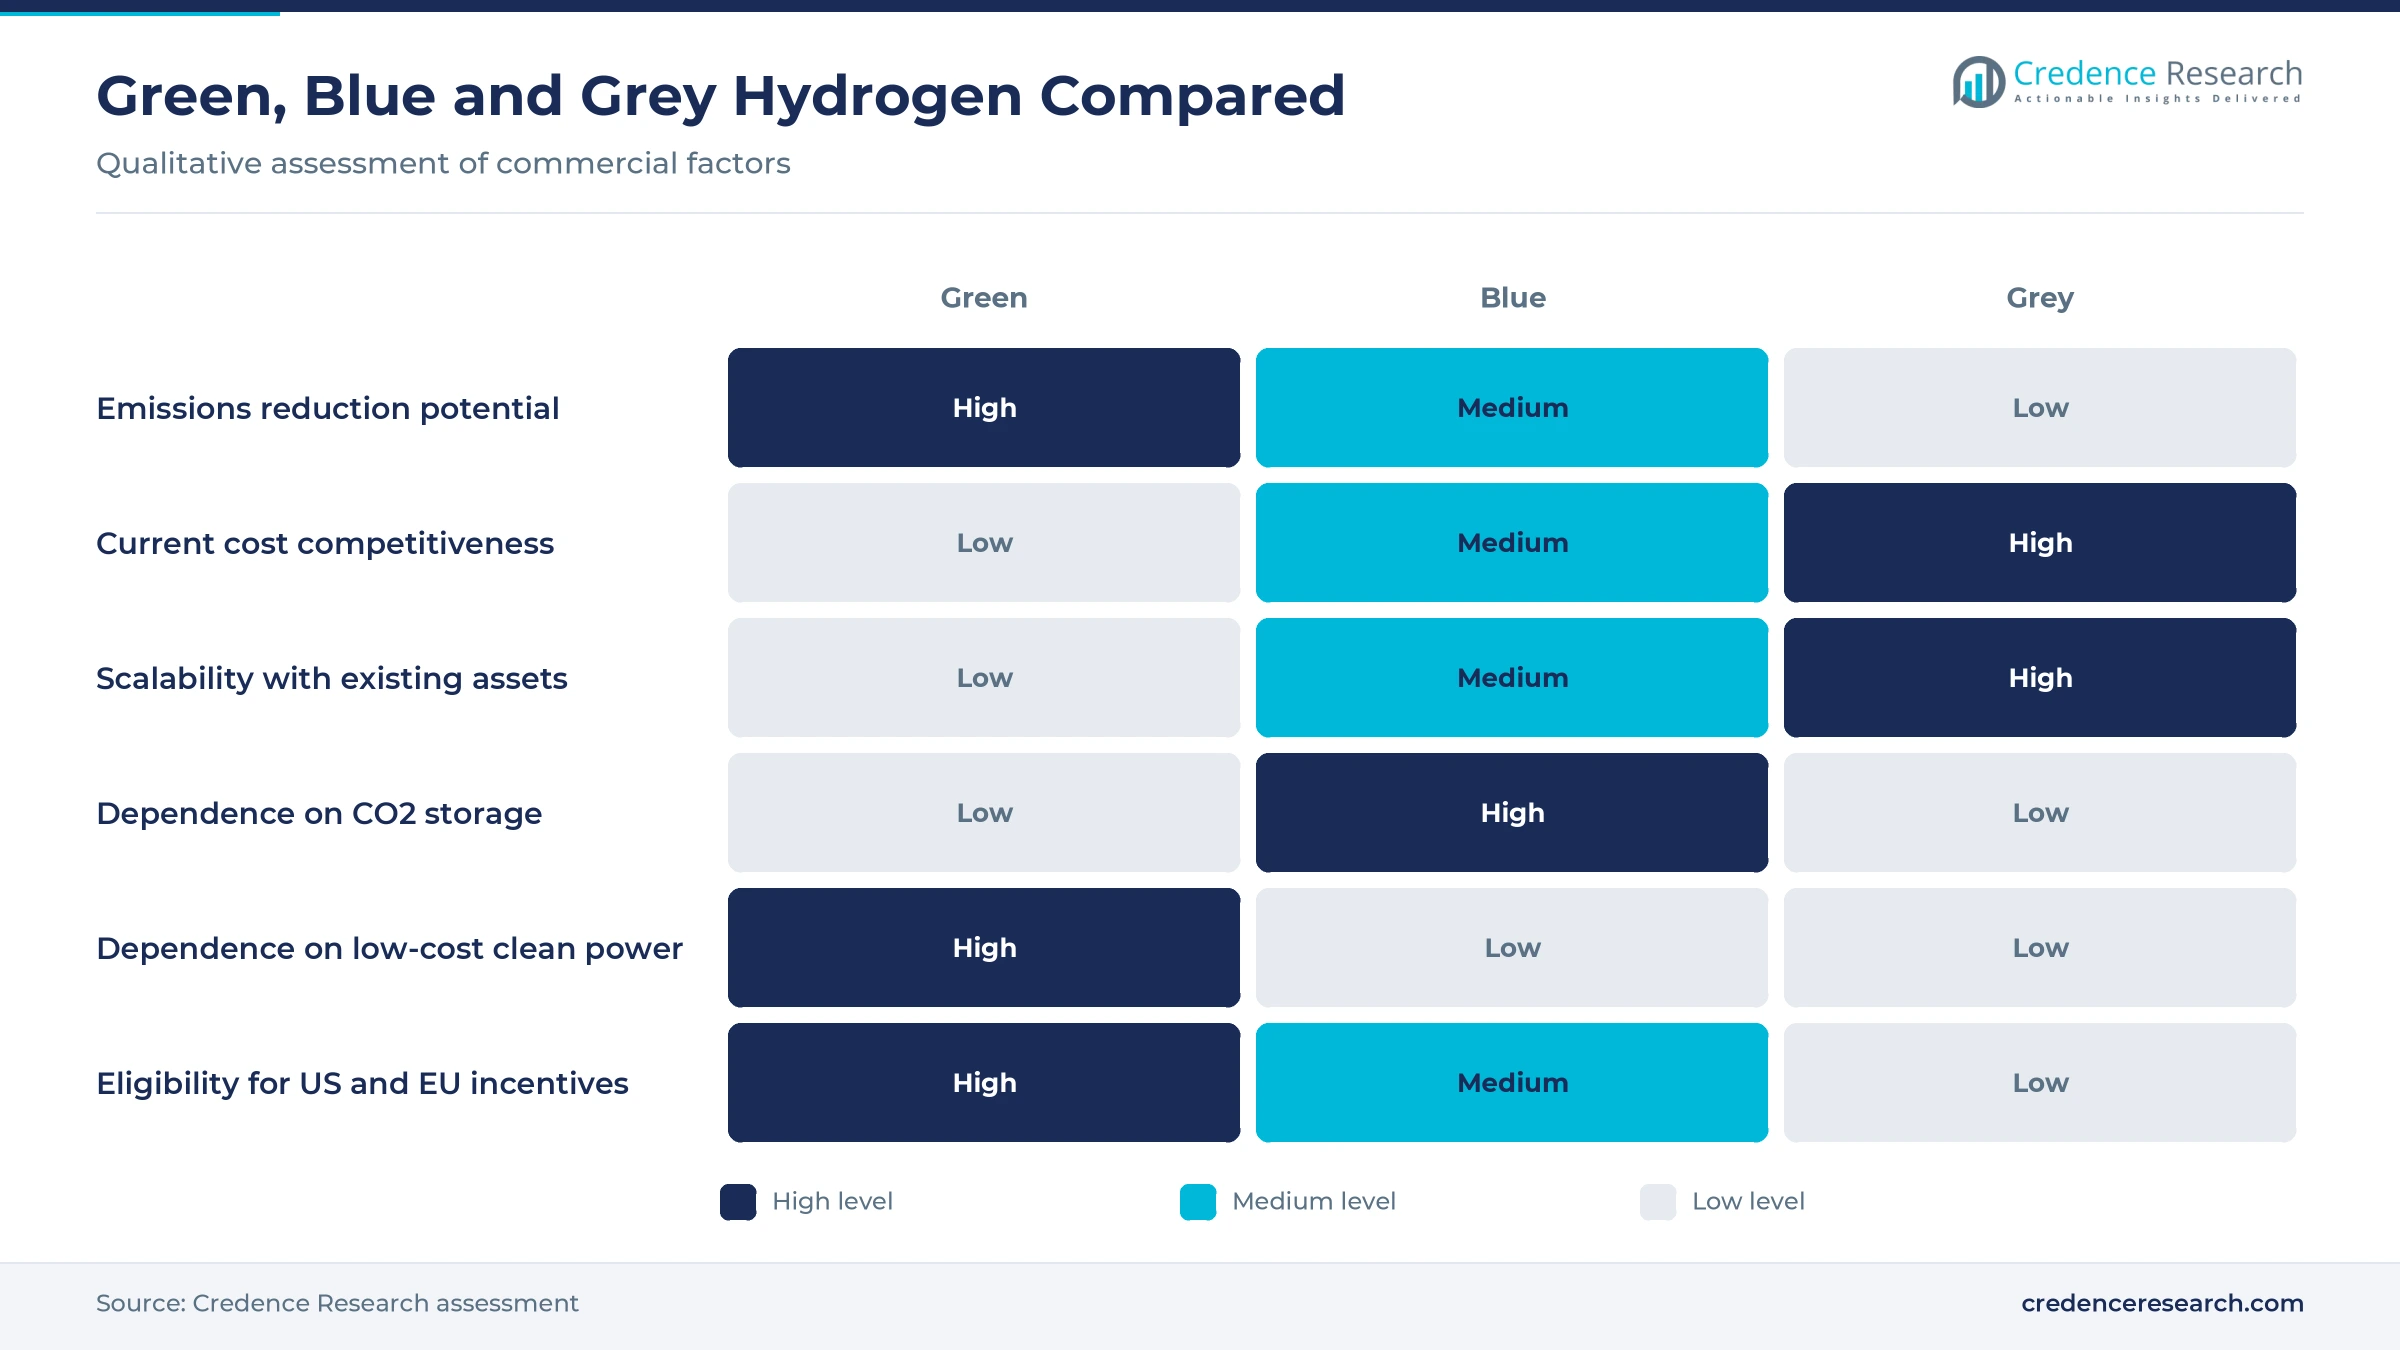
Green hydrogen projects face power price and availability risk, rules on new capacity and time matching that can restrict operations, electrolyzer performance and degradation uncertainty and a cost gap that depends on continued policy support. Blue hydrogen projects face gas price volatility, uncertain long-term treatment of upstream methane, dependence on third-party CO2 storage and the risk that tightening thresholds strand plants designed for moderate capture rates. Both share offtake risk: without long-term contracts at prices that cover the premium, financing stalls, as the shrinking project pipeline shows.
What buyers and investors should evaluate
Industrial buyers, developers and investors comparing green and blue supply should focus on verifiable attributes rather than color labels:
- Certified emission intensity. Ask for well-to-gate kg CO2e/kg H2 under the methodology of the target market, whether 45VH2-GREET in the United States or the EU RFNBO and low-carbon rules.
- Upstream methane data. For blue supply, require measured or source-specific methane intensity, not national defaults alone.
- Capture rate and storage contracts. Confirm the design capture rate, the CO2 storage operator, permits and long-term liability arrangements.
- Power sourcing. For green supply, check that power contracts meet new-capacity, regional and time-matching tests, including the U.S. move to hourly matching in 2030.
- Supply reliability. Match the production profile to the process. Continuous processes need firming, storage or backup supply.
- Policy durability. Model project economics with and without incentives, including the 45V construction deadline and EU review dates.
In many markets the near-term answer will be a portfolio: blue hydrogen where gas and storage are available, green hydrogen as power and electrolyzer costs fall. Contracts that specify emission intensity, verification and flexibility to switch sources protect buyers as rules evolve.
Go deeper with our research
- Green Hydrogen Market Size, Growth, Share and Forecast 2032
- Hydrogen Electrolyzer Market Size, Share and Forecast 2032
- Electrolysis Hydrogen Generation Market Size, Share and Forecast 2032
- Petroleum Refining Hydrogen Market Size, Growth and Forecast 2032
- Carbon Capture and Storage Market Size, Share and Forecast 2032