
Quick answer
A formaldehyde plant oxidizes methanol with air over a catalyst and absorbs the gas in water to make formalin, the feedstock for wood-panel resins, polyacetal plastics and polyols. A greenfield metal oxide unit of 100,000 metric tons a year of 37% solution needs an estimated USD 10–25 million of CapEx. Methanol is about 78% of operating cost, so gross margin of 22–46% follows the formalin-methanol spread. Payback is about 2–6 years at mid-range CapEx.
Attractive as a captive or resin-integrated unit beside panel mills or derivative plants, but thin as a merchant seller in oversupplied regions because formalin is costly to ship and methanol drives nearly all cost.
Formaldehyde plant: key highlights
| Parameter | Indicative value | Note |
|---|---|---|
| Plant capacity | 100,000 metric tons a year of 37% formalin | About 37,000 tons of 100% formaldehyde, iron-molybdate metal oxide route, 330 operating days |
| Total CapEx | USD 10–25 million | Greenfield; low end reflects an Asian or Middle East site, top end an EU or U.S. site with a licensed process |
| Raw material share of operating cost | 75–80% | Methanol at an assumed USD 320–370 per ton delivered |
| Gross margin | 22–46% | Formalin price minus methanol and direct conversion cost |
| Payback period | 2–6 years | 90% utilization, mid-range CapEx of USD 17.5 million; longer where merchant spreads are thin |
| IRR | Available in report | Post-tax, 10-year model |
| Break-even | Available in report | Capacity utilization basis |
Ranges assume a 100,000-ton-a-year greenfield plant making 37% formalin by the metal oxide route, Asian to U.S. or EU sites, 2026 prices, 90% utilization, an assumed ex-works price of USD 240–290 per ton and delivered methanol at an assumed USD 320–370 per ton. CapEx is scaled from disclosed projects with a 0.6 exponent, at assumed rates of 86 rupees and 63 rubles per dollar. Customizable to any country.
What is formaldehyde?
Formaldehyde (CH2O), also called methanal, is the simplest aldehyde. At room temperature it is a colorless, pungent gas that polymerizes easily, so it is almost never sold pure. Producers ship it as formalin, a water solution of 37% to 55% by weight, or as solid paraformaldehyde and the trimer trioxane.
Because formalin is mostly water, freight costs climb quickly with distance. Most plants therefore sit inside or next to the resin, plastics or chemical units that consume them, and a large share of world output never reaches the open market.
Formaldehyde falls under Harmonized System subheading 2912.11, methanal, with paraformaldehyde in 2912.60. Urea-formaldehyde, melamine-formaldehyde and phenol-formaldehyde resins bind particleboard, MDF and plywood, which makes wood panels the largest outlet. Other uses include polyoxymethylene engineering plastic, MDI for polyurethanes, pentaerythritol, neopentyl glycol and other polyols, hexamine, agrochemicals and disinfectants. Concentrated solutions move as UN2209, Class 8, and the gas is classed as a human carcinogen.
Formaldehyde market overview and global demand
Formaldehyde demand is best tracked through its feedstock. Methanex, the largest methanol supplier, puts 2026 global methanol demand at about 100 million metric tons in its March 2026 investor presentation, with formaldehyde taking about 25%. That implies roughly 25 million tons of methanol a year, or about 22 million tons of 100% formaldehyde at typical yields. China accounts for about 60% of methanol demand, other Asia-Pacific markets 15%, and North America with Latin America and Europe about 10% each.
Credence Research values the global urea formaldehyde resin market, the largest outlet, at about USD 33.7 billion in 2025, based on its USD 33.1 billion estimate for 2024 and a 1.8% CAGR. Its slow growth mirrors housing and furniture cycles.
Cross-border trade is thin because water makes up most of each ton shipped. UN Comtrade data for HS 291211 show reported exports of only about USD 158 million and 430,000 tons in 2024, rising to about USD 188 million in 2025. The Netherlands led with about 118,000 tons at near USD 283 per ton, followed by Belgium, Germany, Italy and Poland, so most trade is short-haul within Europe. India shipped about 30,000 tons at about USD 220, while U.S. exports of about 13,000 tons averaged near USD 600.
New capacity keeps clustering beside users, as Chinese groups add plants for pentaerythritol and polyacetal and Indian makers expand alongside plywood demand, while European producers face tighter emission rules on panels from August 2026.
Formaldehyde manufacturing process
Two commercial routes oxidize methanol vapor. The silver process runs a methanol-rich mixture above the upper flammability limit over a silver gauze or crystal bed at about 600–720 degrees Celsius, combining partial oxidation with dehydrogenation. The metal oxide process, chosen for the reference plant, runs a lean mixture below the lower flammability limit over an iron-molybdate catalyst at about 250–400 degrees Celsius, reaching yields of roughly 92–93% and leaving almost no unconverted methanol in the product.
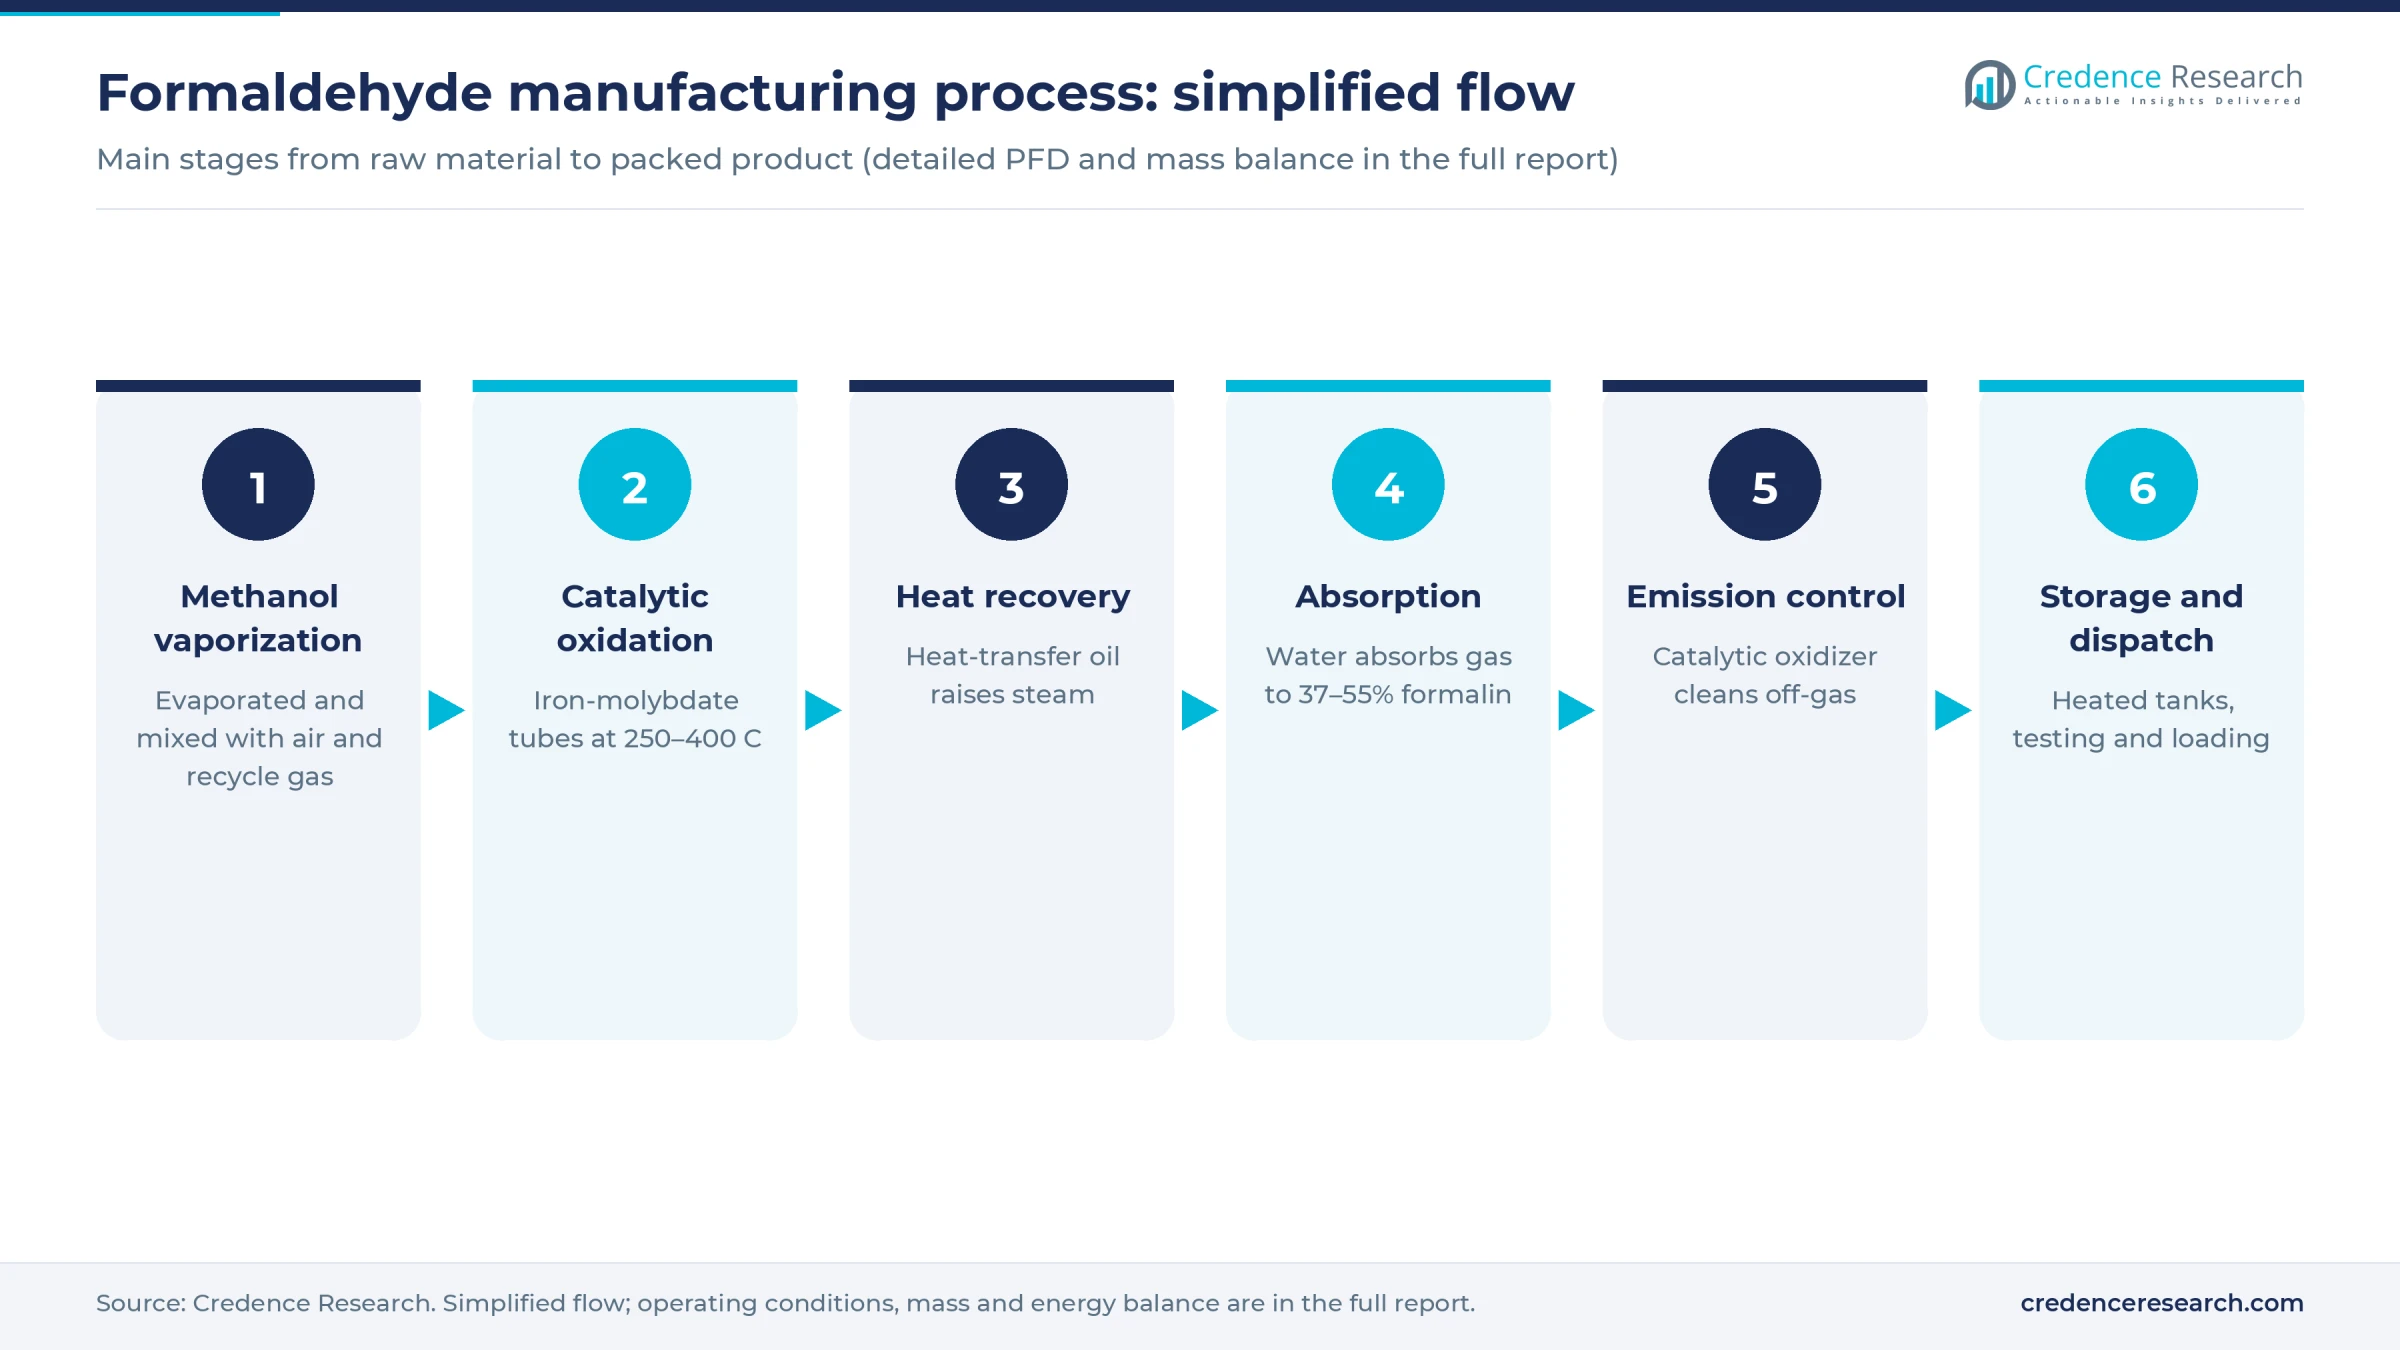
- Methanol receipt and vaporization. Methanol is pumped from storage, preheated and evaporated, then mixed with fresh air and recycled off-gas so the oxygen level stays outside the explosive range.
- Catalytic oxidation. The gas enters a multitubular reactor packed with catalyst pellets. A boiling heat-transfer fluid on the shell side removes reaction heat and holds a tight temperature profile, which protects the catalyst and limits by-products such as carbon monoxide and dimethyl ether.
- Gas cooling and steam raising. Hot product gas is cooled in an after-cooler, while the heat-transfer loop raises steam for the vaporizer and for export.
- Absorption. A packed or tray absorption tower contacts the gas with process water in countercurrent flow, producing formalin at the target strength, usually 37% for resin buyers or up to about 55% for long-haul shipment and captive resin plants.
- Emission control. Off-gas that is not recycled passes through a catalytic oxidizer that destroys residual methanol, formaldehyde, carbon monoxide and dimethyl ether before the stack.
- Storage and dispatch. Formalin is held in heated stainless steel tanks to avoid paraformaldehyde deposits, tested for strength, acidity and methanol content, then pumped to resin units or loaded to tank trucks and rail cars.
Silver plants need a distillation column to strip leftover methanol, while metal oxide units use less methanol per ton and run longer between catalyst changes.
Formaldehyde plant setup cost
The reference plant makes 100,000 metric tons a year of 37% formalin, about 300 tons a day over 330 operating days, in a single metal oxide line. Total CapEx is estimated at USD 10–25 million, including land, the reactor island, absorption and emission control, methanol and product tank farms, utilities, control systems, process license and engineering, preoperative costs and a working capital margin.
Disclosed projects anchor the range across regions. In September 2024, Kanoria Chemicals reported spending about 561 million rupees, or USD 6.5 million at an assumed 86 rupees per dollar, on a 345-ton-a-day metal oxide line at its existing Ankleshwar site in India. Scaled to 100,000 tons with a 0.6 capacity exponent, that gives about USD 6 million, or USD 10–12 million after assumed greenfield site, storage and owner costs. In Egypt, Al Ahram Chemicals plans a USD 10 million complex in the Sokhna zone for 25,000 tons a year each of formaldehyde and urea-formaldehyde concentrate; assigning an assumed 60–70% to formaldehyde and scaling up gives about USD 14–16 million. In Russia, Metadynea spent about 1.2 billion rubles, or near USD 19 million at an assumed 63 rubles per dollar, on a 91,000-ton plant of 55% formalin with licensed technology in 2018, which points to about USD 20 million after scaling and assumed cost escalation. Builds on the Gulf Coast of the United States can sit near or above the top of the range.
For the land row, the plant needs about 20,000 square meters for the process block, a methanol tank farm with fire spacing, formalin storage and truck loading. At an assumed USD 15–60 per square meter, land costs USD 300,000 to USD 1.2 million, about 4% of CapEx at the midpoint, with U.S. and EU sites at the top.
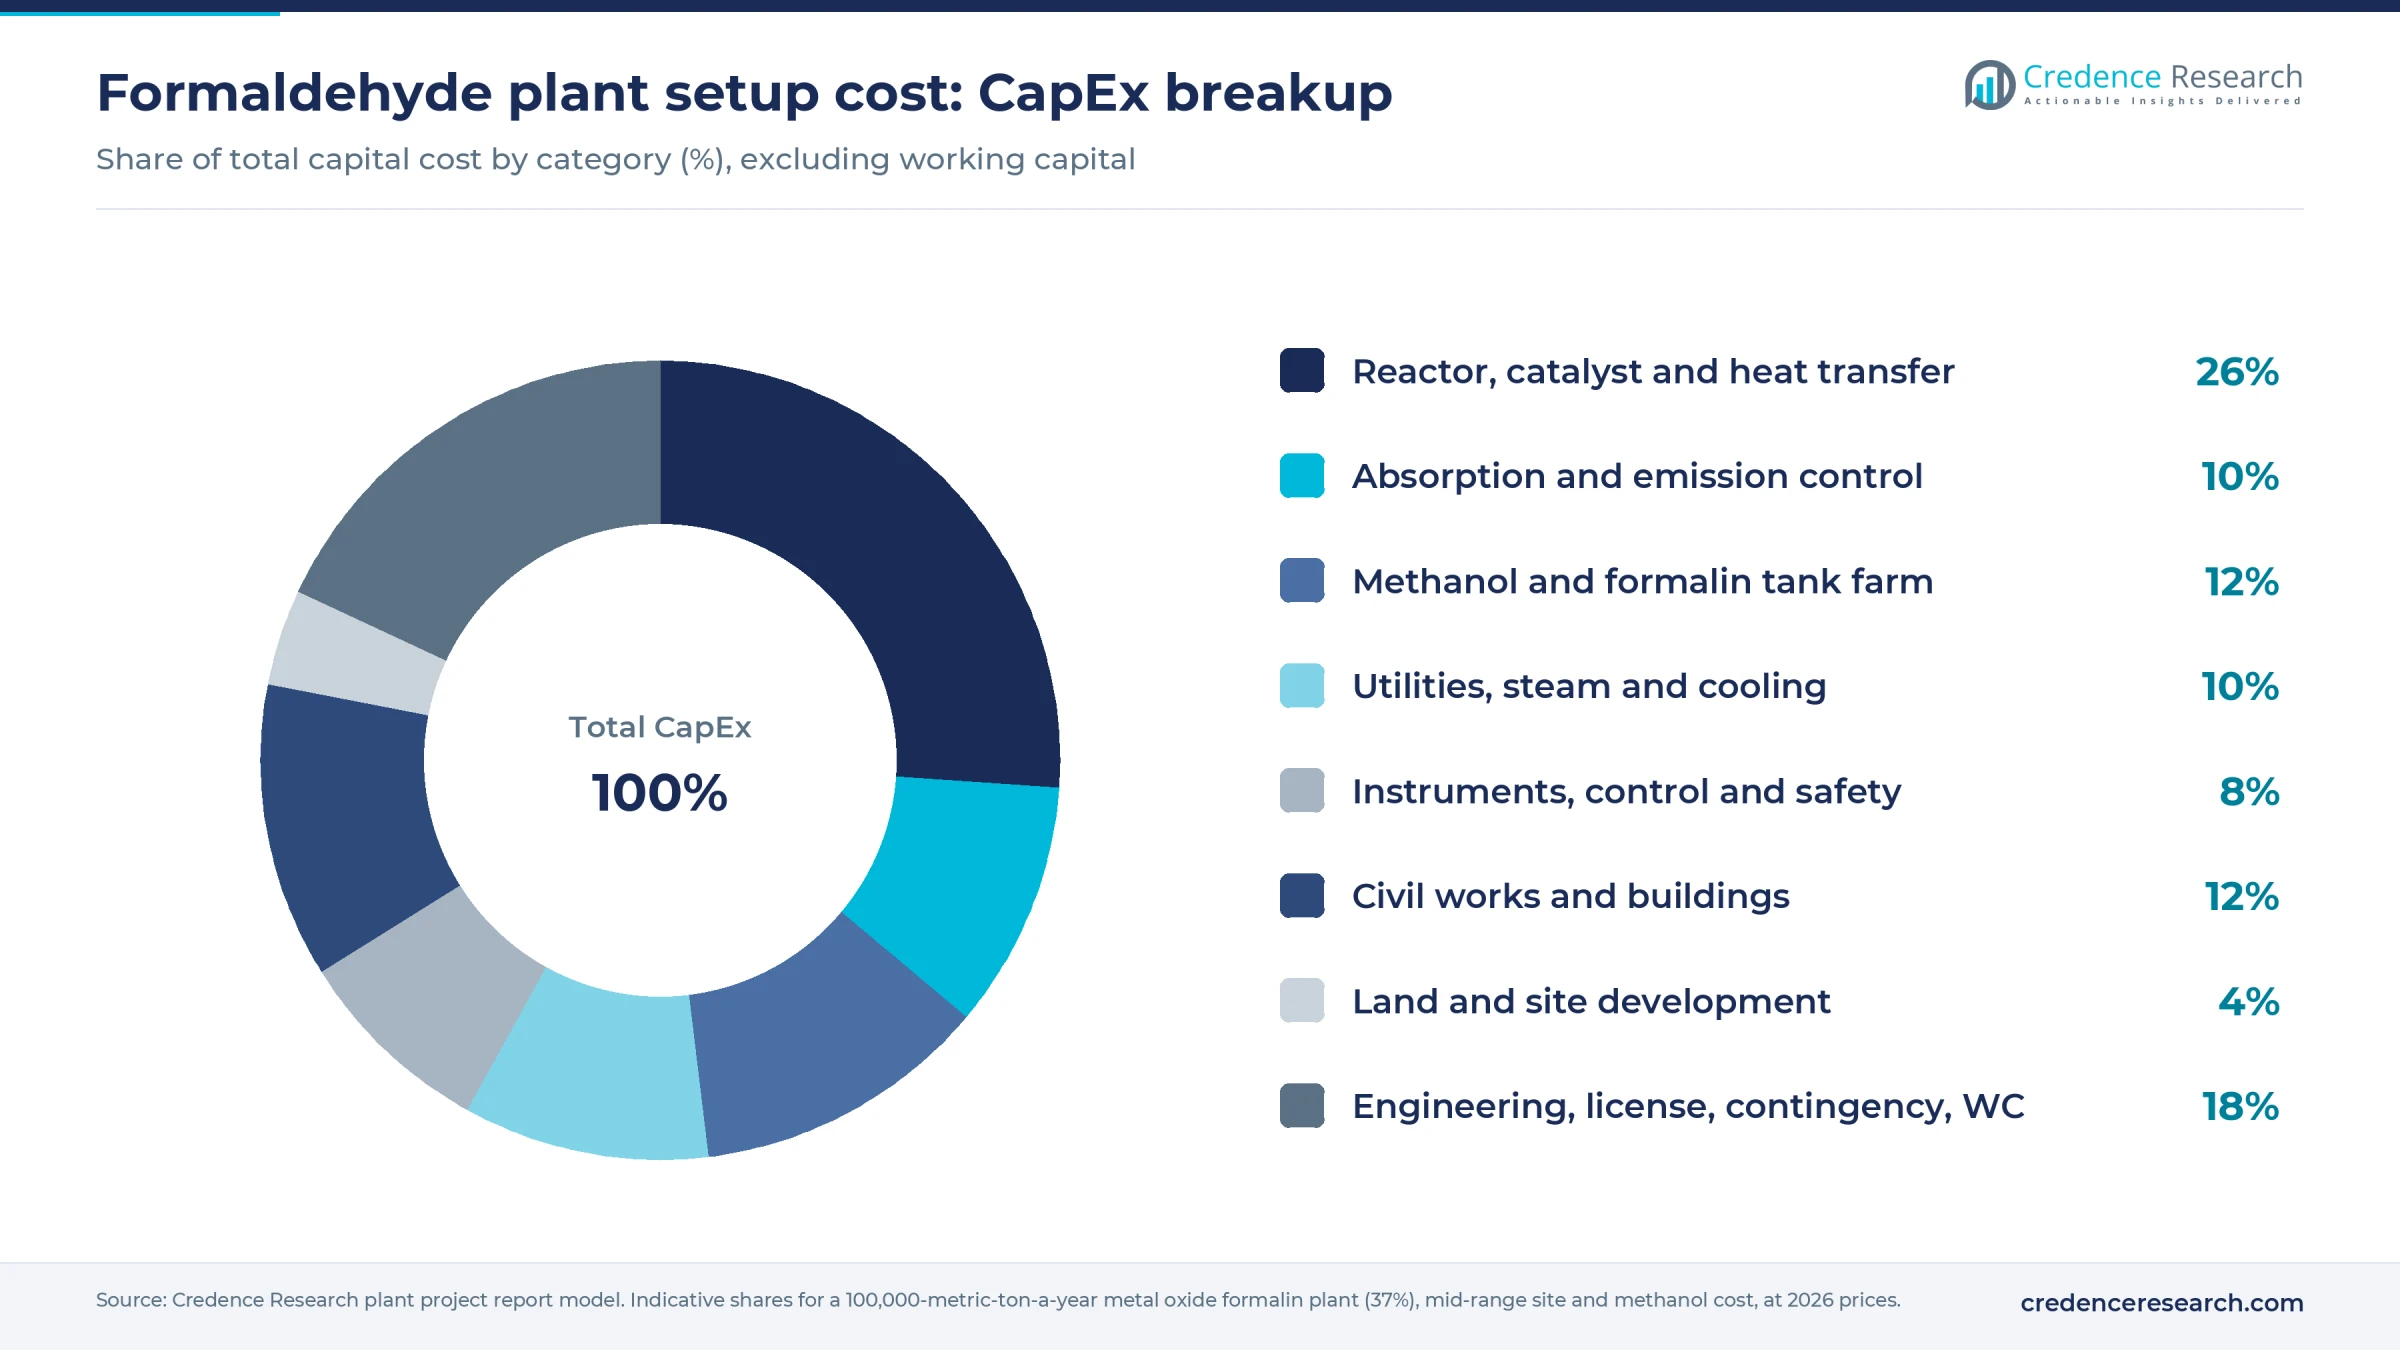
The reactor, catalyst and heat-transfer system take about a quarter of CapEx, and engineering, license fees and contingency weigh heavily for a plant of this size.
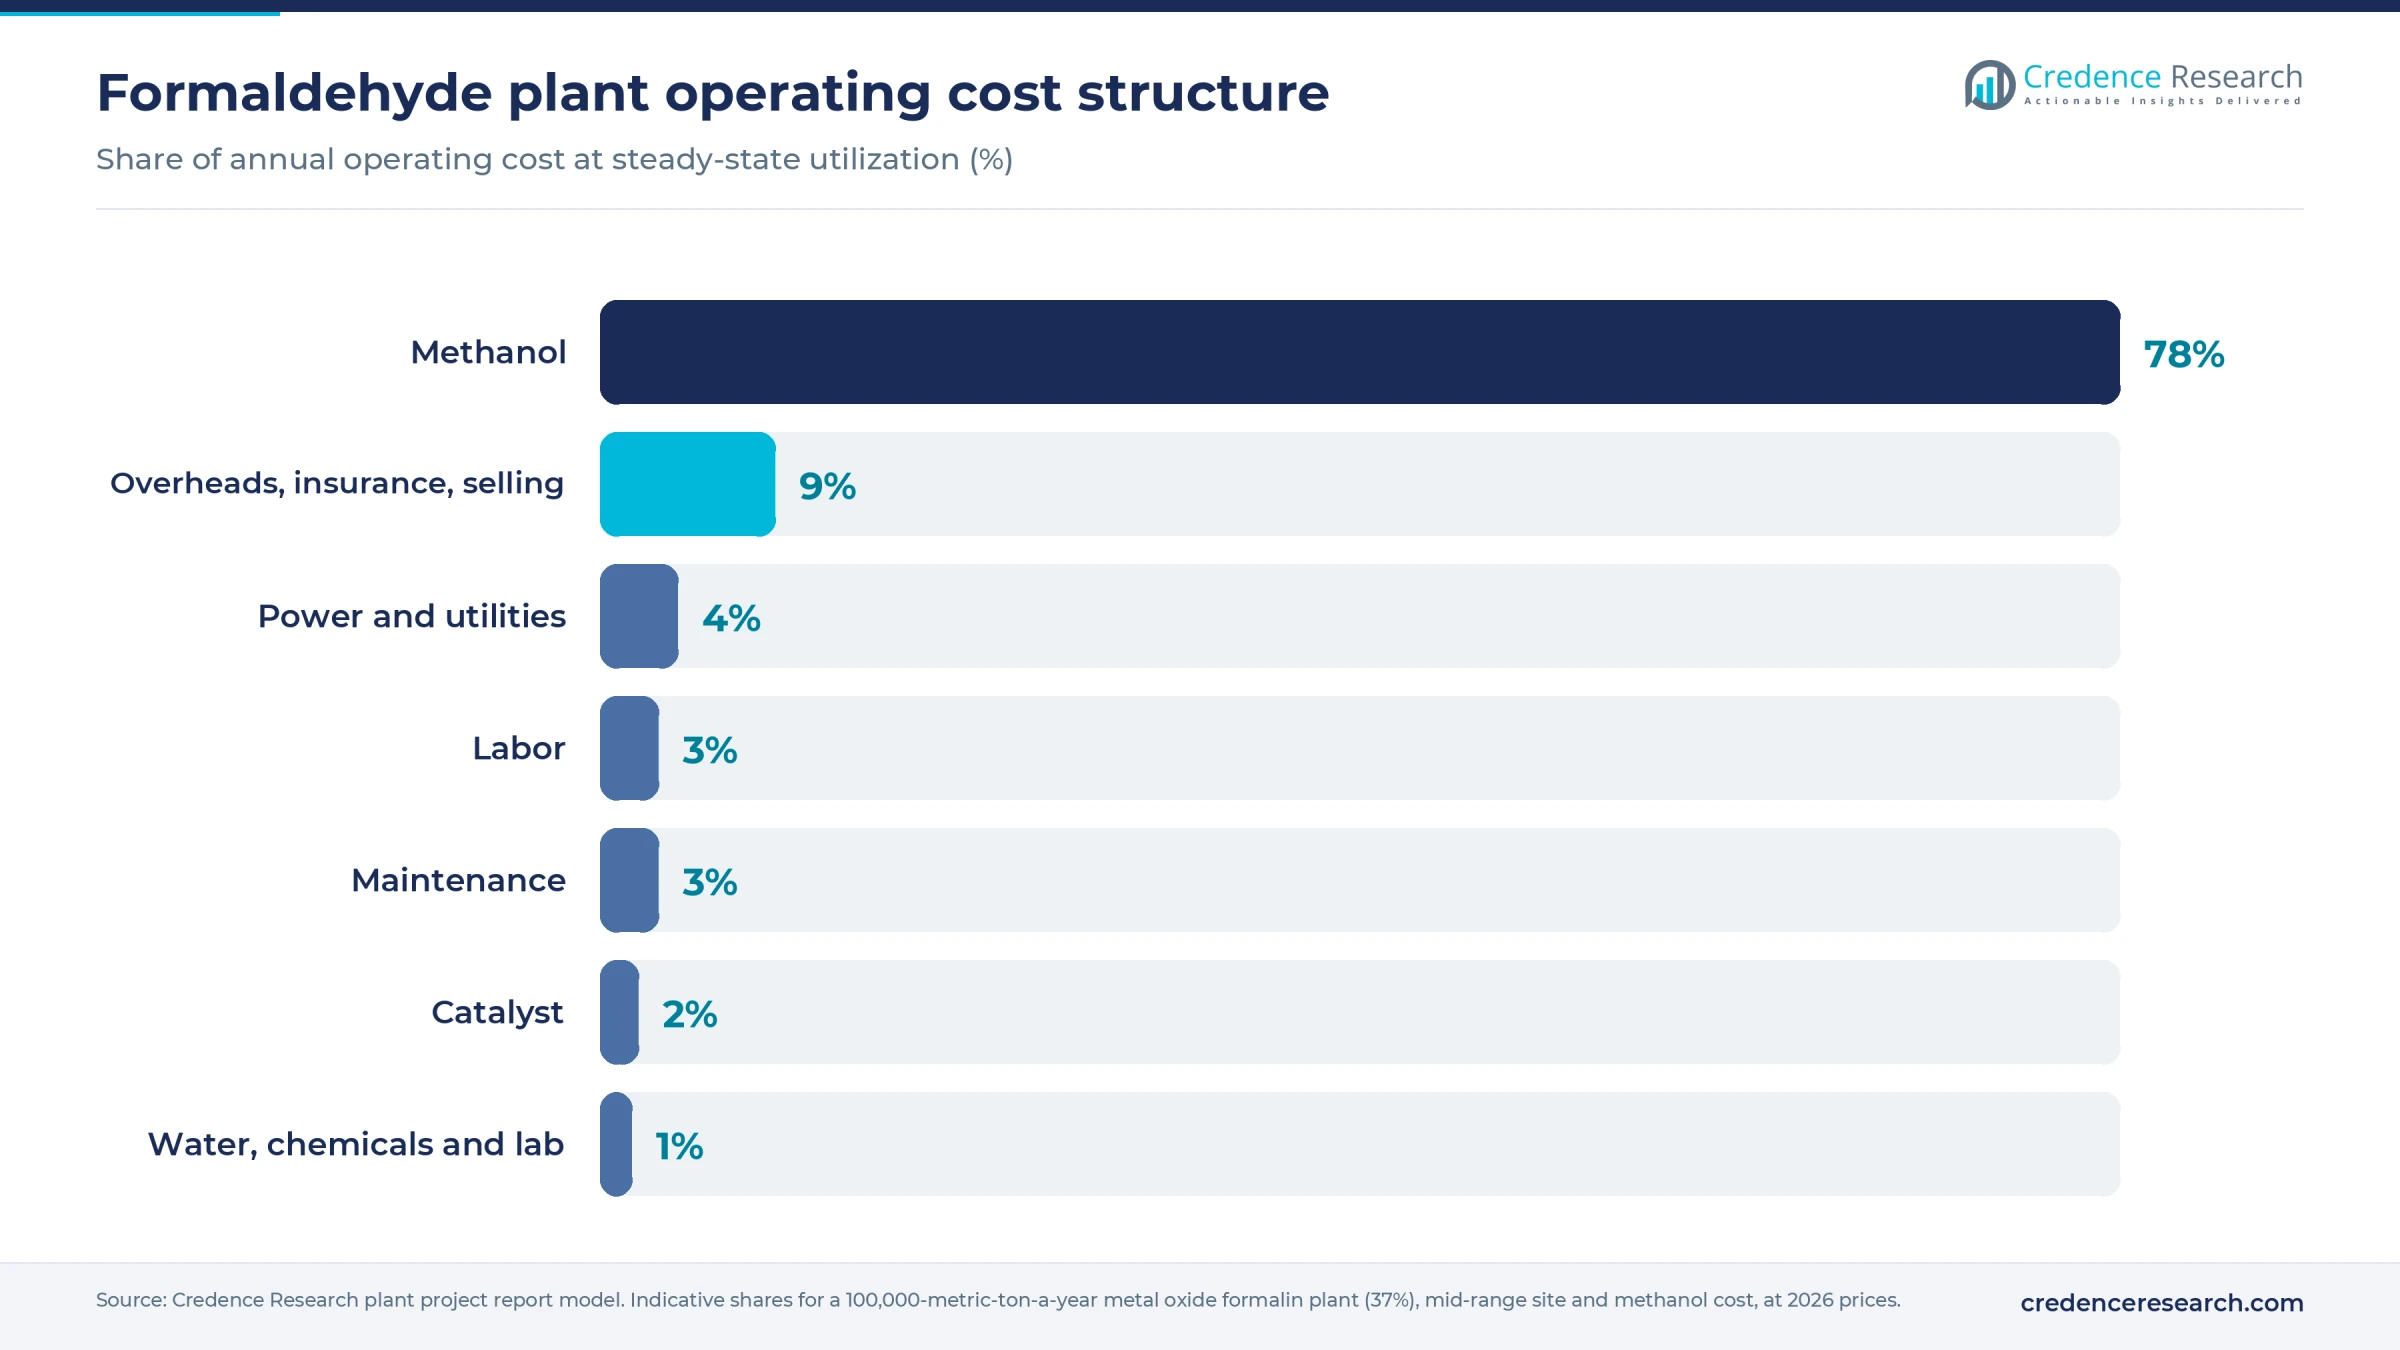
Methanol makes up about 78% of operating cost at the central case, so feedstock contracts outweigh most design choices. The full report can be tailored to any country or region.
Machinery and raw materials for a formaldehyde plant
The main equipment groups are listed below; duty ratings and the full schedule are in the report.
- Methanol unloading pumps, floating-roof or nitrogen-blanketed storage tanks and feed filters
- Methanol evaporator, process air blower and off-gas recycle blower
- Multitubular oxidation reactor with iron-molybdate catalyst and a boiling heat-transfer oil system
- Gas after-cooler, steam drum and condensate system
- Absorption tower with circulation pumps and coolers
- Catalytic emission control unit for off-gas
- Heated stainless steel formalin storage, tanker loading and vapor return
- Cooling tower, demineralized water, nitrogen, fire water, laboratory and distributed control system with safety interlocks
At 90% utilization the reference plant uses about 38,000 tons of methanol a year, or about 0.42–0.43 ton per ton of 37% formalin. Large export supply comes from gas-based plants in Saudi Arabia, Trinidad and Tobago, Oman, Malaysia, Chile and Iran, with coal-based output serving China. Comtrade data put 2025 export unit values at about USD 250–310 per ton from the main Middle East, Caribbean and Asian sellers. Renewable feed is emerging, and the green methanol market may give EU buyers a low-carbon option at a premium.
Formaldehyde business profit margin and ROI
Gross margin is estimated at 22–46%, measured as the formalin price minus methanol and direct conversion cost, as a share of price. The build uses an assumed ex-works price of USD 240–290 per ton of 37% solution, near the lower end of 2024 Comtrade export unit values of about USD 220–410 from India, the Netherlands, Germany and Italy. Methanol is taken at an assumed USD 320–370 per ton delivered, in line with average realized prices of about USD 355–361 shown by Methanex, or about USD 134–159 per ton of formalin. Direct conversion cost for power, catalyst, labor, maintenance and water is assumed at USD 22–28 per ton, net of steam exported to neighbors.
At 90% utilization, or 90,000 tons, revenue is about USD 24 million. Annual cash profit after an assumed USD 1.2–1.8 million of overheads is about USD 3–11 million, which puts payback at about 2–6 years on mid-range CapEx of USD 17.5 million. A top-end build in a weak spread year can take eight years or more.
The key sensitivity is the spread between formalin and methanol. Each USD 10 per ton change in methanol moves cost by about USD 4.25 per ton of formalin, or close to USD 400,000 a year. Spreads in China often run below the weak case, which is why most new capacity there is captive.
| Indicator | Result |
|---|---|
| Gross margin | 22–46% |
| Payback period | 2–6 years |
| Post-tax IRR | Available in report |
| Net present value | Available in report |
| Return on investment | Available in report |
| Debt service coverage | Available in report |
| Break-even capacity use | Available in report |
How to start a formaldehyde business, licenses and approvals
Approvals follow a common sequence: company and tax registration, industrial zoning and building permits in an area cleared for hazardous chemicals, an air permit covering methanol and formaldehyde emissions, wastewater approval, fire and explosion protection for methanol storage, process safety and major accident plans, chemical registration, worker exposure monitoring under carcinogen rules and dangerous goods transport compliance. Formaldehyde is classed as carcinogenic to humans by the International Agency for Research on Cancer, so exposure limits shape plant layout, sampling and medical surveillance from the design stage.
| Market | Key approvals for a formaldehyde plant |
|---|---|
| United States | State Clean Air Act construction and operating permits, with formaldehyde a listed hazardous air pollutant; OSHA formaldehyde standard 29 CFR 1910.1048, with a 0.75 ppm eight-hour limit and 2 ppm short-term limit; OSHA process safety management above 1,000 pounds of formalin; EPA risk management program above 15,000 pounds of formaldehyde solution; TSCA reporting and pending risk management rules; EPCRA toxic release reporting; DOT hazardous materials rules |
| European Union | Integrated permit under the Industrial Emissions Directive; REACH registration and CLP labeling as carcinogen category 1B and mutagen category 2; binding exposure limit of 0.3 ppm under the Carcinogens, Mutagens and Reprotoxic Substances Directive; Seveso III screening of methanol and formaldehyde inventories; REACH Annex XVII entry 77, capping emissions from furniture and wood-based articles at 0.062 mg per cubic meter from Aug. 6, 2026 |
| India | Environmental clearance under the EIA Notification 2006 for synthetic organic chemicals; consent to establish and operate from the state pollution control board; factory license and hazardous process approvals; on-site emergency plan and safety audit under the MSIHC Rules 1989; boiler registration with the state inspectorate |
Siting and the air permit usually set the timeline, because regulators review methanol tank spacing and model stack emissions before construction starts.
Key formaldehyde manufacturers and recent developments
Most formaldehyde is made by companies that consume it. BASF, Celanese, Perstorp and Ercros run captive plants for polyols, polyacetal and resins, while Bakelite Synthetics, Georgia-Pacific Chemicals, Arclin and Kronospan make it beside wood-adhesive and panel operations. Metafrax and Metadynea lead in Russia, Kanoria Chemicals is a major Indian merchant supplier, and Chinese groups such as Yihua run large plants for derivative chains.
- December 2025: Hexion sold its U.S. Gulf Coast formalin business at Baytown, Texas, and Luling and Geismar, Louisiana, to infrastructure investor Ancala, which formed Valentra to run the sites under multi-year customer contracts.
- March 2026: Yihua Group started a 100,000-ton-a-year plant in Inner Mongolia, after a 120,000-ton plant in Hubei in November 2025, both feeding pentaerythritol units with Clariant catalysts.
- July 2026: Honeywell completed its GBP 1.325 billion purchase of Johnson Matthey's catalyst technologies unit, the licensor of the Formox metal oxide process.
The pattern favors plants integrated with resins or derivatives, while merchant sellers compete within short trucking range.
What's inside the Formaldehyde project report PDF
The report runs to 21 chapters. Open a chapter to see its sections.
1. Preface
2. Scope and Methodology
- 2.1 Objectives of the Study
- 2.2 Stakeholders
- 2.3 Research Methodology
- 2.4 Data Sources and Key Assumptions
3. Executive Summary
- 3.1 Market Snapshot
- 3.2 Project at a Glance (Capacity, CapEx, OpEx)
- 3.3 Key Financial Indicators (IRR, NPV, Payback, Break-even)
- 3.4 Feasibility Verdict
4. Product Overview
- 4.1 Formaldehyde Definition and Properties
- 4.2 Grades and Specifications (BIS / ISO / ASTM)
- 4.3 HS Code and Classification
- 4.4 Key Applications
- 4.5 Substitutes
5. Global Formaldehyde Market
- 5.1 Market Overview
- 5.2 Historical and Current Market Performance (Volume and Value)
- 5.3 Market Breakup by Grade / Type
- 5.4 Market Breakup by End-Use Industry
- 5.5 Market Breakup by Region
- 5.6 Market Drivers, Restraints and Trends
- 5.7 Value Chain Analysis
- 5.8 Market Forecast
6. Target Country Formaldehyde Market Analysis
- 6.1 Demand and Supply Analysis
- 6.2 Installed Capacity vs Demand Gap
- 6.3 Import Dependence
- 6.4 Demand Forecast by End-Use
7. Trade Analysis
- 7.1 Imports by Volume, Value and Country
- 7.2 Exports by Volume, Value and Country
- 7.3 Trade Balance and Opportunities
8. Price Analysis
- 8.1 Historical Formaldehyde Price Trends by Region
- 8.2 Raw Material / Feedstock Price Trends and Linkage
- 8.3 Price Forecast
- 8.4 Margins Across the Value Chain
9. Competitive Landscape
- 9.1 Market Structure
- 9.2 Key Players and Installed Capacities
- 9.3 Profiles of Key Players
- 9.4 Recent Developments (Expansions, M&A, New Plants)
10. Manufacturing Process and Technology
- 10.1 Comparison of Technology Routes
- 10.2 Selected Route and Process Flow Diagram
- 10.3 Unit Operations Involved
- 10.4 Chemical Reactions Involved
- 10.5 Mass Balance and Raw Material Requirements
- 10.6 Energy Balance
- 10.7 Quality Assurance Criteria and Technical Tests
- 10.8 By-products and Waste Handling
- 10.9 Technology Licensors / Providers
11. Project Details, Requirements and Costs
- 11.1 Land, Location and Site Development
- 11.1.1 Site Selection Criteria
- 11.1.2 Location Analysis
- 11.1.3 Land Requirement and Costs
- 11.1.4 Site Development Costs
- 11.2 Plant Layout
- 11.2.1 Layout Principles
- 11.2.2 Proposed Layout
- 11.2.3 Factors Influencing Layout
- 11.3 Civil Works and Buildings
- 11.4 Plant Machinery
- 11.4.1 Machinery Requirements and Specifications
- 11.4.2 Machinery Costs
- 11.4.3 Machinery Suppliers
- 11.5 Raw Materials
- 11.5.1 Requirements per Tonne of Output
- 11.5.2 Procurement and Sourcing
- 11.5.3 Costs
- 11.5.4 Suppliers
- 11.6 Packaging
- 11.6.1 Packaging Requirements
- 11.6.2 Packaging Costs
- 11.6.3 Packaging Suppliers
- 11.7 Storage and Material Handling
- 11.8 Transportation Requirements and Costs
- 11.9 Utilities
- 11.9.1 Power Requirements and Costs
- 11.9.2 Water Requirements and Costs
- 11.9.3 Steam, Fuel and Other Utilities
- 11.10 Manpower Requirements and Wages
12. Environment, Health, Safety and Sustainability
- 12.1 Effluent and Emissions Management
- 12.2 Hazard Classification and Safety Measures
- 12.3 Carbon Footprint
- 12.4 Green / Low-Carbon Process Options
13. Regulatory Procedures, Approvals and Certifications
- 13.1 Licences and Registrations
- 13.2 Environmental Clearances
- 13.3 Product Certifications (BIS, REACH, etc.)
- 13.4 Approval Timeline
14. Project Implementation Schedule
15. Project Economics
- 15.1 Capital Cost of the Project
- 15.2 Techno-Economic Parameters
- 15.3 Capacity Utilization and Ramp-up
- 15.4 Product Pricing and Margins
- 15.5 Income Projections
- 15.6 Expenditure Projections
- 15.7 Working Capital Requirement
- 15.8 Taxation
- 15.9 Depreciation
16. Financial Analysis
- 16.1 Projected Profit and Loss Account
- 16.2 Projected Cash Flow Statement
- 16.3 Projected Balance Sheet
- 16.4 Liquidity Analysis
- 16.5 Profitability Analysis (Payback, NPV, IRR, ROI)
- 16.6 Break-even Analysis
- 16.7 Debt Service Coverage Ratio (DSCR)
- 16.8 Sensitivity Analysis
- 16.9 Scenario and Uncertainty Analysis
17. Funding and Incentives
- 17.1 Means of Finance and Debt-Equity Structure
- 17.2 Loans and Financial Assistance
- 17.3 Government Schemes and Subsidies (PLI, State Policies)
18. Risk Assessment
- 18.1 Key Success Factors
- 18.2 Key Risk Factors
- 18.3 Risk Mitigation
19. Strategic Recommendations
20. Case Study of a Successful Venture
21. Appendix
- 21.1 Detailed Assumptions
- 21.2 Abbreviations
- 21.3 List of Tables and Figures
- 21.4 Sources
This page vs. the full report
| Data point | On this page (free) | In the full report |
|---|---|---|
| Total CapEx | One rounded range at one capacity | Exact figure at three capacities with a line-item breakup |
| CapEx breakup | Category shares (%) only | Cost, quantity and supplier for every machine |
| Operating cost | Share of raw materials, utilities and labor | Per-unit cost sheet with each input price and consumption |
| Profitability | Gross margin range and payback band | Exact IRR, NPV, ROI, break-even and DSCR |
| Financial statements | List of what is included | 10-year P&L, cash flow, balance sheet and Excel model |
| Sensitivity | One directional line | Full sensitivity and scenario tables |
| Process | Simplified flow diagram | Detailed process flow, mass and energy balance, operating conditions |
| Machinery | Names of the main machines | Specifications, capacity, cost and supplier list |
| Market | Headline size, growth and global demand | Segment, region, trade and price forecast tables |
| Suppliers and buyers | Supplier types and sourcing hubs | Named suppliers and buyers |
Formaldehyde project report: FAQs
How much does it cost to set up a formaldehyde plant?
Which is better, the silver or metal oxide process?
Why is most formaldehyde made next to its users?
What is the profit margin in formaldehyde manufacturing?
What is the payback period for a formaldehyde plant?
Which approvals does a formaldehyde plant need?
How much methanol does a formaldehyde plant use?

About the analyst
Nisha Gupta, Senior Research Analyst
Nisha Gupta is a Senior Research Analyst at Credence Research Inc. who works across industry domains, including packaging, automotive parts and machinery. Her focus is the modelling engine behind each study: she builds quantitative market databases and econometric forecasting frameworks, and developed automated Excel-based market modelling templates that cut client turnaround time by 30%.
Related market research
More plant project reports
- Sulfuric Acid Manufacturing Plant Project Report (DPR) 2026
- Engine Oil Manufacturing Plant Project Report (DPR) 2026
- Ferrous Sulphate Manufacturing Plant Project Report (DPR) 2026
- Acetonitrile Manufacturing Plant Project Report (DPR) 2026
- Sodium Chloride Manufacturing Plant Project Report (DPR) 2026
- Sodium Chlorate Manufacturing Plant Project Report (DPR) 2026