
Quick answer
An engine oil plant blends base oil with additive packages, then fills branded packs for cars, trucks and motorcycles. A 30,000 tonne a year blending and filling plant needs fixed CapEx of about USD 10–18 million at an Asian industrial park and an assumed USD 25–45 million at a U.S. or EU site. Gross margin runs about 18–30% at 2026 base oil prices, and central-case payback takes about 3–6 years.
Viable for operators with secured base oil supply, performance approvals and a distribution network; weak as an unbranded toll blender exposed to base oil spikes.
Engine Oil plant: key highlights
| Parameter | Indicative value | Note |
|---|---|---|
| Plant capacity | 30,000 TPA (100 TPD) | About 34 million liters a year at 0.875 kg per liter, 300 working days |
| Total CapEx | USD 10–18 million | Asian industrial park; assumed USD 25–45 million at a U.S. or EU site; excludes working capital |
| Raw material share of operating cost | 68–74% | Base oil and additives, including selling and freight in total cost |
| Gross margin | 18–30% | Assumed net selling price of USD 2,400–3,000 per tonne and assumed base oil of USD 1,300–1,800 per tonne |
| Payback period | 3–6 years | Central case at 80% utilization, on CapEx plus working capital margin; extreme pairings about 2–13 years |
| IRR | Available in report | Post-tax, 10-year model |
| Break-even | Available in report | Capacity utilization basis |
Ranges assume a 30,000 TPA greenfield mineral and semi-synthetic blending and filling plant on 5 acres at an Asian industrial park, 2026 prices, 80% utilization, assumed base oil of USD 1,300–1,800 per tonne, an assumed additive cost near USD 3,000 per tonne and assumed net prices of USD 2,400–3,000 per tonne. U.S. and EU costs are assumed multiples. The full report is customizable to any country.
What is engine oil?
Engine oil is a finished lubricant that reduces friction and wear, carries heat away from pistons and bearings, keeps soot and sludge in suspension, and neutralizes acids formed by combustion. A typical formula holds about 85–90% base oil, with the balance made up of a detergent-inhibitor additive package and a viscosity modifier.
Products divide by viscosity grade, such as SAE 0W-20, 5W-30, 15W-40 and 20W-50, by base stock into mineral, semi-synthetic and full synthetic, and by duty into passenger car, heavy-duty diesel, motorcycle and marine oils. Performance claims follow API, ILSAC, ACEA and automaker specifications, and those approvals often matter more to buyers than the brand name.
Petroleum-based engine oil is classified under HS code 271019, with the U.S. schedule separately listing automotive, diesel and marine engine lubricating oils at 2710.19.30.20. Formulas with less than 70% petroleum oil can move to HS 340319, and formulas with none to HS 340399, so synthetic blends need a customs check. Buyers include vehicle makers for factory fill, dealer and independent workshops, fleets, retail chains and national distributors.
Engine oil market overview and global demand
Credence Research does not yet publish a standalone engine oil market size, so the closest live benchmarks frame the sector. The global synthetic lubricants market analysis puts that segment at about USD 33.4 billion in 2025, based on Credence Research's USD 32.3 billion for 2024 and 3.19% CAGR. Upstream, the base oil market study implies about USD 32.7 billion in 2025, based on USD 29.5 billion for 2023 and 5.2% CAGR. These figures describe adjacent markets, not engine oil itself.
Physical indicators give a better sense of scale. Automotive lubricants made up about 55% of total lubricant demand in 2024, according to a January 2026 Lube Magazine base oil review, which expects as much as 8% of global lubricant demand to be lost by 2030 if the IEA's forecast holds. No current official world total was found.
Government data in India show lubricant and grease consumption of 483,000 tonnes in March 2026, a single month that shows scale in a large emerging market. Finished oil trade is often regional because freight and pack formats favor local blending, yet flows can be large. Mexico took 43% of U.S. base oil and finished lubricant exports in 2024, about 2.2 million tonnes. For lower-petroleum preparations, 2022 trade data for HS 340319 rank Germany, the U.S. and France as the top exporters.
Longer drain intervals and electric vehicles shrink volume in mature markets, while motorcycle fleets, trucks and older cars in Asia, Africa and Latin America still add demand. The two-wheeler lubricants segment shows why regional mix matters to a new plant.
Engine oil manufacturing process
Engine oil is blended, not reacted, so a plant makes no chemical change to its feeds. Quality depends on accurate dosing, clean transfers and rigorous testing, and most of the engineering effort goes into avoiding cross-contamination between grades.
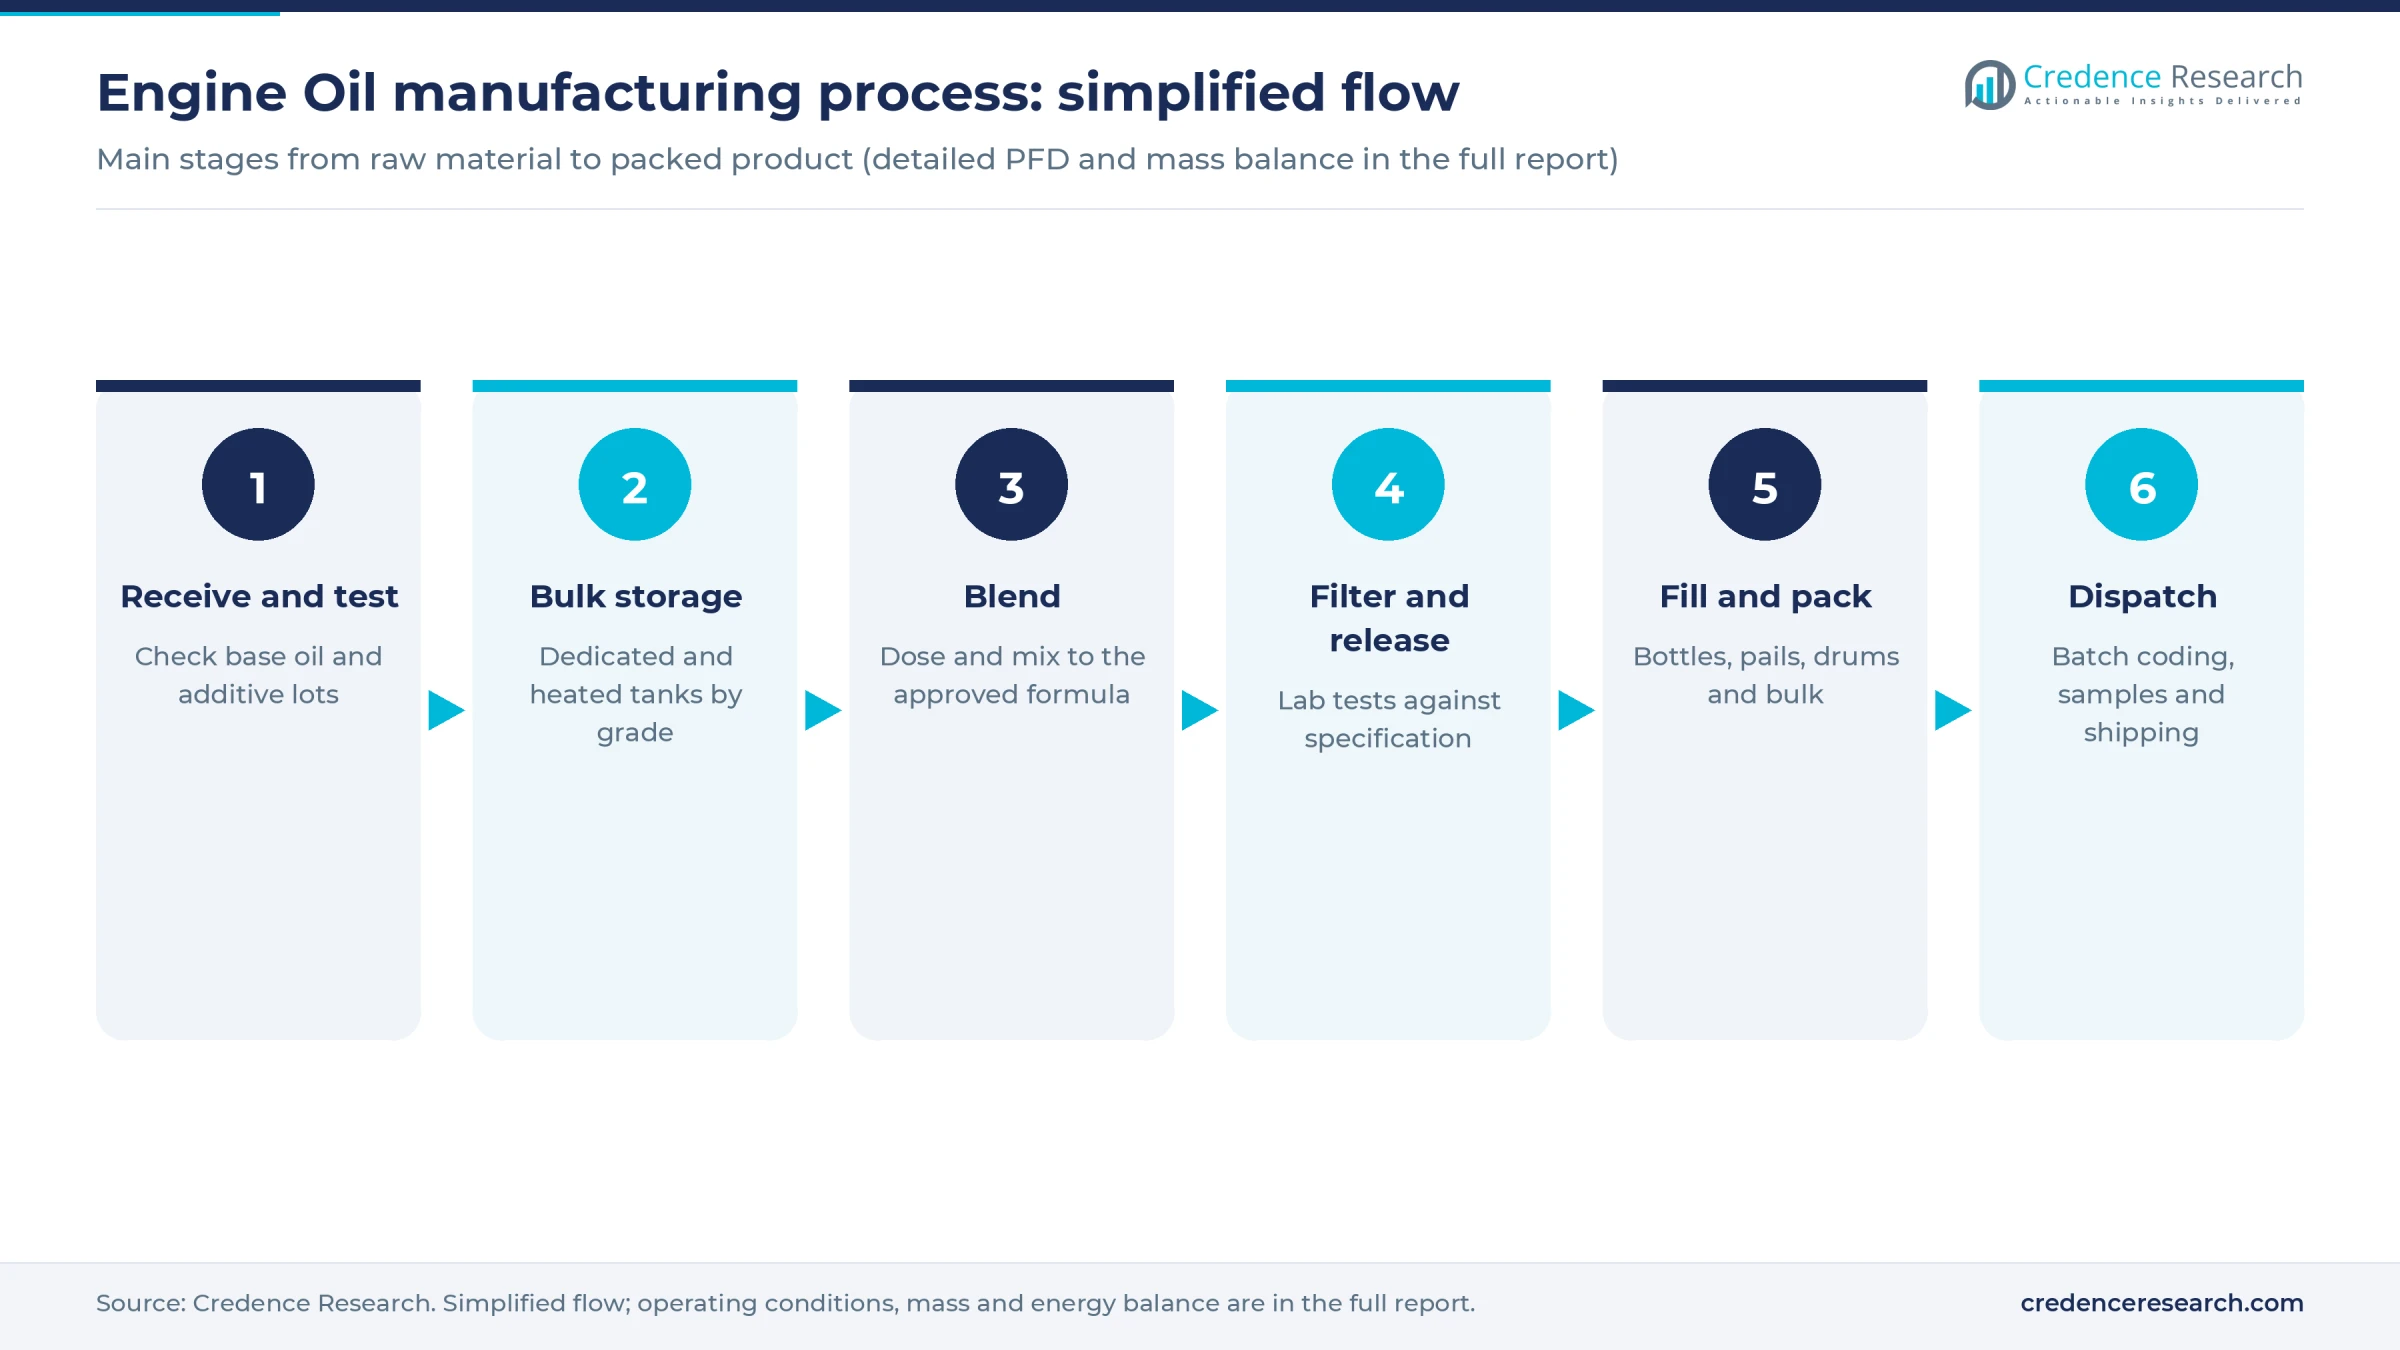
- Receiving and testing. Base oil arrives by coastal tanker, rail, truck or flexitank, and additives arrive in heated bulk containers or drums. The lab checks viscosity, appearance, water and flash point before any tank is unloaded.
- Bulk storage. Each base stock has a dedicated tank, with Group I, II and III grades kept apart. Viscous additives stay in heated, insulated tanks to keep them pumpable.
- Batch or in-line blending. Load cell or meter-based dosing adds base oil, the additive package, viscosity modifier and pour point depressant to a blending kettle. Pulse-air or agitator mixing at a moderate temperature, often about 50–65 degrees Celsius, gives a uniform blend. Larger plants add in-line blending for high-volume grades.
- Filtration and lab release. The batch passes through cartridge or bag filters. The lab then measures kinematic viscosity, viscosity index, base number, elemental additive content and foam behavior against the approved formula. An out-of-specification batch is corrected or downgraded, never released.
- Filling and packing. Finished oil moves through dedicated or pigged lines to filling machines for bottles, cans, pails, drums and intermediate bulk containers, with bulk tanker loading for fleets and vehicle makers.
- Dispatch and traceability. Each pack carries a batch code, so a field complaint can be traced back to raw material lots. Retained samples support warranty claims and performance audits.
Line flushing is the hidden cost of the process. A wide grade list means more changeovers, more slop oil and lower effective throughput, which is why successful blenders rationalize their stock-keeping units early.
Engine oil plant setup cost
The indicative build is a 30,000 tonne a year plant, or 100 tonnes a day over 300 days, on about 5 acres of serviced land. Fixed CapEx comes to about USD 10–18 million at an Asian industrial park and an assumed USD 25–45 million at a U.S. or EU site, where civil works, tankage and permitting cost more. Working capital of about USD 8–13 million is excluded, and the full report can be recast for any country.
Disclosed plant investments anchor that estimated range. ExxonMobil announced about USD 110 million, for a 159,000 kiloliter plant in Maharashtra, or about 143,000 tonnes. Total reported about USD 50 million for 40,000 tonnes in Russia in 2018, and Gulf Oil Lubricants reported about USD 22 million for its Chennai greenfield plant, later listed at 45,000 tonnes. Scaled to 30,000 tonnes with the six-tenths rule, these give about USD 17 million for the regional build and USD 42–43 million for the major-company builds. The Gulf figure is undated, roughly a decade old and not escalated, and ExxonMobil's Indian plant scales well above the Asian range, so USD 10–18 million assumes a regional blender's simpler scope, not a major's.
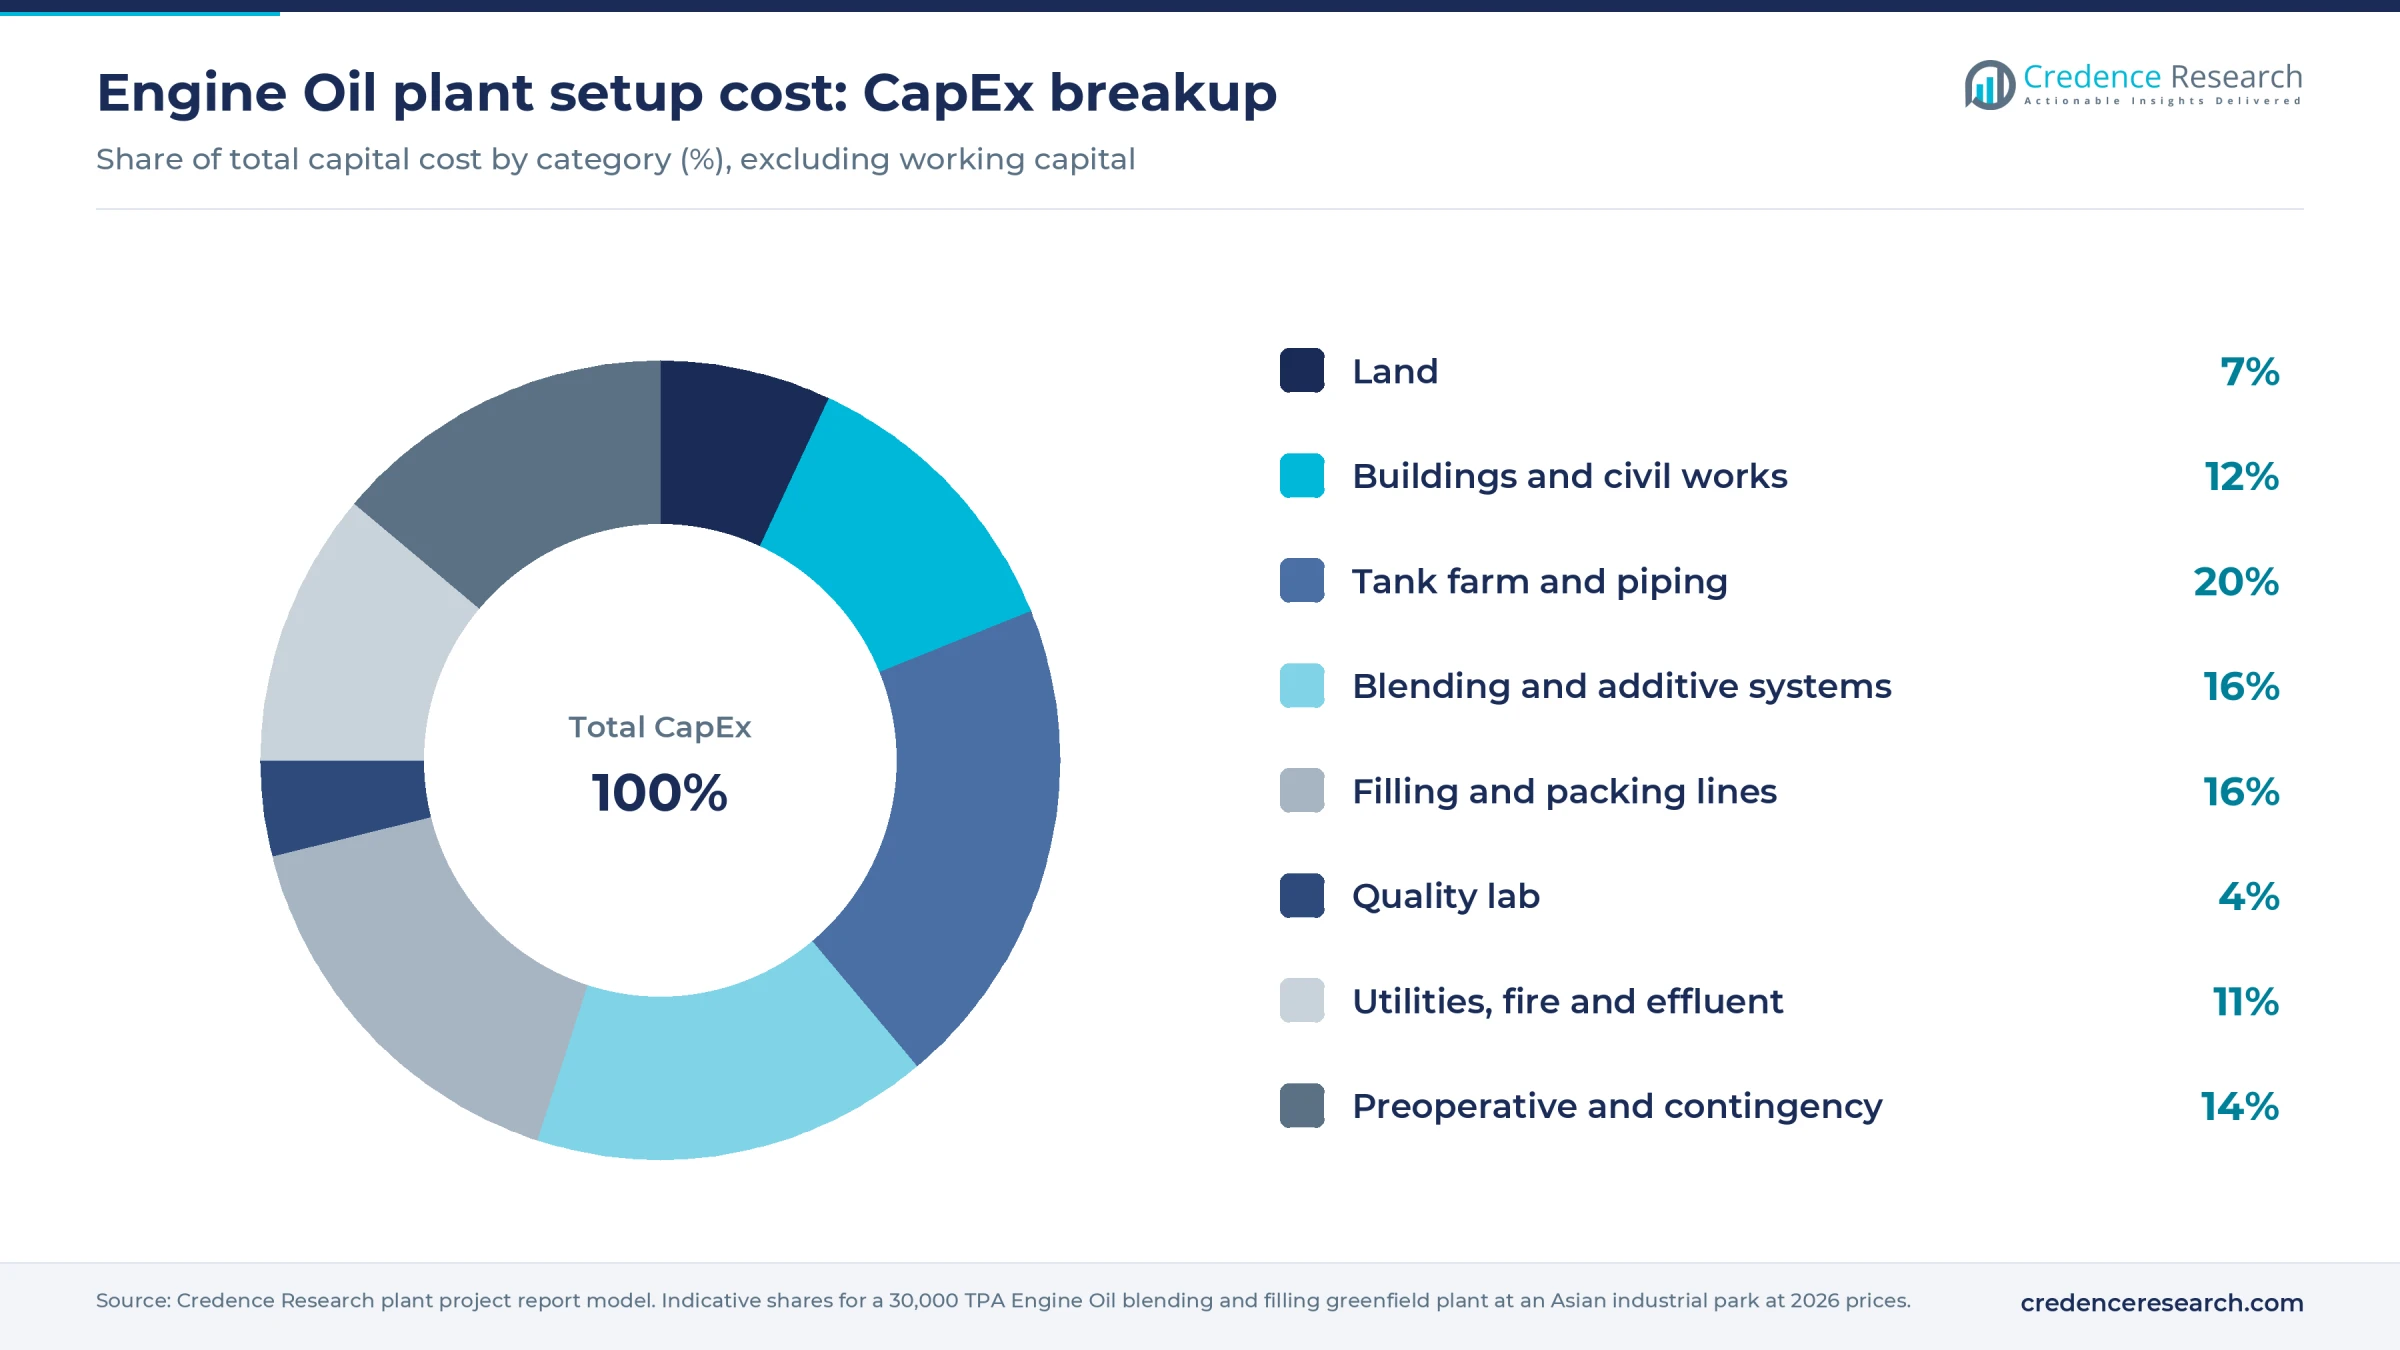
Land shows how each row was built. At an assumed USD 40–55 per square meter, a 20,000 square meter plot costs about USD 800,000–1.1 million, or about 7% of CapEx at the midpoint. U.S. rural sites can be cheaper, and European chemical parks often cost more, so this share swings by location.
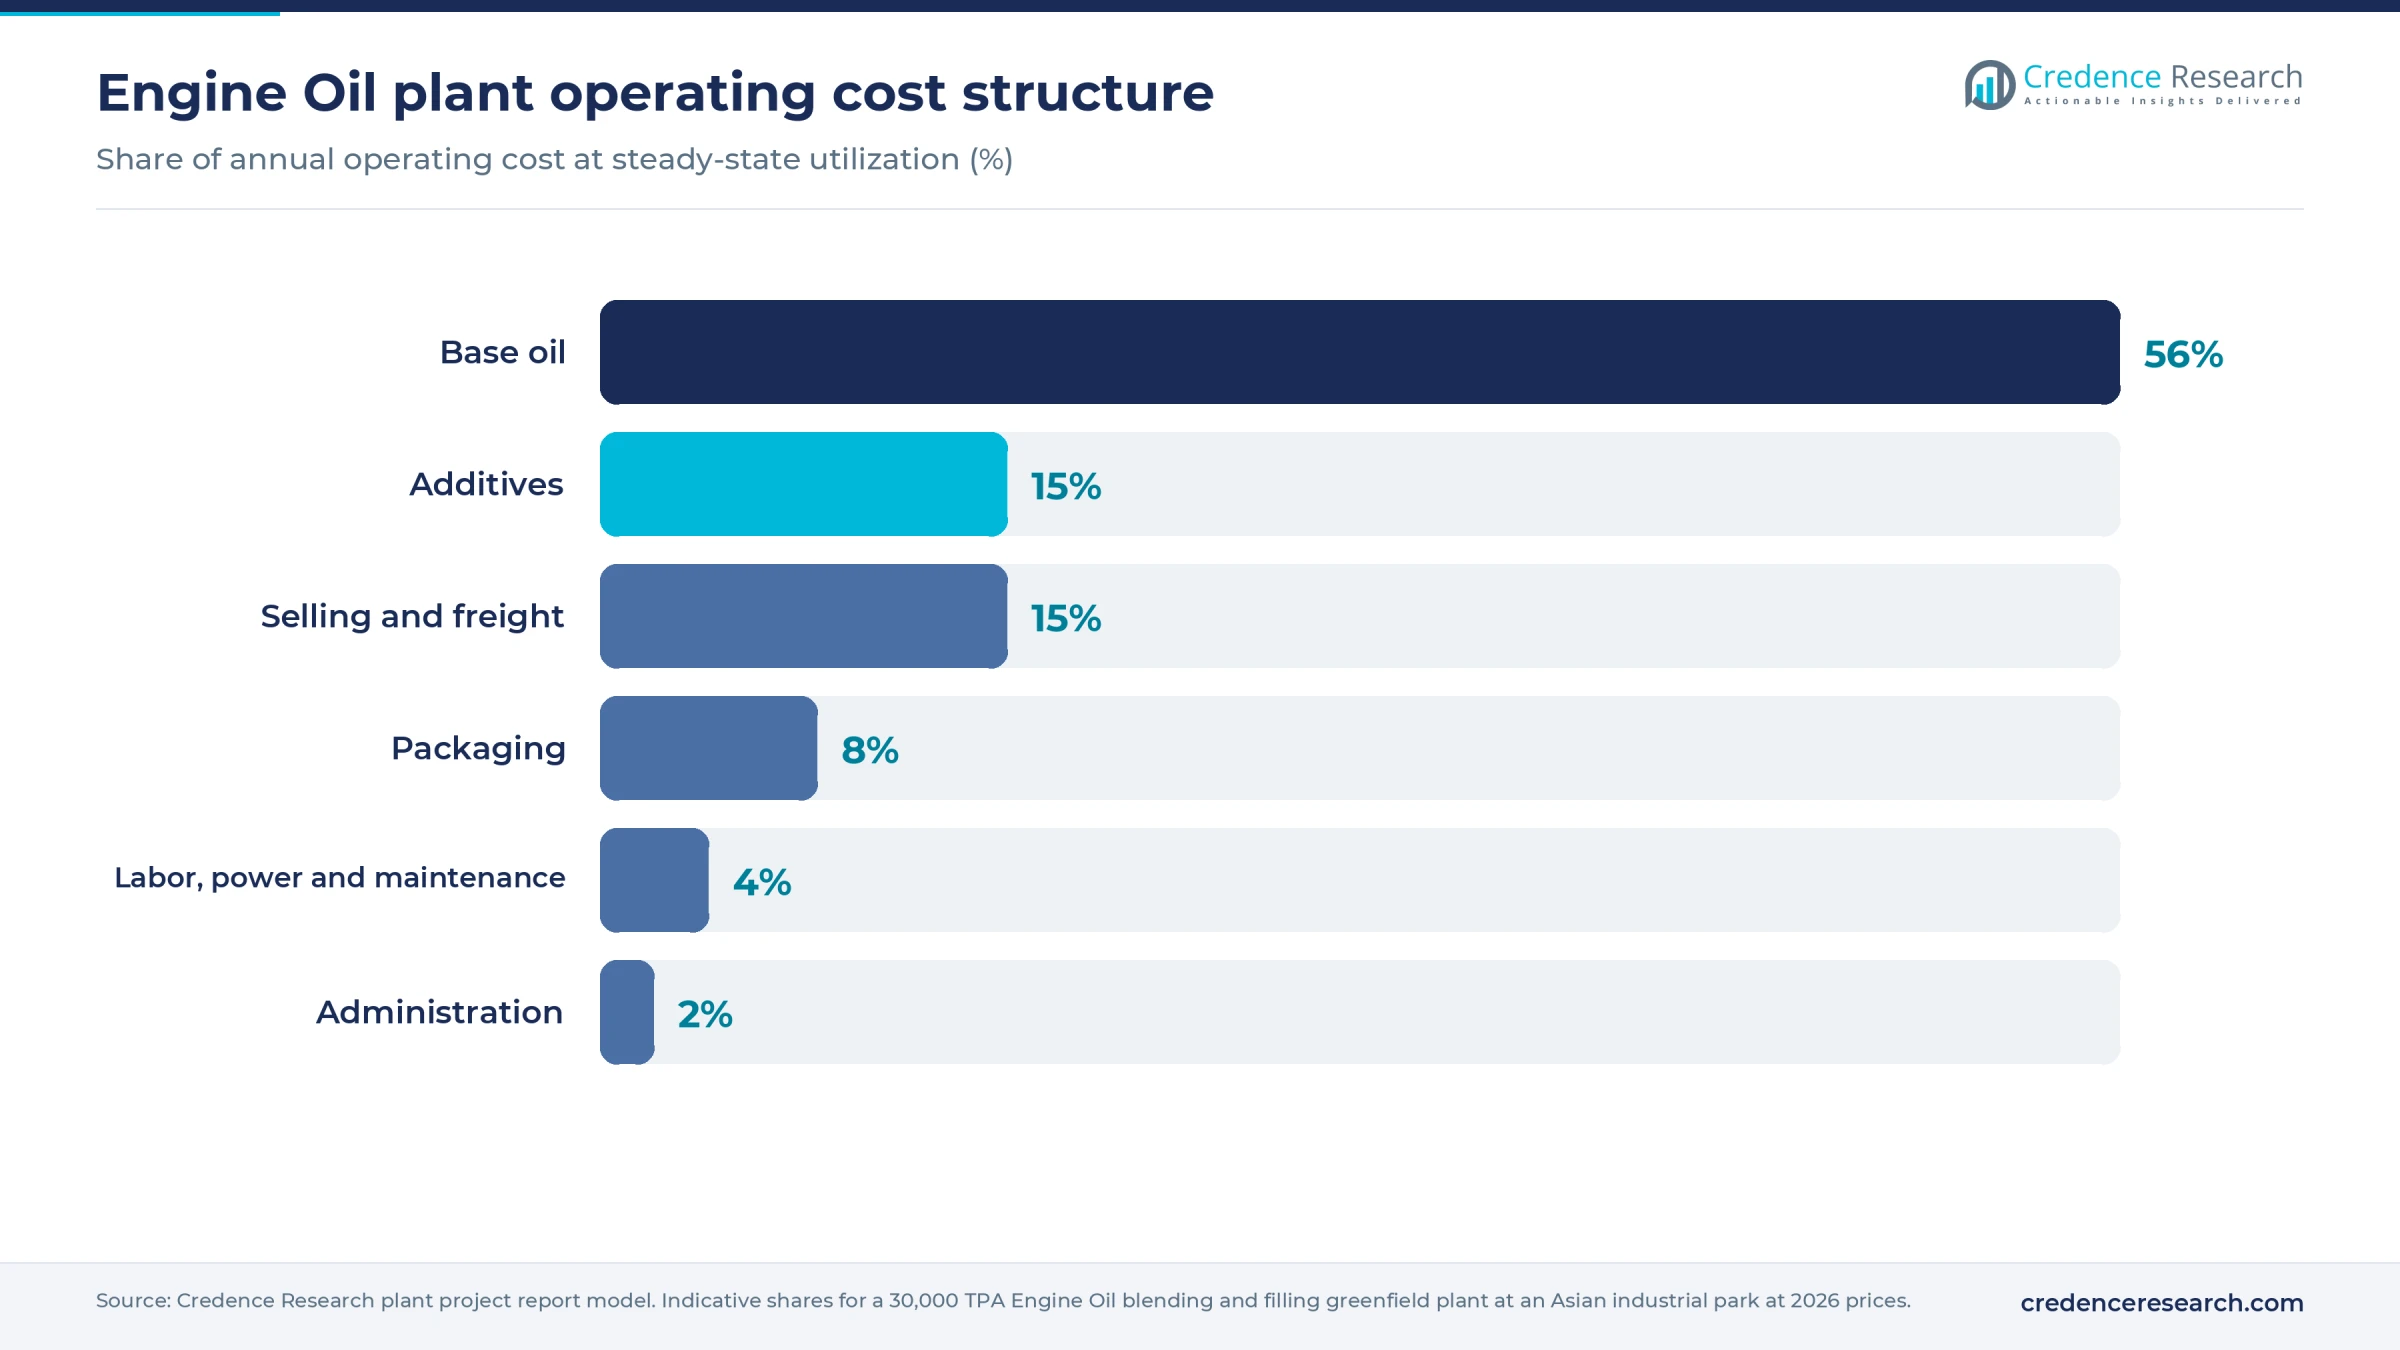
Base oil and additives take about 68–74% of total cash cost, with selling and freight next. Each USD 100 per tonne change in base oil moves cost by about USD 88 per tonne of finished oil, roughly 3 margin points at the midpoint price.
Machinery and raw materials for an engine oil plant
A blending plant needs base oil and additive storage tanks with heating coils, unloading pumps and manifolds, batch blending kettles with load cells, and pulse-air or agitator mixing. It also needs an additive dosing skid, drum decanting or heating ovens, cartridge filters, pigging or dedicated transfer lines and a distributed control system. Packing calls for bottle and can fillers, capping and induction sealing machines, labelers, pail and drum filling stations, and palletizers. The quality lab needs viscometers, a flash point tester, a base number titrator and an elemental analyzer, and the site needs a boiler or thermal heater, fire protection and an oily water separator.
Base oil is the main raw material, and it is drawn from a concentrated group of refineries. Group I supply comes from older refineries in Europe, Asia and Latin America, and Group II from the U.S., South Korea, Taiwan and China. Group III comes largely from South Korea, the Gulf and Southeast Asia. Middle East plants held about a fifth of global Group III capacity before the 2026 Strait of Hormuz disruption. Additive packages come from a small number of global formulators with blending sites in the U.S., Europe, Singapore and India, while plastic packs are usually local.
Plastic bottles and pails often represent the largest packing bill, which makes the lubricant packaging market relevant to plant budgeting. Re-refined base oil from used oil is a growing alternative where collection is well organized and engine approvals allow its use.
Engine oil business profit margin and ROI
Margins in this business depend less on the blending step than on the timing of price changes. Base oil quotes for mid-August 2026 showed Group I SN150 at USD 1,270–1,310 per tonne FOB Asia, Group II 150N at USD 1,590–1,630 and Group III 4 cSt at USD 3,430–3,480, far above the early 2026 levels before the Gulf conflict. The model uses an assumed base oil cost of USD 1,300–1,800 per tonne and an assumed blended additive cost near USD 3,000 per tonne, informed by a listed diesel package price of about USD 3,300 per tonne.
With assumed net prices of USD 2,400–3,000 per tonne, or about USD 2.10–2.60 per liter, gross margin runs about 18–30%. Cost lags hurt most when base oil rises before retail prices follow. Established premium brands can earn far more, but they also spend heavily on brand and distribution.
At 80% utilization, a central-case plant generates about USD 3.5–6.4 million in annual post-tax cash profit after selling and overhead costs. On CapEx plus a working capital margin of about USD 2.7 million, payback falls at about 3–6 years. Extreme pairings stretch to about 2–13 years.
| Financial metric | Status |
|---|---|
| IRR | Available in report |
| NPV | Available in report |
| ROI | Available in report |
| DSCR | Available in report |
How to start an engine oil business, licenses and approvals
Every plant needs business and tax registration, zoning and building permits, an environmental permit covering air emissions, oily wastewater and tank spills, occupational and fire safety approval, and chemical inventory compliance for base oils and additives. Used oil and sludge handling usually sits under waste rules, and export or import registration applies to traded product. Performance claims are a separate workstream, since market access depends on additive-maker data, approved formulas and, for some customers, automaker approvals.
| Market | Key approvals for engine oil |
|---|---|
| United States | TSCA inventory compliance; EPA used oil standards under 40 CFR Part 279 and spill prevention plans under 40 CFR Part 112; FTC labeling rules under 16 CFR Part 311 for re-refined oil claims; voluntary API engine oil Licensing and Certification System for the API marks; state air, stormwater and motor oil labeling requirements |
| European Union | REACH registration and CLP labeling; waste oil rules under Directive 2008/98/EC; national environmental permits; for ACEA claims, self-certification under the EELQMS system and the ATIEL Code of Practice |
| India | Processor license from the state competent authority under the Lubricating Oils and Greases (Processing, Supply and Distribution Regulation) Order, 1987, with product specifications declared; used oil extended producer responsibility registration with the Central Pollution Control Board under the Hazardous and Other Wastes Rules, in force since April 2024; state pollution control board consent to establish and operate |
Key engine oil manufacturers and recent developments
The global tier includes Shell, ExxonMobil's Mobil, Castrol, TotalEnergies, Chevron, Valvoline Global and FUCHS, alongside national champions such as Sinopec, PetroChina, Idemitsu, GS Caltex's Kixx and Indian Oil. Gulf Oil Lubricants India and many independent blenders compete on regional distribution, often in motorcycle and commercial vehicle grades. Upstream integration protects the majors in a base oil squeeze, a key risk for any new entrant serving the changing vehicle fluids mix.
- April 2026. FUCHS completed its full takeover of the OPET FUCHS joint venture on April 30, adding the Aliaga production plant in Turkey to its wholly owned network.
- May 2026. Lubes'N'Greases reported that the American Petroleum Institute allowed a 180-day testing window for base oil swaps after the Gulf disruption, a concession General Motors declined to match.
- November 2026. Trade press reported on Nov. 2 that BP had completed the sale of a 65% stake in Castrol to Stonepeak, leaving Castrol a standalone company with BP keeping 35%.
What's inside the Engine Oil project report PDF
The report runs to 21 chapters. Open a chapter to see its sections.
1. Preface
2. Scope and Methodology
- 2.1 Objectives of the Study
- 2.2 Stakeholders
- 2.3 Research Methodology
- 2.4 Data Sources and Key Assumptions
3. Executive Summary
- 3.1 Market Snapshot
- 3.2 Project at a Glance (Capacity, CapEx, OpEx)
- 3.3 Key Financial Indicators (IRR, NPV, Payback, Break-even)
- 3.4 Feasibility Verdict
4. Product Overview
- 4.1 Engine Oil Definition and Properties
- 4.2 Grades and Specifications (BIS / ISO / ASTM)
- 4.3 HS Code and Classification
- 4.4 Key Applications
- 4.5 Substitutes
5. Global Engine Oil Market
- 5.1 Market Overview
- 5.2 Historical and Current Market Performance (Volume and Value)
- 5.3 Market Breakup by Grade / Type
- 5.4 Market Breakup by End-Use Industry
- 5.5 Market Breakup by Region
- 5.6 Market Drivers, Restraints and Trends
- 5.7 Value Chain Analysis
- 5.8 Market Forecast
6. Target Country Engine Oil Market Analysis
- 6.1 Demand and Supply Analysis
- 6.2 Installed Capacity vs Demand Gap
- 6.3 Import Dependence
- 6.4 Demand Forecast by End-Use
7. Trade Analysis
- 7.1 Imports by Volume, Value and Country
- 7.2 Exports by Volume, Value and Country
- 7.3 Trade Balance and Opportunities
8. Price Analysis
- 8.1 Historical Engine Oil Price Trends by Region
- 8.2 Raw Material / Feedstock Price Trends and Linkage
- 8.3 Price Forecast
- 8.4 Margins Across the Value Chain
9. Competitive Landscape
- 9.1 Market Structure
- 9.2 Key Players and Installed Capacities
- 9.3 Profiles of Key Players
- 9.4 Recent Developments (Expansions, M&A, New Plants)
10. Manufacturing Process and Technology
- 10.1 Comparison of Technology Routes
- 10.2 Selected Route and Process Flow Diagram
- 10.3 Unit Operations Involved
- 10.4 Chemical Reactions Involved
- 10.5 Mass Balance and Raw Material Requirements
- 10.6 Energy Balance
- 10.7 Quality Assurance Criteria and Technical Tests
- 10.8 By-products and Waste Handling
- 10.9 Technology Licensors / Providers
11. Project Details, Requirements and Costs
- 11.1 Land, Location and Site Development
- 11.1.1 Site Selection Criteria
- 11.1.2 Location Analysis
- 11.1.3 Land Requirement and Costs
- 11.1.4 Site Development Costs
- 11.2 Plant Layout
- 11.2.1 Layout Principles
- 11.2.2 Proposed Layout
- 11.2.3 Factors Influencing Layout
- 11.3 Civil Works and Buildings
- 11.4 Plant Machinery
- 11.4.1 Machinery Requirements and Specifications
- 11.4.2 Machinery Costs
- 11.4.3 Machinery Suppliers
- 11.5 Raw Materials
- 11.5.1 Requirements per Tonne of Output
- 11.5.2 Procurement and Sourcing
- 11.5.3 Costs
- 11.5.4 Suppliers
- 11.6 Packaging
- 11.6.1 Packaging Requirements
- 11.6.2 Packaging Costs
- 11.6.3 Packaging Suppliers
- 11.7 Storage and Material Handling
- 11.8 Transportation Requirements and Costs
- 11.9 Utilities
- 11.9.1 Power Requirements and Costs
- 11.9.2 Water Requirements and Costs
- 11.9.3 Steam, Fuel and Other Utilities
- 11.10 Manpower Requirements and Wages
12. Environment, Health, Safety and Sustainability
- 12.1 Effluent and Emissions Management
- 12.2 Hazard Classification and Safety Measures
- 12.3 Carbon Footprint
- 12.4 Green / Low-Carbon Process Options
13. Regulatory Procedures, Approvals and Certifications
- 13.1 Licences and Registrations
- 13.2 Environmental Clearances
- 13.3 Product Certifications (BIS, REACH, etc.)
- 13.4 Approval Timeline
14. Project Implementation Schedule
15. Project Economics
- 15.1 Capital Cost of the Project
- 15.2 Techno-Economic Parameters
- 15.3 Capacity Utilization and Ramp-up
- 15.4 Product Pricing and Margins
- 15.5 Income Projections
- 15.6 Expenditure Projections
- 15.7 Working Capital Requirement
- 15.8 Taxation
- 15.9 Depreciation
16. Financial Analysis
- 16.1 Projected Profit and Loss Account
- 16.2 Projected Cash Flow Statement
- 16.3 Projected Balance Sheet
- 16.4 Liquidity Analysis
- 16.5 Profitability Analysis (Payback, NPV, IRR, ROI)
- 16.6 Break-even Analysis
- 16.7 Debt Service Coverage Ratio (DSCR)
- 16.8 Sensitivity Analysis
- 16.9 Scenario and Uncertainty Analysis
17. Funding and Incentives
- 17.1 Means of Finance and Debt-Equity Structure
- 17.2 Loans and Financial Assistance
- 17.3 Government Schemes and Subsidies (PLI, State Policies)
18. Risk Assessment
- 18.1 Key Success Factors
- 18.2 Key Risk Factors
- 18.3 Risk Mitigation
19. Strategic Recommendations
20. Case Study of a Successful Venture
21. Appendix
- 21.1 Detailed Assumptions
- 21.2 Abbreviations
- 21.3 List of Tables and Figures
- 21.4 Sources
This page vs. the full report
| Data point | On this page (free) | In the full report |
|---|---|---|
| Total CapEx | One rounded range at one capacity | Exact figure at three capacities with a line-item breakup |
| CapEx breakup | Category shares (%) only | Cost, quantity and supplier for every machine |
| Operating cost | Share of raw materials, utilities and labor | Per-unit cost sheet with each input price and consumption |
| Profitability | Gross margin range and payback band | Exact IRR, NPV, ROI, break-even and DSCR |
| Financial statements | List of what is included | 10-year P&L, cash flow, balance sheet and Excel model |
| Sensitivity | One directional line | Full sensitivity and scenario tables |
| Process | Simplified flow diagram | Detailed process flow, mass and energy balance, operating conditions |
| Machinery | Names of the main machines | Specifications, capacity, cost and supplier list |
| Market | Headline size, growth and global demand | Segment, region, trade and price forecast tables |
| Suppliers and buyers | Supplier types and sourcing hubs | Named suppliers and buyers |
Engine Oil project report: FAQs
How much does it cost to set up an engine oil plant?
Does an engine oil plant need a refinery?
What is the profit margin in engine oil manufacturing?
How long does an engine oil plant take to pay back?
What licenses does an engine oil plant need?
Which HS code covers engine oil?
What is the biggest risk for a new engine oil maker?

About the analyst
Nisha Gupta, Senior Research Analyst
Nisha Gupta is a Senior Research Analyst at Credence Research Inc. who works across industry domains, including packaging, automotive parts and machinery. Her focus is the modelling engine behind each study: she builds quantitative market databases and econometric forecasting frameworks, and developed automated Excel-based market modelling templates that cut client turnaround time by 30%.
Related market research
- Synthetic Lubricants Market Size, Share and Forecast 2032
- Base oil Market Size, Growth, Analysis & Forecast To 2032
- Two-Wheeler Lubricants Market Size, Growth and Forecast 2032
- Electric Vehicles Fluids & Lubricants Market Size, Share & Forecast 2032
- Lubricant Packaging Market Size, Growth and Forecast 2032
- High-Performance Lubricants Market Size, Growth & Forecast 2032
More plant project reports
- Ferrous Sulphate Manufacturing Plant Project Report (DPR) 2026
- Acetonitrile Manufacturing Plant Project Report (DPR) 2026
- Sodium Chloride Manufacturing Plant Project Report (DPR) 2026
- Sodium Chlorate Manufacturing Plant Project Report (DPR) 2026
- Copper Sulphate Manufacturing Plant Project Report (DPR) 2026
- Egg Tray Manufacturing Plant Project Report (DPR) 2026