
Quick answer
Acetonitrile is a polar solvent used mainly in drug synthesis and chromatography, and most world supply is a by-product of acrylonitrile. A standalone investor would use the on-purpose acetic acid and ammonia route. A 15,000-metric-ton-a-year greenfield plant needs an estimated USD 15–45 million of CapEx. Gross margin is about 14–33% at premium or protected prices, and payback is about 5–17 years at mid-range CapEx.
Viable with pharma-grade sales, a protected market or low-cost acetic acid, but exposed when by-product supply from acrylonitrile plants sets the export price below on-purpose cost.
Acetonitrile plant: key highlights
| Parameter | Indicative value | Note |
|---|---|---|
| Plant capacity | 15,000 metric tons per year | On-purpose route, acetic acid and ammonia, standalone site |
| Total CapEx | USD 15–45 million | Low end an Asian industrial park, top end a U.S. or EU site |
| Raw material share of operating cost | 75–80% | Acetic acid, ammonia and caustic lye |
| Gross margin | 14–33% | At an assumed USD 1,300–1,550 per ton; negative at Chinese export prices |
| Payback period | 5–17 years | 90% utilization, USD 30 million mid-range CapEx, simple pre-tax basis |
| IRR | Available in report | Post-tax, 10-year model |
| Break-even | Available in report | Capacity utilization basis |
Ranges assume a 15,000-metric-ton on-purpose plant using acetic acid and ammonia, Asian to U.S. or EU sites, 2026 prices and 90% utilization. Selling price of USD 1,300–1,550 per ton is assumed. CapEx is scaled from disclosed Indian projects at an assumed INR 74.5 (2021) and INR 82 (2023) per USD, with assumed escalation and location factors. Customizable to any country or region.
What is acetonitrile?
Acetonitrile (CH3CN, CAS 75-05-8), also called methyl cyanide, is a colorless, water-miscible liquid that boils near 82 degrees Celsius. Its value comes from dissolving both polar and many nonpolar compounds while staying transparent to ultraviolet light, a combination few solvents offer at comparable cost.
Grades step up sharply in purity and price. Industrial material of about 99.9% serves chemical synthesis and extraction. HPLC and LC-MS grades serve analytical labs, while pharmaceutical and DNA-synthesis grades reach 99.999% and need low water, low ultraviolet absorbance and tight control of trace metals.
The product is classified under Harmonized System subheading 2926.90, other nitrile-function compounds. That basket code also covers many other nitriles, so customs totals overstate it. For transport it is UN1648, Class 3, Packing Group II, with a closed-cup flash point near 2 degrees Celsius.
Main applications are active pharmaceutical ingredient manufacture, peptide and oligonucleotide synthesis, chromatography, agrochemical intermediates and butadiene extraction. Pharmaceutical buyers also treat it as an ICH Q3C Class 2 residual solvent, limited to 410 ppm in finished drugs by default, so makers of drug-grade solvent face quality audits.
Acetonitrile market overview and global demand
The global market is small in value, with pharmaceutical use a leading outlet. It is worth about USD 387 million in 2025, based on Credence Research's global market study of USD 365 million for 2024 and a 5.9% CAGR, which points to USD 577.3 million by 2032. It also sits inside the wider high-purity solvents category, valued by Credence Research at USD 4.05 billion in 2024.
Supply follows a product that buyers of this solvent do not control. Propylene ammoxidation makes acrylonitrile, with crude acetonitrile recovered at about 2–4% of output, so availability moves with demand for ABS resins, acrylic fiber and nitrile rubber. When those markets weaken, solvent supply can tighten regardless of drug demand. Cornerstone Chemical said in February 2025 it would mothball a 240,000-ton Louisiana acrylonitrile plant.
China and India are the clearest markets with public numbers, though the Chinese data are dated. China Chemical Reporter put 2017 Chinese capacity near 102,000 tons, with output of 59,500 tons and consumption of 44,000 tons. Only about 8,000 tons of that output came from synthesis units, on 40,000 tons of capacity, because high costs left many idle.
India is a leading on-purpose base. Installed capacity is about 48,000–54,000 tons, and published demand estimates run from 30,000 to 40,000 tons. Imports were about 19,000–20,000 tons in fiscal 2025, worth about USD 34 million. Generic semaglutide and other peptide drugs are the demand story that sellers cite, because purification by preparative chromatography uses large solvent volumes. That growth is not yet well quantified.
Buyers are mainly drug makers and contract manufacturers, followed by agrochemical producers and lab-solvent packers.
Acetonitrile manufacturing process
Three supply routes exist, and they have very different economics. By-product recovery refines crude acetonitrile from an acrylonitrile plant, at low feed cost, and Asahi Kasei's Korean unit was built on that model at 11,000 tons a year. It is only open to a producer with an acrylonitrile host. Ethanol ammoxidation remains at pilot scale, with published work at about 10 kg per hour. The reference plant here therefore uses the third route, acetic acid ammonolysis, which needs no host plant and is the main commercial on-purpose method. Its net reaction is CH3COOH + NH3 → CH3CN + 2H2O.
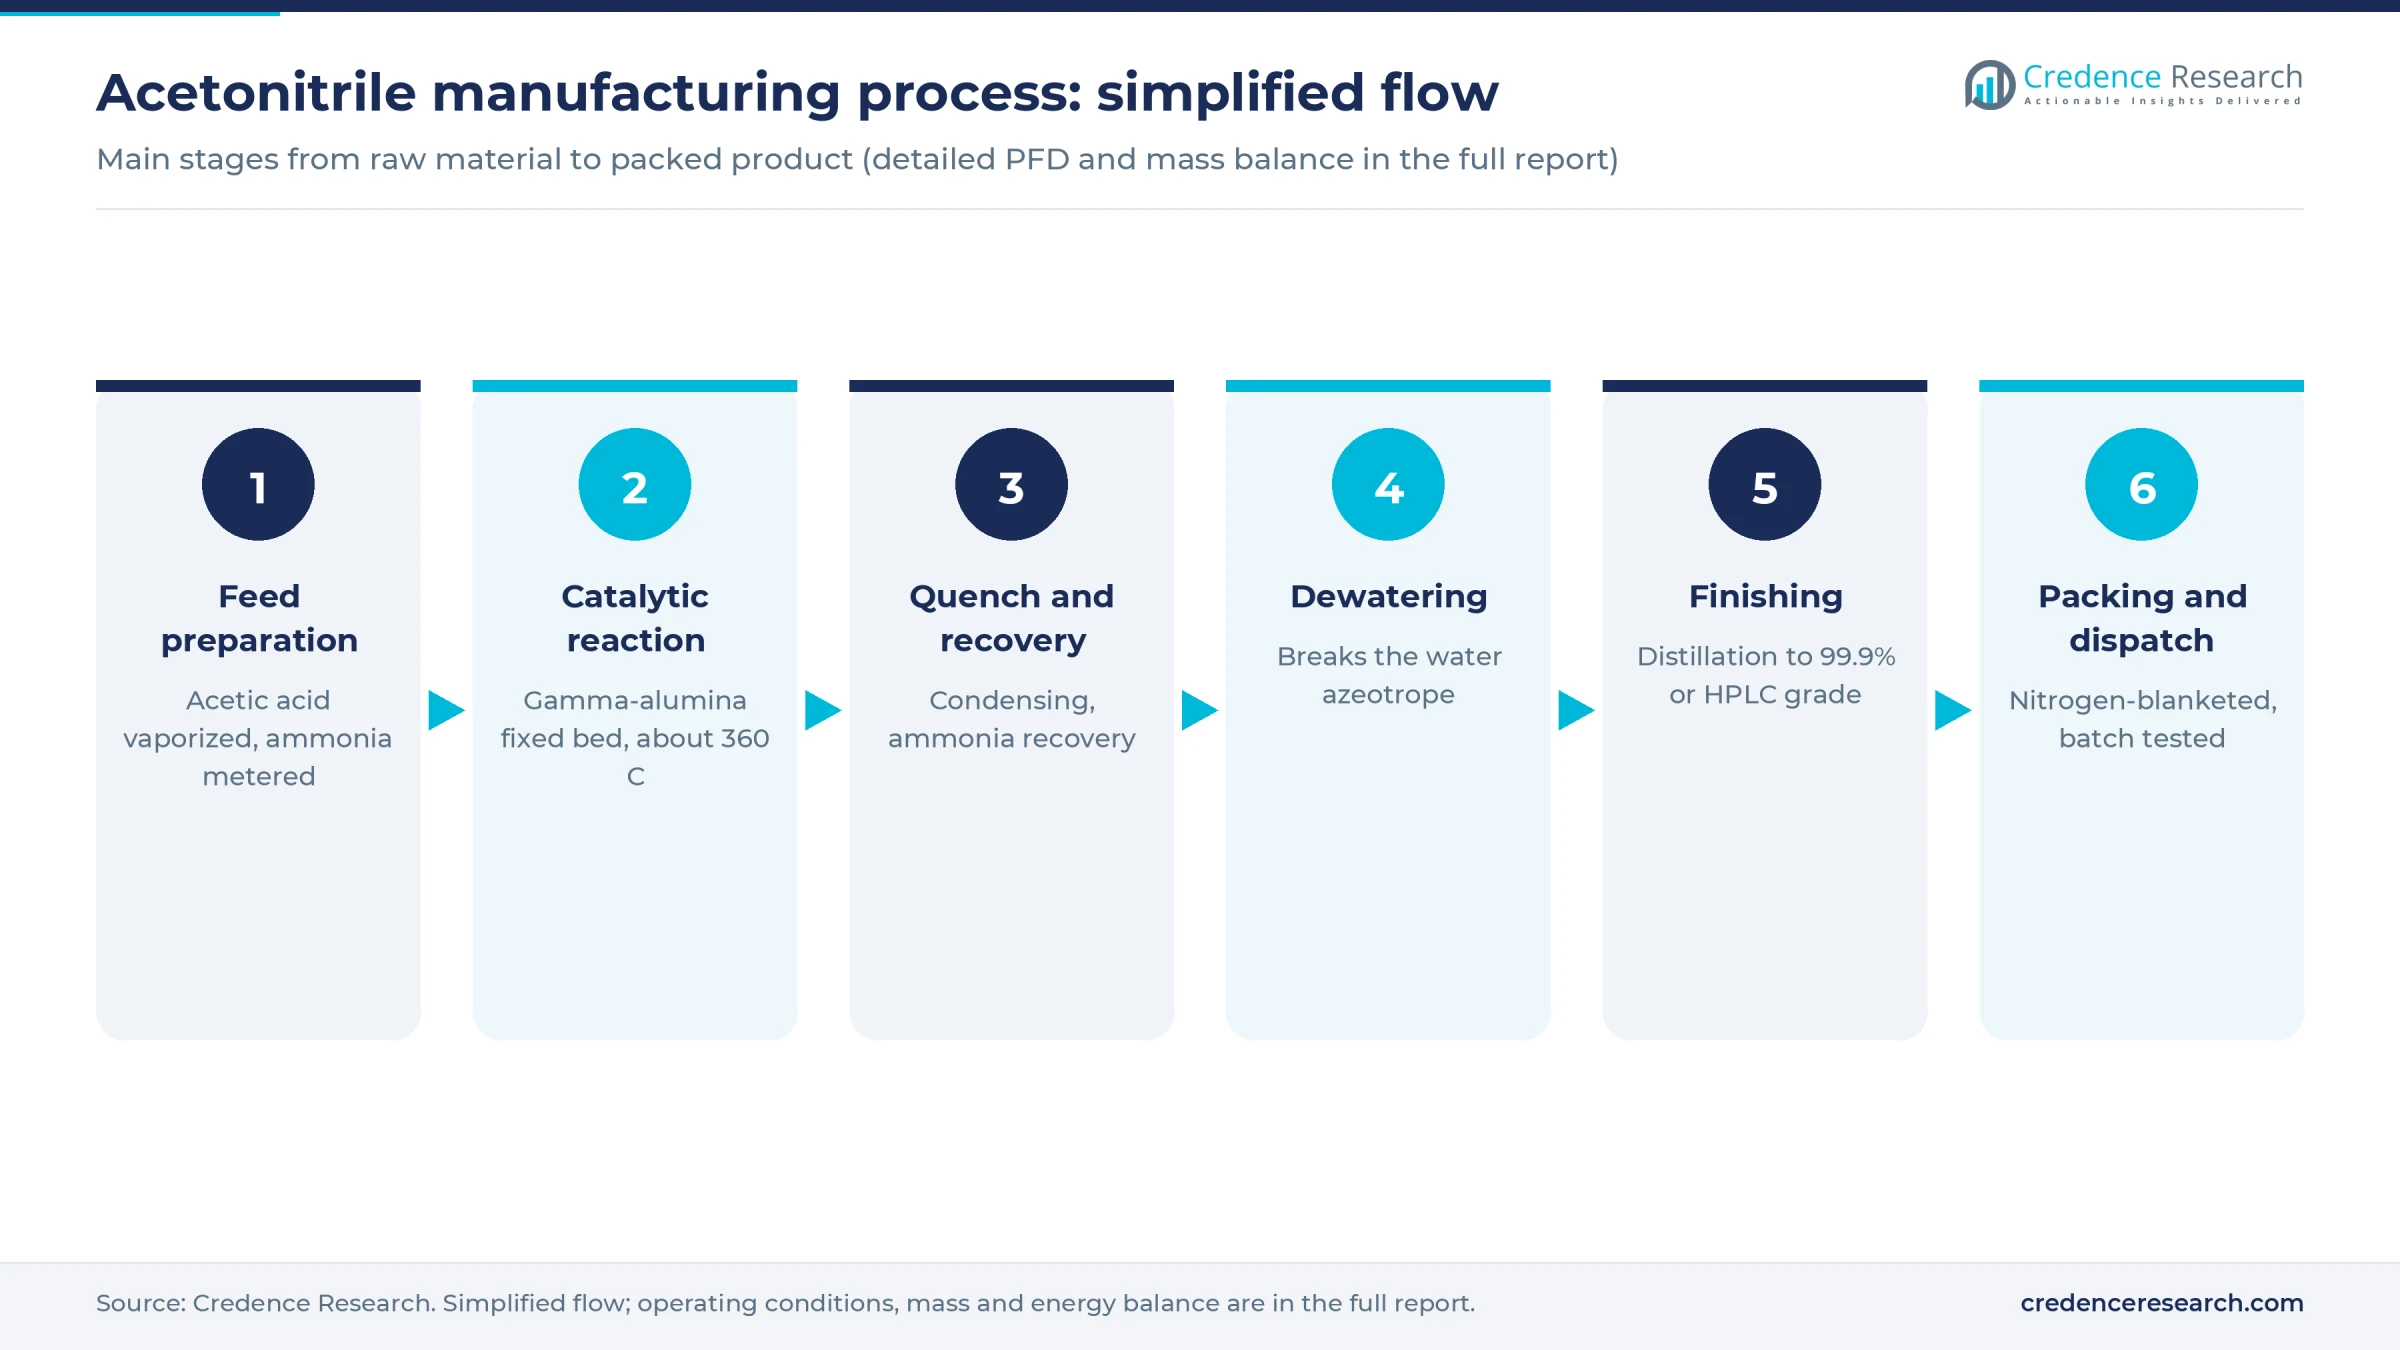
- Feed preparation. Acetic acid is vaporized, and anhydrous ammonia is metered from pressurized storage at close to a one-to-one molar ratio, with a slight excess in many designs.
- Catalytic reaction. Vapors pass over a gamma-alumina catalyst in a heated fixed-bed multitube reactor. A 2026 university design study used about 360 degrees Celsius and 3.1 atmospheres, with 98% conversion. Heat input is a meaningful utility cost.
- Quench and recovery. The product stream is condensed and scrubbed, with unreacted ammonia recovered or neutralized. The result is a wet crude holding about two moles of water for each mole of product.
- Dewatering. Water forms an azeotrope with the product, so plain distillation cannot finish the job. Plants break it with caustic salting-out, extractive distillation using ethylene glycol or pressure-swing distillation.
- Finishing. Fractional columns remove light and heavy impurities to about 99.9%. HPLC and higher grades go through added polishing, sometimes on adsorbents, in closed high-purity lines.
- Packing and dispatch. Product is stored under nitrogen and shipped in tank containers, drums or lab bottles after batch testing.
Yield matters more than reactor volume. Stoichiometry needs about 1.46 tons of acetic acid per ton of product, and a published Indian cost model uses 1.60 tons, so each lost point of yield directly costs margin. Aqueous effluent, spent caustic and off-gas handling add to design scope because the site stores a toxic gas and a highly flammable liquid.
Acetonitrile plant setup cost
The reference plant makes 15,000 metric tons a year, about the size of the unit INEOS announced for Cologne, Germany, in 2022. Total CapEx is estimated at USD 15–45 million, including land, reaction and distillation trains, tank farm, utilities, effluent treatment, preoperative costs and a working capital margin. The spread mainly reflects location and project scope, not technology.
Three disclosed Indian projects anchor it. Balaji Amines approved about USD 9.4–10.7 million in 2021 for 16,500 tons. Alkyl Amines spent about USD 21.5 million in 2021 to lift capacity from about 12,000 to about 30,000 tons. Jindal Speciality Chemicals reported more than USD 12 million for 10,000 tons at Kheda in 2023. All three were disclosed in rupees and converted at the stated assumed rates, or about USD 570–1,220 per annual ton. Scaled by the six-tenths rule, with assumed escalation of 1.25x from 2021 and 1.12x from 2023, they give about USD 12–24 million. An assumed 1.25x greenfield factor produces USD 15–30 million in Asia, and an assumed 1.5–1.6x location factor reaches about USD 35–45 million in the United States or EU.
For the land row, the plant needs about 30,000 square meters including tank separation distances, an assumed figure. At an assumed USD 15–60 per square meter, land costs USD 450,000 to USD 1.8 million, or about 4% of mid-range CapEx. U.S. and EU sites can exceed that range.
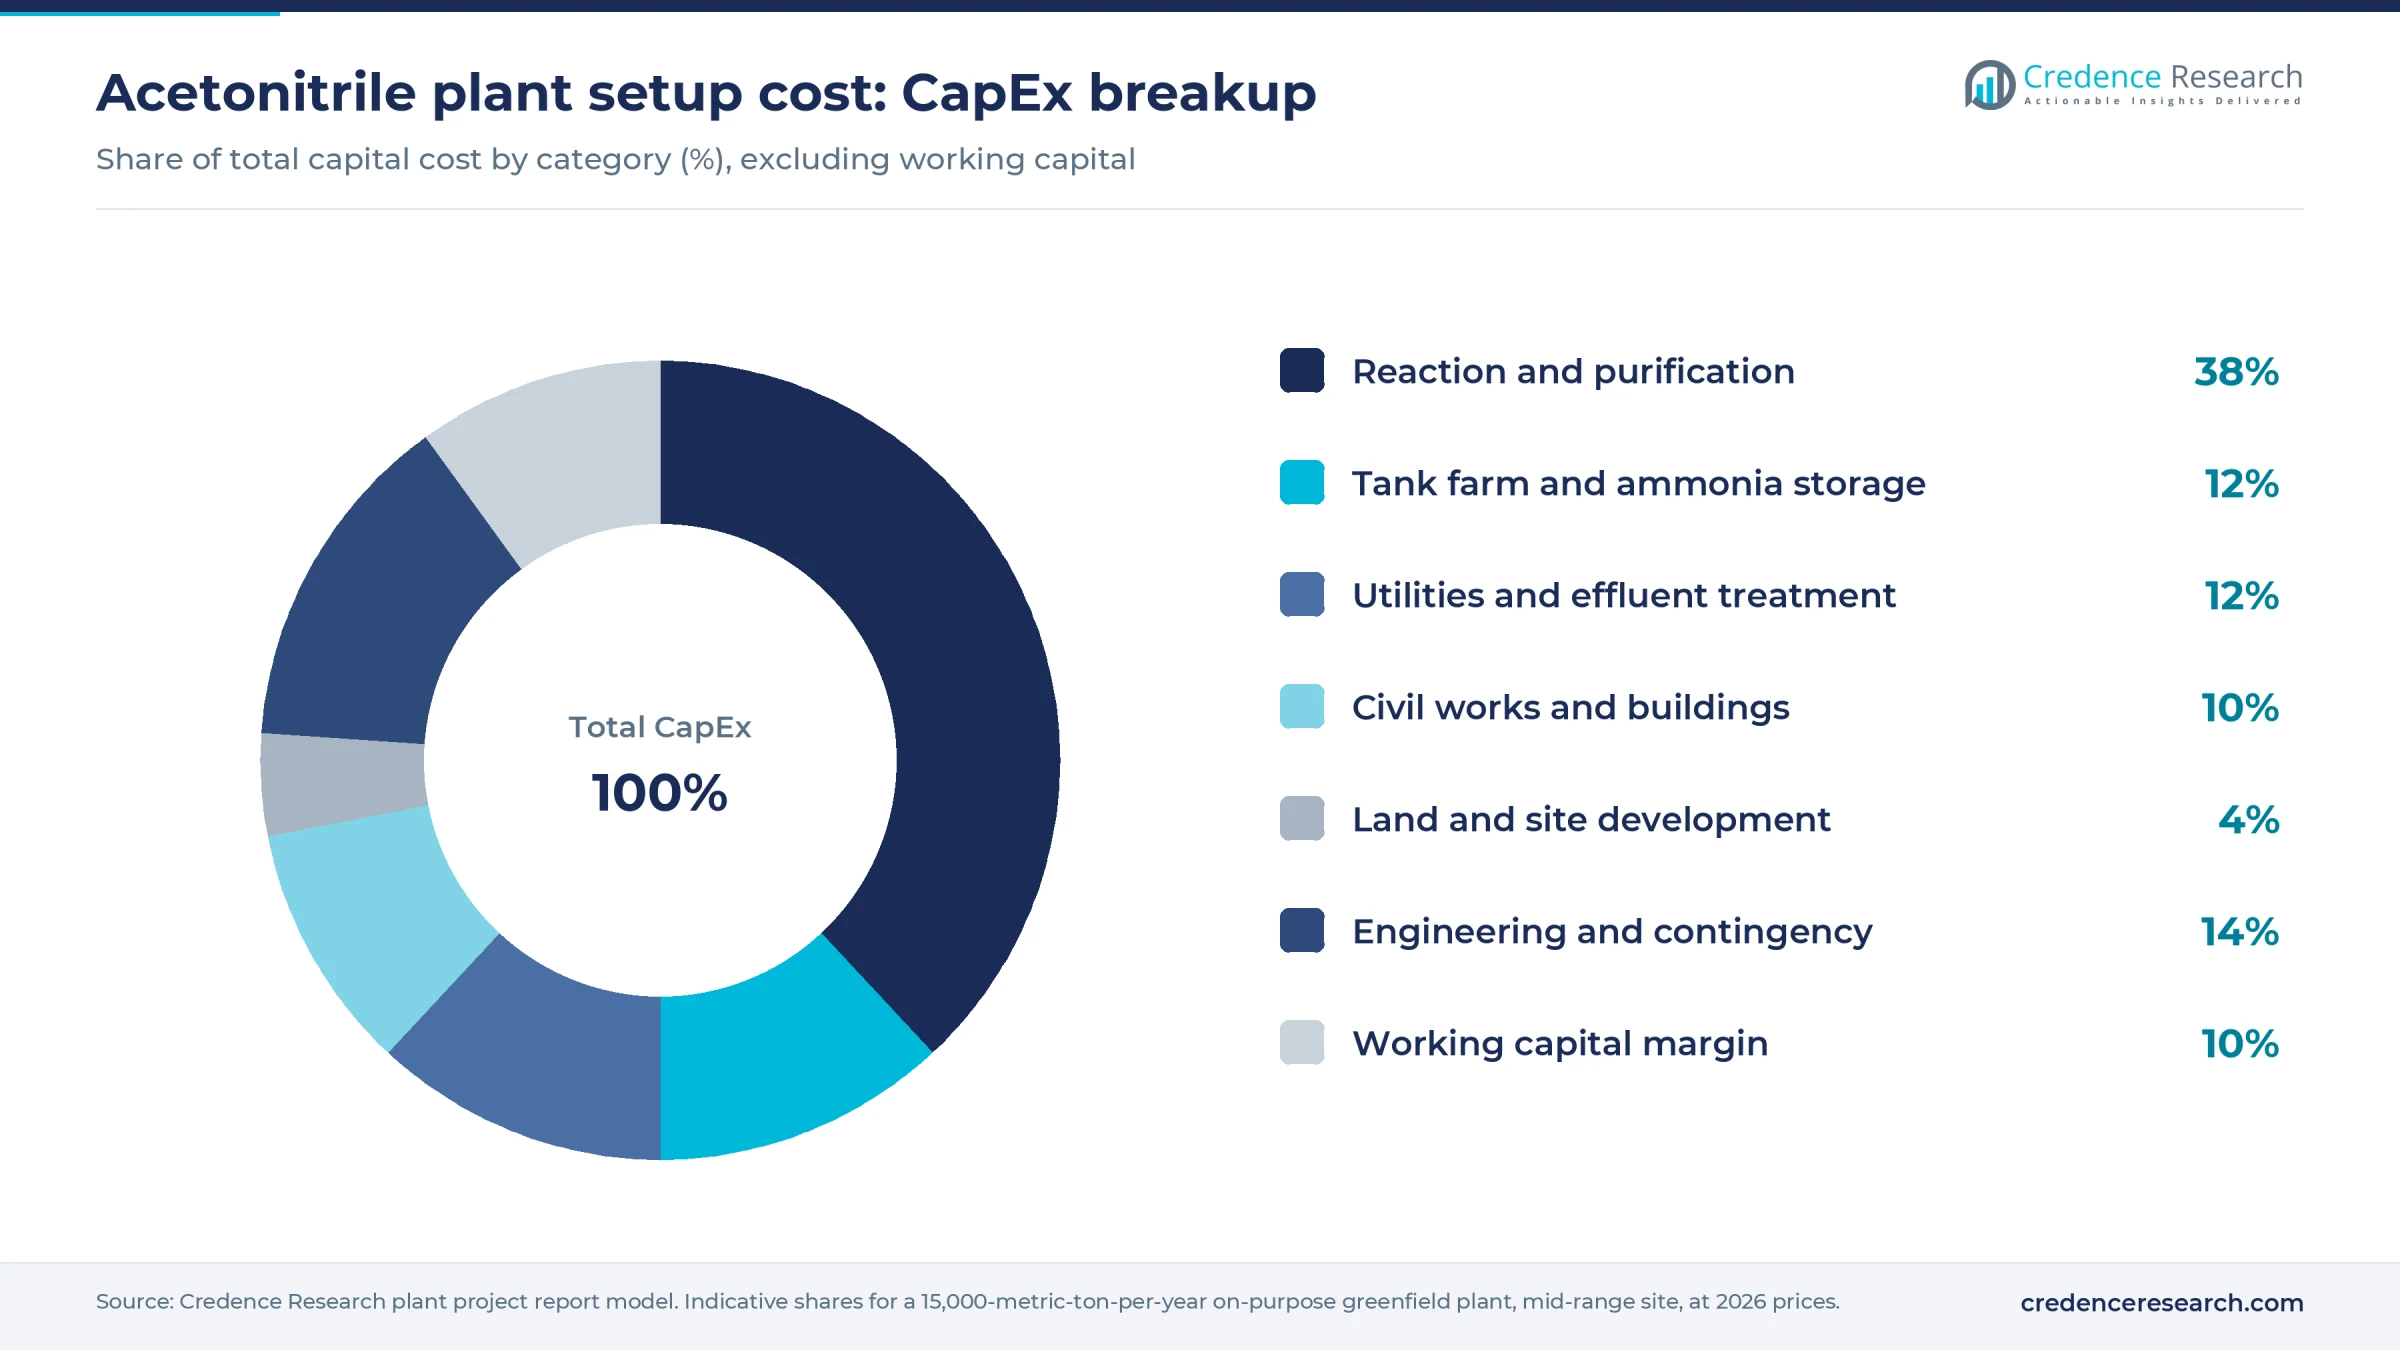
Reaction and purification take close to 40% of the investment, and storage is unusually large because the plant holds ammonia, acid and finished solvent in separate systems. Operating cost tells a simpler story.
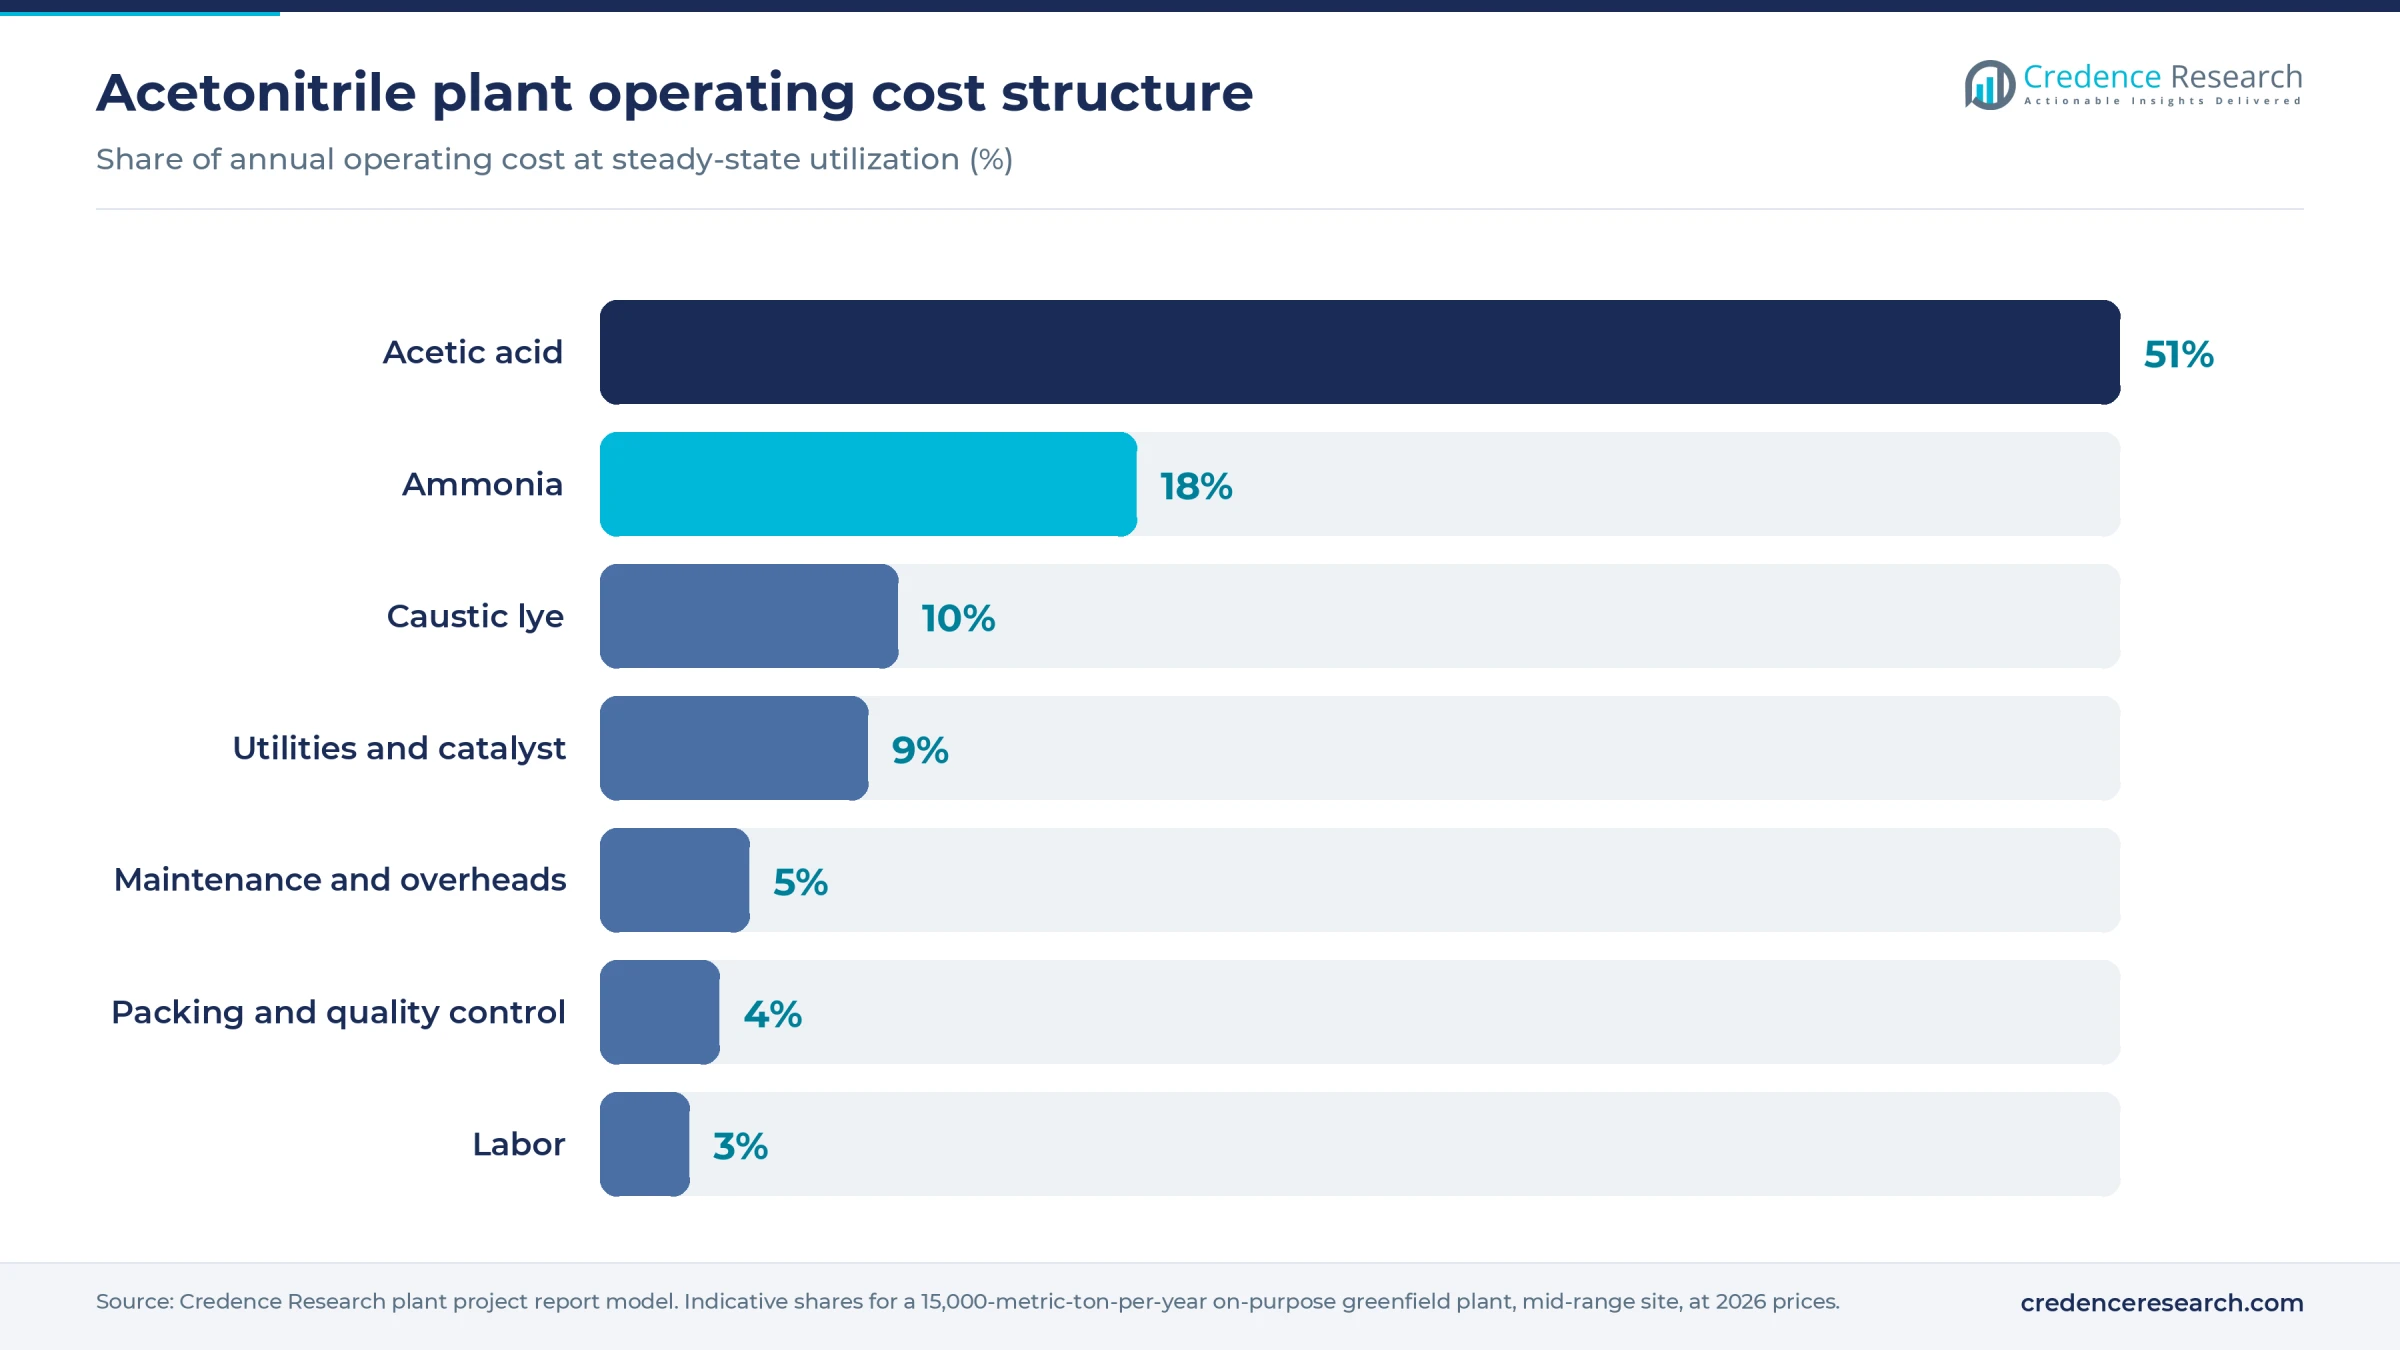
Acetic acid alone is about half of running cost, so feed contracts decide competitiveness more than plant design. The full report can be customized to any country or region.
Machinery and raw materials for an acetonitrile plant
Main equipment groups are listed below; ratings, makes and the full schedule are in the report.
- Acetic acid tanks, pressurized ammonia storage and vaporizers
- Fixed-bed multitube reactor, fired or hot-oil heater and catalyst handling
- Condensers, absorbers and ammonia recovery scrubbers
- Caustic salting-out or extractive dewatering section
- Distillation columns, reboilers and high-purity polishing beds
- Nitrogen-blanketed product tanks and drum or tank-container filling
- Effluent treatment, thermal oxidizer, boiler and cooling tower
- Distributed control system, gas detection, and a quality lab with HPLC and Karl Fischer equipment
At 90% utilization the plant uses about 21,600 tons of acetic acid, 6,900 tons of ammonia and 4,050 tons of caustic lye a year, based on a published usage model. Acetic acid supply comes mainly from methanol carbonylation plants in China, the United States, Singapore, Saudi Arabia, Taiwan and South Korea, with China the largest producer. Ammonia trades widely from the Middle East, Trinidad, Indonesia, Russia and the United States. Caustic lye is available in most chlor-alkali regions.
A site at a port or next to an acetyls complex cuts freight and tank investment. Purchased acetic acid was quoted near USD 342 per ton FOB China in February 2026, and ammonia pricing is more volatile, with published values of USD 400–452 per ton during winter 2025–26.
Acetonitrile business profit margin and ROI
Gross margin is estimated at 14–33%, measured as selling price minus feed and direct conversion cost, at an assumed price of USD 1,300–1,550 per ton. Direct cost is about USD 1,030–1,115 per ton, built from published feed usage and February 2026 prices plus an assumed conversion cost of USD 170–190.
That price assumption is the central risk. Published February 2026 values show about USD 916 per ton FOB China, below on-purpose cost, and about USD 1,261 CIF India including duty. Indian imports averaged about USD 1,500–2,000 per ton in fiscal 2025. On-purpose plants therefore earn their margin from pharma grades, local supply security or trade protection, not from competing with low-priced export material.
At 90% utilization, or 13,500 tons, annual cash profit is about USD 1.8–6.3 million after an assumed USD 0.7 million of fixed overhead. On USD 30 million of mid-range CapEx, simple pre-tax payback is about 5–17 years. A USD 15 million Asian build in the strongest price case reaches about 2.4 years. A USD 45 million U.S. or EU build in the weakest price case would take about 25 years. Each USD 100 per ton change in price moves cash profit by about USD 1.35 million, and each USD 50 per ton on acetic acid moves it by about USD 1.1 million.
| Metric | Value |
|---|---|
| Gross margin | 14–33% |
| Payback period | 5–17 years |
| IRR (post-tax) | Available in report |
| NPV | Available in report |
| Return on investment | Available in report |
| DSCR | Available in report |
| Break-even utilization | Available in report |
How to start an acetonitrile business, licenses and approvals
Approval steps follow a common path: company and tax registration, industrial zoning and building permits, an environmental permit covering air emissions, wastewater and hazardous waste, occupational safety and fire clearances for flammable liquid and anhydrous ammonia storage, chemical substance registration, dangerous goods transport compliance and import or export registration. Drug-grade sales add customer audits and quality certification rather than a separate product license in most markets.
| Market | Key approvals for an acetonitrile plant |
|---|---|
| United States | State or EPA Clean Air Act construction and operating permits, NPDES or pretreatment wastewater permit, RCRA rules (discarded unused product is waste code U003), OSHA 40 ppm exposure limit and Process Safety Management, EPA Risk Management Program for anhydrous ammonia, TSCA compliance, DOT rules for UN1648 |
| European Union | Integrated permit under the Industrial Emissions Directive, Annex I 4.1(d), which names nitriles; REACH registration; CLP classification and labeling; Seveso III review of ammonia and flammable inventories; ADR transport rules |
| India | Environmental clearance under item 5(f) of the EIA Notification 2006, synthetic organic chemicals; state pollution control board consent to establish and operate; factory license; Manufacture, Storage and Import of Hazardous Chemical Rules 1989, which list acetonitrile and ammonia; hazardous waste authorization |
Ammonia storage often sets the safety case and site layout, so inventory limits deserve review before land is chosen. Thresholds and category depend on site and design.
Key acetonitrile manufacturers and recent developments
INEOS Nitriles, which has claimed to be the world's largest producer, is a major by-product supplier through its acrylonitrile network. Asahi Kasei, through Kawasaki in Japan and Tongsuh Petrochemical in Korea, is another major refiner. Chinese producers include Nantong Liyang Chemical, Shandong Kunda Biotechnology and Weifang Zhonghui Chemical. India's on-purpose group includes Alkyl Amines Chemicals, Balaji Amines and Jindal Speciality Chemicals. Buyers in peptide manufacturing usually qualify suppliers grade by grade.
- February 2026: Authorities in Nantong, China, approved the environmental assessment for Nantong Liyang Chemical's 30,000-ton-a-year acetonitrile project, which replaces its existing 10,000-ton unit, with ammonium sulfate and acetone co-products.
- May 2026: Asahi Kasei said it will shut its 200,000-ton Mizushima acrylonitrile line by fiscal 2030, keeping supply through Tongsuh. Fewer such lines would mean less crude by-product for refiners.
- September 2026: Balaji Amines began commercial production at its enhanced Solapur plant, with installed capacity of 1,440 tons a month.
Trade policy also shapes entry, as India's June 2025 anti-dumping notification shows. It set duties of USD 202–481 per ton on Chinese, Russian and Taiwanese material for five years, which helps explain why Indian on-purpose margins differ from those elsewhere.
What's inside the Acetonitrile project report PDF
The report runs to 21 chapters. Open a chapter to see its sections.
1. Preface
2. Scope and Methodology
- 2.1 Objectives of the Study
- 2.2 Stakeholders
- 2.3 Research Methodology
- 2.4 Data Sources and Key Assumptions
3. Executive Summary
- 3.1 Market Snapshot
- 3.2 Project at a Glance (Capacity, CapEx, OpEx)
- 3.3 Key Financial Indicators (IRR, NPV, Payback, Break-even)
- 3.4 Feasibility Verdict
4. Product Overview
- 4.1 Acetonitrile Definition and Properties
- 4.2 Grades and Specifications (BIS / ISO / ASTM)
- 4.3 HS Code and Classification
- 4.4 Key Applications
- 4.5 Substitutes
5. Global Acetonitrile Market
- 5.1 Market Overview
- 5.2 Historical and Current Market Performance (Volume and Value)
- 5.3 Market Breakup by Grade / Type
- 5.4 Market Breakup by End-Use Industry
- 5.5 Market Breakup by Region
- 5.6 Market Drivers, Restraints and Trends
- 5.7 Value Chain Analysis
- 5.8 Market Forecast
6. Target Country Acetonitrile Market Analysis
- 6.1 Demand and Supply Analysis
- 6.2 Installed Capacity vs Demand Gap
- 6.3 Import Dependence
- 6.4 Demand Forecast by End-Use
7. Trade Analysis
- 7.1 Imports by Volume, Value and Country
- 7.2 Exports by Volume, Value and Country
- 7.3 Trade Balance and Opportunities
8. Price Analysis
- 8.1 Historical Acetonitrile Price Trends by Region
- 8.2 Raw Material / Feedstock Price Trends and Linkage
- 8.3 Price Forecast
- 8.4 Margins Across the Value Chain
9. Competitive Landscape
- 9.1 Market Structure
- 9.2 Key Players and Installed Capacities
- 9.3 Profiles of Key Players
- 9.4 Recent Developments (Expansions, M&A, New Plants)
10. Manufacturing Process and Technology
- 10.1 Comparison of Technology Routes
- 10.2 Selected Route and Process Flow Diagram
- 10.3 Unit Operations Involved
- 10.4 Chemical Reactions Involved
- 10.5 Mass Balance and Raw Material Requirements
- 10.6 Energy Balance
- 10.7 Quality Assurance Criteria and Technical Tests
- 10.8 By-products and Waste Handling
- 10.9 Technology Licensors / Providers
11. Project Details, Requirements and Costs
- 11.1 Land, Location and Site Development
- 11.1.1 Site Selection Criteria
- 11.1.2 Location Analysis
- 11.1.3 Land Requirement and Costs
- 11.1.4 Site Development Costs
- 11.2 Plant Layout
- 11.2.1 Layout Principles
- 11.2.2 Proposed Layout
- 11.2.3 Factors Influencing Layout
- 11.3 Civil Works and Buildings
- 11.4 Plant Machinery
- 11.4.1 Machinery Requirements and Specifications
- 11.4.2 Machinery Costs
- 11.4.3 Machinery Suppliers
- 11.5 Raw Materials
- 11.5.1 Requirements per Tonne of Output
- 11.5.2 Procurement and Sourcing
- 11.5.3 Costs
- 11.5.4 Suppliers
- 11.6 Packaging
- 11.6.1 Packaging Requirements
- 11.6.2 Packaging Costs
- 11.6.3 Packaging Suppliers
- 11.7 Storage and Material Handling
- 11.8 Transportation Requirements and Costs
- 11.9 Utilities
- 11.9.1 Power Requirements and Costs
- 11.9.2 Water Requirements and Costs
- 11.9.3 Steam, Fuel and Other Utilities
- 11.10 Manpower Requirements and Wages
12. Environment, Health, Safety and Sustainability
- 12.1 Effluent and Emissions Management
- 12.2 Hazard Classification and Safety Measures
- 12.3 Carbon Footprint
- 12.4 Green / Low-Carbon Process Options
13. Regulatory Procedures, Approvals and Certifications
- 13.1 Licences and Registrations
- 13.2 Environmental Clearances
- 13.3 Product Certifications (BIS, REACH, etc.)
- 13.4 Approval Timeline
14. Project Implementation Schedule
15. Project Economics
- 15.1 Capital Cost of the Project
- 15.2 Techno-Economic Parameters
- 15.3 Capacity Utilization and Ramp-up
- 15.4 Product Pricing and Margins
- 15.5 Income Projections
- 15.6 Expenditure Projections
- 15.7 Working Capital Requirement
- 15.8 Taxation
- 15.9 Depreciation
16. Financial Analysis
- 16.1 Projected Profit and Loss Account
- 16.2 Projected Cash Flow Statement
- 16.3 Projected Balance Sheet
- 16.4 Liquidity Analysis
- 16.5 Profitability Analysis (Payback, NPV, IRR, ROI)
- 16.6 Break-even Analysis
- 16.7 Debt Service Coverage Ratio (DSCR)
- 16.8 Sensitivity Analysis
- 16.9 Scenario and Uncertainty Analysis
17. Funding and Incentives
- 17.1 Means of Finance and Debt-Equity Structure
- 17.2 Loans and Financial Assistance
- 17.3 Government Schemes and Subsidies (PLI, State Policies)
18. Risk Assessment
- 18.1 Key Success Factors
- 18.2 Key Risk Factors
- 18.3 Risk Mitigation
19. Strategic Recommendations
20. Case Study of a Successful Venture
21. Appendix
- 21.1 Detailed Assumptions
- 21.2 Abbreviations
- 21.3 List of Tables and Figures
- 21.4 Sources
This page vs. the full report
| Data point | On this page (free) | In the full report |
|---|---|---|
| Total CapEx | One rounded range at one capacity | Exact figure at three capacities with a line-item breakup |
| CapEx breakup | Category shares (%) only | Cost, quantity and supplier for every machine |
| Operating cost | Share of raw materials, utilities and labor | Per-unit cost sheet with each input price and consumption |
| Profitability | Gross margin range and payback band | Exact IRR, NPV, ROI, break-even and DSCR |
| Financial statements | List of what is included | 10-year P&L, cash flow, balance sheet and Excel model |
| Sensitivity | One directional line | Full sensitivity and scenario tables |
| Process | Simplified flow diagram | Detailed process flow, mass and energy balance, operating conditions |
| Machinery | Names of the main machines | Specifications, capacity, cost and supplier list |
| Market | Headline size, growth and global demand | Segment, region, trade and price forecast tables |
| Suppliers and buyers | Supplier types and sourcing hubs | Named suppliers and buyers |
Acetonitrile project report: FAQs
How much does it cost to set up an acetonitrile plant?
Why is most acetonitrile a by-product?
Which route should a new acetonitrile plant use?
What is the profit margin in acetonitrile manufacturing?
What is the payback period for an acetonitrile plant?
Which approvals does an acetonitrile plant need?
Who buys acetonitrile?

About the analyst
Nisha Gupta, Senior Research Analyst
Nisha Gupta is a Senior Research Analyst at Credence Research Inc. who works across industry domains, including packaging, automotive parts and machinery. Her focus is the modelling engine behind each study: she builds quantitative market databases and econometric forecasting frameworks, and developed automated Excel-based market modelling templates that cut client turnaround time by 30%.
Related market research
- Acetonitrile Market Size, Share, Growth and Forecast 2032
- High Purity Solvents Market Size, Growth, Share & Forecast 2032
- Acetic Acid Market Size, Growth, Share, Trends and Forecast 2032
- Acrylonitrile Butadiene Styrene Market Size, Growth and Forecast 2032
- Peptide Building Block Market Size, Growth and Forecast 2032
- Aprotic Solvents Market Size, Trends, Growth and Forecast 2032
More plant project reports
- Engine Oil Manufacturing Plant Project Report (DPR) 2026
- Ferrous Sulphate Manufacturing Plant Project Report (DPR) 2026
- Sodium Chloride Manufacturing Plant Project Report (DPR) 2026
- Sodium Chlorate Manufacturing Plant Project Report (DPR) 2026
- Copper Sulphate Manufacturing Plant Project Report (DPR) 2026
- Egg Tray Manufacturing Plant Project Report (DPR) 2026