
Quick answer
A sodium chloride manufacturing plant dissolves raw salt or draws natural brine, purifies it and crystallizes refined vacuum salt for food, chemical and pharmaceutical buyers. This overview models a greenfield plant making 100,000 tonnes a year, with estimated CapEx of USD 24–40 million. Gross margin after raw salt and direct conversion costs is estimated at 25–40%, with payback at 6–12 years, because salt is low-priced, freight-sensitive and capital-heavy to refine.
Viable for refiners with secured low-cost brine or raw salt and contracted food or chemical buyers within economic freight range; hard to justify as a merchant bulk supplier competing against large integrated producers.
Sodium Chloride plant: key highlights
| Parameter | Indicative value | Note |
|---|---|---|
| Plant capacity | 100,000 tonnes of refined salt per year | About 300 tonnes a day over 330 operating days |
| Total CapEx | USD 24–40 million | Greenfield, scaled from disclosed salt projects; a U.S. or EU build could exceed the top end |
| Raw material share of operating cost | 30–40% | About 1.05–1.10 tonnes of raw salt per tonne of product, assumed |
| Gross margin | 25–40% | After raw salt and direct conversion costs, at USD 160–230 per tonne ex-plant |
| Payback period | 6–12 years | From commissioning, including ramp-up |
| IRR | Available in report | Post-tax, 10-year model |
| Break-even | Available in report | Capacity utilization basis |
Ranges assume a 100,000 tonnes-per-year greenfield refinery, 330 operating days, 85% steady-state utilization and 2026 prices. Ex-plant price USD 160–230 per tonne, with the top from a 2024 U.S. unit value and the low end assumed. Raw salt, energy and other direct costs are assumed. CapEx excludes working capital and salt works or solution mining; rupees at an assumed 90 and rials at 2.6 per USD. The full report can be customized to any country or region.
What is sodium chloride?
Sodium chloride, NaCl, is common salt: a white crystalline mineral recovered from seawater, underground rock deposits and natural brine. A manufacturing plant in this report's sense does not simply mine it. It upgrades raw salt or brine into refined vacuum salt with consistent purity, grain size and moisture, which food processors and chemical users will pay more to receive.
Grades follow end use. Food-grade salt under the Codex standard must hold at least 97% NaCl on a dry basis, and refined vacuum grades usually run well above that. Iodized table salt adds potassium or sodium iodide or iodate. Industrial grades feed water softeners, textile dyeing, detergents and caustic soda and chlorine production. The narrowest and most demanding tier is pharmaceutical-grade salt for saline and dialysis solutions, made to pharmacopoeia limits under quality systems.
Internationally, salt and pure sodium chloride trade under HS code 250100.
Sodium chloride market overview and global demand
Salt is a large-volume, low-value commodity, so the physical numbers say more than any single market value. The U.S. Geological Survey put world production at about 280 million tonnes in 2024. China led with about 55 million tonnes, followed by the United States at 40 million, India at 28 million, Germany at 16 million and Australia at 13 million.
Refined product is a small slice of that volume. In the United States, vacuum and open pan salt made up 9% of 2024 salt sold or used, against 42% for salt in brine and 40% for rock salt. Its unit value, about USD 230 per tonne at the plant, compares with USD 140 for solar salt and USD 56 for rock salt. That gap is the commercial reason for a refinery. Highway deicing takes about 41% of U.S. consumption and chemicals about 39%, though nearly all chemical demand there is met by low-cost brine rather than refined crystals.
Credence Research values the global rock salt segment at about USD 9.07 billion in 2025, based on its USD 8.66 billion for 2024 and 4.72% CAGR. Its iodized salt estimate gives about USD 3.54 billion in 2025, derived from USD 3.4 billion for 2024 and 4% CAGR. The pharmaceutical grade report gives about USD 370 million in 2025, derived from USD 350 million for 2024 and 5.6% CAGR. These are separate, overlapping views, not one total.
Trade is thin because freight quickly outweighs value. World's Top Exports, a trade data compiler, lists global salt exports at USD 3.55 billion in 2025, led by India, Germany and the Netherlands. China stands out as a buyer of chemical feedstock: India and Australia supplied about 77% of its 2023 imports by value. Most refined salt therefore sells regionally, and plant location decides much of the outcome.
Sodium chloride manufacturing process
The modeled plant makes refined salt by vacuum evaporation, the standard route for food-grade and high-purity crystals.
Brine preparation. Raw solar or rock salt is dissolved to near saturation, or natural brine is pumped from a solution-mined cavern. Saturated brine holds about 26% salt by weight, so the plant must remove roughly 2.8 tonnes of water for each tonne of crystals. That single ratio explains why energy dominates process design.
Purification. Calcium, magnesium and sulfate are precipitated with reagents such as soda ash and caustic soda and settled out. Skimping here causes scaling in heaters, longer shutdowns and off-specification product.
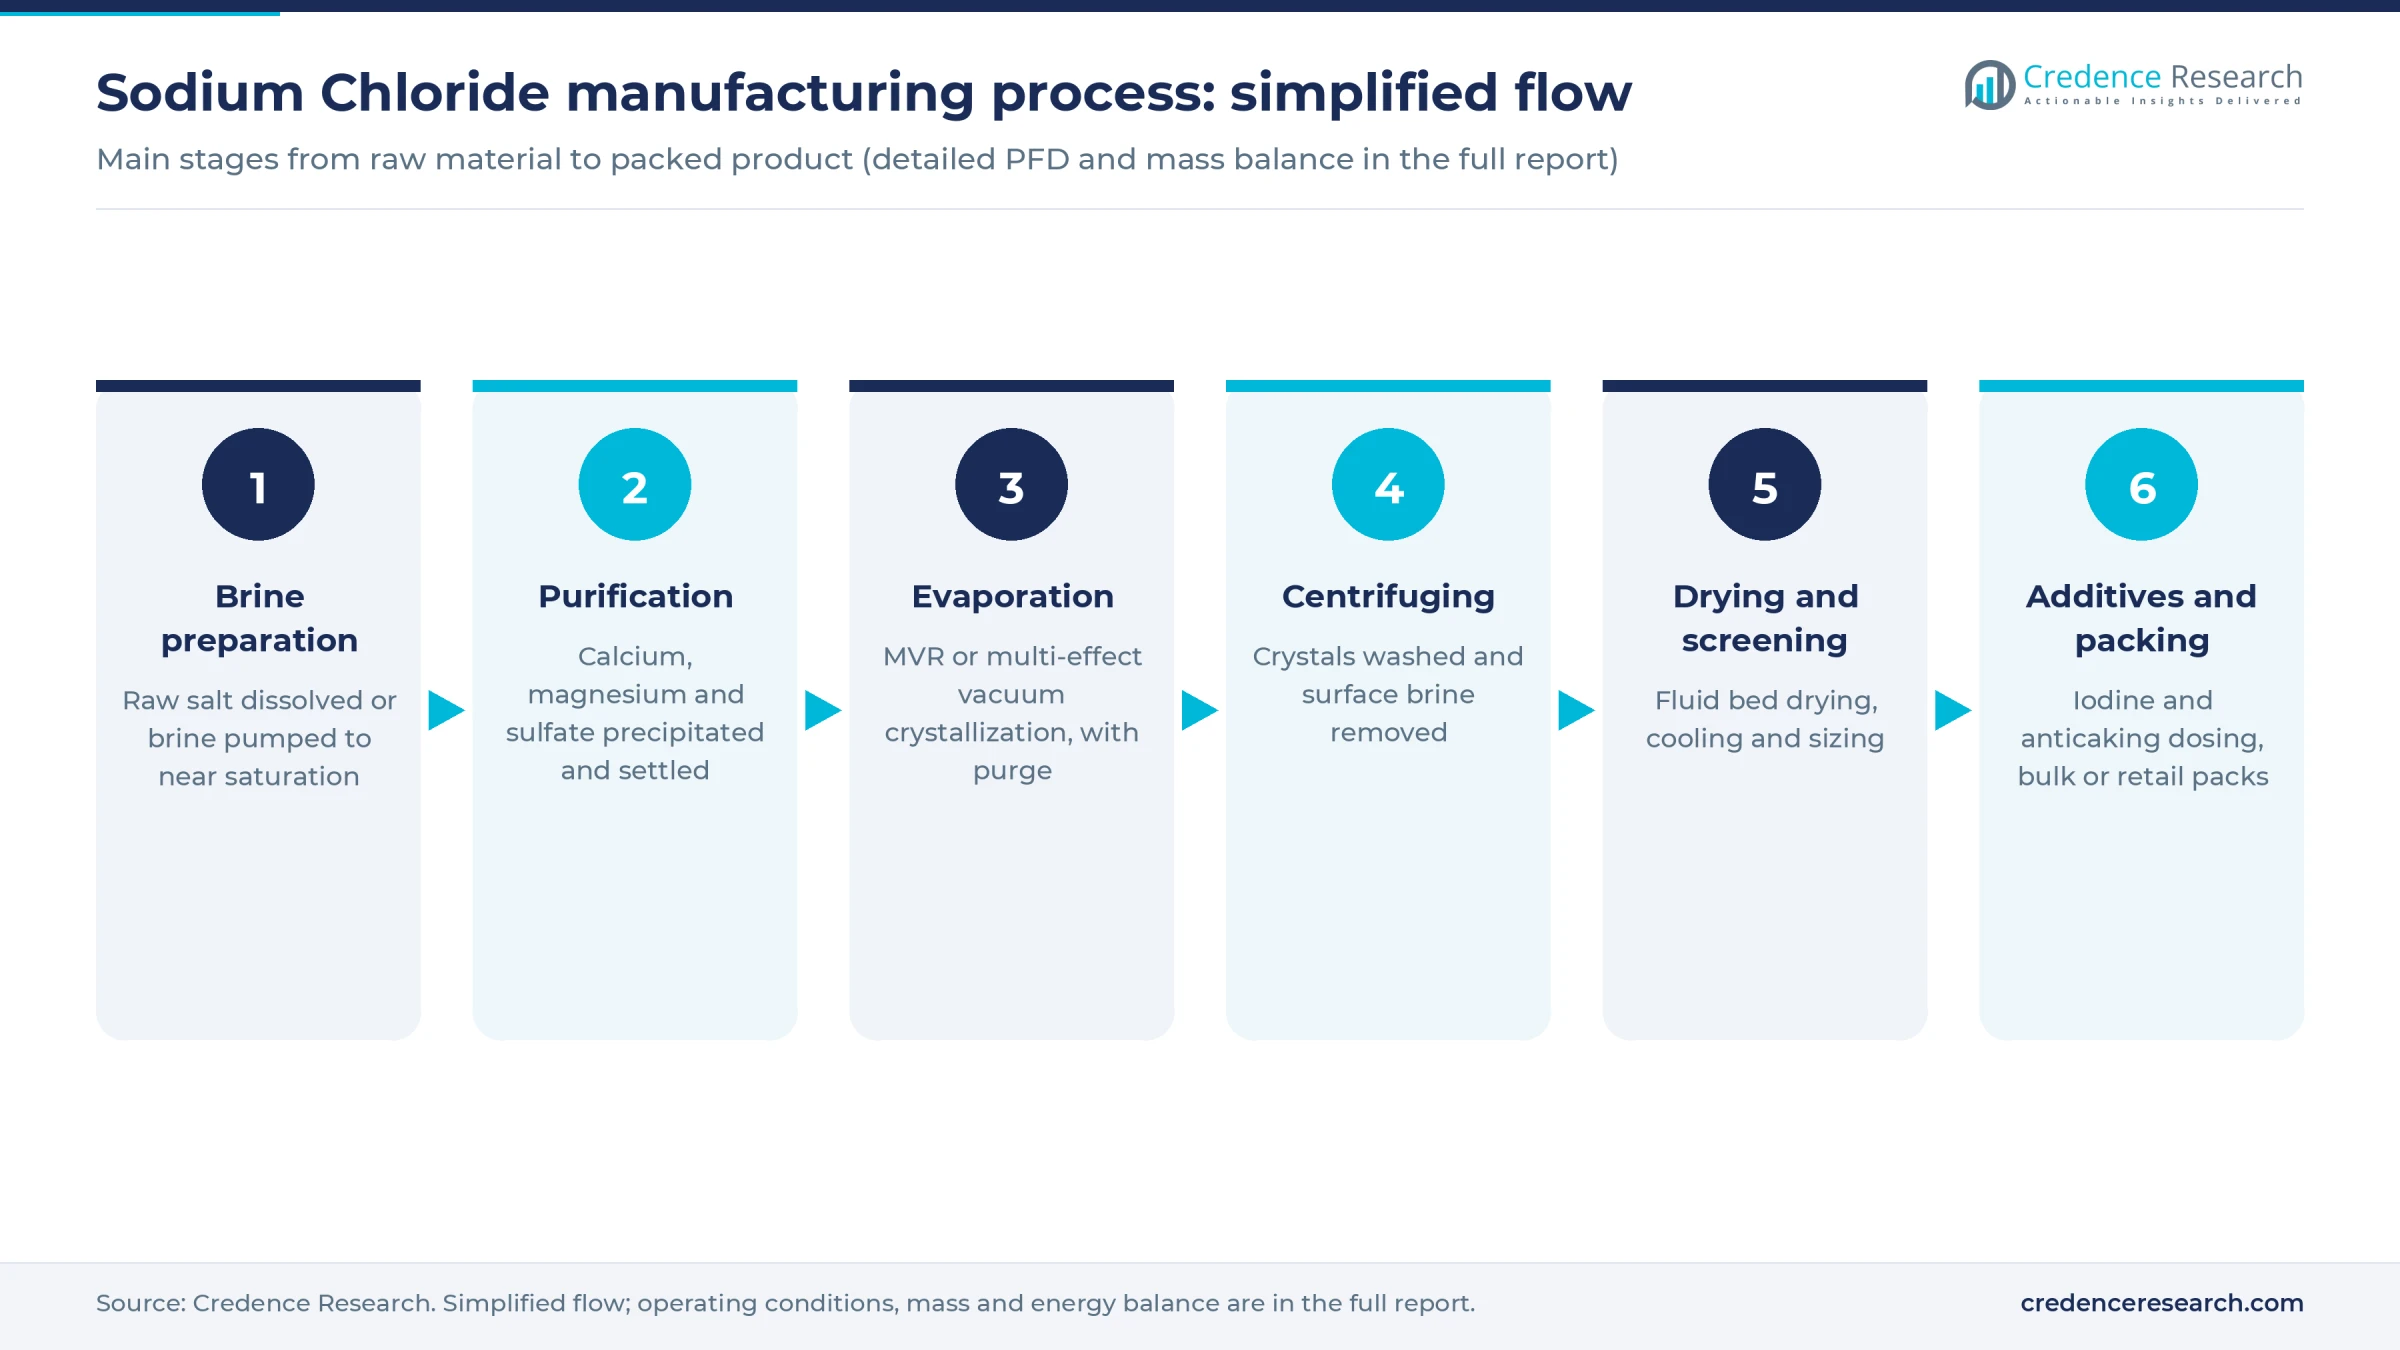
Evaporation and crystallization. Purified brine boils under vacuum. Mechanical vapor recompression, now the main choice for new capacity, compresses vapor and reuses it, shifting the energy bill from steam to electricity. Multi-effect evaporators use steam in stages, which suits sites with cheap steam, and let a producer draw purer crystals from selected effects.
Purge and washing. Part of the mother liquor must leave the circuit, because impurities such as boron accumulate and cannot be removed any other way. Purge volume is both a quality setting and a salt yield loss, and it creates the plant's main effluent. Crystal slurry is washed in counterflow with fresh brine in the salt leg.
Centrifuging and drying. Pusher centrifuges remove most surface brine, and a fluid bed dryer finishes the crystals before cooling and screening to size.
Additives and packing. Food grades receive iodine compounds and permitted anticaking agents in a blender, with iodine dosing checked batch by batch. Product goes to bulk silos, tankers, big bags or retail packs. Consumer packs raise realized price but carry brand and distribution costs.
Sodium chloride plant setup cost
This overview models a greenfield refinery making 100,000 tonnes a year at an estimated total CapEx of USD 24–40 million, excluding salt works, solution mining wells and long pipelines. Three public benchmarks frame the range, each scaled with a standard 0.65 capacity exponent.
The low end comes from a Jazan Chamber investment opportunity reported by Arab News in July 2023, which priced a 100,000 tonnes-per-year refined salt factory in Saudi Arabia at USD 23.9 million. That is a promoter figure, not a built cost. In the middle, an Oman refinery plan reported by Oman Observer in 2017 cited over 10 million rials for 135,000 tonnes, about USD 30 million after scaling and plant cost escalation. The top comes from a Tata Chemicals exchange filing of February 2026, approving a 210,000 tonnes-per-year greenfield iodized vacuum salt facility in Tamil Nadu at about USD 57 million, or about USD 35 million when scaled, with rupees converted at an assumed 90 per U.S. dollar. The filing does not itemize project scope. The stated top of USD 40 million adds a margin for higher-cost sites. No disclosed U.S. or EU greenfield benchmark was found, and a build there could exceed the range.
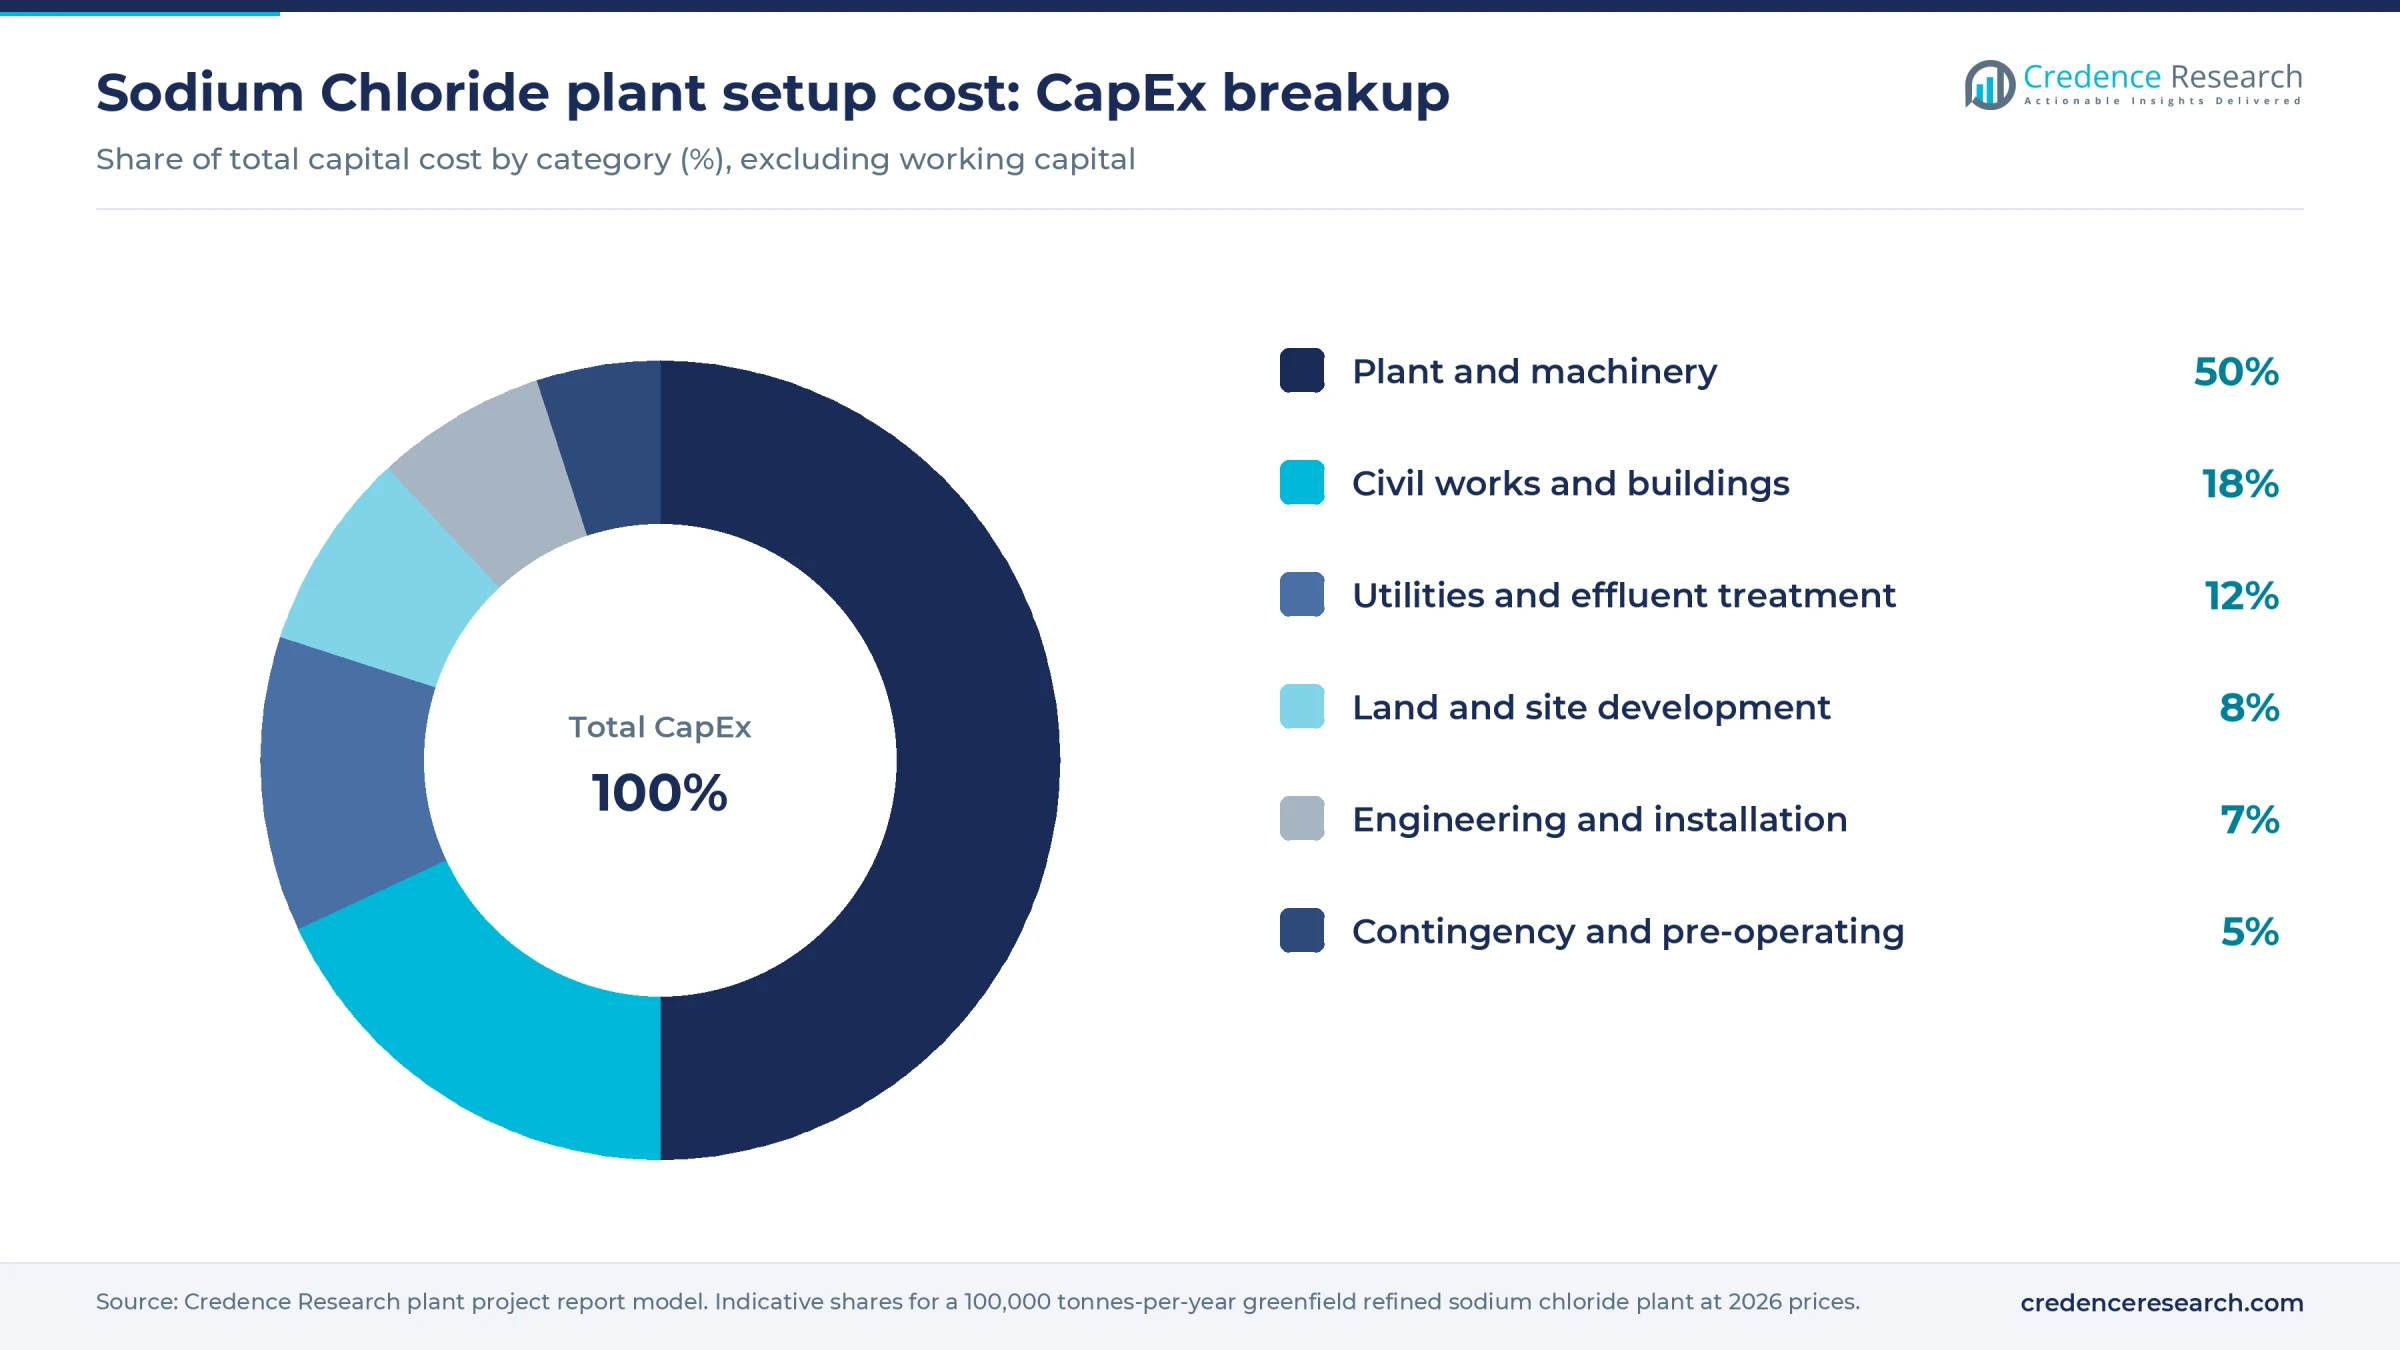
Worked example, land and site development. The plant needs an assumed 40,000–60,000 square meters, with room for a raw salt stockyard and rail or truck access. At an assumed USD 20–60 per square meter in an Asian industrial park, the plot costs about USD 0.8–3.6 million, and at an assumed USD 30–80 at a U.S. or EU site, about USD 1.2–4.8 million. Site works add an assumed USD 0.4–1 million, so this row runs about 5–15% of CapEx.
Working capital is separate. Raw salt stock, finished goods and about two months of receivables tie up an estimated USD 3–4.5 million.
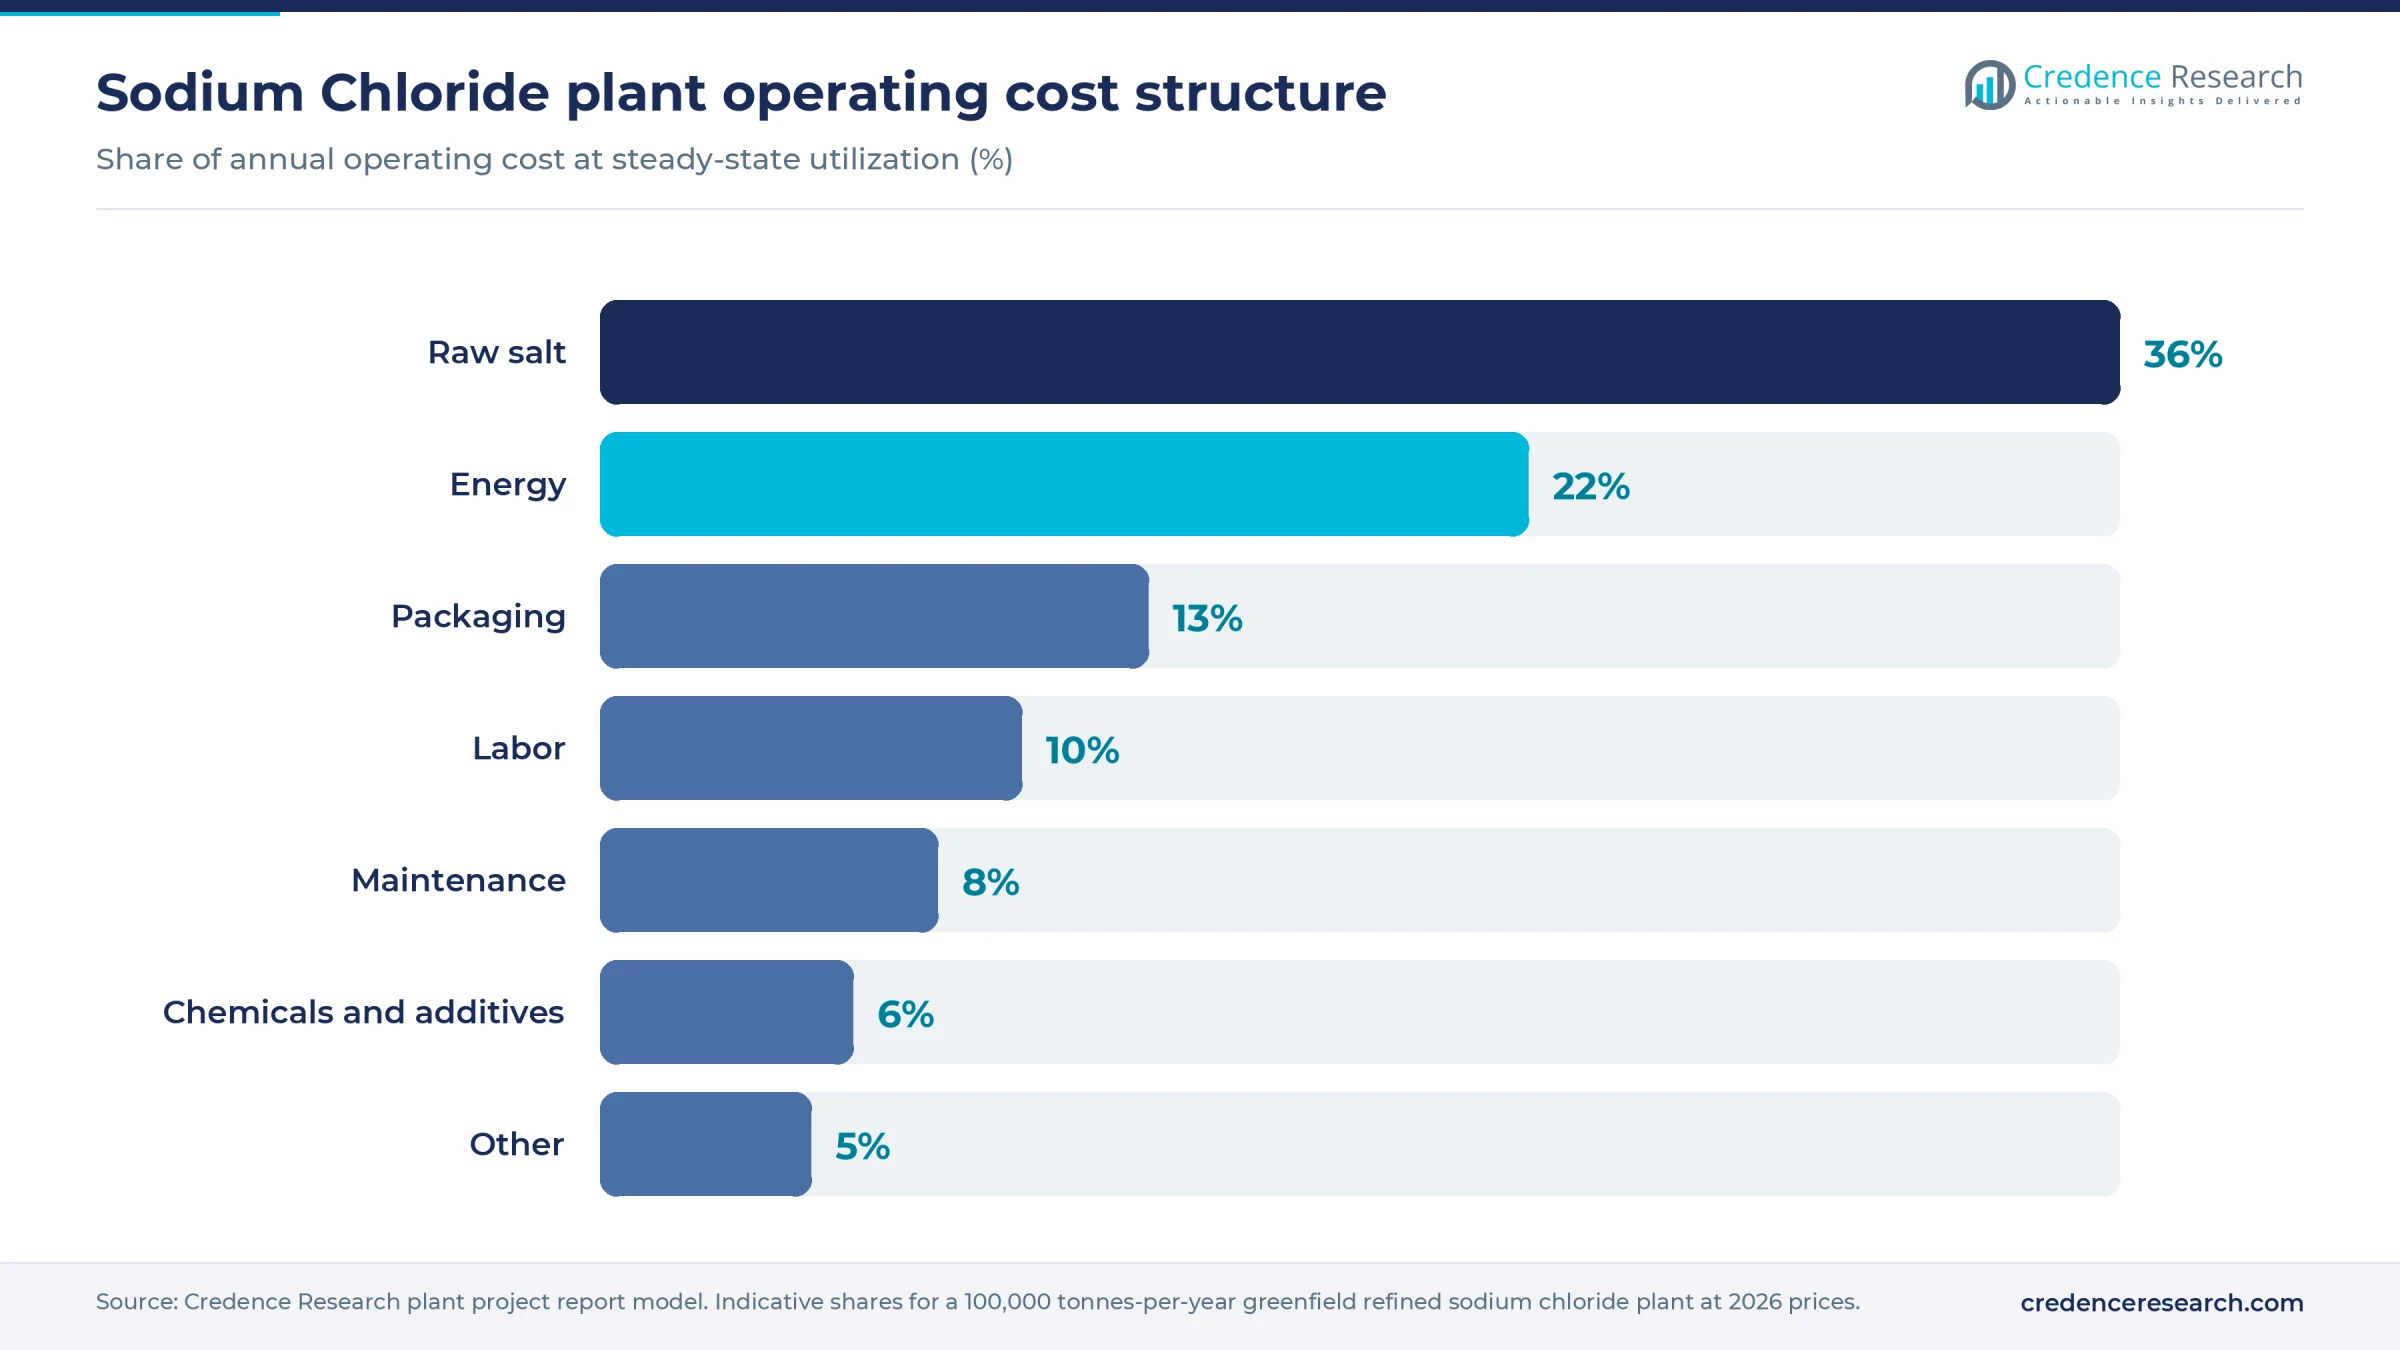
Raw salt and energy together make up more than half of operating cost. Country differences in power price and delivered salt cost move this split sharply. The full report can be customized to any country's costs.
Machinery and raw materials for a sodium chloride plant
Core machinery includes raw salt handling and dissolving tanks, or brine wells and pipelines; reaction and settling vessels with filters; MVR compressors or multi-effect evaporators with forced-circulation crystallizers and heat exchangers; vacuum systems; pusher centrifuges; a fluid bed dryer and cooler; screens; iodine and anticaking dosing; silos; and big bag and retail packing lines. Support systems cover a boiler or substation, cooling water, brine purge treatment and a quality laboratory. Titanium and other corrosion-resistant alloys in heat exchangers cost more up front but protect uptime.
Raw salt is the main input, at an assumed 1.05–1.10 tonnes per tonne of product, along with soda ash, caustic soda or lime for purification. Sourcing follows geography. Solar salt comes from India's Gujarat coast, Australia, Mexico, Chile, Egypt and the Mediterranean, while rock salt and brine are concentrated in the United States, Canada, Germany, the Netherlands, Poland and China. New supply is arriving too: BCI Minerals reported its Mardie solar salt project in Western Australia, designed for about 5.35 million tonnes a year, as 82% built at June 30, 2026, including crystallizer lining.
A site within reach of low-cost brine has the strongest position. A coastal refinery using imported solar salt gains flexibility but takes on ocean freight and handling risk.
Sodium chloride business profit margin and ROI
Refined salt earns a healthy gross margin on a modest revenue base, and that combination sets the return. For the modeled plant, gross margin after raw salt and direct conversion costs is estimated at 25–40%, at an ex-plant price of USD 160–230 per tonne. The top of that price range reflects the U.S. Geological Survey's 2024 unit value, while the low end is assumed for bulk sales in lower-priced markets. Payback runs 6–12 years, including ramp-up.
Revenue of about USD 14–20 million a year on 85,000 tonnes sold is small against USD 24–40 million of capital. A gross margin of USD 3.4–7.8 million must also fund overhead, assumed at USD 1–1.5 million, plus taxes. A high-cost build paired with low bulk pricing would not pay back within 12 years. The Jazan opportunity's promoters cited recovery within four years, which this overview does not adopt because it depends on undisclosed price and cost inputs.
Three levers matter most. Product mix comes first, since food, water softening and pharmaceutical grades outearn bulk chemical salt. Delivered raw salt is next: a USD 10 per tonne rise that cannot be passed on cuts gross margin by about 5–6 percentage points. Energy is third, while freight caps how far a plant can sell.
| Metric | Value |
|---|---|
| Project IRR (post-tax) | Available in report |
| NPV | Available in report |
| Return on investment | Available in report |
| DSCR | Available in report |
| Break-even utilization | Available in report |
How to start a sodium chloride business, licenses and approvals
A refined salt plant needs approvals in seven areas wherever it is built. These are business and tax registration; land use, zoning and building permits; an environmental permit covering brine purge discharge, dryer stack emissions and solid purification sludge; occupational safety and pressure equipment approvals; food facility or medicinal product registration, depending on grade; product standards such as Codex food-grade salt and national iodization rules; and customs registration for export. A plant drawing its own brine or running salt works also needs mining, well or coastal land rights, often the slowest approval of all.
| Market | Product | Environment and site |
|---|---|---|
| United States | FDA food facility registration and 21 CFR Part 117; iodized salt naming and labeling under 21 CFR 100.155; FDA drug rules and USP standards for pharmaceutical grades | NPDES or local pretreatment permit for discharge; state air permit; EPA or state Class III underground injection permit for solution mining; OSHA rules |
| European Union | Food business registration under Regulation (EC) No 852/2004; anticaking additives under Regulation (EC) No 1333/2008; European Pharmacopoeia and medicinal GMP rules for pharmaceutical grades; REACH obligations to be confirmed for industrial grades | National environmental permit, with Industrial Emissions Directive applicability to be confirmed with the regulator; national mining law for brine extraction |
| India | FSSAI license, central at this plant's turnover under thresholds revised in April 2026; sub-regulation 2.3.12 restricts common salt for food use to iodized salt, with labeled exceptions such as industrial use | State pollution control board consents to establish and operate; factory license and boiler registration; Salt Commissioner's Organization for salt land leases |
Large food and pharmaceutical customers commonly add audits, along with certified food safety systems and kosher or halal certification.
Key sodium chloride manufacturers and recent developments
Global supply is led by large, often integrated groups. They include China National Salt in China; Cargill, Compass Minerals and Morton Salt in North America; K+S, Nobian, Groupe Salins and Südwestdeutsche Salzwerke in Europe; and Tata Chemicals and GHCL in India. Consolidation and energy transition, rather than new demand, are shaping recent activity.
- June 2026: K+S agreed to buy Qemetica's salt business, with evaporated salt sites at Stassfurt, Germany, and Janikowo, Poland, for EUR 350 million plus a performance bonus of up to EUR 30 million. Closing is expected in the first quarter of 2027.
- June 2026: Nobian opened an electrified MVR salt plant at Mariager, Denmark, operating since January. It lifts site capacity by about 60%, with potential output of up to 1 million tonnes a year.
- August 2026: GHCL began commercial production of food-grade vacuum salt at Sutrapada, India, with annual capacity of 170,000 tonnes, as reported from its BSE filing.
Together, these moves show established producers buying evaporated capacity and cutting energy exposure. A new entrant must therefore compete on location, grade and customer contracts rather than scale alone.
What's inside the Sodium Chloride project report PDF
The report runs to 21 chapters. Open a chapter to see its sections.
1. Preface
2. Scope and Methodology
- 2.1 Objectives of the Study
- 2.2 Stakeholders
- 2.3 Research Methodology
- 2.4 Data Sources and Key Assumptions
3. Executive Summary
- 3.1 Market Snapshot
- 3.2 Project at a Glance (Capacity, CapEx, OpEx)
- 3.3 Key Financial Indicators (IRR, NPV, Payback, Break-even)
- 3.4 Feasibility Verdict
4. Product Overview
- 4.1 Sodium Chloride Definition and Properties
- 4.2 Grades and Specifications (BIS / ISO / ASTM)
- 4.3 HS Code and Classification
- 4.4 Key Applications
- 4.5 Substitutes
5. Global Sodium Chloride Market
- 5.1 Market Overview
- 5.2 Historical and Current Market Performance (Volume and Value)
- 5.3 Market Breakup by Grade / Type
- 5.4 Market Breakup by End-Use Industry
- 5.5 Market Breakup by Region
- 5.6 Market Drivers, Restraints and Trends
- 5.7 Value Chain Analysis
- 5.8 Market Forecast
6. Target Country Sodium Chloride Market Analysis
- 6.1 Demand and Supply Analysis
- 6.2 Installed Capacity vs Demand Gap
- 6.3 Import Dependence
- 6.4 Demand Forecast by End-Use
7. Trade Analysis
- 7.1 Imports by Volume, Value and Country
- 7.2 Exports by Volume, Value and Country
- 7.3 Trade Balance and Opportunities
8. Price Analysis
- 8.1 Historical Sodium Chloride Price Trends by Region
- 8.2 Raw Material / Feedstock Price Trends and Linkage
- 8.3 Price Forecast
- 8.4 Margins Across the Value Chain
9. Competitive Landscape
- 9.1 Market Structure
- 9.2 Key Players and Installed Capacities
- 9.3 Profiles of Key Players
- 9.4 Recent Developments (Expansions, M&A, New Plants)
10. Manufacturing Process and Technology
- 10.1 Comparison of Technology Routes
- 10.2 Selected Route and Process Flow Diagram
- 10.3 Unit Operations Involved
- 10.4 Chemical Reactions Involved
- 10.5 Mass Balance and Raw Material Requirements
- 10.6 Energy Balance
- 10.7 Quality Assurance Criteria and Technical Tests
- 10.8 By-products and Waste Handling
- 10.9 Technology Licensors / Providers
11. Project Details, Requirements and Costs
- 11.1 Land, Location and Site Development
- 11.1.1 Site Selection Criteria
- 11.1.2 Location Analysis
- 11.1.3 Land Requirement and Costs
- 11.1.4 Site Development Costs
- 11.2 Plant Layout
- 11.2.1 Layout Principles
- 11.2.2 Proposed Layout
- 11.2.3 Factors Influencing Layout
- 11.3 Civil Works and Buildings
- 11.4 Plant Machinery
- 11.4.1 Machinery Requirements and Specifications
- 11.4.2 Machinery Costs
- 11.4.3 Machinery Suppliers
- 11.5 Raw Materials
- 11.5.1 Requirements per Tonne of Output
- 11.5.2 Procurement and Sourcing
- 11.5.3 Costs
- 11.5.4 Suppliers
- 11.6 Packaging
- 11.6.1 Packaging Requirements
- 11.6.2 Packaging Costs
- 11.6.3 Packaging Suppliers
- 11.7 Storage and Material Handling
- 11.8 Transportation Requirements and Costs
- 11.9 Utilities
- 11.9.1 Power Requirements and Costs
- 11.9.2 Water Requirements and Costs
- 11.9.3 Steam, Fuel and Other Utilities
- 11.10 Manpower Requirements and Wages
12. Environment, Health, Safety and Sustainability
- 12.1 Effluent and Emissions Management
- 12.2 Hazard Classification and Safety Measures
- 12.3 Carbon Footprint
- 12.4 Green / Low-Carbon Process Options
13. Regulatory Procedures, Approvals and Certifications
- 13.1 Licences and Registrations
- 13.2 Environmental Clearances
- 13.3 Product Certifications (BIS, REACH, etc.)
- 13.4 Approval Timeline
14. Project Implementation Schedule
15. Project Economics
- 15.1 Capital Cost of the Project
- 15.2 Techno-Economic Parameters
- 15.3 Capacity Utilization and Ramp-up
- 15.4 Product Pricing and Margins
- 15.5 Income Projections
- 15.6 Expenditure Projections
- 15.7 Working Capital Requirement
- 15.8 Taxation
- 15.9 Depreciation
16. Financial Analysis
- 16.1 Projected Profit and Loss Account
- 16.2 Projected Cash Flow Statement
- 16.3 Projected Balance Sheet
- 16.4 Liquidity Analysis
- 16.5 Profitability Analysis (Payback, NPV, IRR, ROI)
- 16.6 Break-even Analysis
- 16.7 Debt Service Coverage Ratio (DSCR)
- 16.8 Sensitivity Analysis
- 16.9 Scenario and Uncertainty Analysis
17. Funding and Incentives
- 17.1 Means of Finance and Debt-Equity Structure
- 17.2 Loans and Financial Assistance
- 17.3 Government Schemes and Subsidies (PLI, State Policies)
18. Risk Assessment
- 18.1 Key Success Factors
- 18.2 Key Risk Factors
- 18.3 Risk Mitigation
19. Strategic Recommendations
20. Case Study of a Successful Venture
21. Appendix
- 21.1 Detailed Assumptions
- 21.2 Abbreviations
- 21.3 List of Tables and Figures
- 21.4 Sources
This page vs. the full report
| Data point | On this page (free) | In the full report |
|---|---|---|
| Total CapEx | One rounded range at one capacity | Exact figure at three capacities with a line-item breakup |
| CapEx breakup | Category shares (%) only | Cost, quantity and supplier for every machine |
| Operating cost | Share of raw materials, utilities and labor | Per-unit cost sheet with each input price and consumption |
| Profitability | Gross margin range and payback band | Exact IRR, NPV, ROI, break-even and DSCR |
| Financial statements | List of what is included | 10-year P&L, cash flow, balance sheet and Excel model |
| Sensitivity | One directional line | Full sensitivity and scenario tables |
| Process | Simplified flow diagram | Detailed process flow, mass and energy balance, operating conditions |
| Machinery | Names of the main machines | Specifications, capacity, cost and supplier list |
| Market | Headline size, growth and India demand trend | Segment, region, trade and price forecast tables |
| Suppliers and buyers | Supplier types and sourcing hubs | Named suppliers and buyers |
Sodium Chloride project report: FAQs
How much does it cost to set up a sodium chloride plant?
What raw material does a sodium chloride plant use?
What is the profit margin in sodium chloride manufacturing?
What is the payback period for a salt refinery?
What is the HS code for sodium chloride?
Is mechanical vapor recompression better than multi-effect evaporation for salt?
Is iodization mandatory for sodium chloride sold as food?

About the analyst
Nisha Gupta, Senior Research Analyst
Nisha Gupta is a Senior Research Analyst at Credence Research Inc. who works across industry domains, including packaging, automotive parts and machinery. Her focus is the modelling engine behind each study: she builds quantitative market databases and econometric forecasting frameworks, and developed automated Excel-based market modelling templates that cut client turnaround time by 30%.
Related market research
- Rock Salt Market Size, Trends, Share, Growth and Forecast 2032
- Iodized Salt Market Size, Growth, Share and Forecast 2032
- Pharmaceutical Grade Sodium Chloride Market Size & Forecast
- Caustic Soda Market Size, Share, Growth and Forecast 2032
- Celtic Salt Market Size, Growth, Trends, Share and Forecast 2032
- Low Sodium Sea Salt Market Size, Share and Growth Report 2032
More plant project reports
- Sodium Chlorate Manufacturing Plant Project Report (DPR) 2026
- Copper Sulphate Manufacturing Plant Project Report (DPR) 2026
- Perfume Manufacturing Plant Project Report (DPR) 2026
- Fruit Juice Processing Plant Project Report (DPR) 2026
- Guar Gum Powder Manufacturing Plant Project Report (DPR) 2026
- Shrimp Processing Plant Project Report (DPR) 2026