
Quick answer
A sodium chlorate plant electrolyzes purified salt brine into the crystalline oxidizer that pulp mills use to generate chlorine dioxide. A greenfield unit of about 50,000 metric tons a year needs an estimated USD 55–95 million of CapEx. Electricity is close to half of operating cost, so gross margin of 22–38% depends on the power contract. Payback is about 7–14 years at mid-range CapEx, faster with an anchor mill.
Viable beside a growing pulp mill with cheap, contracted power, but risky as a merchant plant in regions where mills are closing and supply is long.
Sodium Chlorate plant: key highlights
| Parameter | Indicative value | Note |
|---|---|---|
| Plant capacity | About 50,000 metric tons per year | Crystal basis, electrolytic route, about 34 MW load |
| Total CapEx | USD 55–95 million | Greenfield; low end reflects a chemical island or Asian site, top end a standalone U.S. or EU site |
| Raw material share of operating cost | 8–12% | Salt only; electricity is the main cost at about 42–53% |
| Gross margin | 22–38% | Price minus salt, power and direct conversion cost |
| Payback period | 7–14 years | 90% utilization, mid-range CapEx; about five years at the low end of CapEx and costs |
| IRR | Available in report | Post-tax, 10-year model |
| Break-even | Available in report | Capacity utilization basis |
Ranges assume a 50,000-metric-ton greenfield plant, Asian to U.S. or EU sites, 2026 prices, 90% utilization, ex-works price at an assumed USD 650–720 per ton, power at an assumed USD 0.04–0.05 per kWh and delivered salt at an assumed USD 60–110 per ton. CapEx is scaled from disclosed projects at EUR 1 = USD 1.22 (2004), with assumed 1.8x cost escalation. Customizable to any country.
What is sodium chlorate?
Sodium chlorate (NaClO3) is a white, water-soluble inorganic salt and a strong oxidizer. Producers make it from common salt, water and electricity, and sell it as dry crystal or as a concentrated solution. Nearly all of it is consumed as a feedstock rather than an end product, because pulp mills turn it on site into chlorine dioxide, a gas too unstable to ship.
Grades are simple: crystal for long-distance freight, solution for short hauls by tanker or pipeline, and specialty material for chemical synthesis. Buyers mainly judge purity, moisture, delivery reliability and contract length.
The product falls under Harmonized System subheading 2829.11, chlorates of sodium. For transport it is UN1495, Class 5.1 as a solid, and UN2428 as a solution. Besides bleaching, smaller outlets include herbicides and defoliants, sodium chlorite and other chemical intermediates, ore processing and well drilling. A U.S. EPA supply chain profile puts wood pulp bleaching above 90% of North American use and herbicides at about 2% of U.S. use.
Sodium chlorate market overview and global demand
Credence Research does not publish a separate market value for this product, so physical and trade indicators give the clearest picture. The closest downstream measure is the global chlorine dioxide market, at about USD 1.03 billion in 2025, based on Credence Research's USD 990.91 million for 2024 and a 3.74% CAGR. The wider specialty pulp and paper chemicals market is about USD 24.9 billion in 2025, based on USD 23.95 billion for 2024 and a 3.92% CAGR.
UN Comtrade data for HS 282911 show 2024 exports of about USD 366 million among reporting countries. Canada led with about 331,000 metric tons at roughly USD 0.62 per kg, down from about 382,000 tons in 2023. France shipped about 77,000 tons, China about 62,000 and the United States about 54,000. Because most large mills buy under contract or make the product beside the mill, trade captures only part of world output.
Demand is moving south. EPA data show U.S. consumption near 699,000 tons in 2019, with imports exceeding domestic output and Canada holding about 70% of North American capacity. Since then, the North American base has weakened: in a December 2025 regulatory presentation, Chemtrade said 11 bleached pulp mills had closed since 2023 and described excess chlorate supply. Tree Frog Forestry News reported in May 2026 that Brazil had become a net exporter within two years, as new hardwood pulp capacity brought chemical islands with it.
The buyer base is narrow: kraft pulp producers, followed by chlorite makers and water treatment suppliers. A new plant therefore needs a named customer more than a market forecast.
Sodium chlorate manufacturing process
Commercial output is electrolytic. The net reaction is NaCl + 3H2O → NaClO3 + 3H2, so each metric ton of product theoretically uses about 0.55 ton of salt and yields about 57 kg of hydrogen. Unlike chlor-alkali cells, chlorate cells have no membrane, because chlorine must react with hydroxide in the same liquor.
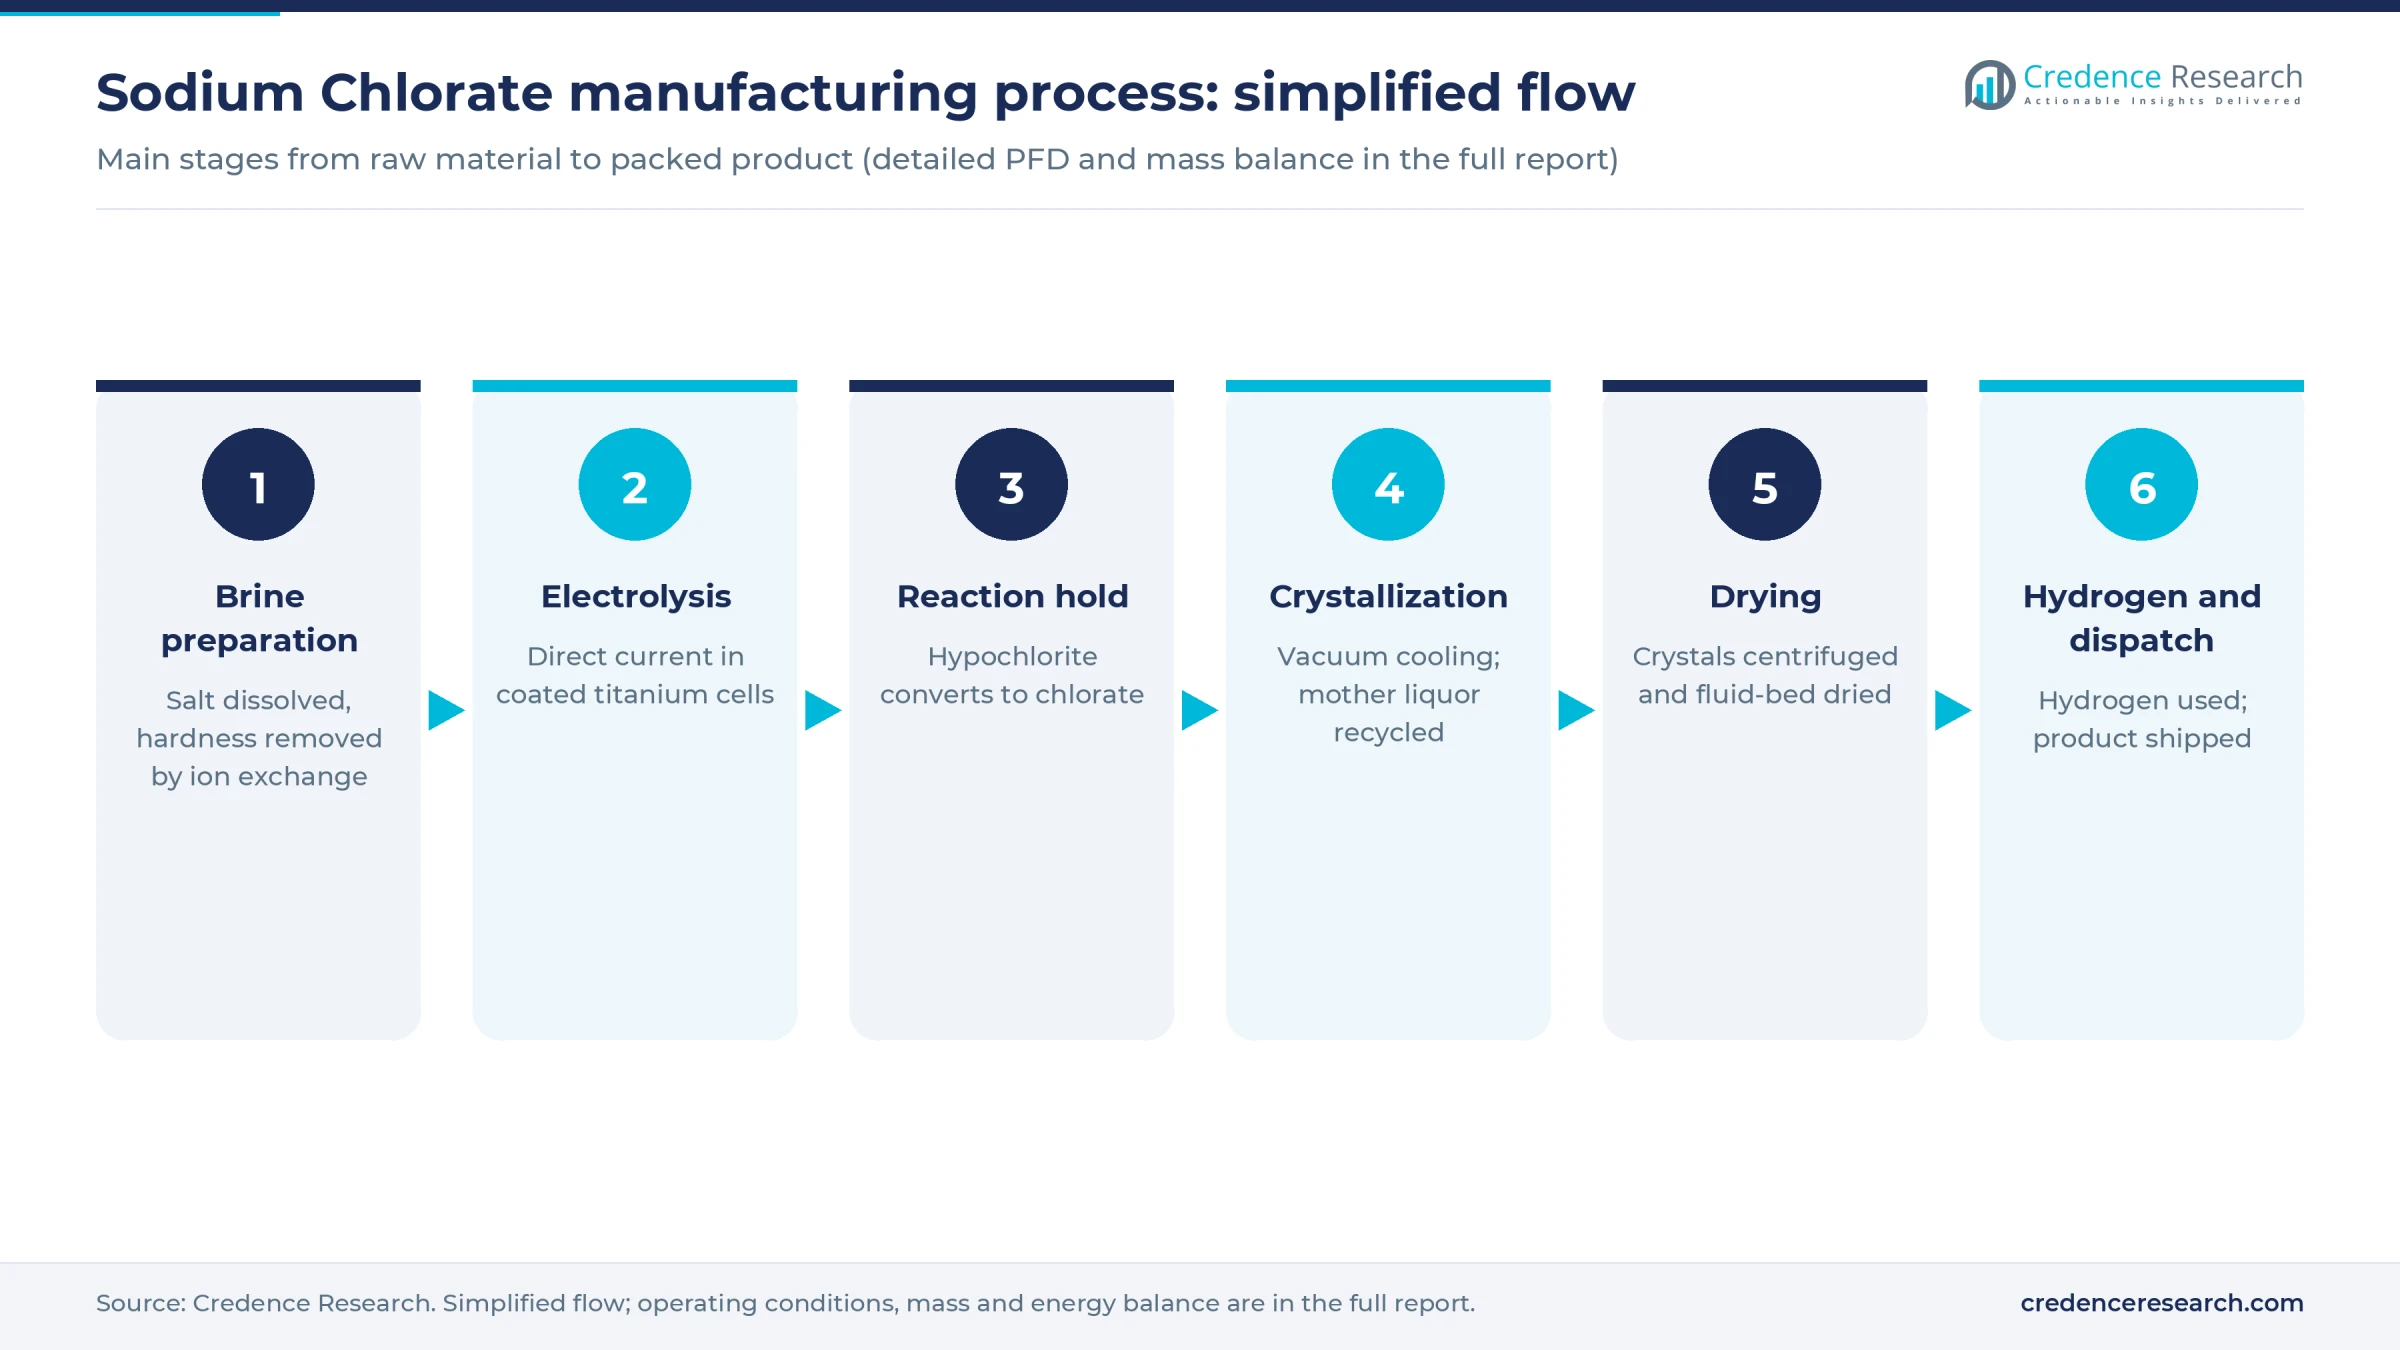
- Brine preparation. Salt dissolves in recycled mother liquor or water. Chemical treatment and ion exchange then remove calcium and magnesium, often to below 50 parts per billion, because hardness fouls cathodes and raises power use.
- Electrolysis. Direct current passes between metal-oxide-coated titanium anodes and steel cathodes at about 60–90 degrees Celsius and a pH near 6. Sodium dichromate at a few grams per liter raises current efficiency, buffers pH and limits oxygen in the hydrogen stream. Industrial current efficiency is about 92–95%.
- Reaction hold. Liquor circulates through reactors, where hypochlorite converts to chlorate until the stream carries about 450–650 grams of chlorate per liter.
- Crystallization. A vacuum crystallizer cools the liquor to about 20 degrees Celsius, and pure crystals drop out. Mother liquor returns to the cells, carrying its salt and dichromate with it. A chilled sidestream can remove sulfate that enters with the salt.
- Separation and drying. Centrifuges wash the crystals, and a fluid-bed dryer finishes them. Mills nearby can instead receive solution, which avoids drying and bagging.
- Hydrogen and dispatch. Hydrogen is scrubbed, then burned for steam, sold or vented. Product moves to silos, railcars, tankers or bags.
A published technical study cites about 5.05 MWh per ton as typical, and worn electrodes push that figure higher, so anode recoating is a core maintenance decision. Dry chlorate mixed with organic matter can ignite, which shapes housekeeping, clothing and storage design throughout the plant.
Sodium chlorate plant setup cost
The reference plant makes about 50,000 metric tons a year, the size of Eka Chemicals' Brazilian unit and ERCO's former Grande Prairie plant. At an assumed 5.4 MWh per ton including auxiliaries and 8,000 operating hours, it draws about 34 MW. Total CapEx is estimated at USD 55–95 million, including land, cell rooms, power supply, crystallization, utilities, preoperative costs and a working capital margin.
Disclosed projects anchor the range, although few publish tonnage. Eka Chemicals budgeted around EUR 50 million in 2004 for a Brazilian chemical island that included a 50,000-ton chlorate plant. ERCO's Chilean plant for CMPC was put in the 65 million dollar range, with the currency unstated in the report, for a mid-2006 start. Scaled by an assumed chlorate share, an assumed 70,000–100,000 tons for the Chilean plant and an assumed 1.8x cost escalation, these point to about USD 55–95 million. Kemira's EUR 50–60 million Joutseno line, which nearly doubled that site's capacity in 2017, supports the same order of magnitude, while brownfield cases such as its USD 20 million Eastover expansion show how much existing infrastructure saves.
For the land row, the plant needs about 40,000 square meters including rail access and safety distances. At an assumed USD 15–60 per square meter, land costs USD 600,000 to USD 2.4 million, about 2% of CapEx at the midpoint. Asian parks sit low; U.S. and EU sites sit high and can exceed the range.
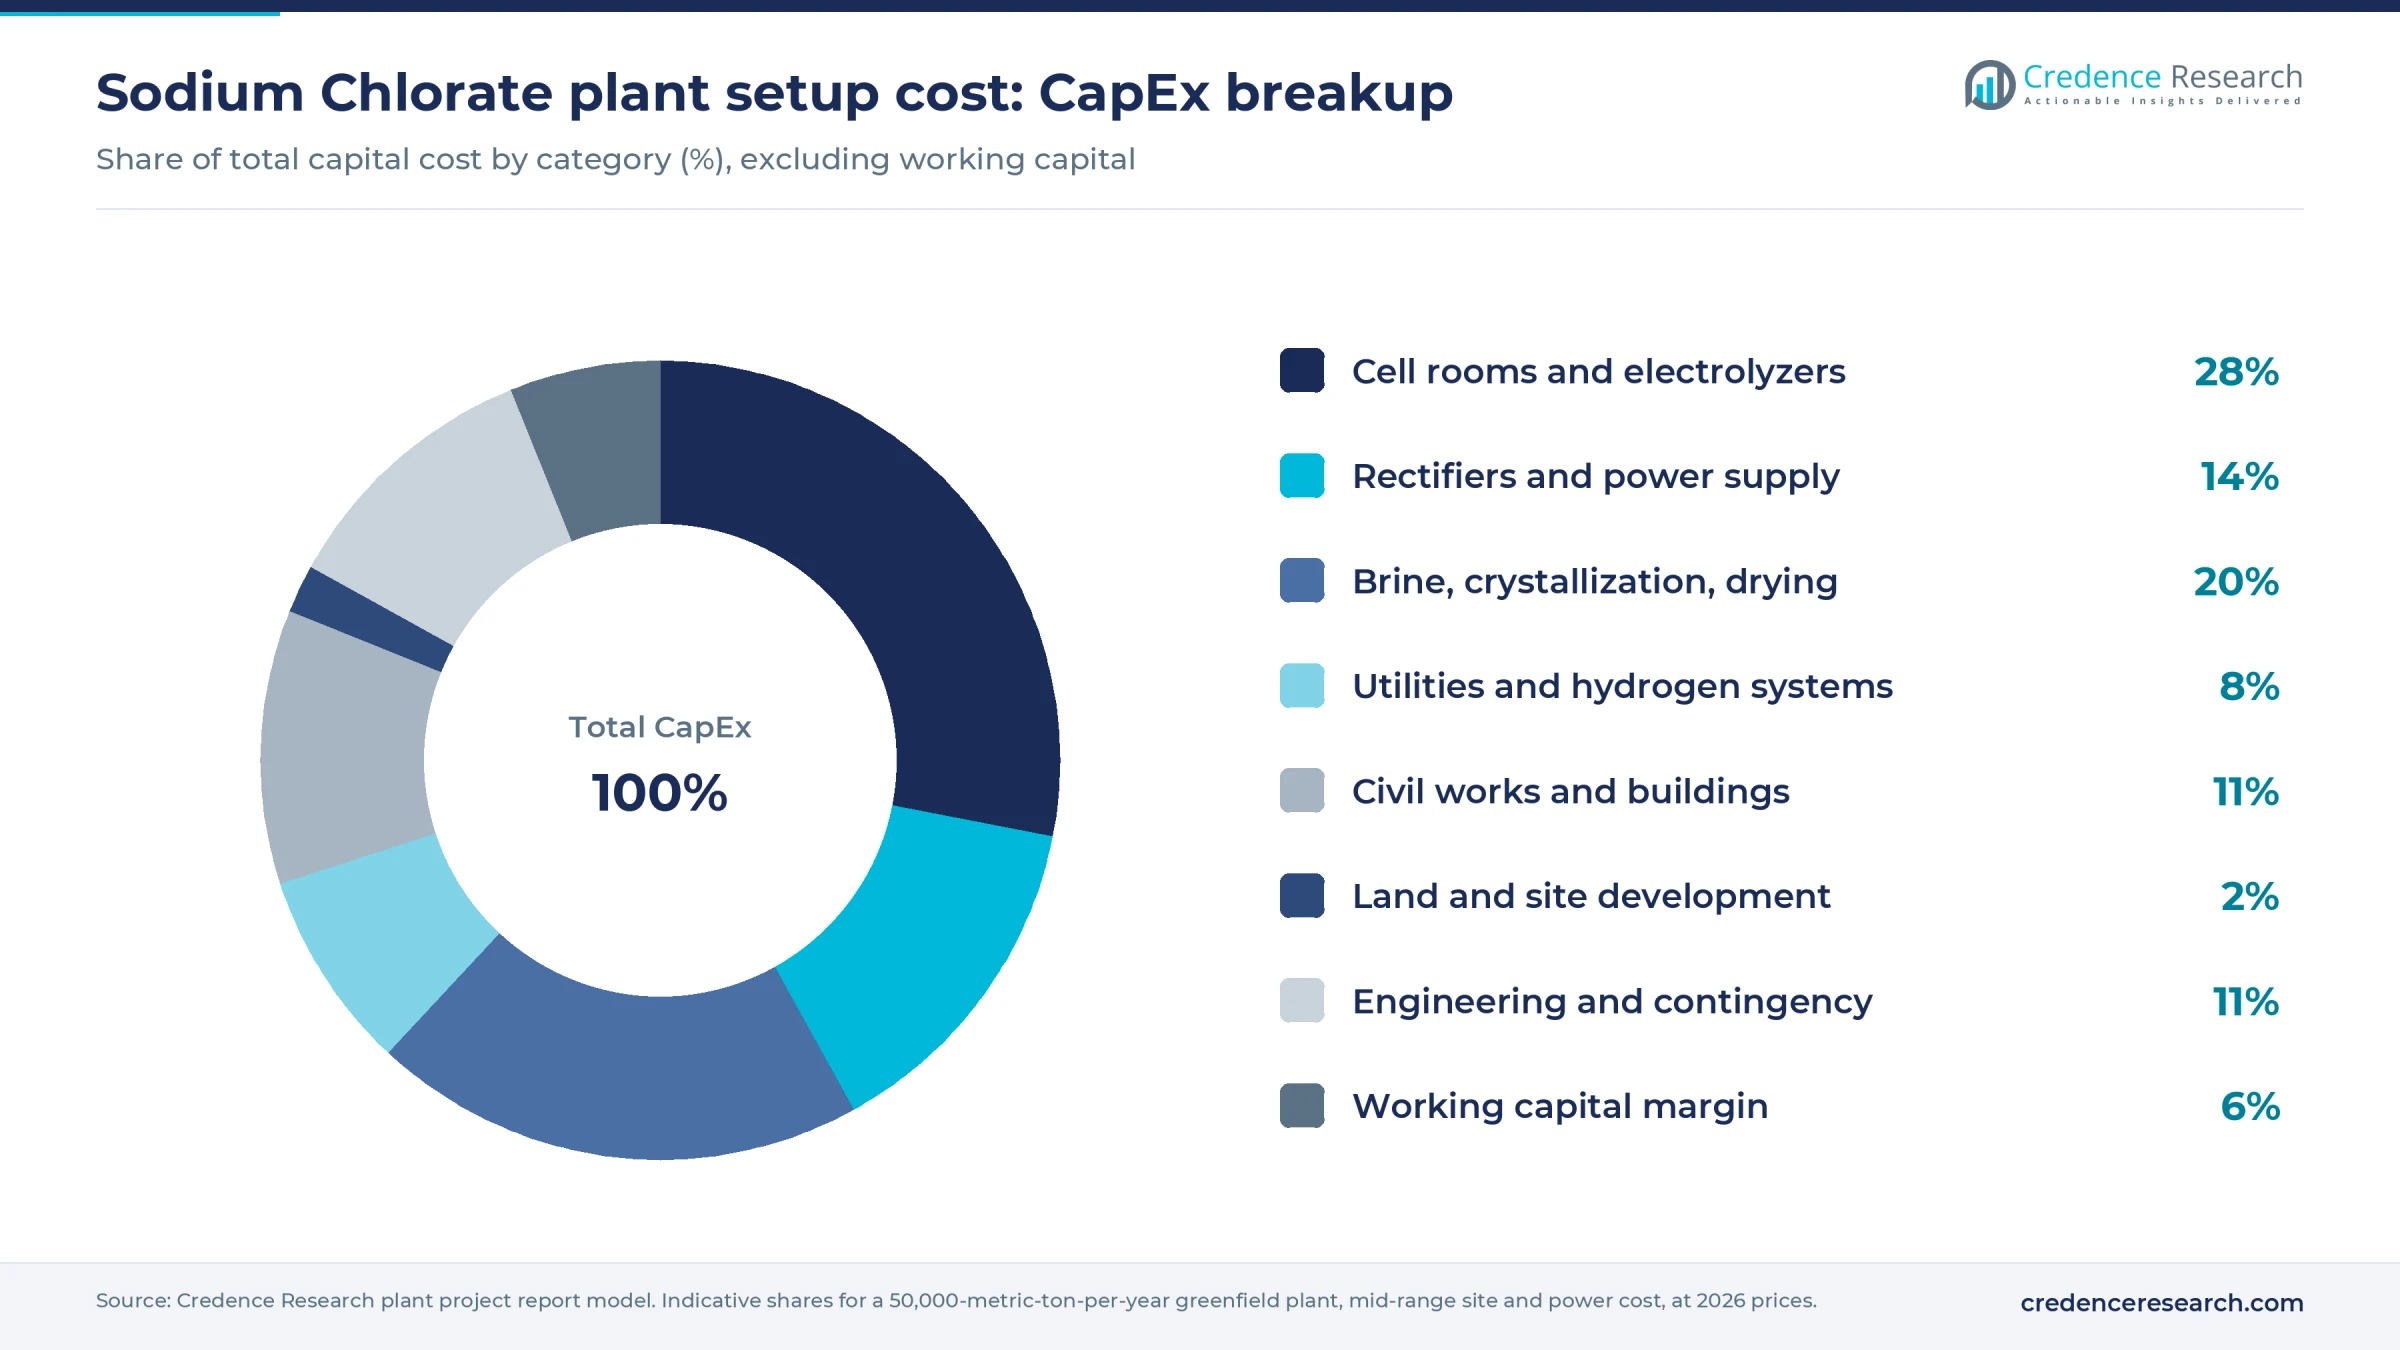
Cell rooms and rectified power supply together take about 42% of CapEx, which explains why the project scales poorly below world-class power prices. Operating cost is dominated by a single purchase.
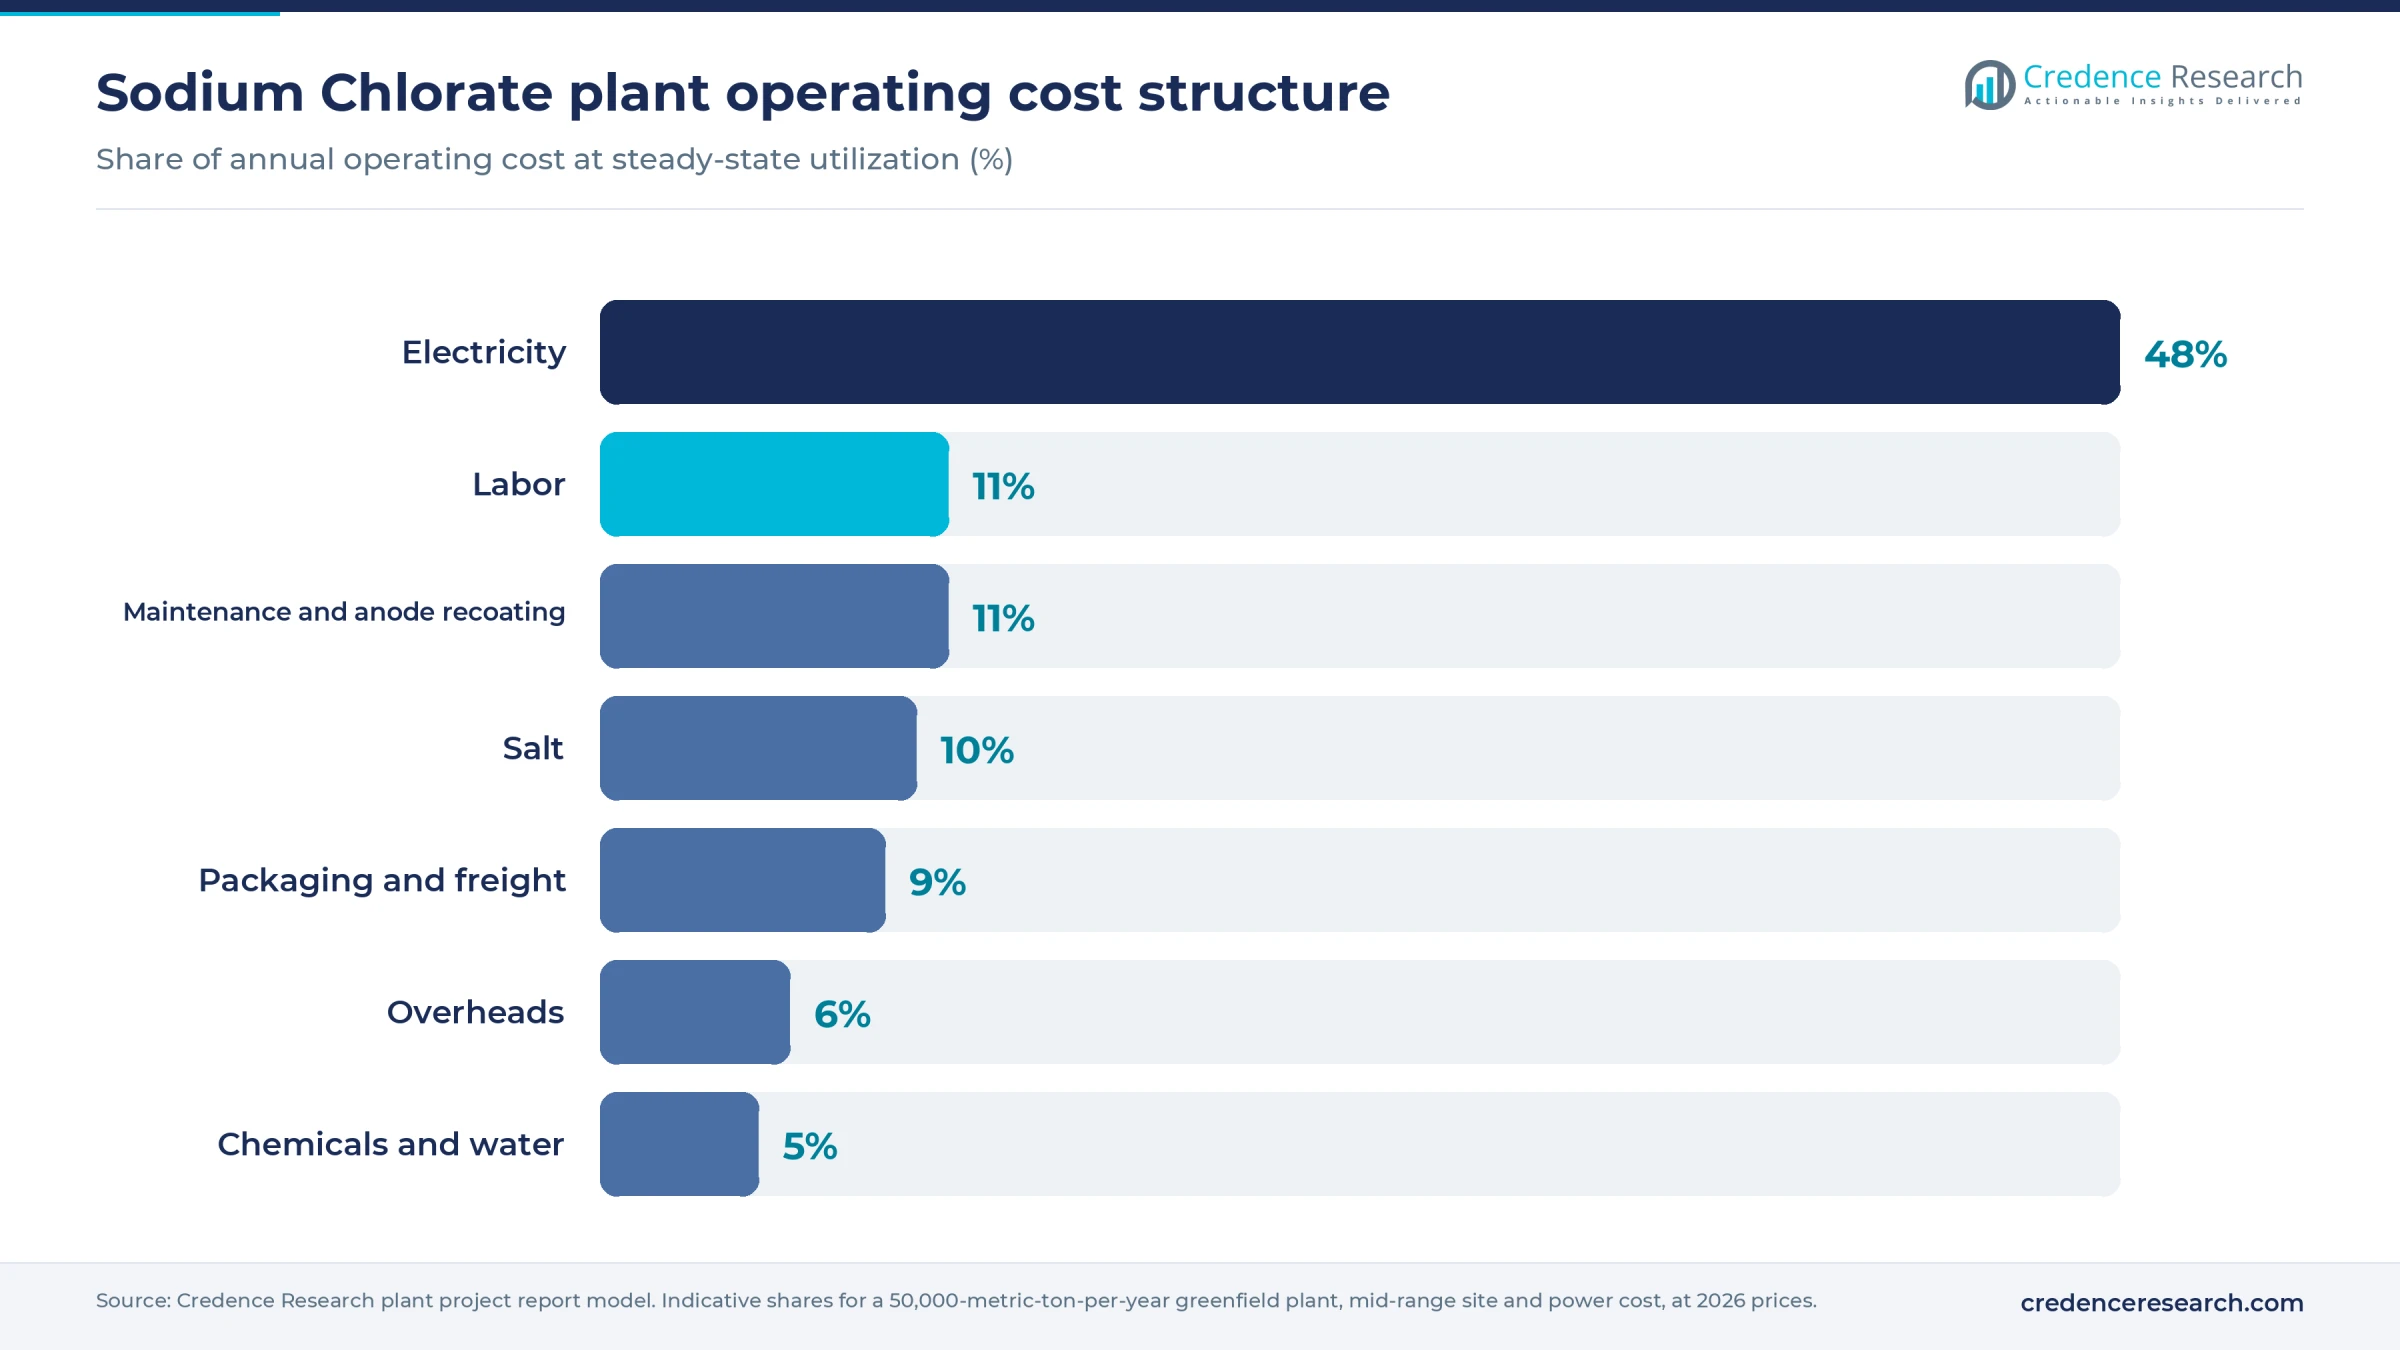
Electricity alone takes close to half of running cost at the central case, and Chemtrade puts it at about 70% of variable cost at its Brandon site. Siting therefore starts with a long-term power tariff, not with land. The full report can be customized to any country or region.
Machinery and raw materials for a sodium chlorate plant
The main equipment groups are listed below; ratings, makes and the full schedule are in the report.
- Salt storage, brine saturators, clarification and ion-exchange purification
- Electrolyzers with coated titanium anodes and steel cathodes, plus reactor vessels
- Transformers, rectifiers and busbars
- Vacuum crystallizers, heat exchangers and chillers
- Centrifuges, fluid-bed dryer, baghouse and scrubbers
- Hydrogen collection, scrubbing and boiler or compression systems
- Silos, solution tanks and rail, tanker and bag loading
- Chromium treatment unit, control system and quality lab
The reference plant needs about 26,000 tons of salt a year at an assumed 0.57 ton per ton of product. Salt is widely traded: Comtrade 2024 data show India and Chile exporting about 20 million and 6 million tons at near USD 0.02 per kg, Canada about 3 million tons at USD 0.04, and Germany, the Netherlands and the United States at USD 0.10–0.13 for higher grades or shorter hauls. Sites near solar salt, rock salt or a brine field gain most, because purification costs rise with low-grade feed.
Power is the true feedstock. Hydroelectric regions such as Canada and the Nordics built the industry, and Brazilian units draw renewable electricity from the mills they serve. About 2,600 tons of by-product hydrogen a year can offset steam or fuel, while sodium dichromate comes from a few chromium chemical producers.
Sodium chlorate business profit margin and ROI
Gross margin is estimated at 22–38%, measured as selling price minus salt, power and direct conversion cost. The build uses an assumed ex-works price of USD 650–720 per ton, set against 2024 Comtrade export unit values of about USD 620 per ton from Canada, USD 640 from France, USD 660 from China and USD 800 from the United States. At an assumed USD 0.04–0.05 per kWh, power alone costs about USD 216–270 per ton.
At 90% utilization, or 45,000 tons, revenue is near USD 31 million and annual cash profit after overheads is about USD 5.2–10.7 million. That puts payback at about 7–14 years on mid-range CapEx of USD 75 million. A low-cost island build with favorable terms can reach about five years, while a merchant plant in a shrinking region can run well past the range.
Each USD 0.01 per kWh shifts cost by about USD 54 per ton, or about USD 2.4 million a year, which is why plants close over tariffs. ERCO shut its 50,000-ton Grande Prairie plant in 2022 citing electricity rates. Selling hydrogen is an upside not counted here, since many sites still lack a buyer; Chemtrade reports about 7,250 tons a year unused at Brandon.
| Metric | Value |
|---|---|
| Gross margin | 22–38% |
| Payback period | 7–14 years |
| IRR (post-tax) | Available in report |
| NPV | Available in report |
| Return on investment | Available in report |
| DSCR | Available in report |
| Break-even utilization | Available in report |
How to start a sodium chlorate business, licenses and approvals
Approval steps follow a common path: company and tax registration, industrial zoning and building permits, an environmental permit covering air, wastewater and chromium-bearing residues, occupational safety and fire clearances for an oxidizer and hydrogen, chemical registration, dangerous goods transport compliance and import registration for equipment. A high-voltage grid connection agreement is often the longest-lead item. Separate pesticide registration applies only if the plant sells herbicide products.
| Market | Key approvals for a sodium chlorate plant |
|---|---|
| United States | State air permit (ERCO's Valdosta, Georgia, plant holds a Title V permit), wastewater discharge permit, OSHA workplace rules, TSCA compliance, DOT hazardous materials rules for UN1495, EPA FIFRA registration for pesticide uses. DHS listed it as a CFATS chemical of interest, but that program's authority lapsed in July 2023 |
| European Union | National integrated environmental permit, REACH registration, CLP labeling, REACH Annex XIV authorization for sodium dichromate use, Seveso III review for oxidizer inventories, and Regulation (EU) 2019/1148, which restricts general-public sales above 40% by weight. Herbicide use is not approved under Decision 2008/865/EC |
| India | Consent to establish and operate from the state pollution control board, factory license from the state factories department, Manufacture, Storage and Import of Hazardous Chemical Rules 1989, where sodium chlorate is listed by name, and hazardous waste authorization for chromium residues |
The EU dichromate rule deserves early attention. Existing authorizations were granted to named companies, with 12-year review periods for several producers, so a new entrant needs its own legal route to use the additive.
Key sodium chlorate manufacturers and recent developments
Nouryon, Kemira, ERCO Worldwide and Chemtrade, whose Brandon, Manitoba, site is the largest in North America at about 320,000 tons, are among the major Western producers. Regional makers include Ercros in Spain and several Chinese exporters, and Gujarat Alkalies owns units in India. Nouryon's model of building beside the customer has reshaped competition, with a site for Arauco due to add almost 10% to its global capacity, as announced in August 2025.
- December 2025: ERCO announced the permanent closure of its Hargrave, Manitoba, chlorate operations after a rectifier transformer failure, citing reinvestment costs and market conditions.
- March 2026: Bondalti's offer for Ercros, whose Sabiñánigo site makes sodium chlorate, valued the company at roughly EUR 329 million and closed with 77.23% acceptance. Shareholders approved delisting in June.
- October 2026: Arauco's 3.5 million-ton pulp mill in Inocência, Brazil, the customer for Nouryon's new unit, reached about 81% completion, with startup expected in the fourth quarter of 2027.
The pattern favors integrated sites at new Latin American mills, while older merchant capacity retreats where mills close or power prices rise.
What's inside the Sodium Chlorate project report PDF
The report runs to 21 chapters. Open a chapter to see its sections.
1. Preface
2. Scope and Methodology
- 2.1 Objectives of the Study
- 2.2 Stakeholders
- 2.3 Research Methodology
- 2.4 Data Sources and Key Assumptions
3. Executive Summary
- 3.1 Market Snapshot
- 3.2 Project at a Glance (Capacity, CapEx, OpEx)
- 3.3 Key Financial Indicators (IRR, NPV, Payback, Break-even)
- 3.4 Feasibility Verdict
4. Product Overview
- 4.1 Sodium Chlorate Definition and Properties
- 4.2 Grades and Specifications (BIS / ISO / ASTM)
- 4.3 HS Code and Classification
- 4.4 Key Applications
- 4.5 Substitutes
5. Global Sodium Chlorate Market
- 5.1 Market Overview
- 5.2 Historical and Current Market Performance (Volume and Value)
- 5.3 Market Breakup by Grade / Type
- 5.4 Market Breakup by End-Use Industry
- 5.5 Market Breakup by Region
- 5.6 Market Drivers, Restraints and Trends
- 5.7 Value Chain Analysis
- 5.8 Market Forecast
6. Target Country Sodium Chlorate Market Analysis
- 6.1 Demand and Supply Analysis
- 6.2 Installed Capacity vs Demand Gap
- 6.3 Import Dependence
- 6.4 Demand Forecast by End-Use
7. Trade Analysis
- 7.1 Imports by Volume, Value and Country
- 7.2 Exports by Volume, Value and Country
- 7.3 Trade Balance and Opportunities
8. Price Analysis
- 8.1 Historical Sodium Chlorate Price Trends by Region
- 8.2 Raw Material / Feedstock Price Trends and Linkage
- 8.3 Price Forecast
- 8.4 Margins Across the Value Chain
9. Competitive Landscape
- 9.1 Market Structure
- 9.2 Key Players and Installed Capacities
- 9.3 Profiles of Key Players
- 9.4 Recent Developments (Expansions, M&A, New Plants)
10. Manufacturing Process and Technology
- 10.1 Comparison of Technology Routes
- 10.2 Selected Route and Process Flow Diagram
- 10.3 Unit Operations Involved
- 10.4 Chemical Reactions Involved
- 10.5 Mass Balance and Raw Material Requirements
- 10.6 Energy Balance
- 10.7 Quality Assurance Criteria and Technical Tests
- 10.8 By-products and Waste Handling
- 10.9 Technology Licensors / Providers
11. Project Details, Requirements and Costs
- 11.1 Land, Location and Site Development
- 11.1.1 Site Selection Criteria
- 11.1.2 Location Analysis
- 11.1.3 Land Requirement and Costs
- 11.1.4 Site Development Costs
- 11.2 Plant Layout
- 11.2.1 Layout Principles
- 11.2.2 Proposed Layout
- 11.2.3 Factors Influencing Layout
- 11.3 Civil Works and Buildings
- 11.4 Plant Machinery
- 11.4.1 Machinery Requirements and Specifications
- 11.4.2 Machinery Costs
- 11.4.3 Machinery Suppliers
- 11.5 Raw Materials
- 11.5.1 Requirements per Tonne of Output
- 11.5.2 Procurement and Sourcing
- 11.5.3 Costs
- 11.5.4 Suppliers
- 11.6 Packaging
- 11.6.1 Packaging Requirements
- 11.6.2 Packaging Costs
- 11.6.3 Packaging Suppliers
- 11.7 Storage and Material Handling
- 11.8 Transportation Requirements and Costs
- 11.9 Utilities
- 11.9.1 Power Requirements and Costs
- 11.9.2 Water Requirements and Costs
- 11.9.3 Steam, Fuel and Other Utilities
- 11.10 Manpower Requirements and Wages
12. Environment, Health, Safety and Sustainability
- 12.1 Effluent and Emissions Management
- 12.2 Hazard Classification and Safety Measures
- 12.3 Carbon Footprint
- 12.4 Green / Low-Carbon Process Options
13. Regulatory Procedures, Approvals and Certifications
- 13.1 Licences and Registrations
- 13.2 Environmental Clearances
- 13.3 Product Certifications (BIS, REACH, etc.)
- 13.4 Approval Timeline
14. Project Implementation Schedule
15. Project Economics
- 15.1 Capital Cost of the Project
- 15.2 Techno-Economic Parameters
- 15.3 Capacity Utilization and Ramp-up
- 15.4 Product Pricing and Margins
- 15.5 Income Projections
- 15.6 Expenditure Projections
- 15.7 Working Capital Requirement
- 15.8 Taxation
- 15.9 Depreciation
16. Financial Analysis
- 16.1 Projected Profit and Loss Account
- 16.2 Projected Cash Flow Statement
- 16.3 Projected Balance Sheet
- 16.4 Liquidity Analysis
- 16.5 Profitability Analysis (Payback, NPV, IRR, ROI)
- 16.6 Break-even Analysis
- 16.7 Debt Service Coverage Ratio (DSCR)
- 16.8 Sensitivity Analysis
- 16.9 Scenario and Uncertainty Analysis
17. Funding and Incentives
- 17.1 Means of Finance and Debt-Equity Structure
- 17.2 Loans and Financial Assistance
- 17.3 Government Schemes and Subsidies (PLI, State Policies)
18. Risk Assessment
- 18.1 Key Success Factors
- 18.2 Key Risk Factors
- 18.3 Risk Mitigation
19. Strategic Recommendations
20. Case Study of a Successful Venture
21. Appendix
- 21.1 Detailed Assumptions
- 21.2 Abbreviations
- 21.3 List of Tables and Figures
- 21.4 Sources
This page vs. the full report
| Data point | On this page (free) | In the full report |
|---|---|---|
| Total CapEx | One rounded range at one capacity | Exact figure at three capacities with a line-item breakup |
| CapEx breakup | Category shares (%) only | Cost, quantity and supplier for every machine |
| Operating cost | Share of raw materials, utilities and labor | Per-unit cost sheet with each input price and consumption |
| Profitability | Gross margin range and payback band | Exact IRR, NPV, ROI, break-even and DSCR |
| Financial statements | List of what is included | 10-year P&L, cash flow, balance sheet and Excel model |
| Sensitivity | One directional line | Full sensitivity and scenario tables |
| Process | Simplified flow diagram | Detailed process flow, mass and energy balance, operating conditions |
| Machinery | Names of the main machines | Specifications, capacity, cost and supplier list |
| Market | Headline size, growth and India demand trend | Segment, region, trade and price forecast tables |
| Suppliers and buyers | Supplier types and sourcing hubs | Named suppliers and buyers |
Sodium Chlorate project report: FAQs
How much does it cost to set up a sodium chlorate plant?
What capacity suits a new sodium chlorate plant?
Why does electricity matter so much in sodium chlorate production?
What is the profit margin in sodium chlorate manufacturing?
What is the payback period for a sodium chlorate plant?
Which approvals does a sodium chlorate plant need?
Who buys sodium chlorate?

About the analyst
Nisha Gupta, Senior Research Analyst
Nisha Gupta is a Senior Research Analyst at Credence Research Inc. who works across industry domains, including packaging, automotive parts and machinery. Her focus is the modelling engine behind each study: she builds quantitative market databases and econometric forecasting frameworks, and developed automated Excel-based market modelling templates that cut client turnaround time by 30%.
Related market research
- Chlorine Dioxide Market Size, Share, Trends and Forecast 2032
- Specialty Pulp and Paper Chemicals Market Size and Forecast 2032
- Hardwood Pulp Market Size, Share, Growth and Forecast 2032
- Dissolving Pulp Market Size, Trends, Share & Forecast 2032
- Industrial Water Treatment Chemicals Market Size, Share and Forecast 2032
More plant project reports
- Sodium Chloride Manufacturing Plant Project Report (DPR) 2026
- Copper Sulphate Manufacturing Plant Project Report (DPR) 2026
- Perfume Manufacturing Plant Project Report (DPR) 2026
- Fruit Juice Processing Plant Project Report (DPR) 2026
- Guar Gum Powder Manufacturing Plant Project Report (DPR) 2026
- Shrimp Processing Plant Project Report (DPR) 2026