
Airports buy security as lanes, gates and linked platforms
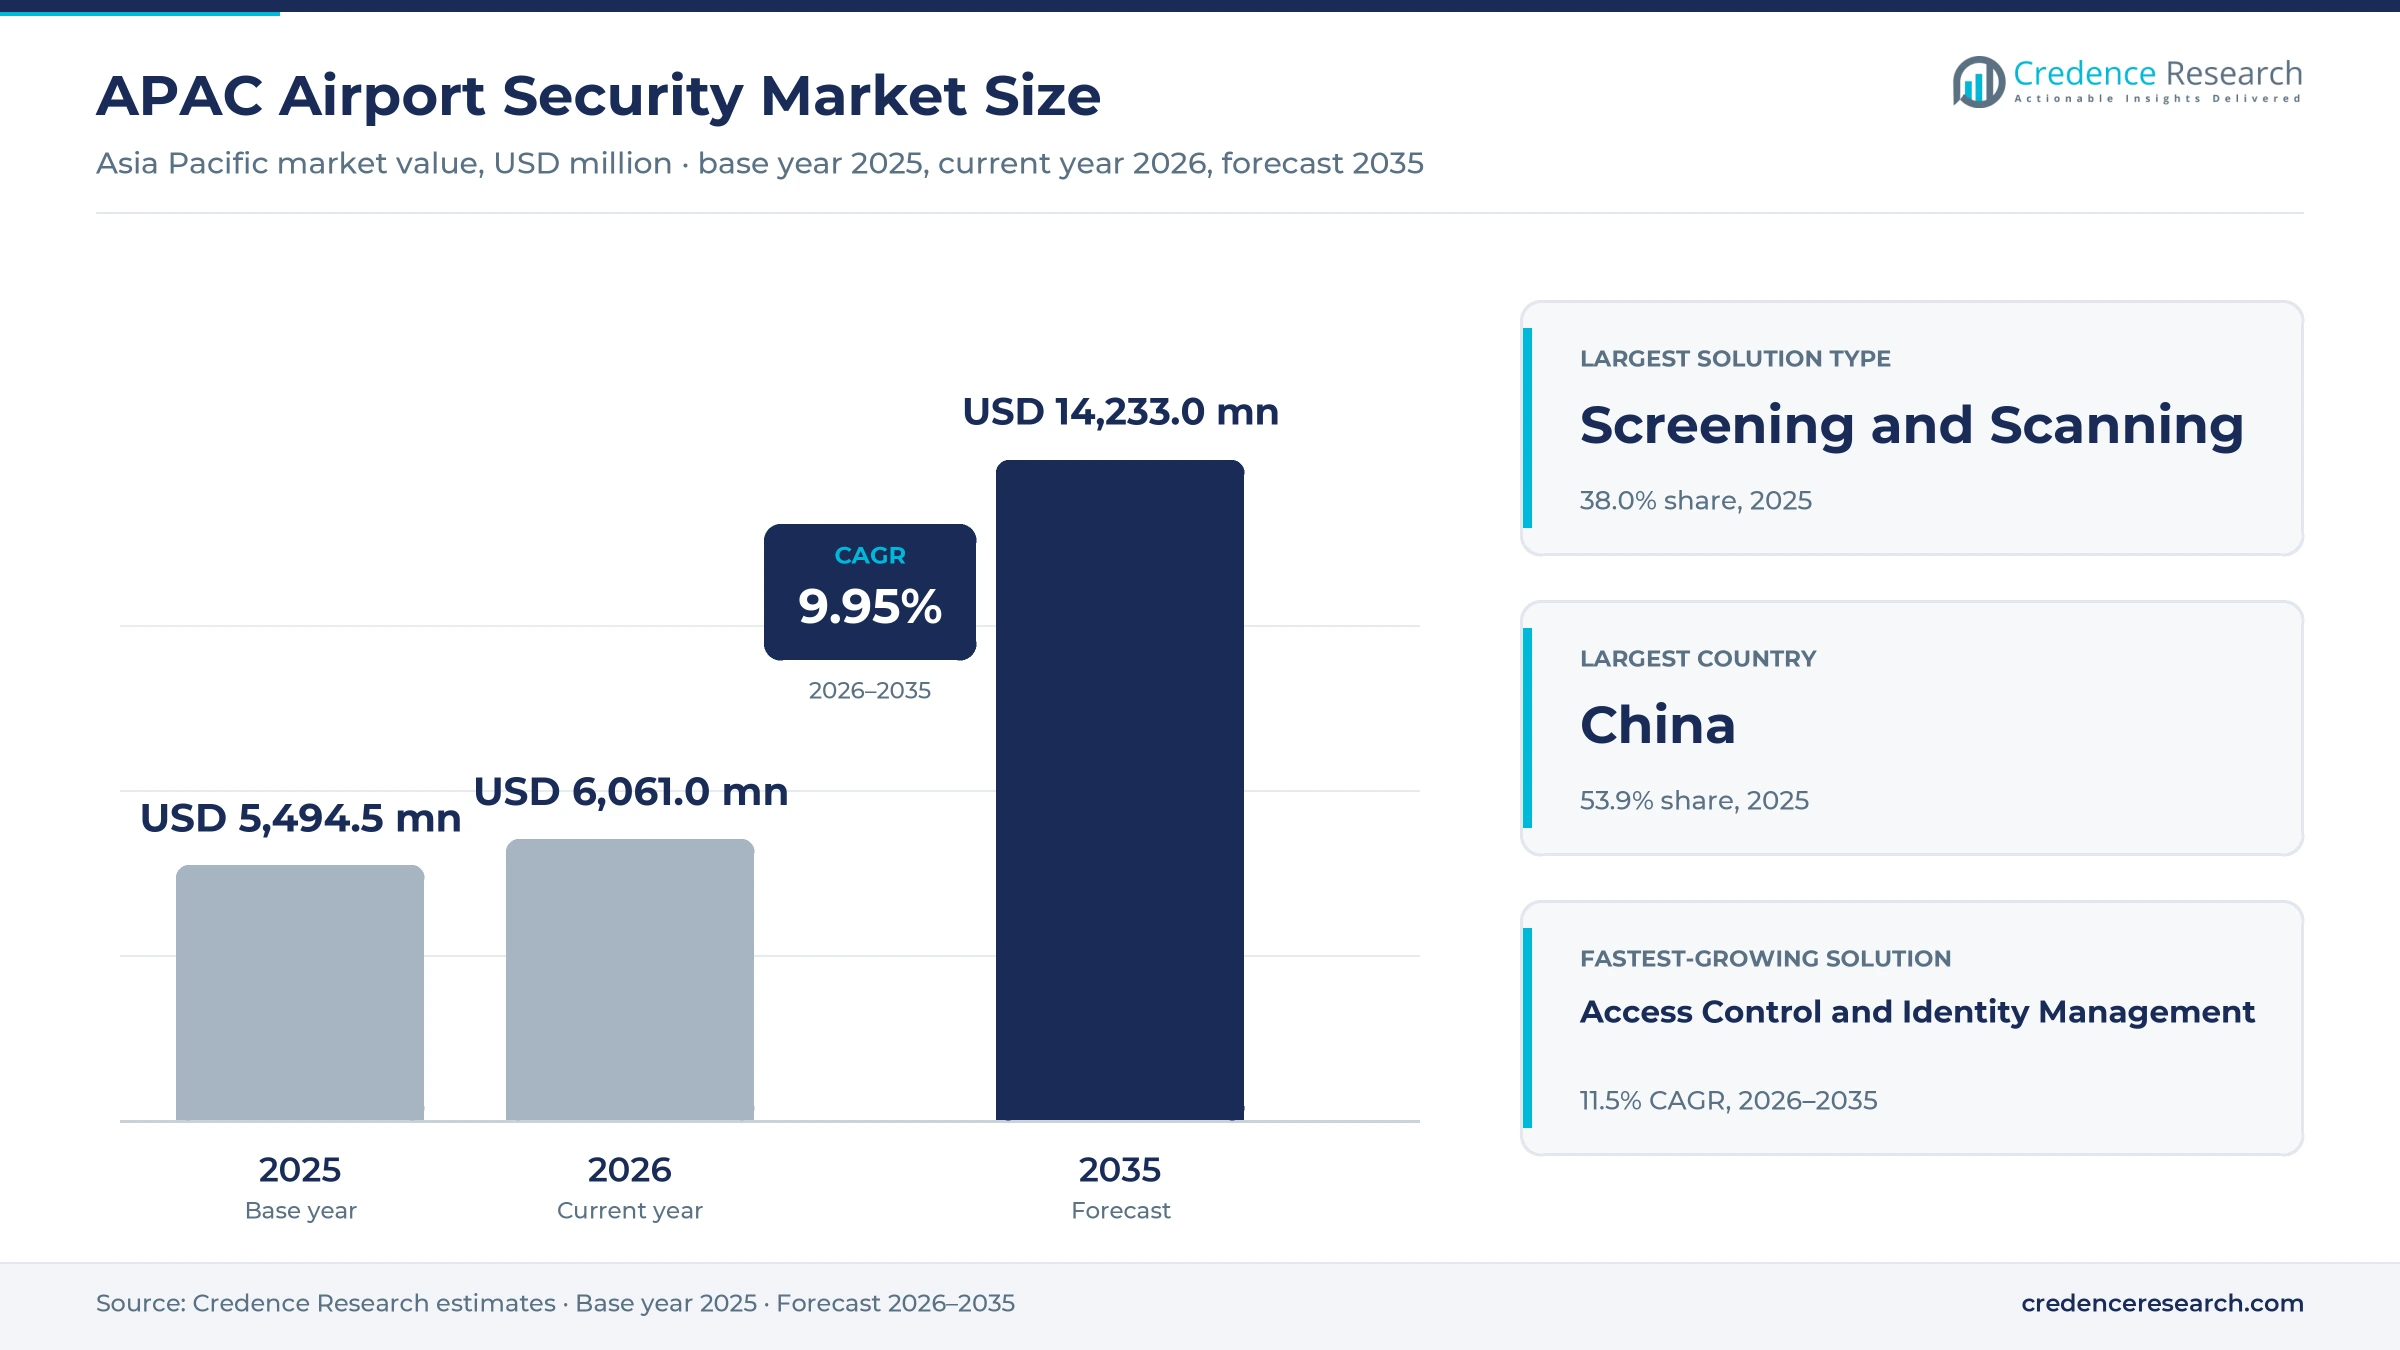
The APAC airport security market was valued at USD 5.49 billion in 2025 and is projected to increase from USD 6.06 billion in 2026 to USD 14.23 billion by 2035, registering a CAGR of 9.95% during 2026–2035. Demand comes from airport operators, national screening agencies and airline tenants that are replacing two-dimensional X-ray lanes, adding biometric gates and wiring video, access and cyber controls into shared operations centers. China held the largest country share, 53.9% in 2025, because its 270 certified airports handled nearly 1.53 billion passenger trips that year. India is the fastest-growing country market at 12.1% a year, as new greenfield airports and regional terminals open with screening and identity systems specified from the first day. A major commercial change is the move to computed tomography checkpoints, which let passengers keep laptops and liquids in their bags. Hong Kong, the Australian capital-city airports and Thailand all began running such lanes between 2024 and 2025, so suppliers now compete on throughput as much as on detection.
Screening, identity, surveillance and cyber spending define the scope
The market counts spending by airports, security agencies and airport tenants on passenger and baggage screening equipment, video surveillance and analytics, access control and identity systems, perimeter intrusion detection and cybersecurity for airport IT and operational networks. Buyers purchase equipment outright, sign multi-year service contracts or pay term subscriptions for software, and most large terminals combine all three models.
The count excludes manned guarding wages, police and immigration staff costs, aircraft cabin security and airline reservation systems that sit outside airport networks. Value moves from equipment makers and software developers through system integrators and maintenance contractors to airport operators, which then run the lanes with screening agencies under national regulator rules.
APAC Airport Security Market Insights
- The market rises from USD 5.49 billion in 2025 to USD 14.23 billion by 2035, a 9.95% CAGR, as new terminals, CT checkpoints and biometric gates enter procurement across the region.
- China held 53.9% of 2025 value because its 41 airports above 10 million passenger trips handled 83.7% of national traffic in 2025.
- Screening and Scanning led with 38.0% of 2025 value, since regulated X-ray, CT and body scanning remains the largest checkpoint expense for airports.
- Australia required CT lanes, body scanners and 3D bag scanners at major city airports by the end of 2025 under a federal mandate worth about AUD 2 billion.
- Digi Yatra has passed 100 million journeys across 38 Indian airports, which shows how quickly facial-recognition boarding scales on a national platform.
Screening hardware leads while identity systems grow fastest
Screening leads while identity management grows fastest
Based on solution type, the market is categorized into screening and scanning, surveillance and video analytics, access control and identity management, perimeter security and cybersecurity and IT security. Screening and Scanning led with 38.0% of 2025 value because every departing passenger and bag must pass regulated X-ray, CT or body-scanning equipment, and the Airports Authority of India tendered 600 hand-baggage scanners for 43 airports in July 2023. Access Control and Identity Management grows fastest at 11.5% a year as Digi Yatra facial-recognition boarding has passed 100 million journeys across 38 Indian airports, according to the Ministry of Civil Aviation. Replacement of X-ray screening equipment still sets the budget calendar at most terminals.
Airport operators lead as airline tenants buy their own lanes
Based on customer type, the market is categorized into airport operating companies, government security authorities and airport tenant enterprises. Airport Operating Companies led with 52.0% of 2025 value because operators fund terminal fit-outs and own most checkpoint assets, as at Navi Mumbai International, where the public-private operator built a first terminal for 20 million passengers a year. Airport Tenant Enterprises grow fastest at 10.9% a year as airlines start paying for their own lanes, and Japan Airlines ordered four CT scanners with automated tray return for its Haneda Terminal 1 premium checkpoints, Smiths Detection said in May 2026. Government agencies remain the main buyers of border biometrics and body scanners.
Mega-hubs lead as regional airports grow fastest
Based on airport size, the market is categorized into mega-hub airports, major airports, regional airports and small airports. Mega-Hub Airports led with 41.0% of 2025 value because traffic is concentrated, and the 41 Chinese airports with more than 10 million passenger trips handled 83.7% of national throughput in 2025, according to the Civil Aviation Administration of China. Regional Airports grow fastest at 11.1% a year as the count of operational Indian airports rose from 74 in 2014 to 165 in July 2026, and each new site needs certified screening before its first flight. Smaller airports buy fewer lanes but often order complete systems at once.
Capital purchases lead while service contracts grow fastest
Based on pricing model, the market is categorized into capital purchase, term subscription and service contract. Capital Purchase led with 58.0% of 2025 value because scanners and gates are owned assets, and the Australian capital-city airports bought CT lanes, body scanners and 3D bag scanners under a federal mandate worth about AUD 2 billion that was due by the end of 2025, according to The Nightly. Service Contract grows fastest at 10.8% a year as airports bundle upkeep with supply, and the Airport Authority Hong Kong awarded Nuctech an HK$6.9 million maintenance term contract for Terminal 1 intrusion detection in February 2026. Subscriptions remain small but are rising with cloud-hosted management software.
| Segment Group | Leading Sub-segment | Share, 2025 | Fastest-growing Sub-segment | CAGR, 2026–2035 |
|---|---|---|---|---|
| By Solution Type | Screening and Scanning | 38.0% | Access Control and Identity Management | 11.5% |
| By Customer Type | Airport Operating Companies | 52.0% | Airport Tenant Enterprises | 10.9% |
| By Airport Size | Mega-Hub Airports | 41.0% | Regional Airports | 11.1% |
| By Pricing Model | Capital Purchase | 58.0% | Service Contract | 10.8% |
Checkpoint prices are set per lane and per scanner
Pricing in the market follows the asset, and most value is still paid up front per lane, per scanner or per gate, with maintenance billed separately. An April 2023 U.S. federal order, the clearest public benchmark, implied about USD 0.73 million for each checkpoint CT unit, many times the roughly INR 4.1 million that the Airports Authority of India budgeted per hand-baggage X-ray scanner. That gap explains why CT spreads first at large hubs, while regional airports keep buying 2D machines. Detection certification, tray-return automation and software licenses move prices most. Suppliers earn steadier margins on maintenance and upgrades, so buyers gain leverage by tendering supply and upkeep together.
| Offer or segment | Typical price or fee | Basis |
|---|---|---|
| Checkpoint CT scanner, U.S. federal benchmark | About USD 0.73 million per unit | Credence Research estimate from a TSA order of USD 42.9 million for 59 units, April 2023 |
| Hand-baggage X-ray scanner, India | About INR 4.1 million per unit | Credence Research estimate from an AAI tender of Rs 246 crore for 600 scanners, July 2023 |
| Terminal intrusion detection supply, Hong Kong | HK$11.3 million | Airport Authority Hong Kong award, February 2026 |
| Terminal intrusion detection maintenance, Hong Kong | HK$6.9 million term contract | Airport Authority Hong Kong award, February 2026 |
Request a Free Sample
Fill in your details and we'll send you a free sample report.
- Sample data tables & charts
- Research methodology
Terminal pipelines and biometric programs drive spending
New terminals and replacement cycles anchor procurement
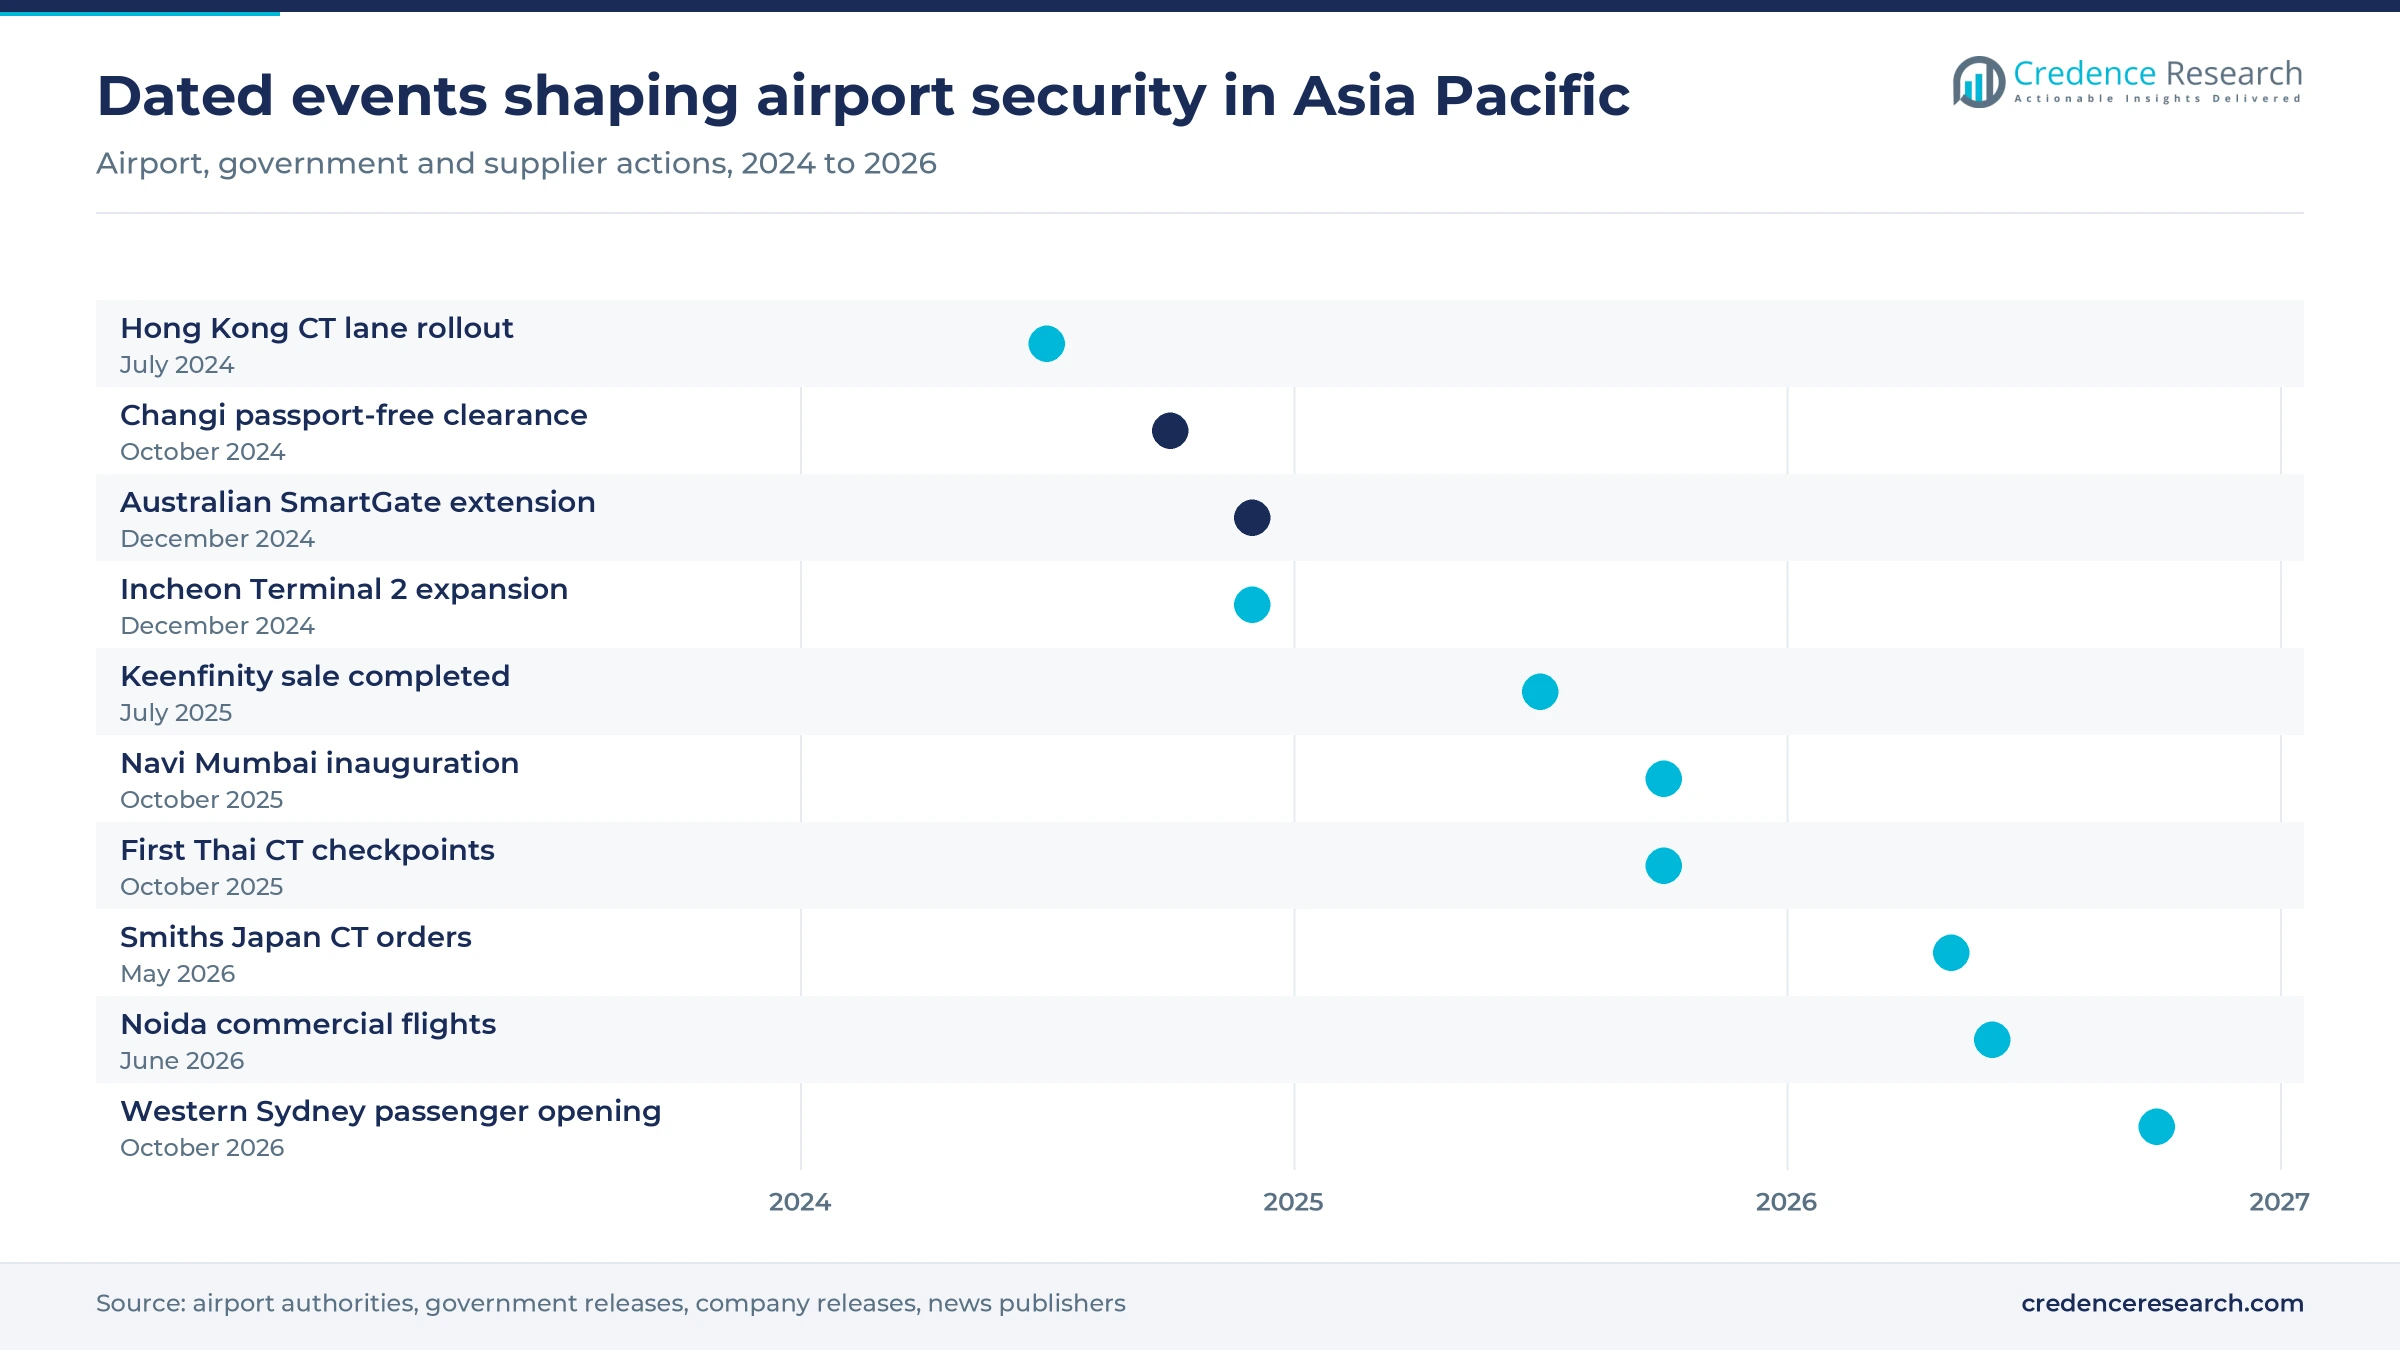
New terminals and scheduled equipment replacement create the steadiest demand, because every gate, baggage hall and perimeter added must be secured before certification. China added 29 transport airports and 49 runways during 2021 to 2025, backed by 630 billion yuan of fixed-asset investment, according to China Daily. India's Navi Mumbai airport was inaugurated in October 2025 on a phase-one budget of Rs 19,646 crore, and Noida International began commercial flights on June 15, 2026. Incheon's fourth-phase expansion lifted capacity to 106 million passengers in December 2024 at a cost above 4.8 trillion won, The Korea Times reported. Each project brings a full package of screening, access, video and perimeter systems, so construction pipelines translate directly into supplier order books.
Biometric processing moves from pilots to national scale
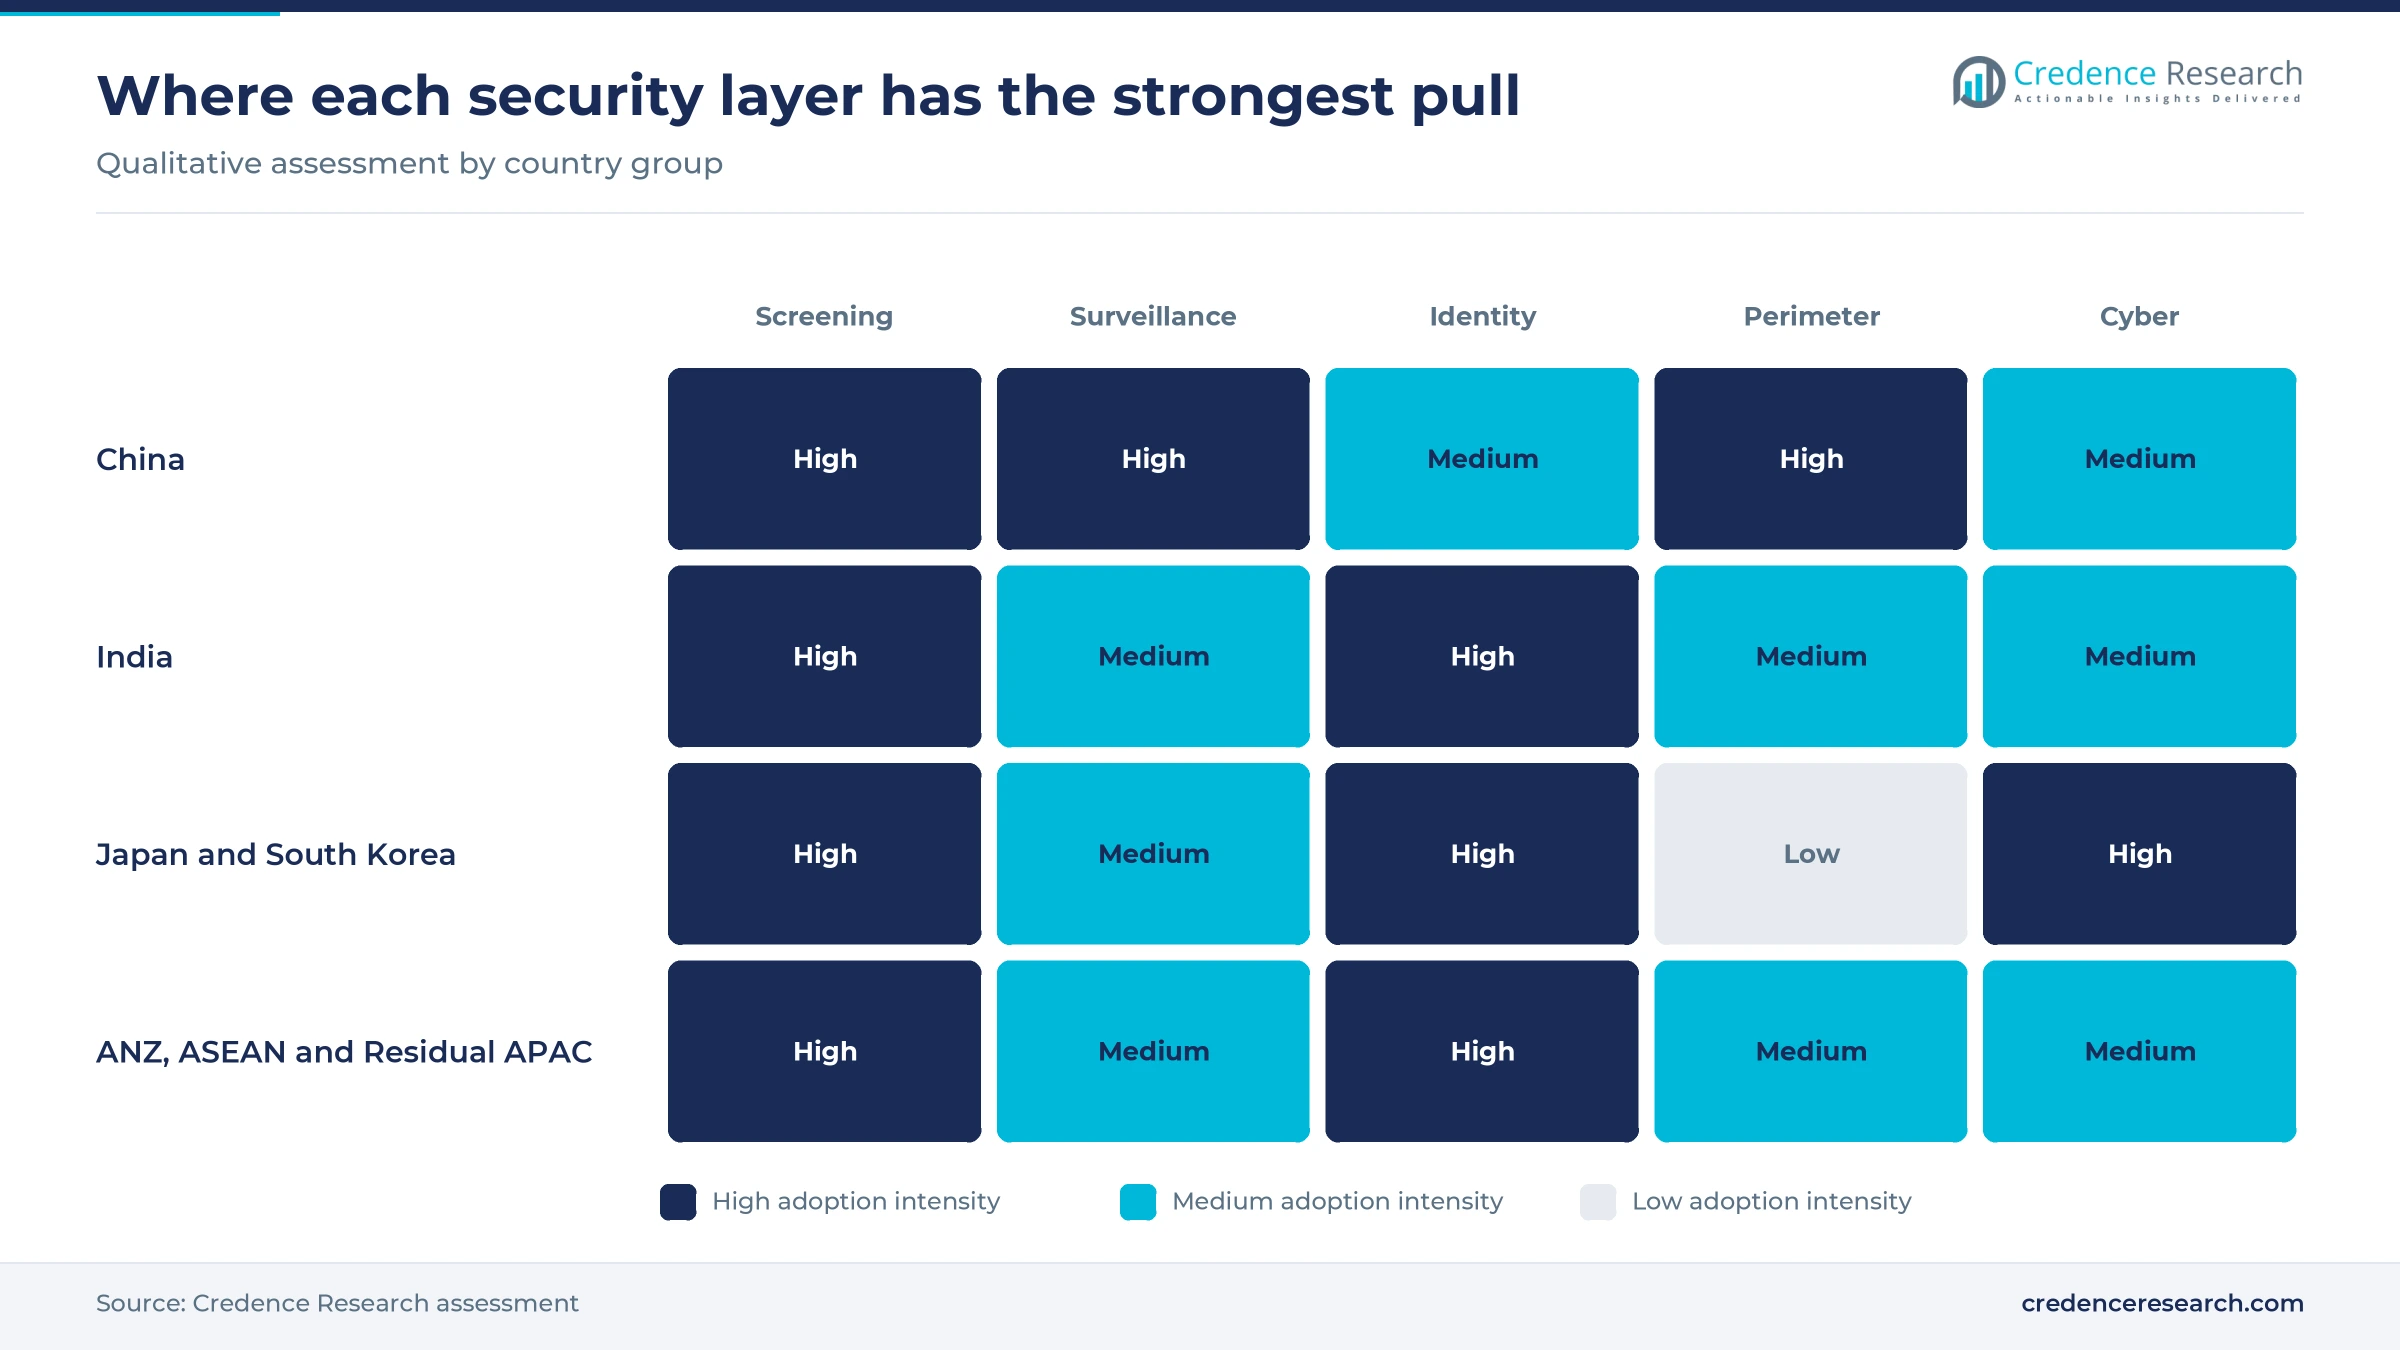
Biometric passenger processing is moving from trials to national systems, and that shift lifts spending on cameras, gates, enrollment software and identity platforms. Singapore made passport-free immigration clearance available at all four Changi terminals by October 2024, with an average clearance time of 10 seconds, according to Biometric Update. Australia's Department of Home Affairs extended Idemia's SmartGate agreement for 10 years in December 2024, and Sydney Airport is adding 40 new SmartGate units under a 2024 deal with the Australian Border Force. Incheon raised its dedicated Smart Pass departure gates to five in May 2026 and plans to extend biometric boarding services to up to half of its operational facilities. The Digi Yatra volumes noted above confirm that passengers adopt such systems quickly.
Connected platforms replace stand-alone security systems
Airports are replacing stand-alone cameras, door controllers and screening machines with connected platforms, because shared data reduces staffing needs and speeds incident response. ST Engineering deployed its AGIL Secure platform at Indonesia's Dhoho Kediri International Airport in January 2024, linking identity management, access control, video analytics and intrusion detection under one operator interface. Melbourne Airport opened 4 new domestic lanes that pair Smiths Detection CT scanners and automated tray return with the Checkpoint.Evoplus screening management platform, according to Security World Market. Triton completed its purchase of the Bosch video, access and intrusion business on July 1, 2025, creating Keenfinity Group with about 4,300 employees. These moves push buyers toward multi-year integration contracts, which favor vendors with open software and local engineering teams.
Regulator-set standards force checkpoint upgrades
Regulators are setting new screening and access standards, and compliance dates force airports to replace equipment even when older lanes still work. The Australian federal mandate noted above required CT lanes, body scanners and 3D bag scanners at major city airports by the end of 2025. After its upgrade, Sydney Airport reported that 99.1% of international passengers and 99.9% of domestic passengers cleared security in under 10 minutes, The Nightly reported in October 2025. India's Bureau of Civil Aviation Security moved aerodrome entry permits to a digital workflow with facial biometric verification across 169 airports, according to News On AIR. Each new rule converts into a dated purchase cycle for screening and identity vendors, which makes regulator calendars a better demand signal than traffic alone.
CT checkpoints and cyber resilience reshape purchases
Shift to CT checkpoints that keep laptops in bags
Checkpoints are shifting from 2D X-ray to computed tomography, which lets passengers leave laptops and liquids in their bags and raises lane throughput. The Airport Authority Hong Kong began a phased rollout of 50 CT-based smart screening channels and 32 full-body scanners in July 2024, expecting average throughput to rise about 20%. Beijing Daxing's Easy Security Check lanes, which use CT scanners and millimeter-wave gates, served more than 1.4 million passengers between October 2024 and September 2026 and save about three minutes per passenger. Smiths Detection delivered the first three CT checkpoint scanners in Thailand to Airports of Thailand in October 2025. Vendors that pair CT units with automated tray return now win tenders on passengers per hour, not only on detection rates.
Cyber resilience rises up airport security budgets
Cyber resilience is rising up airport security budgets, because check-in, baggage and access systems now share networks with operational technology. A data attack on Japan Airlines in December 2024 halted ticket sales for same-day flights and delayed 24 domestic departures by more than 30 minutes, the South China Morning Post reported. Airport and Aviation Services Sri Lanka exposed more than 7,000 records in a 2024 breach, a case the Airports Authority of India cited at an ICAO Asia Pacific cybersecurity seminar in 2025. The same presentation cited a 131% rise in aviation cyberattacks between 2022 and 2023. The presentation recommended cyber security operations centers and real-time threat monitoring for the aviation sector, a spending line that lifts the cybersecurity and IT security segment faster than physical systems.
Opportunity in screening fit-outs for regional airports
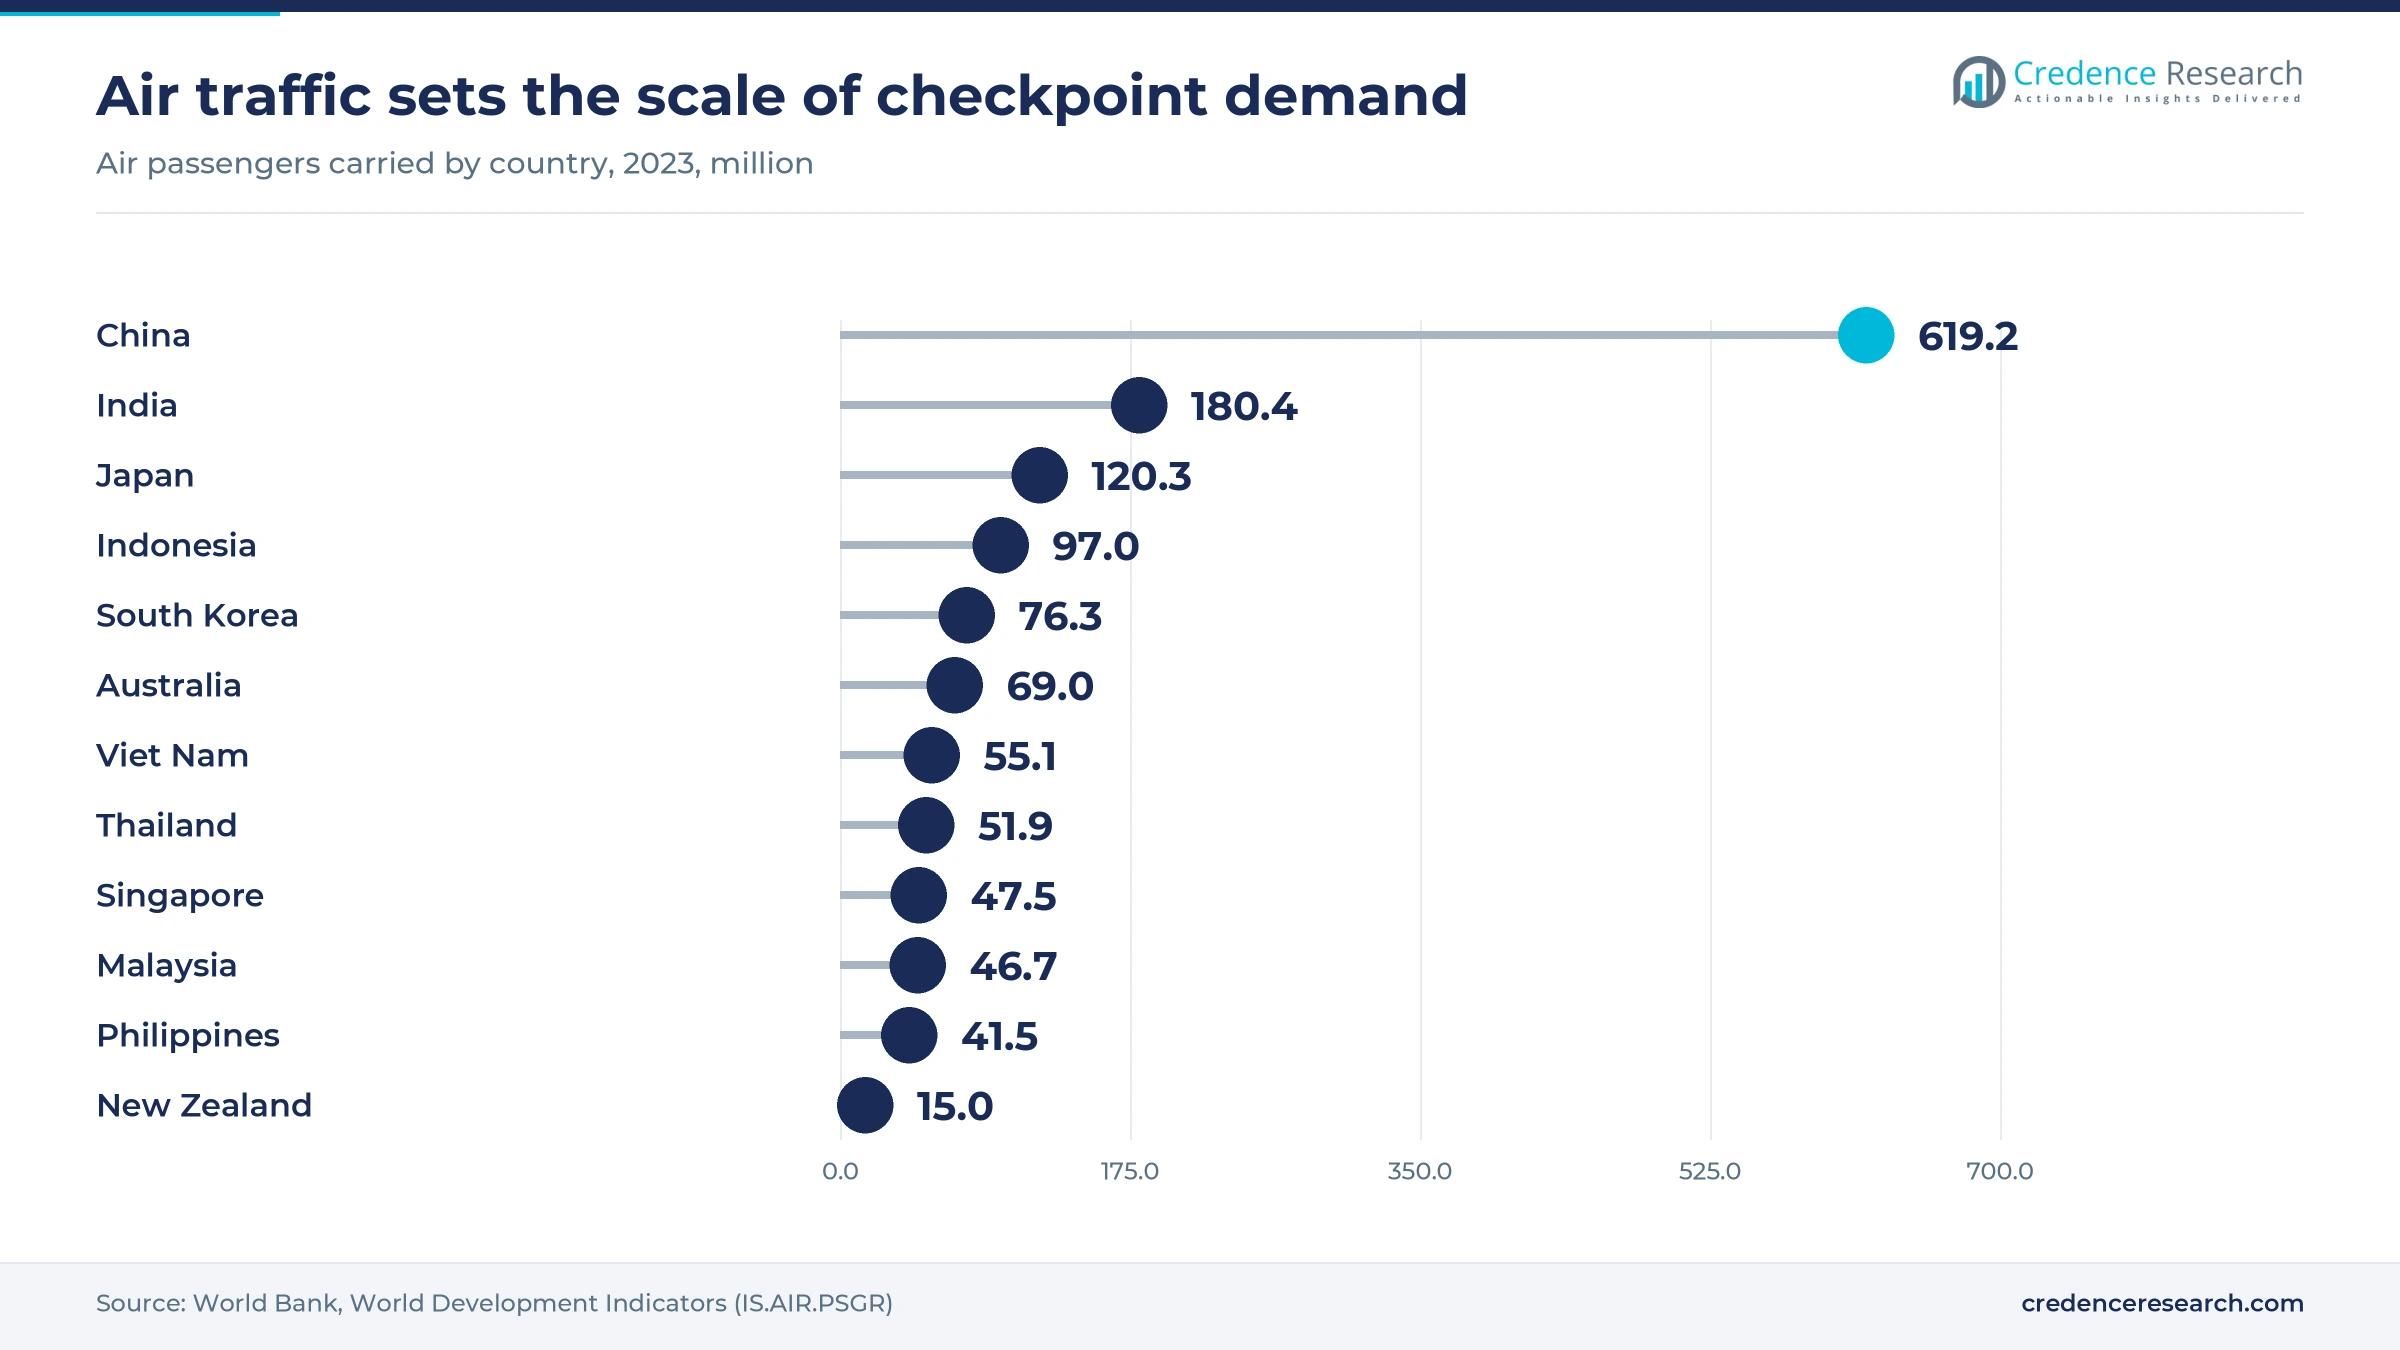
Regional and small airports offer an opening because many still run older 2D equipment, while traffic growth is fastest outside the main hubs. The Indian airport network has more than doubled since 2014, as noted above, and the Ministry of Civil Aviation plans to enable Digi Yatra at 27 more airports by 2027. Japan is moving CT beyond Tokyo, with Smiths Detection scanners installed at Ishigaki in March 2026 and due at Okadama by March 2027. World Bank data show that Indonesia carried 97 million air passengers and Viet Nam 55.1 million in 2023, much of it through island and secondary-city airports. Vendors with compact CT units, financing options and remote maintenance are best placed to win these smaller and more numerous tenders.
Opportunity in tenant-funded lanes and managed services
Tenant-funded lanes and managed services open a second revenue stream, because airlines want faster processing for their own passengers and airports want predictable operating costs. The Japan Airlines purchase of CT lanes for its Haneda premium checkpoints, noted above, shows carriers paying directly for screening. In Korea, where Smart Pass launched at Incheon in July 2023, five airlines, Korean Air, Asiana Airlines, Jeju Air, T'way Air and Air Premia, now register passengers automatically, while five banks enroll users through their mobile apps. Western Sydney International Airport was scheduled to open to passengers on Oct. 25, 2026 with capacity for 10 million a year, giving a greenfield operator the chance to buy security as a service from the start. Suppliers that can bill per passenger or per lane-hour can turn these accounts into long contracts.
Algorithm tuning, retrofit cost and shared software risk
Imported algorithms slow the Indian body scanner rollout
Imported detection algorithms are slowing body scanner deployment in India, because alarm rates rise when software meets unfamiliar clothing and ornaments. Bureau of Civil Aviation Security Director General Rajesh Nirwan said in October 2026 that current algorithms were designed for foreign markets and must be adjusted, The Daily Pioneer reported. Only three of eight planned airports had received machines by then. Vendors must fund local data collection and retuning, and early joint trials with the bureau are the main way to shorten approval.
Capacity gains need costly lane and hall redesign
CT lanes deliver their full gains only when screening halls are rebuilt around longer conveyors, which adds construction cost and disruption. Sydney Airport cut its international screening lanes from 17 to 15 and fitted 21-meter conveyor belts to lift capacity by nearly 30%, The Nightly reported in October 2025. Adelaide still asked international travelers to remove laptops and liquids at that time. Older terminals with tight floor plates face the highest retrofit bills, so suppliers offering compact lanes gain an edge.
Shared passenger-processing software spreads cyber risk
Shared passenger-processing software spreads cyber risk across every airport that buys the same system. In September 2025, an attack on the Collins Aerospace MUSE check-in software disrupted Heathrow, Berlin and Brussels, where airlines were asked to cancel half of departing flights. The Indian electronics ministry said the same software runs at Delhi airport, though operations there were not affected, News On AIR reported. Asian operators therefore face supplier risk outside their own networks and are likely to demand contract terms on patching and fallback procedures.
Hoax threats tie up screening staff and lanes
Hoax bomb threats consume screening capacity, because each call triggers assessment, extra searches and departure delays. More than 350 hoax threats against Indian airlines and airports were reported by October 2024, prompting the Bureau of Civil Aviation Security to revise its Bomb Threat Contingency Plan, The Free Press Journal reported. The revised plan requires assessment committees, intensified checks and closer police coordination at major airports. These incidents raise overtime and lane downtime, which strengthens the case for analytics that triage threats faster.
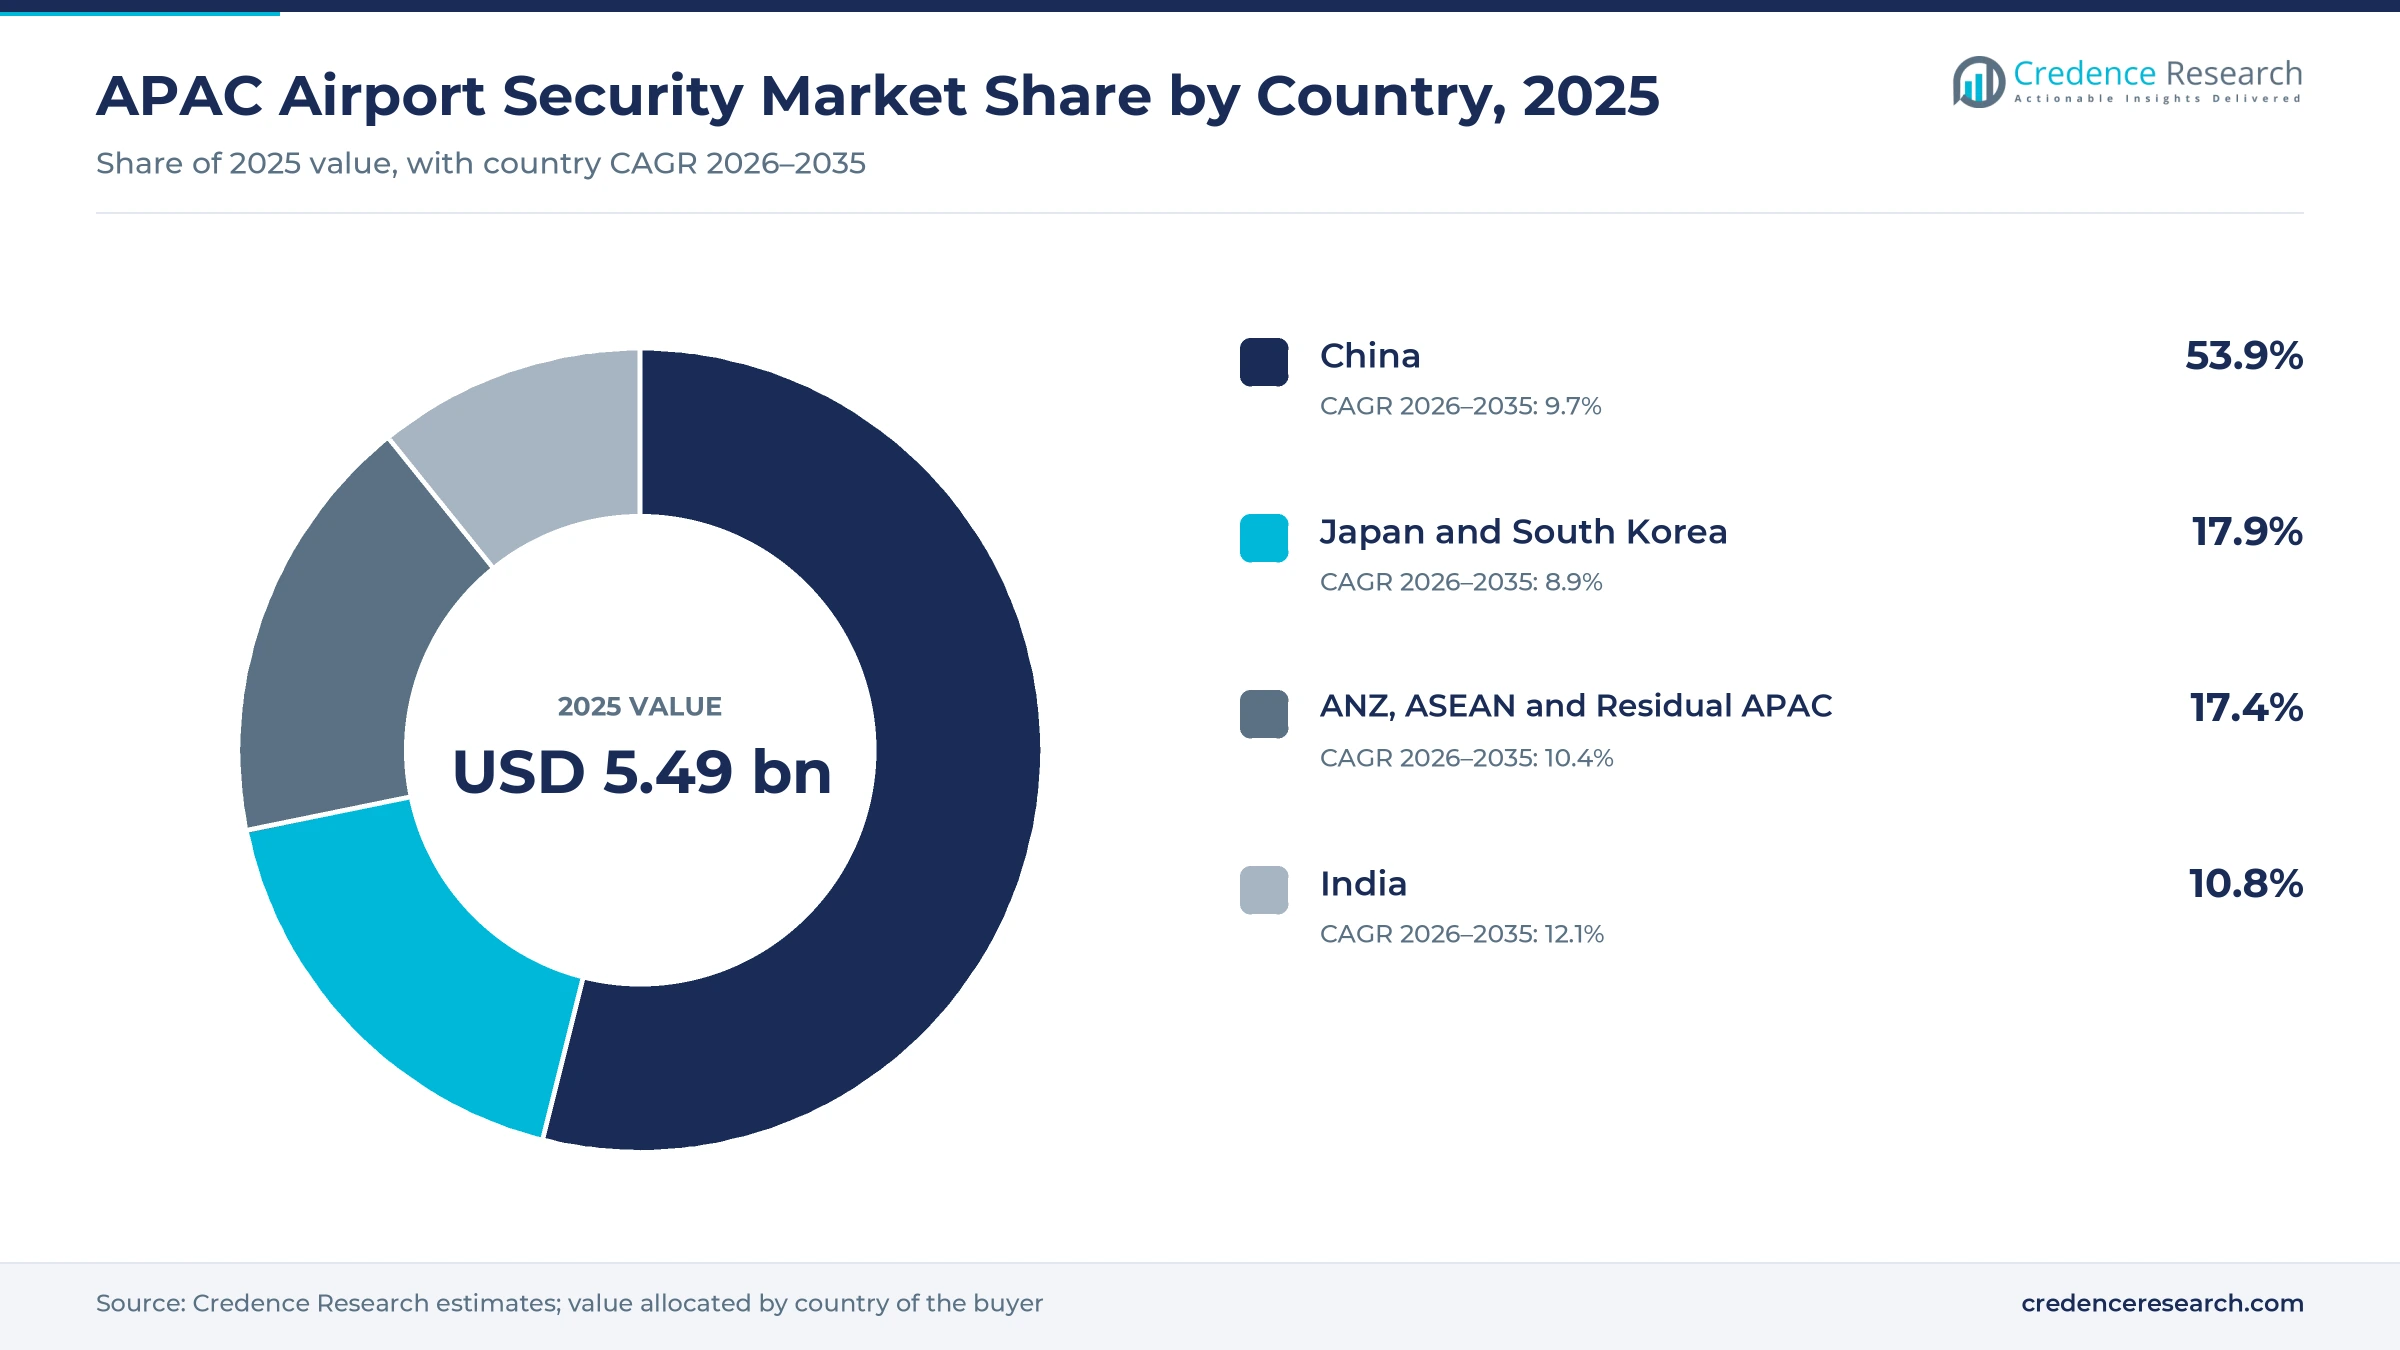
China leads on scale as India grows fastest
| Country | Value, 2025 (USD billion) | Share, 2025 | CAGR, 2026–2035 |
|---|---|---|---|
| China | 2.96 | 53.9% | 9.7% |
| Japan and South Korea | 0.98 | 17.9% | 8.9% |
| ANZ, ASEAN and Residual APAC | 0.96 | 17.4% | 10.4% |
| India | 0.59 | 10.8% | 12.1% |
China leads on network scale and steady hub expansion
China held 53.9% of 2025 value and grows at 9.7% a year, supported by the largest airport network in the region and steady hub expansion. World Bank data show that Chinese carriers flew 619.2 million passengers in 2023, more than three times the 180.4 million flown by Indian carriers. Cargo and mail throughput rose 9% to 21.86 million tons in 2025, according to the Civil Aviation Administration of China, which lifts demand for cargo-zone inspection. Growth trails India because many Chinese hubs already run modern lanes, so new spending tilts toward upgrades and analytics.
Japan and South Korea spend on upgrades at mature hubs
Japan and South Korea held 17.9% of 2025 value and grow at 8.9% a year, the slowest pace in the region because both run mature networks. Spending centers on upgrades, and Smiths Detection already had 42 3D X-ray scanners installed in Japan before Fukuoka ordered 12 more in January 2024. NEC supplies the Face Express boarding system used at Narita and Haneda, and Incheon pairs its expanded Terminal 2 with facial recognition departure gates. Buyers in both countries pay for throughput and passenger experience more than for new capacity.
India grows fastest on greenfield airports and identity
India held 10.8% of 2025 value and is the fastest-growing country market at 12.1% a year. Union Civil Aviation Minister Kinjarapu Ram Mohan Naidu has projected about 500 million annual passengers by 2030, and the new airports at Navi Mumbai and Noida, which opened in 2025 and 2026, are planned to be fully Digi Yatra enabled. Body scanner trials and digital entry permits add further security layers at existing airports. For suppliers, India offers volume but demands local algorithm tuning, as the challenges section explains.
ANZ, ASEAN and Residual APAC build on biometric borders
ANZ, ASEAN and Residual APAC held 17.4% of 2025 value and grow at 10.4% a year. The Australian capital-city airports completed most of their mandated checkpoint upgrades in 2025, and Western Sydney International was due to add a new terminal in October 2026. New Zealand Customs says about 70% of arriving and departing passengers use eGates. Singapore sets the regional benchmark for passport-free clearance, while the first Thai CT lanes and the integrated platform at Dhoho Kediri, both noted above, mark early adoption elsewhere in Southeast Asia.
Vendors and regulators moved fastest during 2024–2026
| Development | Status and market relevance |
|---|---|
| In December 2024, the Australian Department of Home Affairs extended its SmartGate agreement with Idemia for another 10 years. | Active, covering upgraded gates and kiosks for international arrivals processing at Australian airports. |
| In July 2025, Triton completed its acquisition of the Bosch security and communications product business, which now operates as Keenfinity Group. | Completed, creating an independent supplier of video, access control and intrusion products. |
| In October 2025, Prime Minister Narendra Modi inaugurated Navi Mumbai International Airport, with commercial flights starting in December. | Operating, adding a greenfield terminal whose screening and identity systems were specified from the start. |
| In October 2025, Smiths Detection delivered three HI-SCAN 6040 CTiX checkpoint scanners to Airports of Thailand. | Delivered, marking the first CT checkpoint deployment in Thailand. |
| In February 2026, ST Engineering showcased its AGIL Secure FastPass suite, including biometric e-gates and an AI scanning system, at the Singapore Airshow. | Commercial offer, aimed at contactless processing from check-in to boarding. |
CT, body scanners and face matching change checkpoints
- Computed tomography scanners build 3D images of carry-on bags, so passengers can keep laptops and liquids packed and each lane screens more people per hour.
- Millimeter-wave body scanners detect non-metallic items on passengers without contact, and Beijing Daxing pairs them with CT lanes in its fast-track channels.
- Facial recognition e-gates match a live face to a stored passport or boarding record, which removes document checks at immigration and the boarding gate.
- Integrated security management platforms combine access control, video analytics and intrusion alarms on one operator screen, so a single control room can run the whole site.
Need a Custom Version of This Report?
Tailor the scope, geography, or segments to your exact requirements.
- Custom geography or segment scope
- Direct access to our analyst team
Certified screening makers and identity specialists lead
Competition in APAC airport security splits by system layer, and each layer has a different set of leaders. In checkpoint screening, Smiths Detection has supplied CT lanes to airports in Japan, Thailand and Australia, while Nuctech has extended into terminal intrusion detection at Hong Kong International Airport. Identity is led by biometric specialists, with NEC supplying Face Express boarding in Japan and Idemia running Australian SmartGates and the Singapore passport-free lanes. Integrators such as ST Engineering sell unified platforms that tie access control, video and intrusion detection together, and Keenfinity Group now sells former Bosch video, access and intrusion products as an independent company. Buyers judge vendors on regulator approval, lane throughput, local service teams and the openness of their software. Contracts increasingly bundle supply with multi-year maintenance, which rewards suppliers that already have installed bases to upgrade.
Certification barriers concentrate screening, not software
The supply side has three tiers with very different barriers to entry. Screening equipment is concentrated among a handful of manufacturers, because each CT or body scanner model must pass regulator approval before airports can buy it, and buyers rarely mix vendors within one checkpoint. Identity and biometric systems sit with a second group of specialists that often contract with border agencies rather than airports. Video, access control platforms and perimeter detection form the most fragmented tier, served by camera makers and local integrators. Margins are highest in certified screening hardware and multi-year maintenance, while integration work carries thinner margins and more project risk.
Companies profiled and their roles in this market
| Company | Type | Role in the market |
|---|---|---|
| Smiths Detection | Screening equipment maker | Supplied CT checkpoint scanners to Fukuoka, Haneda, Melbourne and Airports of Thailand in 2024–2026 |
| Nuctech Company Limited | Screening and detection systems maker | Won the Hong Kong International Airport Terminal 1 intrusion detection contract in February 2026 |
| NEC Corporation | Biometrics and IT provider | Supplies the Face Express facial-recognition boarding system at Narita and Haneda |
| ST Engineering | Systems integrator | Deployed AGIL Secure at Dhoho Kediri International Airport in Indonesia and offers FastPass biometric e-gates |
| Keenfinity Group | Video, access and intrusion products supplier | Former Bosch security business, independent under Triton since July 2025 |
| Idemia | Biometrics provider | Runs the Australian SmartGate system under a 10-year extension signed in December 2024 and supports passport-free clearance in Singapore |
Construction sets volume and replacement sets the margin
Credence Research's view is that APAC airport security spending follows construction first and replacement second, which makes China and India the two markets that decide the forecast. China sets the volume, but new Indian airports and regional terminals add the most incremental demand each year. The strongest supplier position combines approved CT screening with biometric processing and long maintenance contracts, because buyers increasingly award these together. The most assumption-heavy estimate is the solution-type split, since airports rarely publish security budgets by layer. Buyers should test vendors on lane throughput and local service depth rather than catalog breadth.
Model values rest on traffic, program and price evidence
The report uses 2025 as the base year and 2026 to 2035 as the forecast period. Market values come from the Credence Research model, and country, solution, customer, airport-size and pricing-model splits are Credence Research estimates informed by public data. Sources include Civil Aviation Administration of China statistics, World Bank air transport data, ICAO seminar material, Indian government releases, airport authority announcements, company releases and regional news publishers. No interviews or surveys were used to prepare this edition of the report. The scope counts security equipment, software and services bought for airports, as defined in the market description above.
Regional airports widen the customer base to 2035
Credence Research expects the market to reach USD 14.23 billion by 2035 as airports in the region finish new terminals, replace 2D screening and extend biometric processing beyond the main hubs. India should keep the fastest pace, while China remains the largest source of value. The solution mix will tilt toward identity management, cybersecurity and integrated platforms, although screening hardware stays the largest single item. Suppliers with approved CT units, local service teams and open software are best placed to gain share. The main risks are slower Chinese airport investment, delayed scanner approvals and a large cyber incident that diverts budgets.
Hub capital plans and biometric scale set the range
The range of outcomes depends mainly on whether planned airport projects in China and India stay on schedule and whether biometric processing spreads from hubs to regional airports. Faster approvals for CT lanes and body scanners would pull replacement spending forward. A second large cyber incident would shift budgets toward IT security without raising the total much. Weak traffic or tighter public budgets in China would hit the downside hardest, because that market holds more than half of regional value.
| Scenario | CAGR, 2026–2035 | Value, 2035 | What has to hold |
|---|---|---|---|
| Downside | 8.3% | USD 12.47 billion | Chinese airport investment slows, Indian scanner approvals slip and regional tenders are delayed |
| Base | 9.95% | USD 14.23 billion | Planned terminals open close to schedule and CT replacement continues at the main hubs |
| Upside | 11.2% | USD 15.82 billion | Biometric processing reaches regional airports and CT lanes spread to secondary cities faster |
Frequently Asked Questions
How big is the APAC airport security market?
Which country leads airport security spending in Asia Pacific?
Which country market is growing fastest?
Which solution type holds the largest share?
Why do CT scanners matter for airports in the region?
How fast is biometric passenger processing spreading?
What is holding the market back?
Who are the main companies in this market?
Table of Content
Chapter 1 Market Segmentation
- 1.1 Segmentation Framework
- 1.1.1 Product and Service Classification
- 1.1.2 Application and End-Use Classification
- 1.1.3 Technology and Solution Classification
- 1.1.4 Customer and Distribution Channel Classification
- 1.1.5 Geographic Segmentation
- 1.1.6 Market Segment Definitions and Boundaries
- 1.2 By Solution Type
- 1.2.1 Screening and Scanning
- 1.2.2 Surveillance and Video Analytics
- 1.2.3 Access Control and Identity Management
- 1.2.4 Perimeter Security
- 1.2.5 Cybersecurity and IT Security
- 1.3 By Customer Type
- 1.3.1 Airport Operating Companies
- 1.3.2 Government Security Authorities
- 1.3.3 Airport Tenant Enterprises
- 1.4 By Airport Size
- 1.4.1 Mega-Hub Airports
- 1.4.2 Major Airports
- 1.4.3 Regional Airports
- 1.4.4 Small Airports
- 1.5 By Pricing Model
- 1.5.1 Capital Purchase
- 1.5.2 Term Subscription
- 1.5.3 Service Contract
- 1.6 By Country
- 1.6.1 China
- 1.6.2 India
- 1.6.3 Japan and South Korea
- 1.6.4 ANZ, ASEAN and Residual APAC
Chapter 2 Introduction
- 2.1 Report Objectives and Scope
- 2.2 Product Definition and Industry Terminology
- 2.3 Market Inclusions and Exclusions
- 2.4 Research Process
- 2.4.1 Primary Research and Expert Interviews
- 2.4.2 Secondary Research and Source Review
- 2.4.3 Top-Down and Bottom-Up Estimation
- 2.4.4 Data Triangulation and Verification
- 2.5 Market Size Measurement Basis
- 2.5.1 2025: USD 5.49 billion → 2035: USD 14.23 billion
- 2.6 Historical and Forecast Reference Periods
- 2.6.1 Historical Period: 2018-2025
- 2.6.2 Base Year: 2025
- 2.6.3 Forecast Period: 2025-2035
- 2.7 Research Assumptions and Limitations
Chapter 3 Executive Summary
- 3.1 Market Snapshot and Key Findings
- 3.2 Base-Year Market Size, 2025
- 3.3 Forecast Market Size, 2035
- 3.4 Revenue and Volume Growth Outlook
- 3.5 Key Demand and Supply Indicators
- 3.6 Leading Market Segments
- 3.7 Fastest-Growing Market Opportunities
- 3.8 Regional Performance Highlights
- 3.9 Technology and Industry Transformation
- 3.10 Competitive Landscape Summary
- 3.11 Analyst View and Strategic Implications
Chapter 4 APAC Airport Security Market Trends and Developments
- 4.1 Historical Industry Development, 2018-2025
- 4.2 Recent Market Trends and Developments
- 4.3 Demand and Customer Behavior Trends
- 4.4 Technology and Product Innovation
- 4.5 Artificial Intelligence, Automation and Digitalization
- 4.6 Local Manufacturing and Supply Chain Realignment
- 4.7 Industry Partnerships, Mergers and Acquisitions
- 4.8 Sustainability and Circular Economy Developments
- 4.9 Government and Private Sector Investment Trends
- 4.10 Emerging Business Models and Commercialization
- 4.11 Industry Developments and Announcements
Chapter 5 APAC Airport Security Market Supply and Demand Analysis
- 5.1 Demand Trend and Consumption Analysis, 2018-2025
- 5.2 Demand Forecast, 2025-2035
- 5.3 Supply Chain Structure and Procurement Trends
- 5.4 Supply-Demand Gap and Bottlenecks
- 5.5 Import Dependence and Sourcing Structure
- 5.6 Regional Supply and Demand Concentration
Chapter 6 APAC Airport Security Market Pricing Analysis
- 6.1 Pricing Structure and Measurement
- 6.2 Historical Pricing Trends, 2018-2025
- 6.3 Pricing Outlook, 2025-2035
- 6.4 Pricing by Product and Market Segment
- 6.5 Geographic Pricing Differences
- 6.6 Key Input, Energy, Labor and Logistics Costs
- 6.7 Contract Pricing and Purchasing Models
- 6.8 Pricing Sensitivity and Competitive Positioning
- 6.9 Price, Margin and Profitability Implications
Chapter 7 APAC Airport Security Market Dynamics
- 7.1 Market Growth Drivers
- 7.1.1 Demand-Side Drivers
- 7.1.2 Technology and Innovation Drivers
- 7.1.3 Infrastructure and Investment Drivers
- 7.1.4 Regulatory and Policy Drivers
- 7.2 Market Restraints
- 7.2.1 Cost and Affordability Constraints
- 7.2.2 Technology and Adoption Barriers
- 7.2.3 Supply Chain and Operational Constraints
- 7.3 Market Challenges
- 7.3.1 Competitive Pressure and Margin Erosion
- 7.3.2 Skills, Infrastructure and Implementation Gaps
- 7.4 Emerging Market Opportunities
- 7.5 Market Dynamics Impact and Time-Horizon Assessment
Chapter 8 APAC Airport Security Value Chain Analysis
- 8.1 Industry Value Chain Overview
- 8.2 Upstream Suppliers and Critical Inputs
- 8.3 Technology and Component Providers
- 8.4 Manufacturing or Service Delivery
- 8.5 Distribution, Channel Partners and Integrators
- 8.6 Downstream Applications and End Users
- 8.7 Value Addition and Profit Pools
- 8.8 Vertical Integration and Outsourcing
- 8.9 Supplier Concentration and Risk
- 8.10 Supply Chain Localization and Resilience
Chapter 9 APAC Airport Security Market Regulations and Policies
- 9.1 Relevant Laws, Standards and Compliance Frameworks
- 9.2 Product, Service, Safety and Quality Requirements
- 9.3 Government Policies, Incentives and Subsidies
- 9.4 Imports, Exports and Trade Barriers
- 9.5 Public Procurement and Local Content Requirements
- 9.6 Data Protection, AI and Cybersecurity Compliance
- 9.7 Upcoming Policy Changes and Market Implications
Chapter 10 APAC Airport Security Market Hotspots and Opportunities
- 10.1 Market Opportunity Mapping and Growth Hotspots
- 10.2 High-Growth Applications and Customer Groups
- 10.3 Underserved Markets and White-Space Opportunities
- 10.4 Emerging Technology and Product Opportunities
- 10.5 New Capacity and Investment Hotspots
- 10.6 Market Entry and Expansion Opportunities
- 10.7 Distribution and Partnership Opportunities
- 10.8 Near-Term and Long-Term Commercial Potential
- 10.9 Opportunity Attractiveness and Execution Risks
Chapter 11 APAC Airport Security Market Outlook, 2025-2035
- 11.1 Market Size and Analysis
- 11.1.1 Revenue (Market Measurement: 2025: USD 5.49 billion → 2035: USD 14.23 billion)
- 11.1.2 Historical Market Size, 2018-2025
- 11.1.3 Base-Year Market Size, 2025
- 11.2 Market Forecast, 2025-2035
- 11.2.1 Revenue Forecast to 2035
- 11.2.2 CAGR and Year-on-Year Growth
- 11.2.3 Incremental Revenue Opportunity
- 11.3 Forecast Assumptions and Scenario Analysis
- 11.3.1 Base-Case Forecast
- 11.3.2 Optimistic and Conservative Scenarios
- 11.3.3 Technology, Pricing and Policy Sensitivities
- 11.4 Market Attractiveness and Growth Outlook
Chapter 12 APAC Airport Security Market Segmentation and Outlook
- 12.1 Segmentation Summary and Market Shares, 2025
- 12.2 Largest and Fastest-Growing Segments
- 12.3 By Solution Type - Market Size and Forecast, 2025-2035
- 12.3.1 Segment Definition and Scope
- 12.3.2 Historical Market Size, 2018-2025
- 12.3.3 Revenue Forecast, 2025-2035
- 12.3.4 Base-Year Market Share, 2025
- 12.3.5 Segment CAGR and Growth Drivers
- 12.3.6 Subsegment Market Size and Forecast
- 12.3.6.1 Screening and Scanning
- 12.3.6.2 Surveillance and Video Analytics
- 12.3.6.3 Access Control and Identity Management
- 12.3.6.4 Perimeter Security
- 12.3.6.5 Cybersecurity and IT Security
- 12.3.7 Subsegment Pricing and Adoption Trends
- 12.3.8 Leading Suppliers and Competition
- 12.3.9 Regional Demand and Opportunities
- 12.4 By Customer Type - Market Size and Forecast, 2025-2035
- 12.4.1 Segment Definition and Scope
- 12.4.2 Historical Market Size, 2018-2025
- 12.4.3 Revenue Forecast, 2025-2035
- 12.4.4 Base-Year Market Share, 2025
- 12.4.5 Segment CAGR and Growth Drivers
- 12.4.6 Subsegment Market Size and Forecast
- 12.4.6.1 Airport Operating Companies
- 12.4.6.2 Government Security Authorities
- 12.4.6.3 Airport Tenant Enterprises
- 12.4.7 Subsegment Pricing and Adoption Trends
- 12.4.8 Leading Suppliers and Competition
- 12.4.9 Regional Demand and Opportunities
- 12.5 By Airport Size - Market Size and Forecast, 2025-2035
- 12.5.1 Segment Definition and Scope
- 12.5.2 Historical Market Size, 2018-2025
- 12.5.3 Revenue Forecast, 2025-2035
- 12.5.4 Base-Year Market Share, 2025
- 12.5.5 Segment CAGR and Growth Drivers
- 12.5.6 Subsegment Market Size and Forecast
- 12.5.6.1 Mega-Hub Airports
- 12.5.6.2 Major Airports
- 12.5.6.3 Regional Airports
- 12.5.6.4 Small Airports
- 12.5.7 Subsegment Pricing and Adoption Trends
- 12.5.8 Leading Suppliers and Competition
- 12.5.9 Regional Demand and Opportunities
- 12.6 By Pricing Model - Market Size and Forecast, 2025-2035
- 12.6.1 Segment Definition and Scope
- 12.6.2 Historical Market Size, 2018-2025
- 12.6.3 Revenue Forecast, 2025-2035
- 12.6.4 Base-Year Market Share, 2025
- 12.6.5 Segment CAGR and Growth Drivers
- 12.6.6 Subsegment Market Size and Forecast
- 12.6.6.1 Capital Purchase
- 12.6.6.2 Term Subscription
- 12.6.6.3 Service Contract
- 12.6.7 Subsegment Pricing and Adoption Trends
- 12.6.8 Leading Suppliers and Competition
- 12.6.9 Regional Demand and Opportunities
- 12.7 By Country - Market Size and Forecast, 2025-2035
- 12.7.1 Segment Definition and Scope
- 12.7.2 Historical Market Size, 2018-2025
- 12.7.3 Revenue Forecast, 2025-2035
- 12.7.4 Base-Year Market Share, 2025
- 12.7.5 Segment CAGR and Growth Drivers
- 12.7.6 Subsegment Market Size and Forecast
- 12.7.6.1 China
- 12.7.6.2 India
- 12.7.6.3 Japan and South Korea
- 12.7.6.4 ANZ, ASEAN and Residual APAC
- 12.7.7 Subsegment Pricing and Adoption Trends
- 12.7.8 Leading Suppliers and Competition
- 12.7.9 Regional Demand and Opportunities
- 12.8 Segment Growth Comparison
- 12.9 Segment Attractiveness and Priority Matrix
Chapter 13 APAC Airport Security End-Use and Application Market Outlook
- 13.1 End-Use Industry and Customer Demand Structure
- 13.2 Leading Applications and Customer Groups
- 13.3 End-Use Market Size, Share and Forecast
- 13.4 Major End-Use Industry Deep Dives
- 13.4.1 Customer Requirements and Use Cases
- 13.4.2 Demand and Replacement Cycles
- 13.4.3 Technical and Regulatory Considerations
- 13.4.4 Purchasing and Procurement Models
- 13.4.5 Leading Vendors and Distribution Channels
- 13.4.6 Forecast and Commercial Opportunities
- 13.5 Emerging Applications and Cross-Segment Demand
- 13.6 End-Use Industry Investment Priorities
Chapter 14 APAC Airport Security Geographic Market Outlook, 2025-2035
- 14.1 Regional Market Size and Country-Level Shares, 2025
- 14.2 Country Market Size Comparison, 2025
- 14.3 Country Market Forecasts, 2025-2035
- 14.4 Subregional Industrial and Demand Clusters
- 14.5 Intra-Regional Pricing and Cost Differences
- 14.6 Cross-Border Trade and Supply Networks
- 14.7 Regional Supply and Demand Balances
- 14.8 Country Opportunity Comparison and Prioritization
Note: Every listed country is covered on the structure shown under the first country.
Chapter 15 APAC Airport Security Technology, Innovation and Sustainability Outlook
- 15.1 Technology Landscape and Maturity
- 15.2 Product, Process and Service Innovation
- 15.3 AI, Automation and Digital Tools in the Industry
- 15.4 Technology Adoption and Performance Benchmarking
- 15.5 Innovation Pipeline and R&D Investment
- 15.6 Patent and Intellectual Property Trends
- 15.7 Energy Efficiency and Resource Management
- 15.8 Sustainability, Recycling and Circularity
- 15.9 Technology Roadmap, 2025-2035
- 15.10 Risks of Obsolescence and Technology Substitution
Chapter 16 APAC Airport Security Market Key Strategic Imperatives
- 16.1 Growth and Market Entry Priorities
- 16.2 High-Return Products and Segments
- 16.3 Pricing, Profitability and Cost Optimization
- 16.4 Technology Investment and Product Differentiation
- 16.5 Supply Chain Localization and Resilience
- 16.6 Distribution and Customer Acquisition
- 16.7 Partnership, Acquisition and Capacity Strategy
- 16.8 Regional Expansion Priorities
- 16.9 Short-, Medium- and Long-Term Actions
Chapter 17 Competition Outlook
- 17.1 Industry Competition Characteristics
- 17.2 Market Structure and Concentration
- 17.3 Market Share and Competitive Positioning, 2025
- 17.4 Company-Wise Revenue and Product Benchmarking
- 17.5 Production and Service Capacity Benchmarking
- 17.6 Technology, Pricing and Differentiation
- 17.7 Regional Footprint and Distribution Strength
- 17.8 Mergers, Acquisitions and Strategic Alliances
- 17.9 New Entrants and Competitive Threats
- 17.10 Porter's Five Forces and Industry Attractiveness
- 17.11 Competitive Outlook, 2025-2035
Chapter 18 Company Profiles
- 18.1 Company Coverage and Selection Criteria
- 18.2 Smiths Detection
- 18.2.1 Business Description
- 18.2.2 Company Ownership and Geographic Presence
- 18.2.3 Product and Service Portfolio
- 18.2.4 Manufacturing and Operating Footprint
- 18.2.5 Financial Performance and Investment
- 18.2.6 Market Share and Competitive Position
- 18.2.7 Technology and Innovation Capabilities
- 18.2.8 Strategic Alliances or Partnerships
- 18.2.9 Recent Developments
- 18.2.10 Growth Strategy and Outlook
- 18.3 Nuctech Company Limited
- 18.4 NEC Corporation
- 18.5 Idemia
- 18.6 ST Engineering
- 18.7 Keenfinity Group
- 18.8 Other Relevant Market Participants
Note: Every listed company is profiled on the structure shown under the first company. The company list is preliminary and may change based on research findings, market developments, data availability and client requirements.
Chapter 19 Disclaimer
- 19.1 Research and Forecast Disclaimer
- 19.2 Data Source and Estimation Limitations
Note: The depth of individual sections depends on data availability for this market. Volume, capacity, trade and other unit-based metrics are included where applicable.

