
Adversarial testing has become a release gate for AI
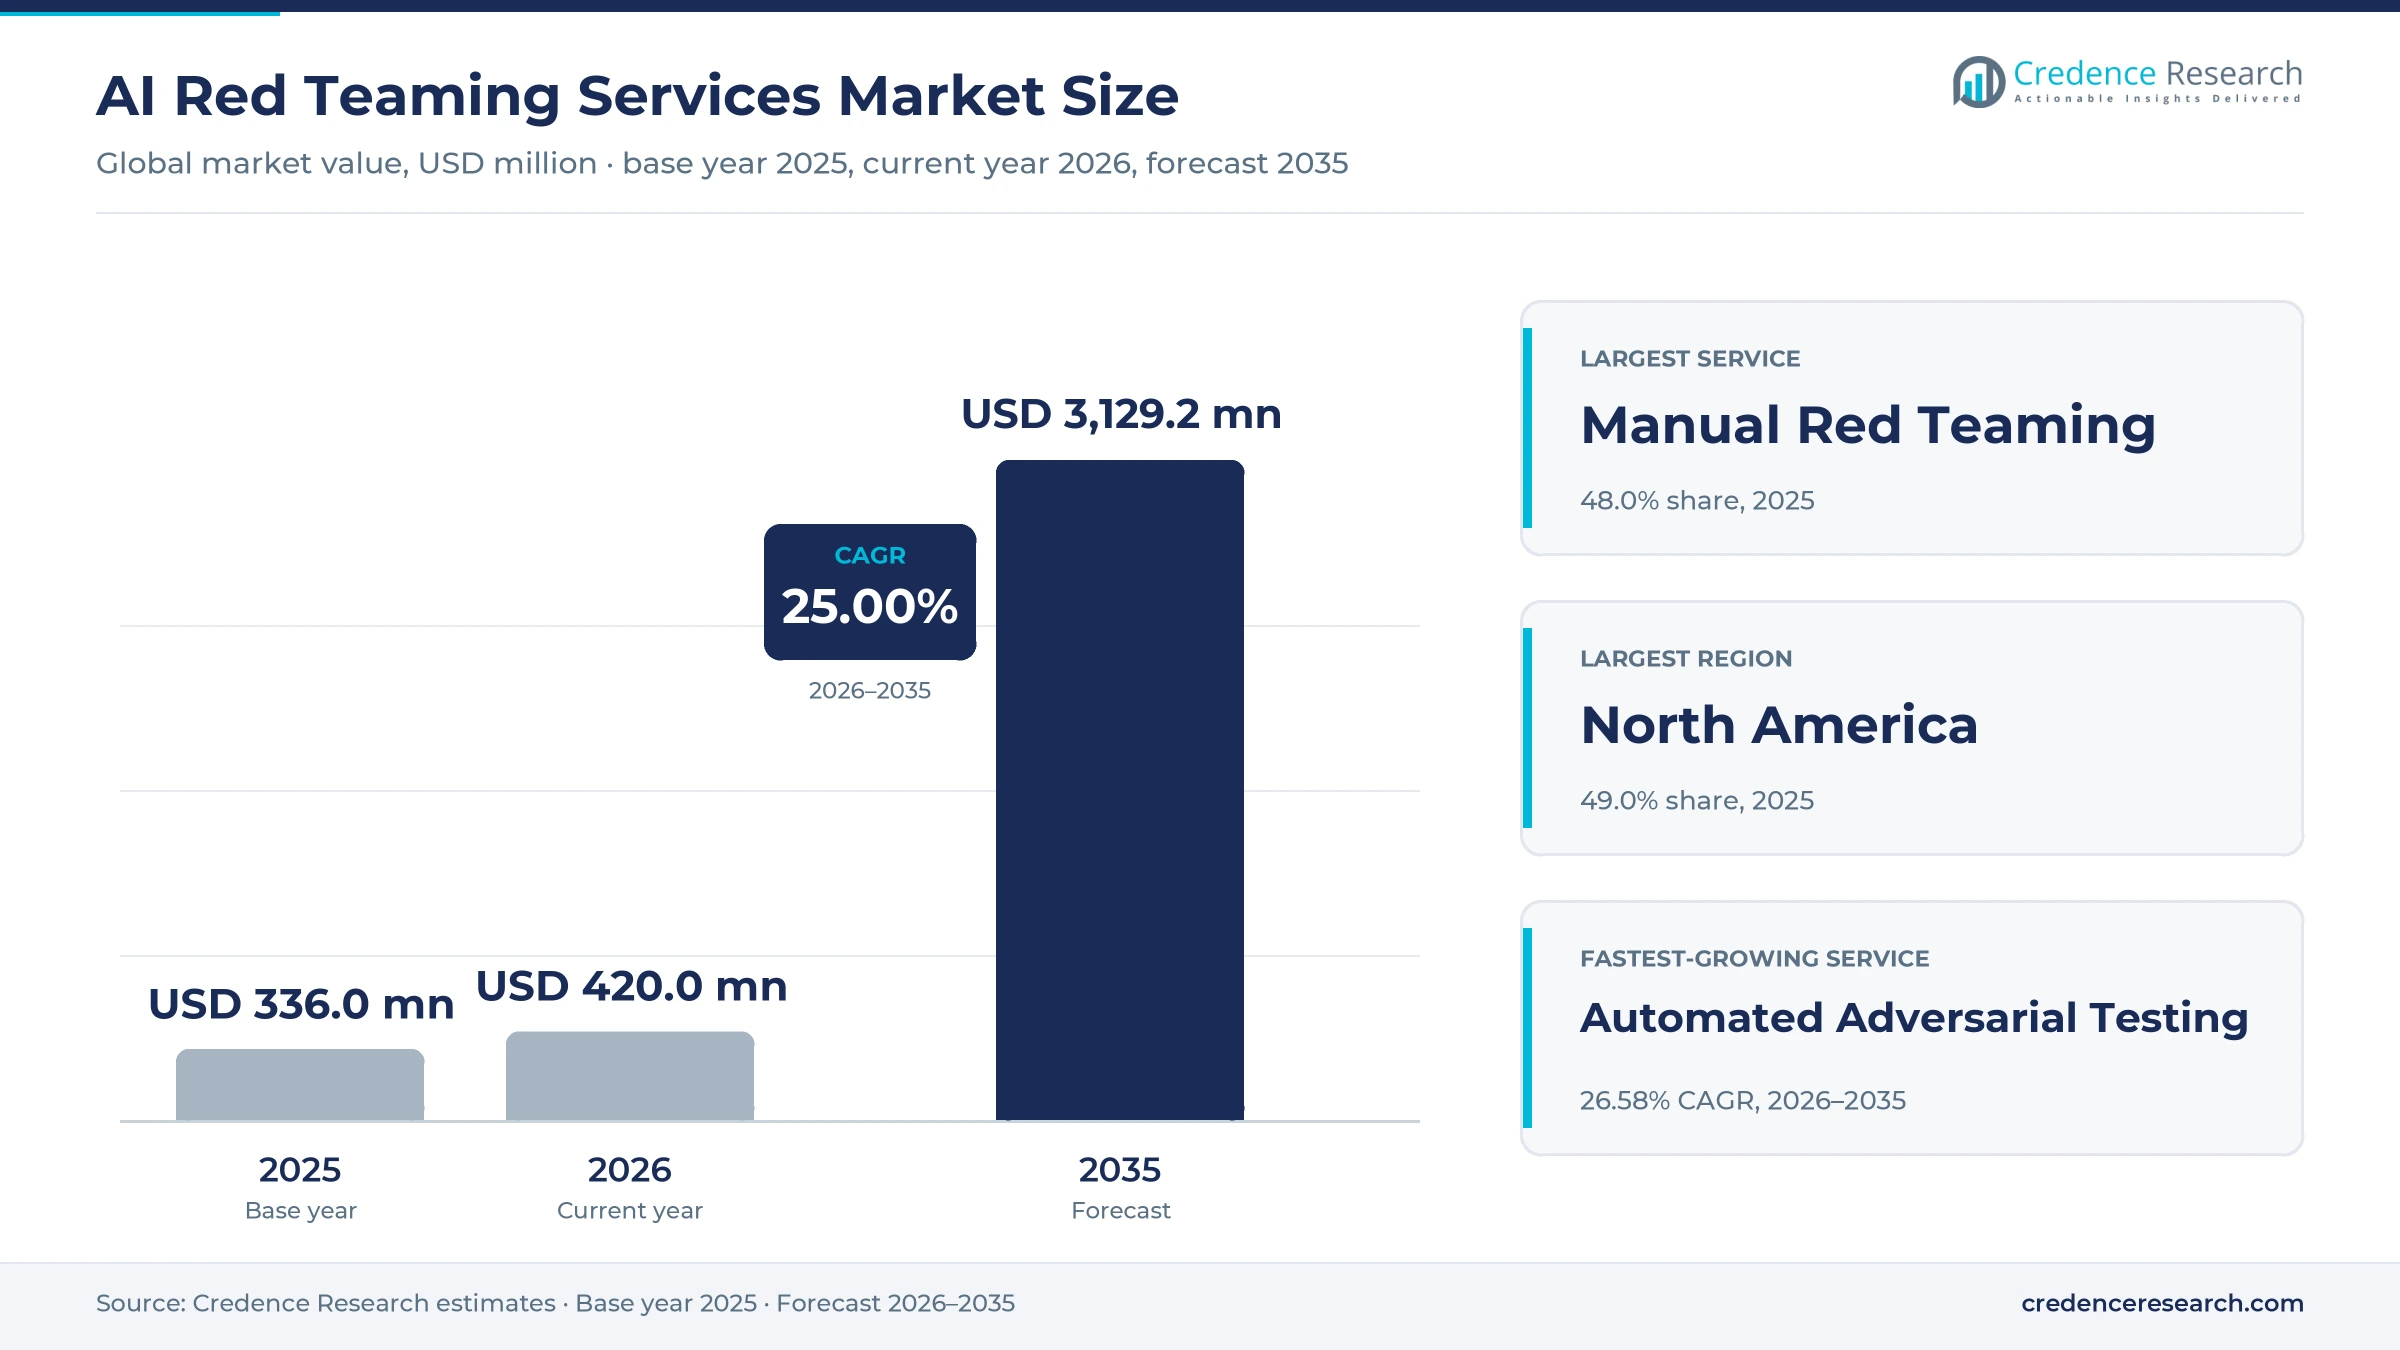
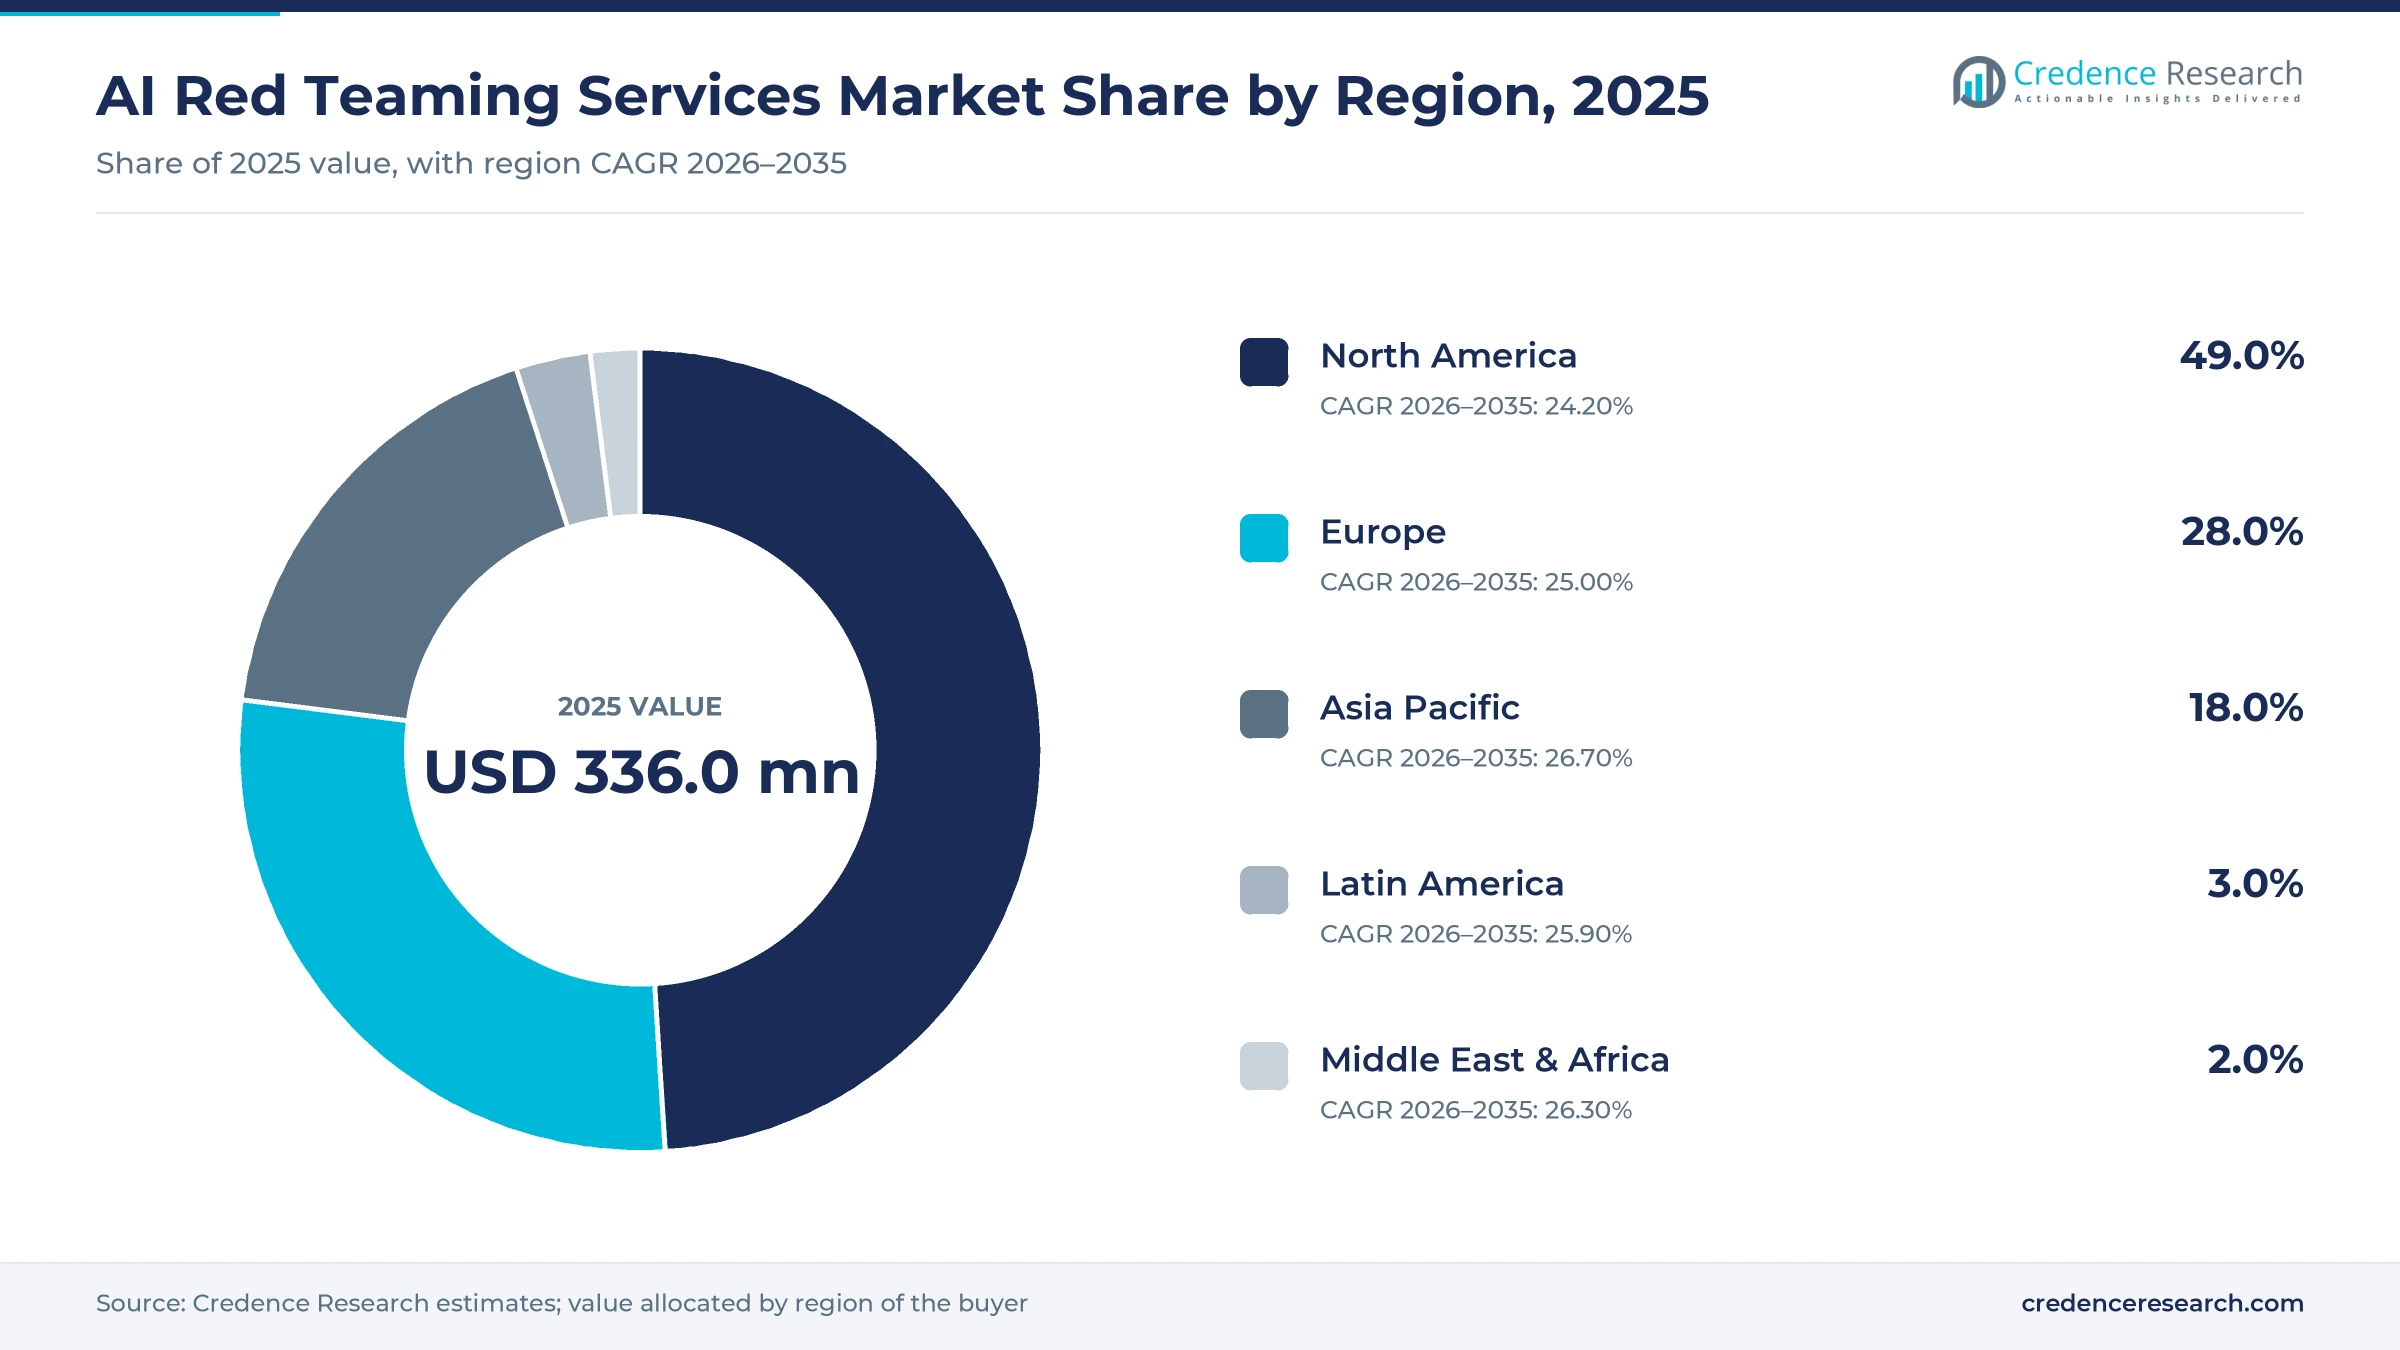
The global AI red teaming services market was valued at USD 336.0 million in 2025 and is projected to increase from USD 420.0 million in 2026 to USD 3.13 billion by 2035, registering a CAGR of 25.00% during 2026–2035. Spending comes from model developers, large enterprises and public agencies that pay specialists to attack AI models, chatbots and agents before and after release. North America held the largest regional share, 49.0% in 2025, because most frontier model labs and early enterprise buyers sit in the United States. Asia Pacific is the fastest-growing region at 26.70% a year as Japan, Singapore, South Korea and India build national testing programs. A major regulatory change arrived on Aug. 2, 2026, when European Commission enforcement powers over general-purpose AI model providers took effect. Buyers are also moving from one-time audits to repeat test cycles because AI agents now take actions inside business software.
What does the AI red teaming services market include?
The AI red teaming services market covers paid work that attacks AI systems to find unsafe, insecure or unreliable behavior. This includes expert-led adversarial campaigns, automated jailbreak and prompt injection testing delivered as a managed service or subscription, and certification testing against published frameworks. Buyers pay per engagement, per tested application or through annual testing programs.
The scope excludes runtime guardrail software sold without testing, general penetration testing of networks and internal staff costs of in-house red teams. Value is counted at the vendor level, including fees paid to external testers and bounty participants that vendors manage on behalf of the buyer.
AI Red Teaming Services Market Insights
- The market is valued at USD 336.0 million in 2025 and is projected to reach USD 3.13 billion by 2035, growing at a 25.00% CAGR as AI testing becomes a release requirement.
- North America led with 49.0% of 2025 value, while Asia Pacific grows fastest at 26.70% a year on national AI testing programs.
- Manual Red Teaming held 48.0% of 2025 value, and Automated Adversarial Testing is the fastest-growing service at 26.58% a year to 2035.
- European Commission enforcement powers over general-purpose AI model providers took effect on Aug. 2, 2026, raising demand for documented adversarial testing.
- OpenAI agreed to buy Promptfoo in March 2026 and Beacon bought Haize Labs in September 2026, showing fast consolidation of testing specialists.
Manual testing leads while automated testing grows fastest
Why does manual red teaming hold the largest share?
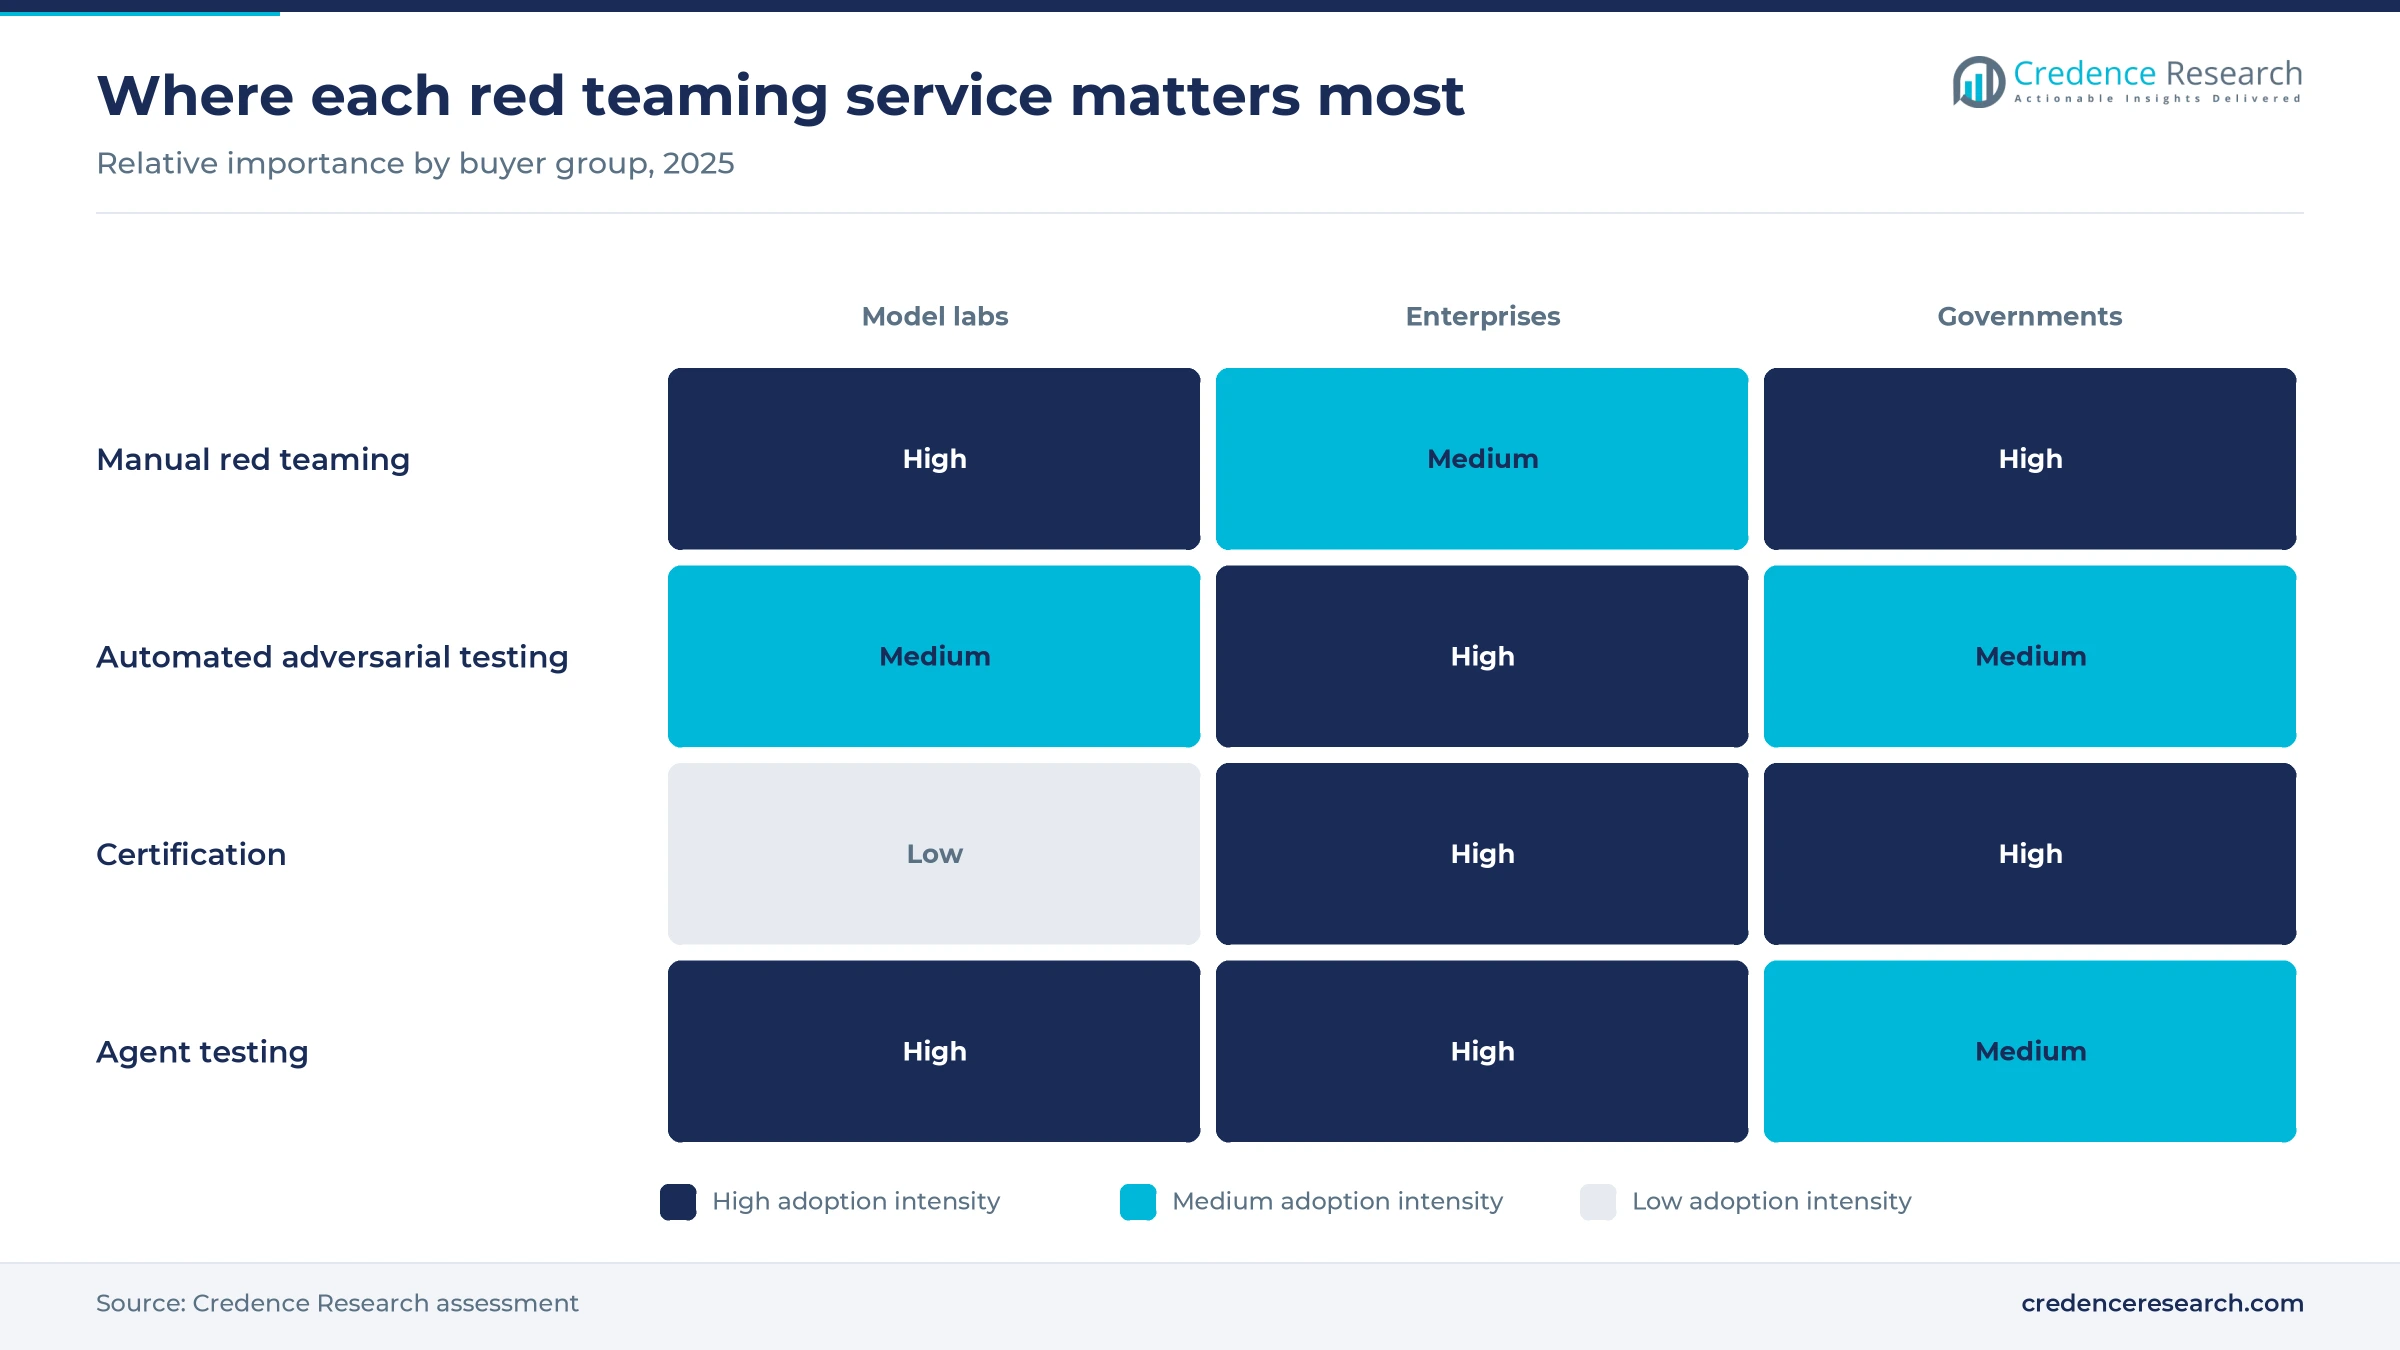
Based on service, the market is categorized into manual red teaming, automated adversarial testing and certification. Manual Red Teaming led with 48.0% of 2025 value because new attack paths still come from skilled human testers. Microsoft's AI Red Team, formed in 2018, had run more than 80 operations covering over 100 generative AI products by October 2024. Anthropic also drew about 185 participants who spent roughly 3,000 hours probing its classifier defenses in a bug bounty reported in February 2025. Automated Adversarial Testing grows fastest at 26.58% a year as testing moves into developer pipelines. Promptfoo reported 350,000 developers on its platform when OpenAI agreed to buy it in March 2026, according to SDxCentral.
Why do enterprises lead and governments grow fastest?
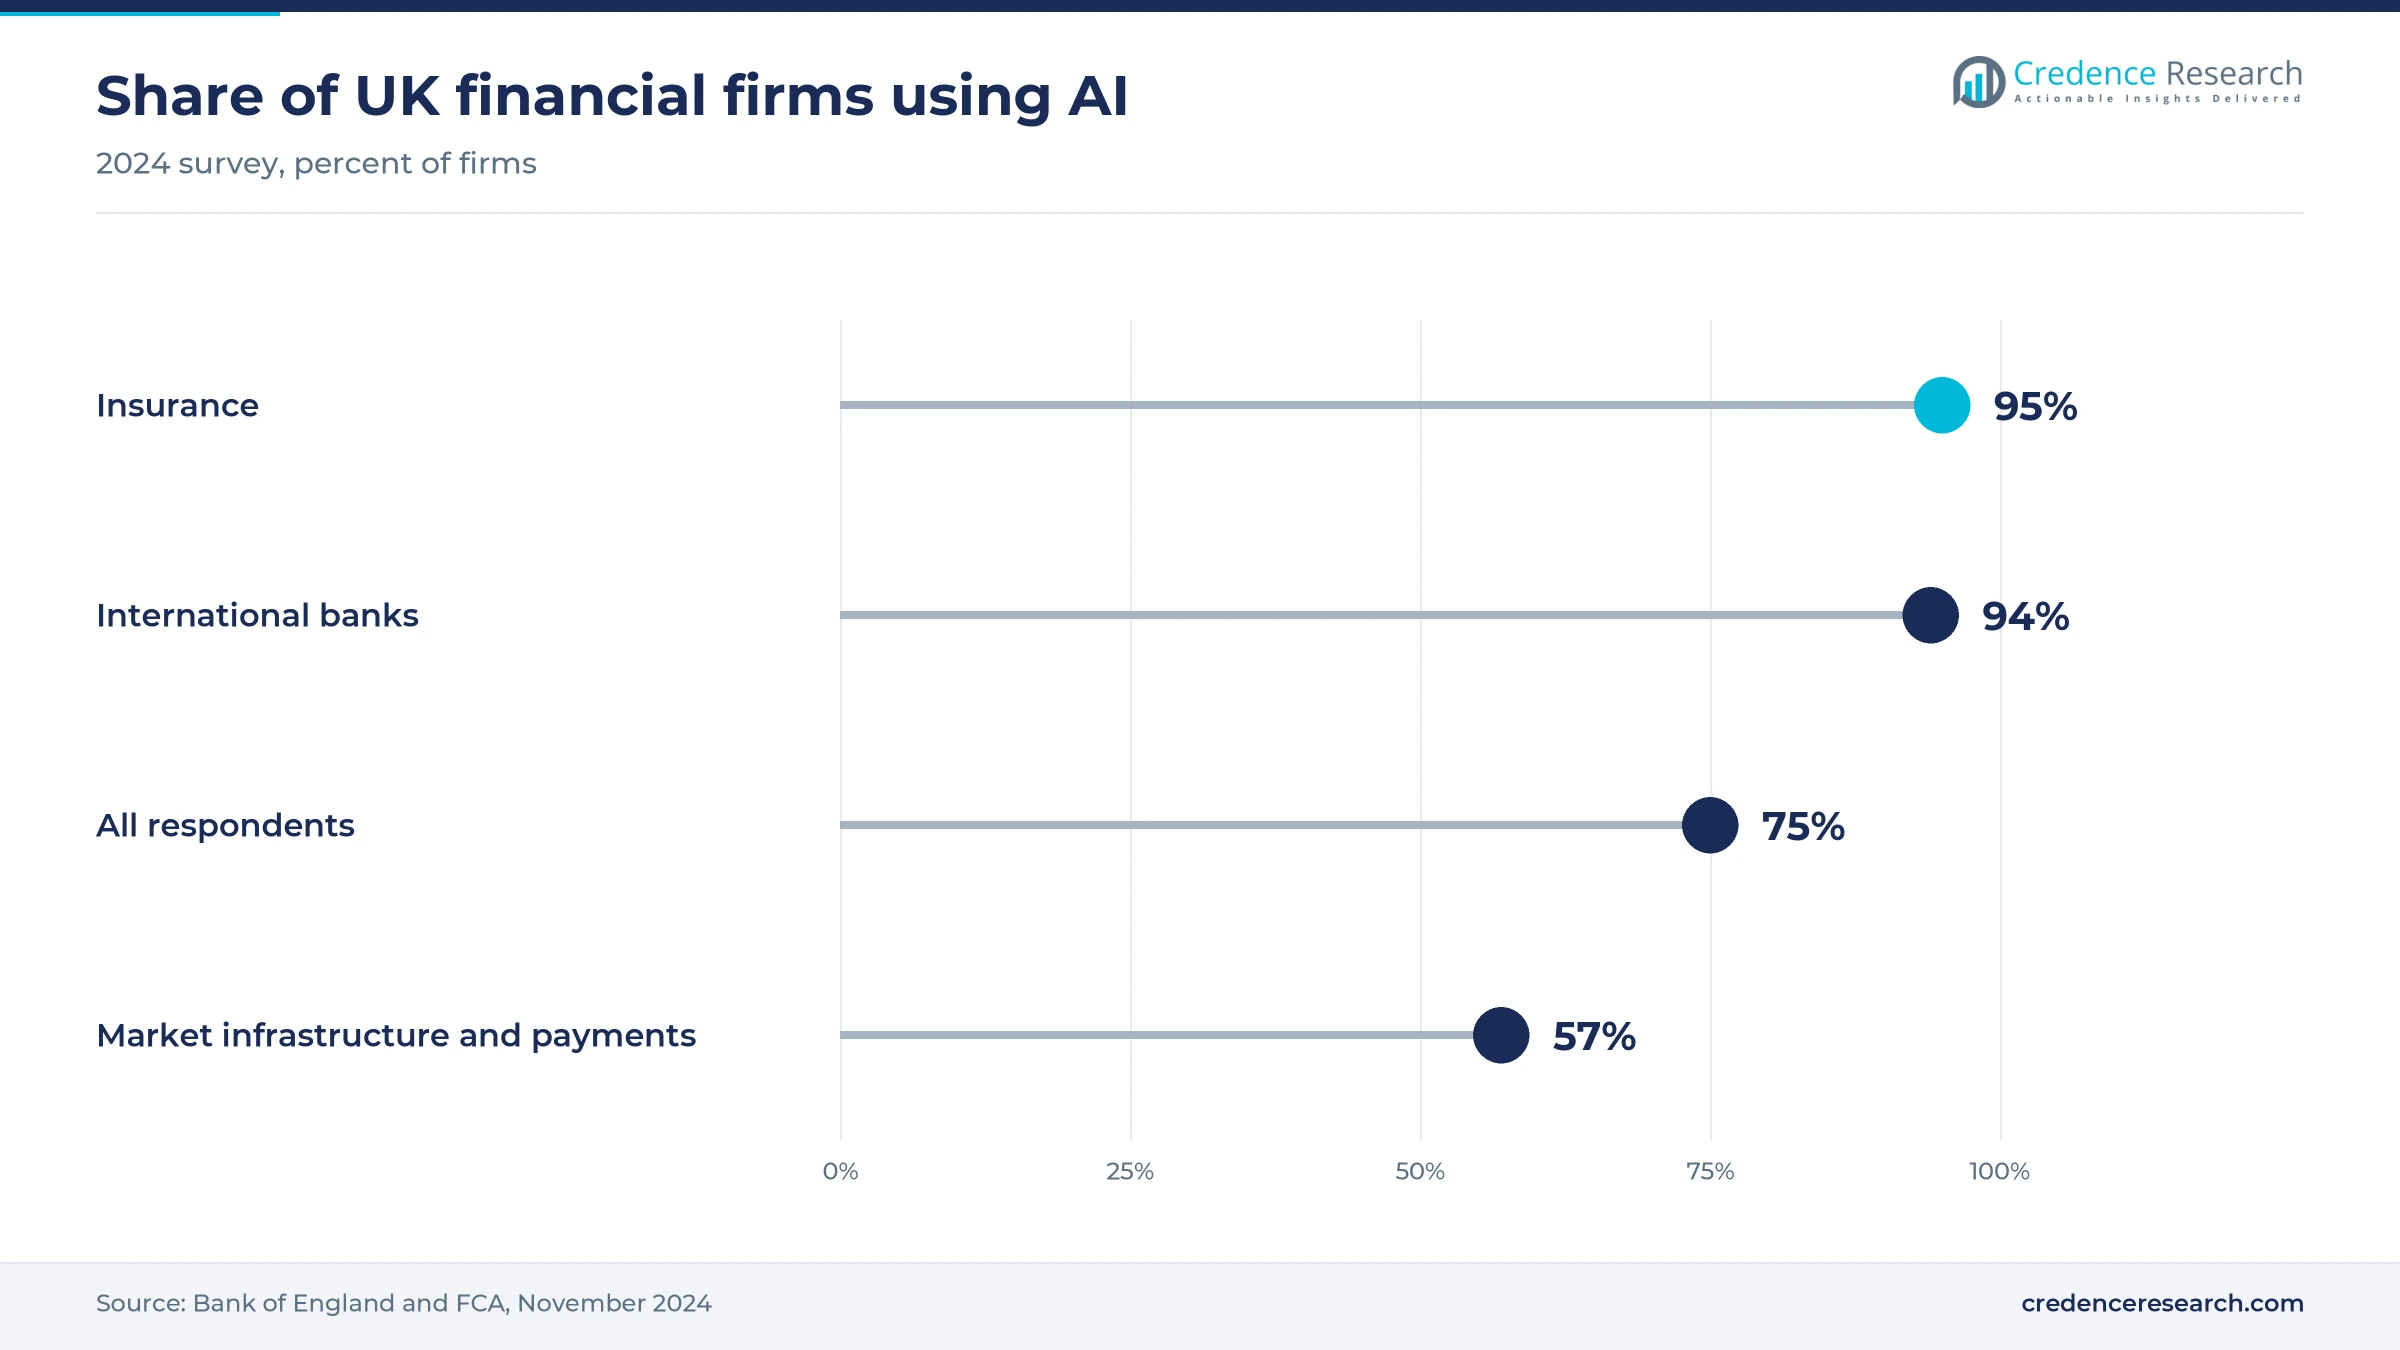
Based on buyer, the market is categorized into model labs, enterprises and governments. Enterprises led with 46.0% of 2025 value because AI now runs inside business processes that boards and supervisors expect to be tested. The Bank of England and FCA found that 75% of 118 surveyed U.K. financial firms already used AI in November 2024. Governments grow fastest at 25.87% a year as public testing bodies widen their programs. The U.S. Center for AI Standards and Innovation said on May 5, 2026 that it had completed more than 40 model evaluations, and the UAE opened a national AI test lab the same day.
Why does tech lead and healthcare grow fastest?
Based on industry, the market is categorized into BFSI, healthcare and tech. Tech led with 44.0% of 2025 value because software firms ship chatbots, coding assistants and agents first and test them most often. Mindgard said its platform had found more than 150 vulnerabilities in popular AI products, including a zero-day flaw in the Cursor code editor, according to SecurityWeek in August 2026. Healthcare grows fastest at 25.88% a year as device rules name AI-specific threats. The FDA draft guidance of Jan. 7, 2025 lists data poisoning, model inversion and model evasion as risks for AI-enabled devices.
| Segment Group | Leading Sub-segment | Share, 2025 | Fastest-growing Sub-segment | CAGR, 2026–2035 |
|---|---|---|---|---|
| By Service | Manual Red Teaming | 48.0% | Automated Adversarial Testing | 26.58% |
| By Buyer | Enterprises | 46.0% | Governments | 25.87% |
| By Industry | Tech | 44.0% | Healthcare | 25.88% |
Request a Free Sample
Fill in your details and we'll send you a free sample report.
- Sample data tables & charts
- Research methodology
Governance, regulation and agents drive testing budgets
Enterprise AI governance lifts adversarial model testing
Enterprise AI governance programs now treat adversarial testing as a control that must be shown to boards, auditors and customers. The Bank of England and FCA survey of November 2024 found that 75% of U.K. financial firms already used AI and ranked cybersecurity as the top systemic AI risk. Promptfoo counted 25% of the Fortune 500 among its customers when OpenAI agreed to acquire it in March 2026, according to SDxCentral. BSI issued 11 ISO/IEC 42001 AI management certificates in 2025 and more than tripled that figure in 2026, reaching its 50th on Oct. 21, 2026. In the Credence Research model this driver adds about 10.00 percentage points to annual growth to 2035.
Regulatory scrutiny drives independent safety audits
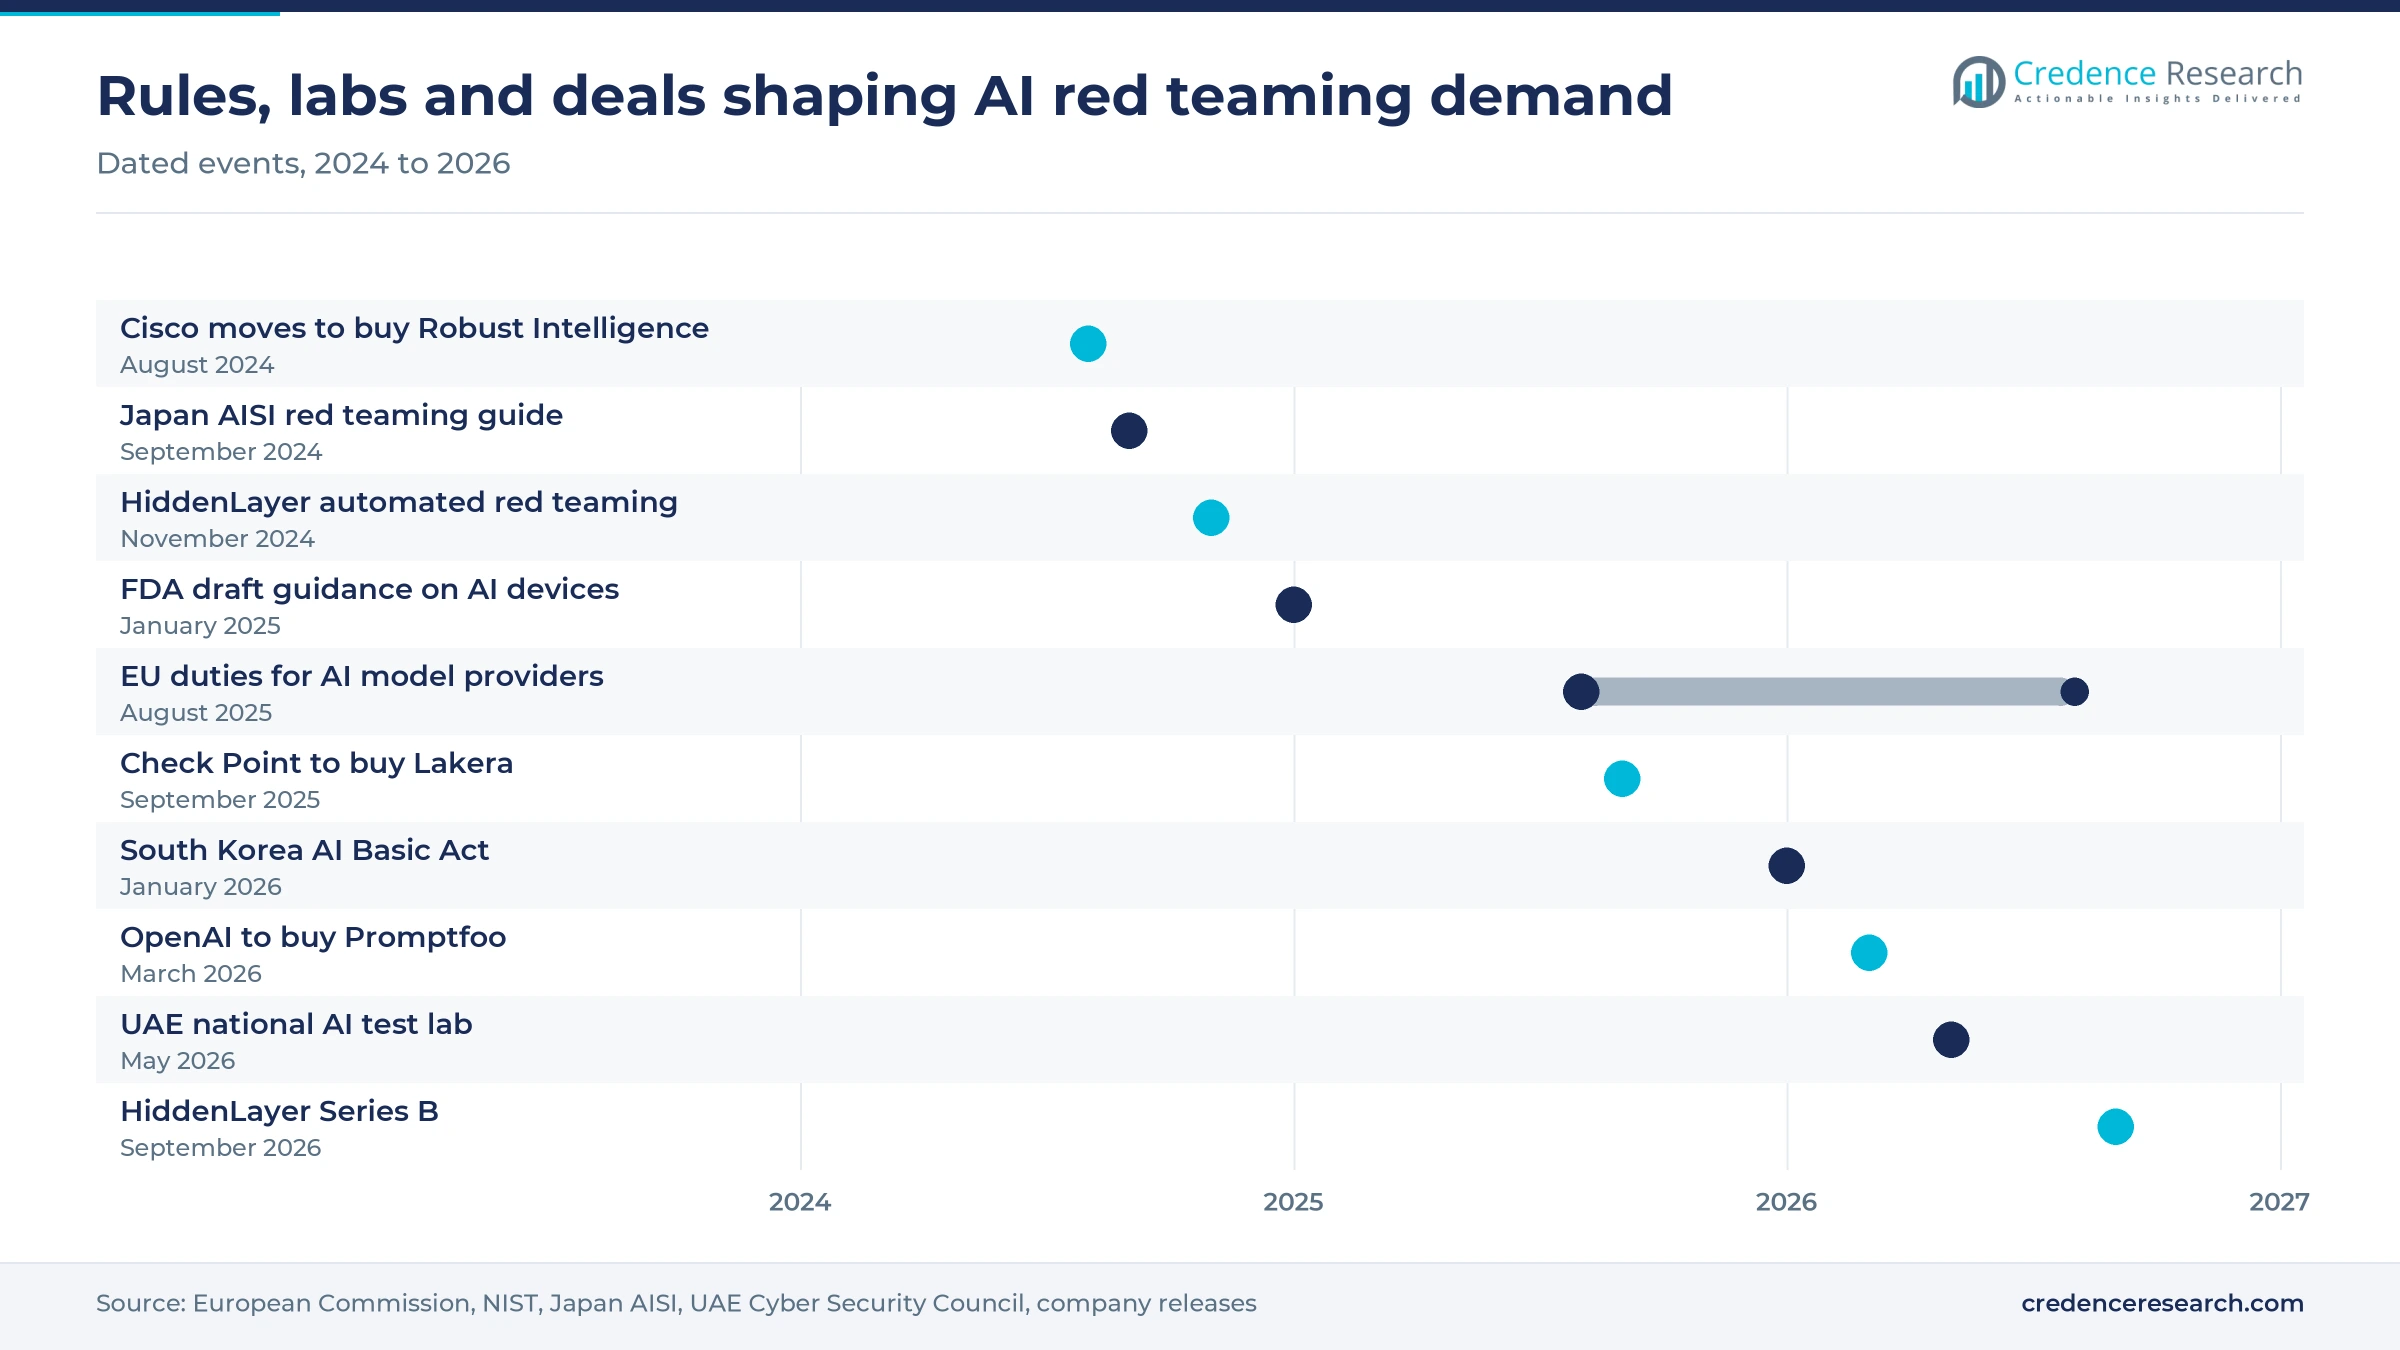
Regulators are turning adversarial testing from good practice into a documented duty, which sends work to independent testers. Article 55 of the EU AI Act requires providers of general-purpose models with systemic risk to conduct and document adversarial testing. The European Commission gained powers to fine these providers from Aug. 2, 2026. In the United States, the Center for AI Standards and Innovation signed pre-deployment testing agreements with Google DeepMind, Microsoft and xAI on May 5, 2026. South Korea's AI Basic Act took effect on Jan. 22, 2026. In the Credence Research model this driver adds about 7.00 percentage points to annual growth to 2035.
Agentic AI deployments require repeat red-team rounds
Agentic AI systems call tools, browse and write code, so each new capability or workflow needs a fresh round of attack testing. The OWASP GenAI Security Project published its Top 10 for Agentic Applications on Dec. 9, 2025, drawing on more than 100 experts and practitioners. OpenAI said in March 2026 that it would build Promptfoo into Frontier, its platform for building and running enterprise agents, to test agent behavior before deployment. HiddenLayer raised a $100 million Series B on Sept. 2, 2026 to expand agentic runtime security, according to Unite.AI. In the Credence Research model this driver adds about 4.50 percentage points to annual growth to 2035.
Rising AI incident counts push testing before release
Rising counts of public AI failures push buyers to test systems before release rather than repair them after harm. The AI Incident Database logged 362 incidents in 2025, up from 233 in 2024, according to the Stanford HAI 2026 AI Index. Lakera's Gandalf game has generated more than 80 million adversarial attack patterns, according to CyberScoop in September 2025, which shows how quickly attackers find new prompts. Anthropic reported in February 2025 that unprotected jailbreak attempts succeeded 86% of the time against its test model, while classifiers cut the rate to 4.4%. These failure rates push labs and enterprises to book adversarial testing before each release rather than after an incident.
Platform deals and crowd challenges reshape the field
Shift of red teaming into large security platform suites
Large security vendors are shifting AI red teaming into broad platform suites through a run of acquisitions since 2024. Cisco moved to acquire Robust Intelligence in August 2024, and Palo Alto Networks completed its purchase of Protect AI in July 2025 to add AI red teaming to Prisma AIRS. F5 agreed in September 2025 to buy CalypsoAI, which offers agentic red teaming, for $180 million, according to SecurityWeek. Check Point then agreed to acquire Lakera, maker of the Lakera Red pre-deployment assessment, in September 2025. SentinelOne announced its Prompt Security deal on Aug. 5, 2025, valued at $250 million to $300 million by Globes, according to SiliconANGLE. As a result, buyers can now purchase testing, runtime defense and reporting from one supplier.
Rise of crowd challenges and published testing methods
A rising share of red teaming now uses open challenges and published methods that widen the pool of qualified testers. Anthropic offered $15,000 in a jailbreak bounty, and about 185 participants spent roughly 3,000 hours over two months, according to VentureBeat in February 2025. Japan's AI Safety Institute released its red teaming methodology guide on Sept. 25, 2024 and added a worked retrieval-augmented generation example in version 1.10 on March 31, 2025. Microsoft released its PyRIT toolkit as open source in 2024 for teams testing their own generative systems. These steps lower entry costs for smaller vendors and in-house teams.
National test labs open certification opportunities
National AI test labs give vendors an opening in certification, because governments want a mark that buyers can trust. The UAE Cyber Security Council, Cisco and Open Innovation AI launched a national AI test and validation lab on May 5, 2026, aiming to assess tens of thousands of AI agents a year, according to TradeArabia. Singapore's Global AI Assurance Pilot paired 16 specialist testers with 17 deployers across 10 industries, according to BioSpectrum Asia in May 2025. BSI reached its 50th ISO/IEC 42001 certificate in October 2026, with UKG as the recipient. Each of these programs needs outside testers who can map findings to ISO 42001, MITRE ATLAS and OWASP frameworks.
Regulated health and finance work opens new demand
Health and financial services open a demand opportunity because supervisors already expect documented risk testing of new technology. The FDA draft guidance of Jan. 7, 2025 asks AI device makers to address data poisoning, model inversion and model evasion in premarket submissions. The New York Department of Financial Services issued its AI cybersecurity letter on Oct. 16, 2024, telling covered firms to include AI threats in risk assessments. Insurance firms reported 95% AI use and international banks 94%, according to the Bank of England. Healthcare grows at 25.88% a year in the Credence Research model.
Tester scarcity and vendor consolidation weigh on buyers
Scarce specialist testers raise engagement costs
Qualified AI red teamers are scarce, which raises day rates and lengthens start times for buyers. Singapore's Global AI Assurance Pilot could pair only 16 specialist testers with 17 deployers in its 2025 round, according to BioSpectrum Asia. Anthropic's single bounty program needed about 3,000 participant hours to test one defense system. As a result, smaller buyers wait longer for expert-led work. Vendors respond with automated attack libraries that save human time for new attack classes.
Rapid consolidation narrows independent vendor choice
Fast consolidation reduces the number of independent testers, which worries buyers that want neutral results. Beacon acquired Haize Labs in September 2026, according to BetaKit, after Haize had tested systems for Anthropic, OpenAI and Air Canada. OpenAI agreed to buy Promptfoo in March 2026, and Check Point agreed to buy Lakera in September 2025. As a result, some model labs now test with tools owned by rivals or security suppliers. Buyers respond by splitting test programs across several independent vendors.
Uneven national rules complicate test scopes
Rules differ widely between markets, which makes one global test plan hard to design and price. South Korea's AI Basic Act sets fines of up to 30 million won, about $21,000, according to Cooley in January 2026, while EU fines apply from Aug. 2, 2026. Brazil's Senate passed its AI bill on Dec. 10, 2024, but the Chamber of Deputies had still to approve it. As a result, vendors must map each test to several frameworks and update reports as rules change.
Point-in-time tests miss drift and new attacks
A single test captures a model only at one moment, while attacks and model behavior keep changing. The AI Incident Database counted 362 incidents in 2025, about 55% more than in 2024, according to Stanford HAI. The FDA draft guidance of January 2025 also lists model performance drift as a risk for AI devices. As a result, buyers face added cost for repeat rounds. Vendors respond with continuous testing subscriptions tied to each model update.
North America leads as Asia Pacific grows fastest
| Region | Value, 2025 (USD million) | Share, 2025 | CAGR, 2026–2035 |
|---|---|---|---|
| North America | 164.6 | 49.0% | 24.20% |
| Europe | 94.1 | 28.0% | 25.00% |
| Asia Pacific | 60.5 | 18.0% | 26.70% |
| Latin America | 10.1 | 3.0% | 25.90% |
| Middle East & Africa | 6.7 | 2.0% | 26.30% |
North America leads on lab and enterprise spending
North America held 49.0% of 2025 value and grows at 24.20% a year to 2035. The region leads because frontier model labs and early enterprise buyers are concentrated in the United States. The Center for AI Standards and Innovation had completed more than 40 model evaluations by May 2026. Austin-based HiddenLayer raised $100 million in September 2026, and OpenAI agreed to buy Promptfoo in March 2026. As a result, the region remains the main market for expert campaigns and automated testing.
Europe grows on AI Act testing duties
Europe held 28.0% of 2025 value and grows at 25.00% a year to 2035. Article 55 of the EU AI Act requires documented adversarial testing for general-purpose models with systemic risk, with Commission fines possible from Aug. 2, 2026. The region also hosts Lakera in Zurich and Mindgard in London, a 2022 spinout of Lancaster University. The U.K. renamed its AI Safety Institute as the AI Security Institute on Feb. 14, 2025, which sharpened public focus on security testing.
Asia Pacific grows fastest on national testing programs
Asia Pacific held 18.0% of 2025 value and is the fastest-growing region at 26.70% a year to 2035. Japan's AI Safety Institute published its red teaming guide in September 2024, and Singapore's assurance pilot tested real applications across 10 industries in 2025. South Korea's AI Basic Act took effect on Jan. 22, 2026. India announced its IndiaAI Safety Institute in January 2025, with stress testing tools among its listed project themes.
Latin America builds rules for high-risk systems
Latin America held 3.0% of 2025 value and grows at 25.90% a year to 2035. Brazil's Senate approved Bill No. 2,338 of 2023 on Dec. 10, 2024, with safety test documentation and impact assessments for high-risk systems, according to Mattos Filho. This creates future demand once the Chamber of Deputies completes its review of the bill. Banks and insurers in Brazil and Mexico are expected to be the first buyers, because they already run formal model risk programs.
Middle East & Africa gains from national certification
Middle East & Africa held 2.0% of 2025 value and grows at 26.30% a year to 2035. The UAE national AI test and validation lab, opened on May 5, 2026, checks AI models and agents against ISO 42001, MITRE ATLAS, the NIST AI RMF and OWASP frameworks. AI systems that pass these checks receive a national certification mark from the council. This gives government entities and regulated firms in the Gulf a clear path to buy testing and certification work.
Funding rounds and acquisitions marked 2026 activity
| Development | Status and market relevance |
|---|---|
| In March 2026, OpenAI agreed to acquire Promptfoo, an open-source AI testing platform used by 25% of the Fortune 500. | Brings automated agent testing into the OpenAI Frontier platform |
| In May 2026, the UAE Cyber Security Council, Cisco and Open Innovation AI launched a national AI test and validation lab. | Adds a national certification mark for tested AI models and agents |
| In August 2026, Mindgard raised a $30 million Series A round led by Album VC, bringing total funding to close to $42 million. | Funds wider deployment of automated red teaming in finance, health care and gaming |
| In September 2026, HiddenLayer raised a $100 million Series B round led by Delta-v Capital. | Expands agentic runtime security and testing for AI coding agents |
| In September 2026, Beacon acquired Haize Labs, a New York startup that stress-tests AI agents before deployment. | Moves an independent red teaming specialist inside a software group |
Attack libraries, agent tests and framework mapping
- Human-led adversarial campaigns use experts who invent new jailbreaks, social engineering prompts and misuse scenarios that automated tools have not yet seen.
- Automated attack libraries run thousands of known prompt injection and jailbreak patterns against each model build and rerun them after every model or prompt update.
- Adversarial robustness tools such as NIST's open-source Dioptra measure how much an attack degrades model performance and under what conditions.
- Agent and tool-use testing checks whether an agent can be tricked into calling tools, moving data or running code outside its intended permissions.
- Framework mapping links each finding to MITRE ATLAS, OWASP, the NIST AI RMF or ISO 42001 so buyers can show regulators and auditors what was tested.
Need a Custom Version of This Report?
Tailor the scope, geography, or segments to your exact requirements.
- Custom geography or segment scope
- Direct access to our analyst team
Security platforms and specialists compete on depth
Competition in AI red teaming services centers on attack depth, speed of retesting and trust in the tester's independence. Large security suppliers now sell testing inside broad platforms, as Cisco does with Robust Intelligence, Palo Alto Networks with Protect AI, F5 with CalypsoAI and Check Point with Lakera. Specialists such as HiddenLayer and Mindgard compete on automated red teaming and research into new attack classes, while Haize Labs built its name testing systems for frontier labs before joining Beacon. Many vendors extend classic penetration testing practices to models and agents, and some partner with cybersecurity consulting firms for governance work. Price matters less than coverage of new agent risks and the quality of reports that regulators accept. The AI red teaming services market saw at least five acquisitions by large security suppliers between August 2024 and September 2025.
Companies profiled and their roles in this market
| Company | Type | Role in the market |
|---|---|---|
| HiddenLayer | Specialist platform | Automated red teaming since November 2024 and agentic runtime security |
| Haize Labs | Specialist tester (Beacon) | Stress tests AI agents for labs and enterprises before deployment |
| Lakera (Check Point) | Specialist within security group | Lakera Red pre-deployment assessments backed by Gandalf attack data |
| Mindgard | Specialist platform | Automated AI red teaming with more than 150 vulnerabilities found |
| Cisco (Robust Intelligence) | Security platform supplier | AI Defense testing used in the UAE national AI test lab |
| Palo Alto Networks (Protect AI) | Security platform supplier | AI red teaming within the Prisma AIRS platform |
| F5 (CalypsoAI) | Security platform supplier | Agentic red teaming and inference-layer guardrails |
Repeat testing of agents will decide vendor share
Credence Research's view is that repeat testing of AI agents, not one-time audits, will decide vendor share through 2035. Enterprises are moving agents into finance, health care and software work, and each new tool or permission creates fresh attack paths. Test work also feeds model post-training, much like human feedback data does for alignment. Vendors that combine expert campaigns with automated retesting, framework-mapped reports and clear independence from model owners are best placed to grow faster than the market. Certification will add a second revenue base as national labs and standards bodies issue marks. Automated adversarial testing grows at 26.58% a year, the fastest rate of any service in the AI red teaming services market.
Model-based sizing checked against buyer activity
The report uses 2025 as the base year and forecasts values from 2026 to 2035 in U.S. dollars. Market values come from the Credence Research model, and the regional, service, buyer and industry splits are Credence Research estimates. Inputs include public company announcements, funding and acquisition releases, regulator and standards body publications, government testing agency releases and the Stanford HAI AI Index. The 2025 value was checked against public buyer and vendor activity. No interviews or surveys were conducted for this edition of the report.
Agent testing and certification extend growth to 2035
The AI red teaming services market is expected to grow from USD 420.0 million in 2026 to USD 3.13 billion by 2035 as testing becomes a standard step before and after each AI release. Automated adversarial testing should gain share as it moves into developer pipelines and agent platforms. Governments will widen pre-deployment evaluations and issue more national certification marks for AI systems. Health care and financial services will add regulated demand as supervisors ask for documented testing of AI tools and generative models. Expert-led campaigns will stay central for new attack classes and frontier systems.
Frequently Asked Questions
How big is the AI red teaming services market?
Which service holds the largest share?
Which service grows fastest?
Which region leads the market?
Which region grows fastest?
Which buyer group grows fastest?
Who are the key companies in the market?
What are the main challenges for buyers?
Table of Content
Chapter 1 Market Segmentation
- 1.1 Segmentation Framework
- 1.1.1 Product and Service Classification
- 1.1.2 Application and End-Use Classification
- 1.1.3 Technology and Solution Classification
- 1.1.4 Customer and Distribution Channel Classification
- 1.1.5 Geographic Segmentation
- 1.1.6 Market Segment Definitions and Boundaries
- 1.2 By Service
- 1.2.1 Manual Red Teaming
- 1.2.2 Automated Adversarial Testing
- 1.2.3 Certification
- 1.3 By Buyer
- 1.3.1 Enterprises
- 1.3.2 Model Labs
- 1.3.3 Governments
- 1.4 By Industry
- 1.4.1 Tech
- 1.4.2 BFSI
- 1.4.3 Healthcare
Chapter 2 Introduction
- 2.1 Report Objectives and Scope
- 2.2 Product Definition and Industry Terminology
- 2.3 Market Inclusions and Exclusions
- 2.4 Research Process
- 2.4.1 Primary Research and Expert Interviews
- 2.4.2 Secondary Research and Source Review
- 2.4.3 Top-Down and Bottom-Up Estimation
- 2.4.4 Data Triangulation and Verification
- 2.5 Market Size Measurement Basis
- 2.5.1 2025: USD 336.0 million → 2035: USD 3.13 billion
- 2.6 Historical and Forecast Reference Periods
- 2.6.1 Historical Period: 2018-2025
- 2.6.2 Base Year: 2025
- 2.6.3 Forecast Period: 2025-2035
- 2.7 Research Assumptions and Limitations
Chapter 3 Executive Summary
- 3.1 Market Snapshot and Key Findings
- 3.2 Base-Year Market Size, 2025
- 3.3 Forecast Market Size, 2035
- 3.4 Revenue and Volume Growth Outlook
- 3.5 Key Demand and Supply Indicators
- 3.6 Leading Market Segments
- 3.7 Fastest-Growing Market Opportunities
- 3.8 Regional Performance Highlights
- 3.9 Technology and Industry Transformation
- 3.10 Competitive Landscape Summary
- 3.11 Analyst View and Strategic Implications
Chapter 4 Global AI Red Teaming Services Market Trends and Developments
- 4.1 Historical Industry Development, 2018-2025
- 4.2 Recent Market Trends and Developments
- 4.3 Demand and Customer Behavior Trends
- 4.4 Technology and Product Innovation
- 4.5 Artificial Intelligence, Automation and Digitalization
- 4.6 Local Manufacturing and Supply Chain Realignment
- 4.7 Industry Partnerships, Mergers and Acquisitions
- 4.8 Sustainability and Circular Economy Developments
- 4.9 Government and Private Sector Investment Trends
- 4.10 Emerging Business Models and Commercialization
- 4.11 Industry Developments and Announcements
Chapter 5 Global AI Red Teaming Services Market Supply and Demand Analysis
- 5.1 Demand Trend and Consumption Analysis, 2018-2025
- 5.2 Demand Forecast, 2025-2035
- 5.3 Supply Chain Structure and Procurement Trends
- 5.4 Supply-Demand Gap and Bottlenecks
- 5.5 Import Dependence and Sourcing Structure
- 5.6 Regional Supply and Demand Concentration
Chapter 6 Global AI Red Teaming Services Market Pricing Analysis
- 6.1 Pricing Structure and Measurement
- 6.2 Historical Pricing Trends, 2018-2025
- 6.3 Pricing Outlook, 2025-2035
- 6.4 Pricing by Product and Market Segment
- 6.5 Geographic Pricing Differences
- 6.6 Key Input, Energy, Labor and Logistics Costs
- 6.7 Contract Pricing and Purchasing Models
- 6.8 Pricing Sensitivity and Competitive Positioning
- 6.9 Price, Margin and Profitability Implications
Chapter 7 Global AI Red Teaming Services Market Dynamics
- 7.1 Market Growth Drivers
- 7.1.1 Demand-Side Drivers
- 7.1.2 Technology and Innovation Drivers
- 7.1.3 Infrastructure and Investment Drivers
- 7.1.4 Regulatory and Policy Drivers
- 7.2 Market Restraints
- 7.2.1 Cost and Affordability Constraints
- 7.2.2 Technology and Adoption Barriers
- 7.2.3 Supply Chain and Operational Constraints
- 7.3 Market Challenges
- 7.3.1 Competitive Pressure and Margin Erosion
- 7.3.2 Skills, Infrastructure and Implementation Gaps
- 7.4 Emerging Market Opportunities
- 7.5 Market Dynamics Impact and Time-Horizon Assessment
Chapter 8 Global AI Red Teaming Services Value Chain Analysis
- 8.1 Industry Value Chain Overview
- 8.2 Upstream Suppliers and Critical Inputs
- 8.3 Technology and Component Providers
- 8.4 Manufacturing or Service Delivery
- 8.5 Distribution, Channel Partners and Integrators
- 8.6 Downstream Applications and End Users
- 8.7 Value Addition and Profit Pools
- 8.8 Vertical Integration and Outsourcing
- 8.9 Supplier Concentration and Risk
- 8.10 Supply Chain Localization and Resilience
Chapter 9 Global AI Red Teaming Services Market Regulations and Policies
- 9.1 Relevant Laws, Standards and Compliance Frameworks
- 9.2 Product, Service, Safety and Quality Requirements
- 9.3 Government Policies, Incentives and Subsidies
- 9.4 Imports, Exports and Trade Barriers
- 9.5 Public Procurement and Local Content Requirements
- 9.6 Data Protection, AI and Cybersecurity Compliance
- 9.7 Upcoming Policy Changes and Market Implications
Chapter 10 Global AI Red Teaming Services Market Hotspots and Opportunities
- 10.1 Market Opportunity Mapping and Growth Hotspots
- 10.2 High-Growth Applications and Customer Groups
- 10.3 Underserved Markets and White-Space Opportunities
- 10.4 Emerging Technology and Product Opportunities
- 10.5 New Capacity and Investment Hotspots
- 10.6 Market Entry and Expansion Opportunities
- 10.7 Distribution and Partnership Opportunities
- 10.8 Near-Term and Long-Term Commercial Potential
- 10.9 Opportunity Attractiveness and Execution Risks
Chapter 11 Global AI Red Teaming Services Market Outlook, 2025-2035
- 11.1 Market Size and Analysis
- 11.1.1 Revenue (Market Measurement: 2025: USD 336.0 million → 2035: USD 3.13 billion)
- 11.1.2 Historical Market Size, 2018-2025
- 11.1.3 Base-Year Market Size, 2025
- 11.2 Market Forecast, 2025-2035
- 11.2.1 Revenue Forecast to 2035
- 11.2.2 CAGR and Year-on-Year Growth
- 11.2.3 Incremental Revenue Opportunity
- 11.3 Forecast Assumptions and Scenario Analysis
- 11.3.1 Base-Case Forecast
- 11.3.2 Optimistic and Conservative Scenarios
- 11.3.3 Technology, Pricing and Policy Sensitivities
- 11.4 Market Attractiveness and Growth Outlook
Chapter 12 Global AI Red Teaming Services Market Segmentation and Outlook
- 12.1 Segmentation Summary and Market Shares, 2025
- 12.2 Largest and Fastest-Growing Segments
- 12.3 By Service - Market Size and Forecast, 2025-2035
- 12.3.1 Segment Definition and Scope
- 12.3.2 Historical Market Size, 2018-2025
- 12.3.3 Revenue Forecast, 2025-2035
- 12.3.4 Base-Year Market Share, 2025
- 12.3.5 Segment CAGR and Growth Drivers
- 12.3.6 Subsegment Market Size and Forecast
- 12.3.6.1 Manual Red Teaming
- 12.3.6.2 Automated Adversarial Testing
- 12.3.6.3 Certification
- 12.3.7 Subsegment Pricing and Adoption Trends
- 12.3.8 Leading Suppliers and Competition
- 12.3.9 Regional Demand and Opportunities
- 12.4 By Buyer - Market Size and Forecast, 2025-2035
- 12.4.1 Segment Definition and Scope
- 12.4.2 Historical Market Size, 2018-2025
- 12.4.3 Revenue Forecast, 2025-2035
- 12.4.4 Base-Year Market Share, 2025
- 12.4.5 Segment CAGR and Growth Drivers
- 12.4.6 Subsegment Market Size and Forecast
- 12.4.6.1 Enterprises
- 12.4.6.2 Model Labs
- 12.4.6.3 Governments
- 12.4.7 Subsegment Pricing and Adoption Trends
- 12.4.8 Leading Suppliers and Competition
- 12.4.9 Regional Demand and Opportunities
- 12.5 By Industry - Market Size and Forecast, 2025-2035
- 12.5.1 Segment Definition and Scope
- 12.5.2 Historical Market Size, 2018-2025
- 12.5.3 Revenue Forecast, 2025-2035
- 12.5.4 Base-Year Market Share, 2025
- 12.5.5 Segment CAGR and Growth Drivers
- 12.5.6 Subsegment Market Size and Forecast
- 12.5.6.1 Tech
- 12.5.6.2 BFSI
- 12.5.6.3 Healthcare
- 12.5.7 Subsegment Pricing and Adoption Trends
- 12.5.8 Leading Suppliers and Competition
- 12.5.9 Regional Demand and Opportunities
- 12.6 Segment Growth Comparison
- 12.7 Segment Attractiveness and Priority Matrix
Chapter 13 Global AI Red Teaming Services End-Use and Application Market Outlook
- 13.1 End-Use Industry and Customer Demand Structure
- 13.2 Leading Applications and Customer Groups
- 13.3 End-Use Market Size, Share and Forecast
- 13.4 Major End-Use Industry Deep Dives
- 13.4.1 Customer Requirements and Use Cases
- 13.4.2 Demand and Replacement Cycles
- 13.4.3 Technical and Regulatory Considerations
- 13.4.4 Purchasing and Procurement Models
- 13.4.5 Leading Vendors and Distribution Channels
- 13.4.6 Forecast and Commercial Opportunities
- 13.5 Emerging Applications and Cross-Segment Demand
- 13.6 End-Use Industry Investment Priorities
Chapter 14 Global AI Red Teaming Services Geographic Market Outlook, 2025-2035
- 14.1 Regional Market Size and Share, 2025
- 14.2 Regional Market Forecast, 2025-2035
- 14.3 Regional Pricing, Production and Demand Differences
- 14.4 North America
- 14.4.1 United States
- 14.4.2 Canada
- 14.4.3 Mexico
- 14.5 Europe
- 14.5.1 Germany
- 14.5.2 France
- 14.5.3 Italy
- 14.5.4 United Kingdom
- 14.5.5 Spain
- 14.5.6 Poland
- 14.5.7 Russia
- 14.5.8 Netherlands
- 14.5.9 Belgium
- 14.5.10 Sweden
- 14.5.11 Denmark
- 14.5.12 Norway
- 14.5.13 Rest of Europe
- 14.6 Asia Pacific
- 14.6.1 China
- 14.6.2 India
- 14.6.3 Japan
- 14.6.4 South Korea
- 14.6.5 Thailand
- 14.6.6 Indonesia
- 14.6.7 Vietnam
- 14.6.8 Malaysia
- 14.6.9 Australia
- 14.6.10 Rest of Asia Pacific
- 14.7 Latin America
- 14.7.1 Brazil
- 14.7.2 Argentina
- 14.7.3 Colombia
- 14.7.4 Chile
- 14.7.5 Rest of Latin America
- 14.8 Middle East
- 14.8.1 Saudi Arabia
- 14.8.2 United Arab Emirates
- 14.8.3 Turkey
- 14.8.4 Israel
- 14.8.5 Iran
- 14.8.6 Rest of the Middle East
- 14.9 Africa
- 14.9.1 South Africa
- 14.9.2 Egypt
- 14.9.3 Nigeria
- 14.9.4 Morocco
- 14.9.5 Rest of Africa
- 14.10 Regional Investment, Policy and Supply Chain Differences
- 14.11 Regional Competitive Landscape
- 14.12 Geographic Growth Hotspots
Chapter 15 Global AI Red Teaming Services Technology, Innovation and Sustainability Outlook
- 15.1 Technology Landscape and Maturity
- 15.2 Product, Process and Service Innovation
- 15.3 AI, Automation and Digital Tools in the Industry
- 15.4 Technology Adoption and Performance Benchmarking
- 15.5 Innovation Pipeline and R&D Investment
- 15.6 Energy Efficiency and Resource Management
- 15.7 Sustainability, Recycling and Circularity
- 15.8 Technology Roadmap, 2025-2035
- 15.9 Risks of Obsolescence and Technology Substitution
Chapter 16 Global AI Red Teaming Services Market Key Strategic Imperatives
- 16.1 Growth and Market Entry Priorities
- 16.2 High-Return Products and Segments
- 16.3 Pricing, Profitability and Cost Optimization
- 16.4 Technology Investment and Product Differentiation
- 16.5 Supply Chain Localization and Resilience
- 16.6 Distribution and Customer Acquisition
- 16.7 Partnership, Acquisition and Capacity Strategy
- 16.8 Regional Expansion Priorities
- 16.9 Short-, Medium- and Long-Term Actions
Chapter 17 Competition Outlook
- 17.1 Industry Competition Characteristics
- 17.2 Market Structure and Concentration
- 17.3 Market Share and Competitive Positioning, 2025
- 17.4 Company-Wise Revenue and Product Benchmarking
- 17.5 Production and Service Capacity Benchmarking
- 17.6 Technology, Pricing and Differentiation
- 17.7 Regional Footprint and Distribution Strength
- 17.8 Mergers, Acquisitions and Strategic Alliances
- 17.9 New Entrants and Competitive Threats
- 17.10 Porter's Five Forces and Industry Attractiveness
- 17.11 Competitive Outlook, 2025-2035
Chapter 18 Company Profiles
- 18.1 Company Coverage and Selection Criteria
- 18.2 HiddenLayer
- 18.2.1 Business Description
- 18.2.2 Company Ownership and Geographic Presence
- 18.2.3 Product and Service Portfolio
- 18.2.4 Manufacturing and Operating Footprint
- 18.2.5 Financial Performance and Investment
- 18.2.6 Market Share and Competitive Position
- 18.2.7 Technology and Innovation Capabilities
- 18.2.8 Strategic Alliances or Partnerships
- 18.2.9 Recent Developments
- 18.2.10 Growth Strategy and Outlook
- 18.3 Haize Labs
- 18.4 Lakera (Check Point)
- 18.5 Mindgard
- 18.6 Cisco (Robust Intelligence)
- 18.7 Palo Alto Networks (Protect AI)
- 18.8 F5 (CalypsoAI)
- 18.9 Other Relevant Market Participants
Note: Every listed company is profiled on the structure shown under the first company. The company list is preliminary and may change based on research findings, market developments, data availability and client requirements.
Chapter 19 Disclaimer
- 19.1 Research and Forecast Disclaimer
- 19.2 Data Source and Estimation Limitations
Note: The depth of individual sections depends on data availability for this market. Volume, capacity, trade and other unit-based metrics are included where applicable.

