
Anti-scam rules turn security into a board priority
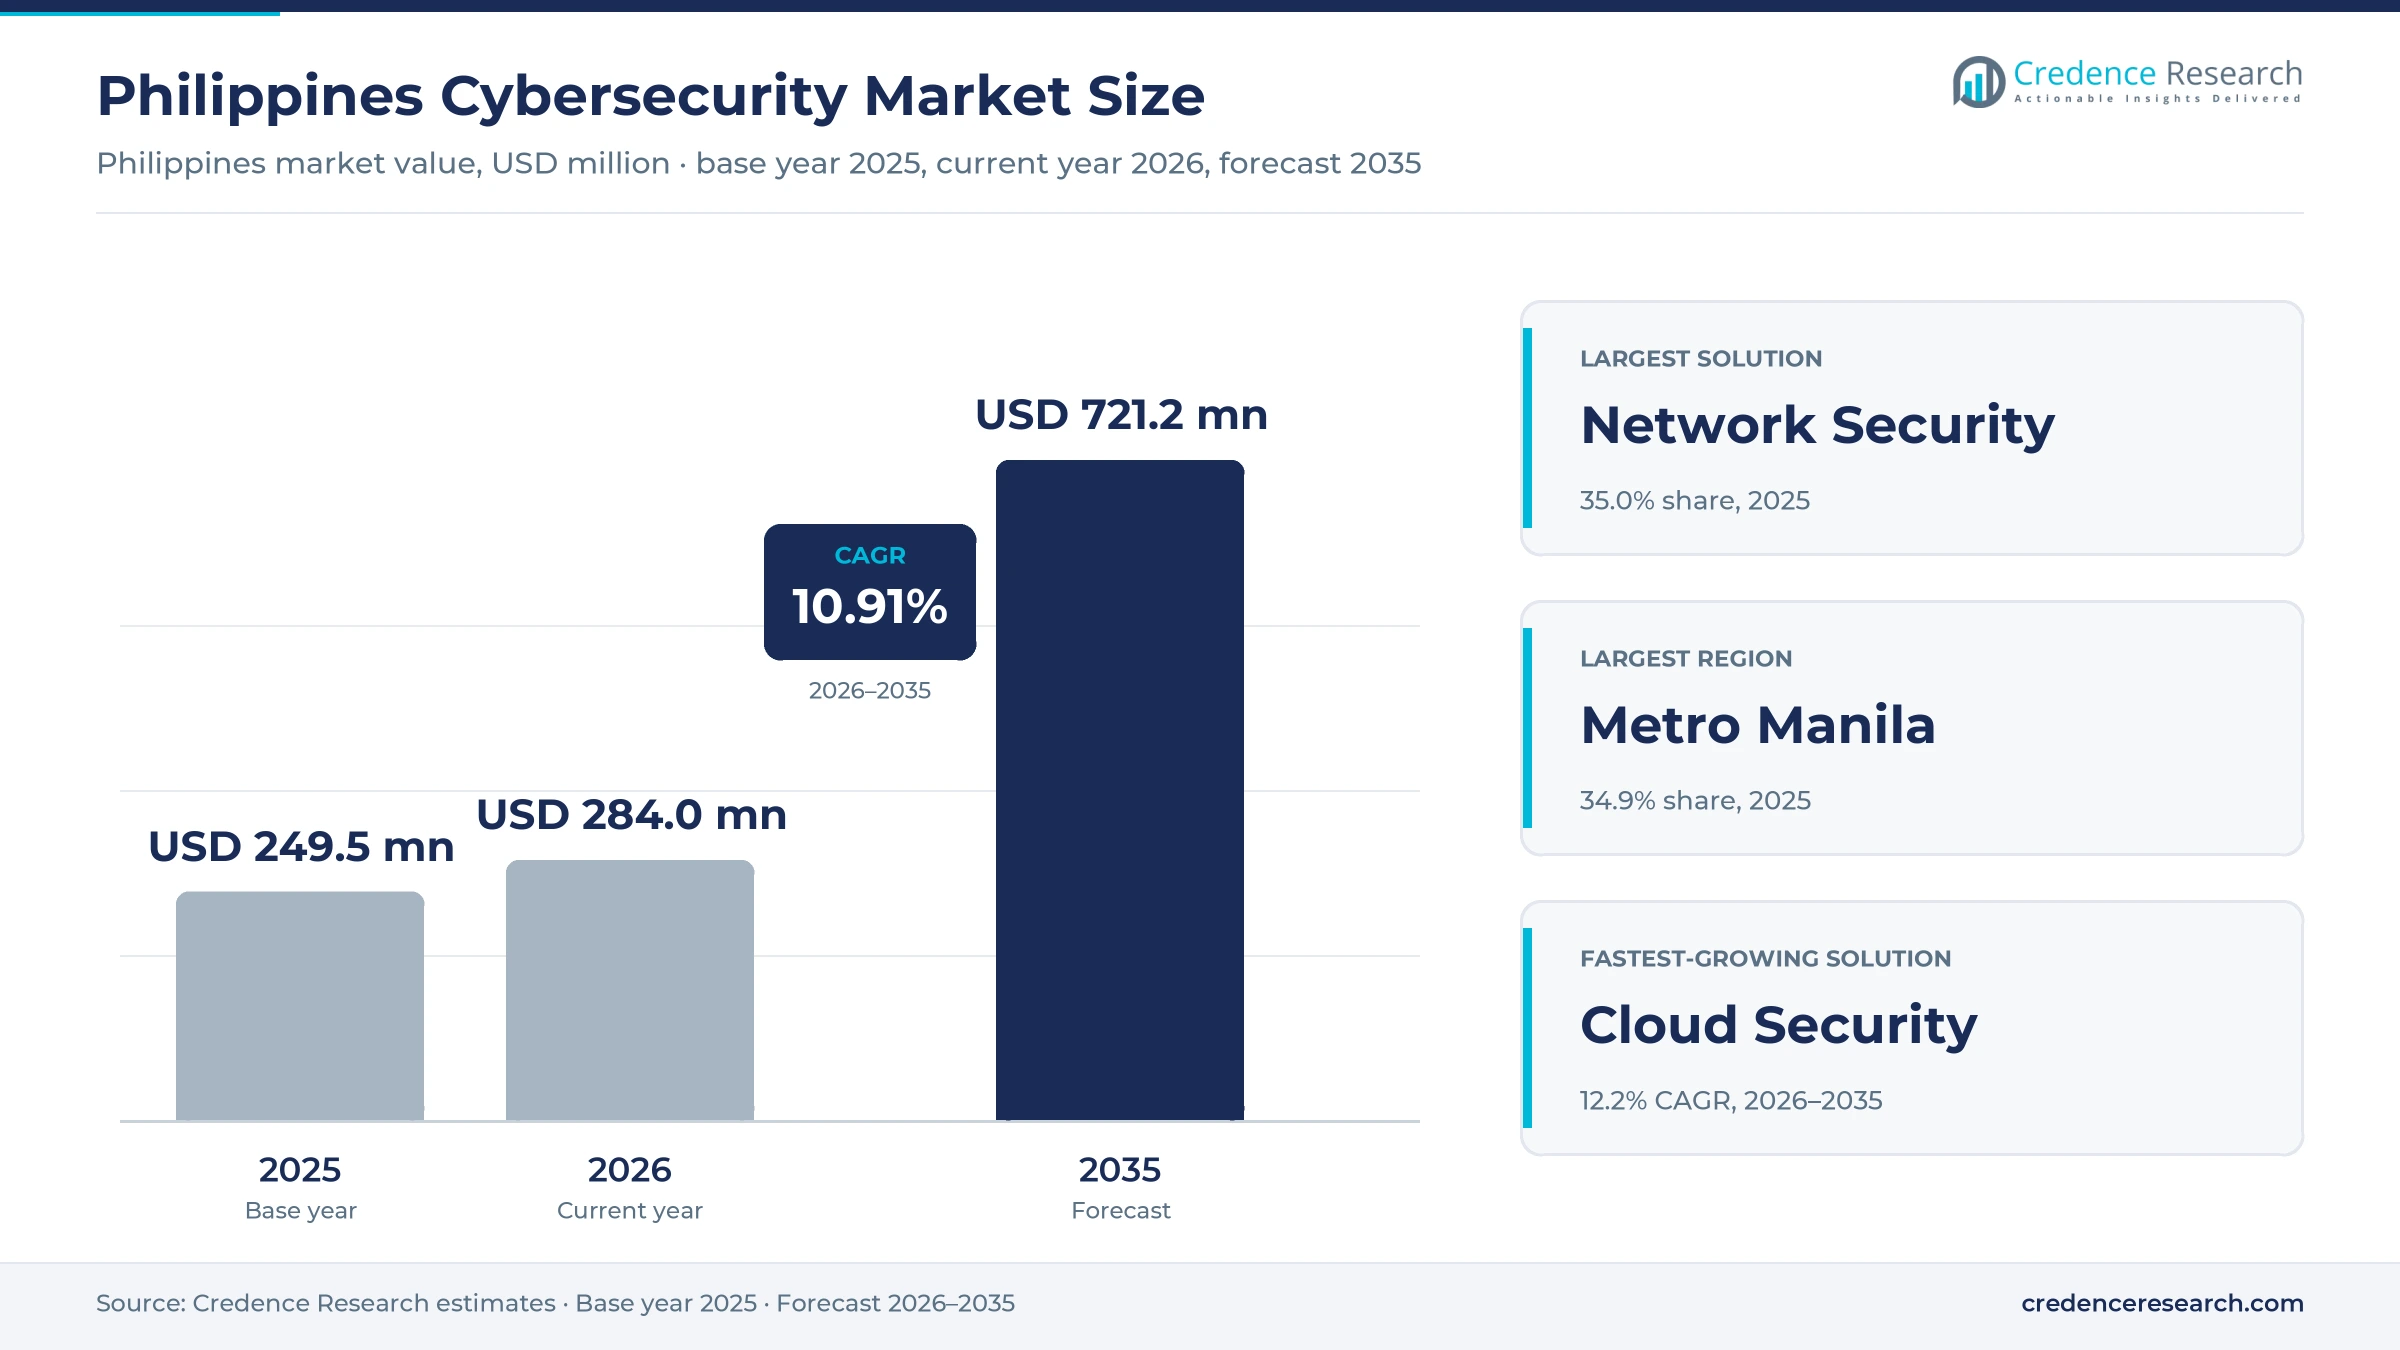
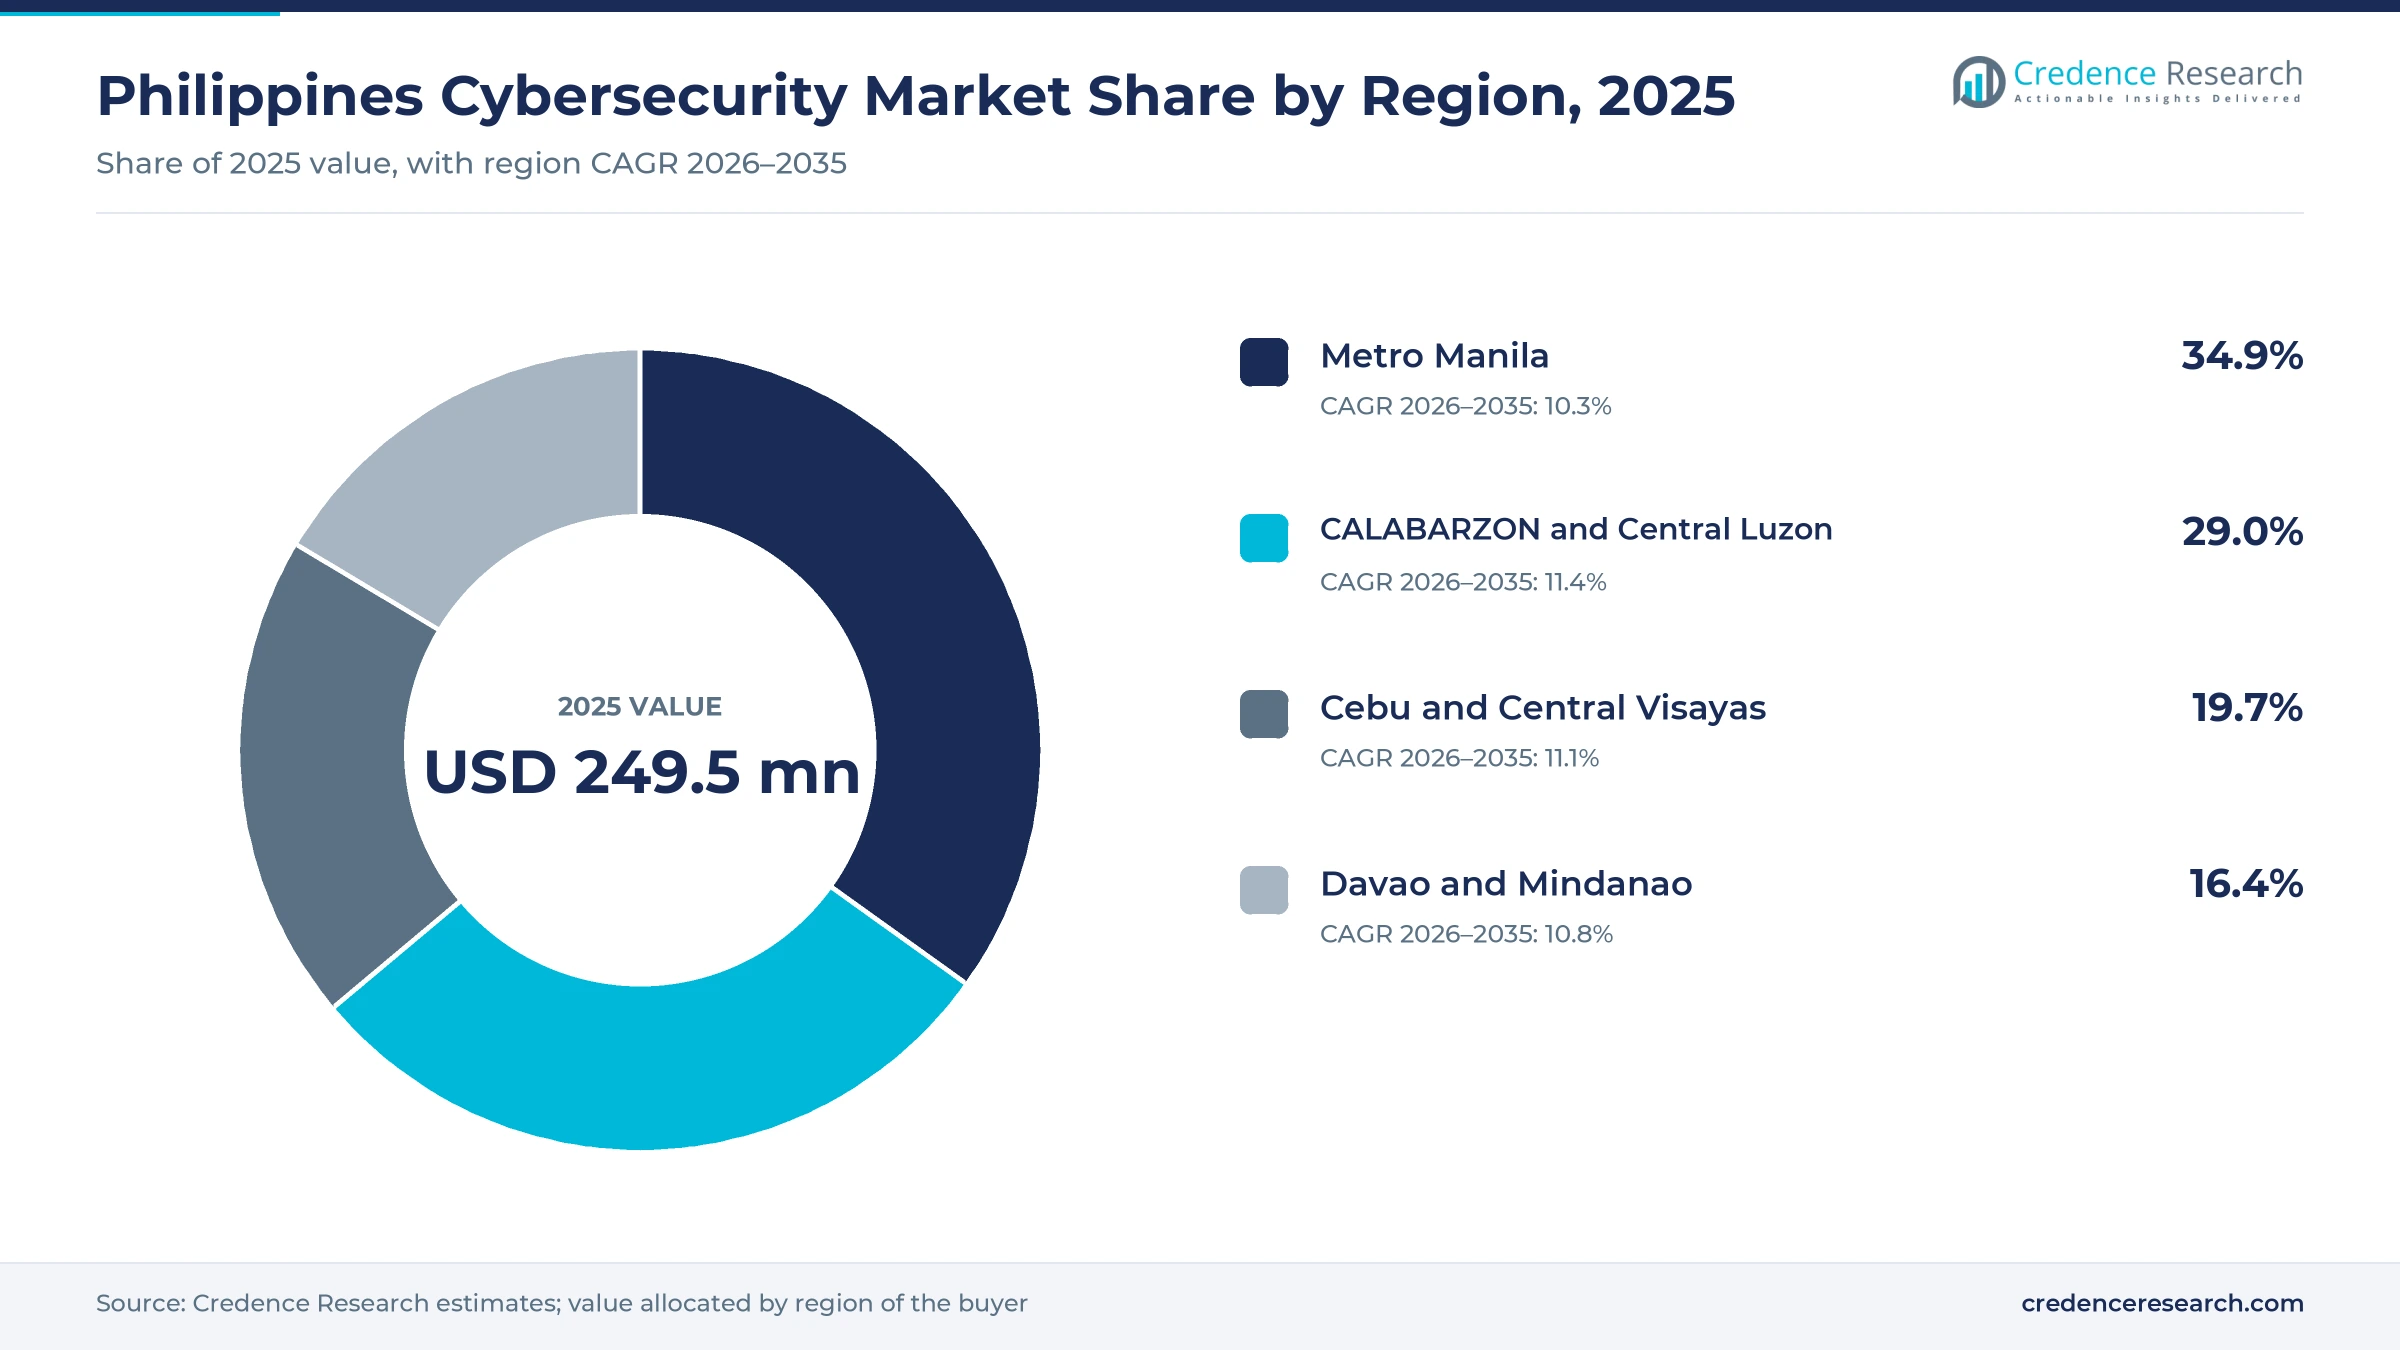
The Philippines cybersecurity market was valued at USD 249.5 million in 2025 and is projected to increase from USD 284.0 million in 2026 to USD 721.2 million by 2035, registering a CAGR of 10.91% during 2026–2035. Spending comes from banks and e-wallets that must meet new anti-scam rules, IT-BPM and telecom operators that protect client and network data, and government agencies carrying out the national cybersecurity plan. Metro Manila held the largest regional share, 34.9% in 2025, because bank headquarters, regulators and most enterprise security buyers sit in the capital. CALABARZON and Central Luzon is the fastest-growing region at 11.4% a year, as hyperscale data centers in Laguna and Cavite pull security spending beyond the capital. The sharpest commercial change is in authentication, since covered banks and e-wallets had to replace text and email one-time passwords for high-risk transactions by June 2026, which moves budgets toward identity, fraud analytics and managed monitoring.
Where does Philippine security spending go, and who pays for it?
The market counts spending by Philippine organizations on network security, endpoint and extended detection, cloud security and identity and access management, whether bought as licenses, subscriptions or managed services. Buyers include banks, e-wallet operators, IT-BPM firms, telecom carriers, national agencies, hospitals and retailers. Most purchases flow through local partners and telecom groups that bundle vendor platforms with monitoring, integration and incident response.
The estimate excludes consumer antivirus sold to households, physical security systems such as CCTV, and general IT services that carry no security scope. Value is counted at the price the end buyer pays, so global vendors, local distributors, integrators and managed service providers all share in the same sale.
Philippines Cybersecurity Market Insights
- The market grows from USD 249.5 million in 2025 to USD 721.2 million by 2035, a 10.91% pace that lifts spending about 2.5 times from its 2026 base of USD 284.0 million.
- Metro Manila led with 34.9% of 2025 value, while CALABARZON and Central Luzon grows fastest at 11.4% a year on data center construction.
- Financial Services held 32.0% of 2025 value, because BSP-supervised institutions lost P5.82 billion to cyberattacks in 2024 and now face strict authentication rules.
- Covered banks and e-wallets had to replace SMS and email one-time passwords for high-risk transactions by June 25, 2026, under BSP Circular No. 1213.
- Telecom groups ePLDT and Globe Business resell global platforms with local monitoring, which makes managed services the main route for mid-market buyers.
Network tools, in-house systems and banks lead spending
Why do network tools still take the largest share?
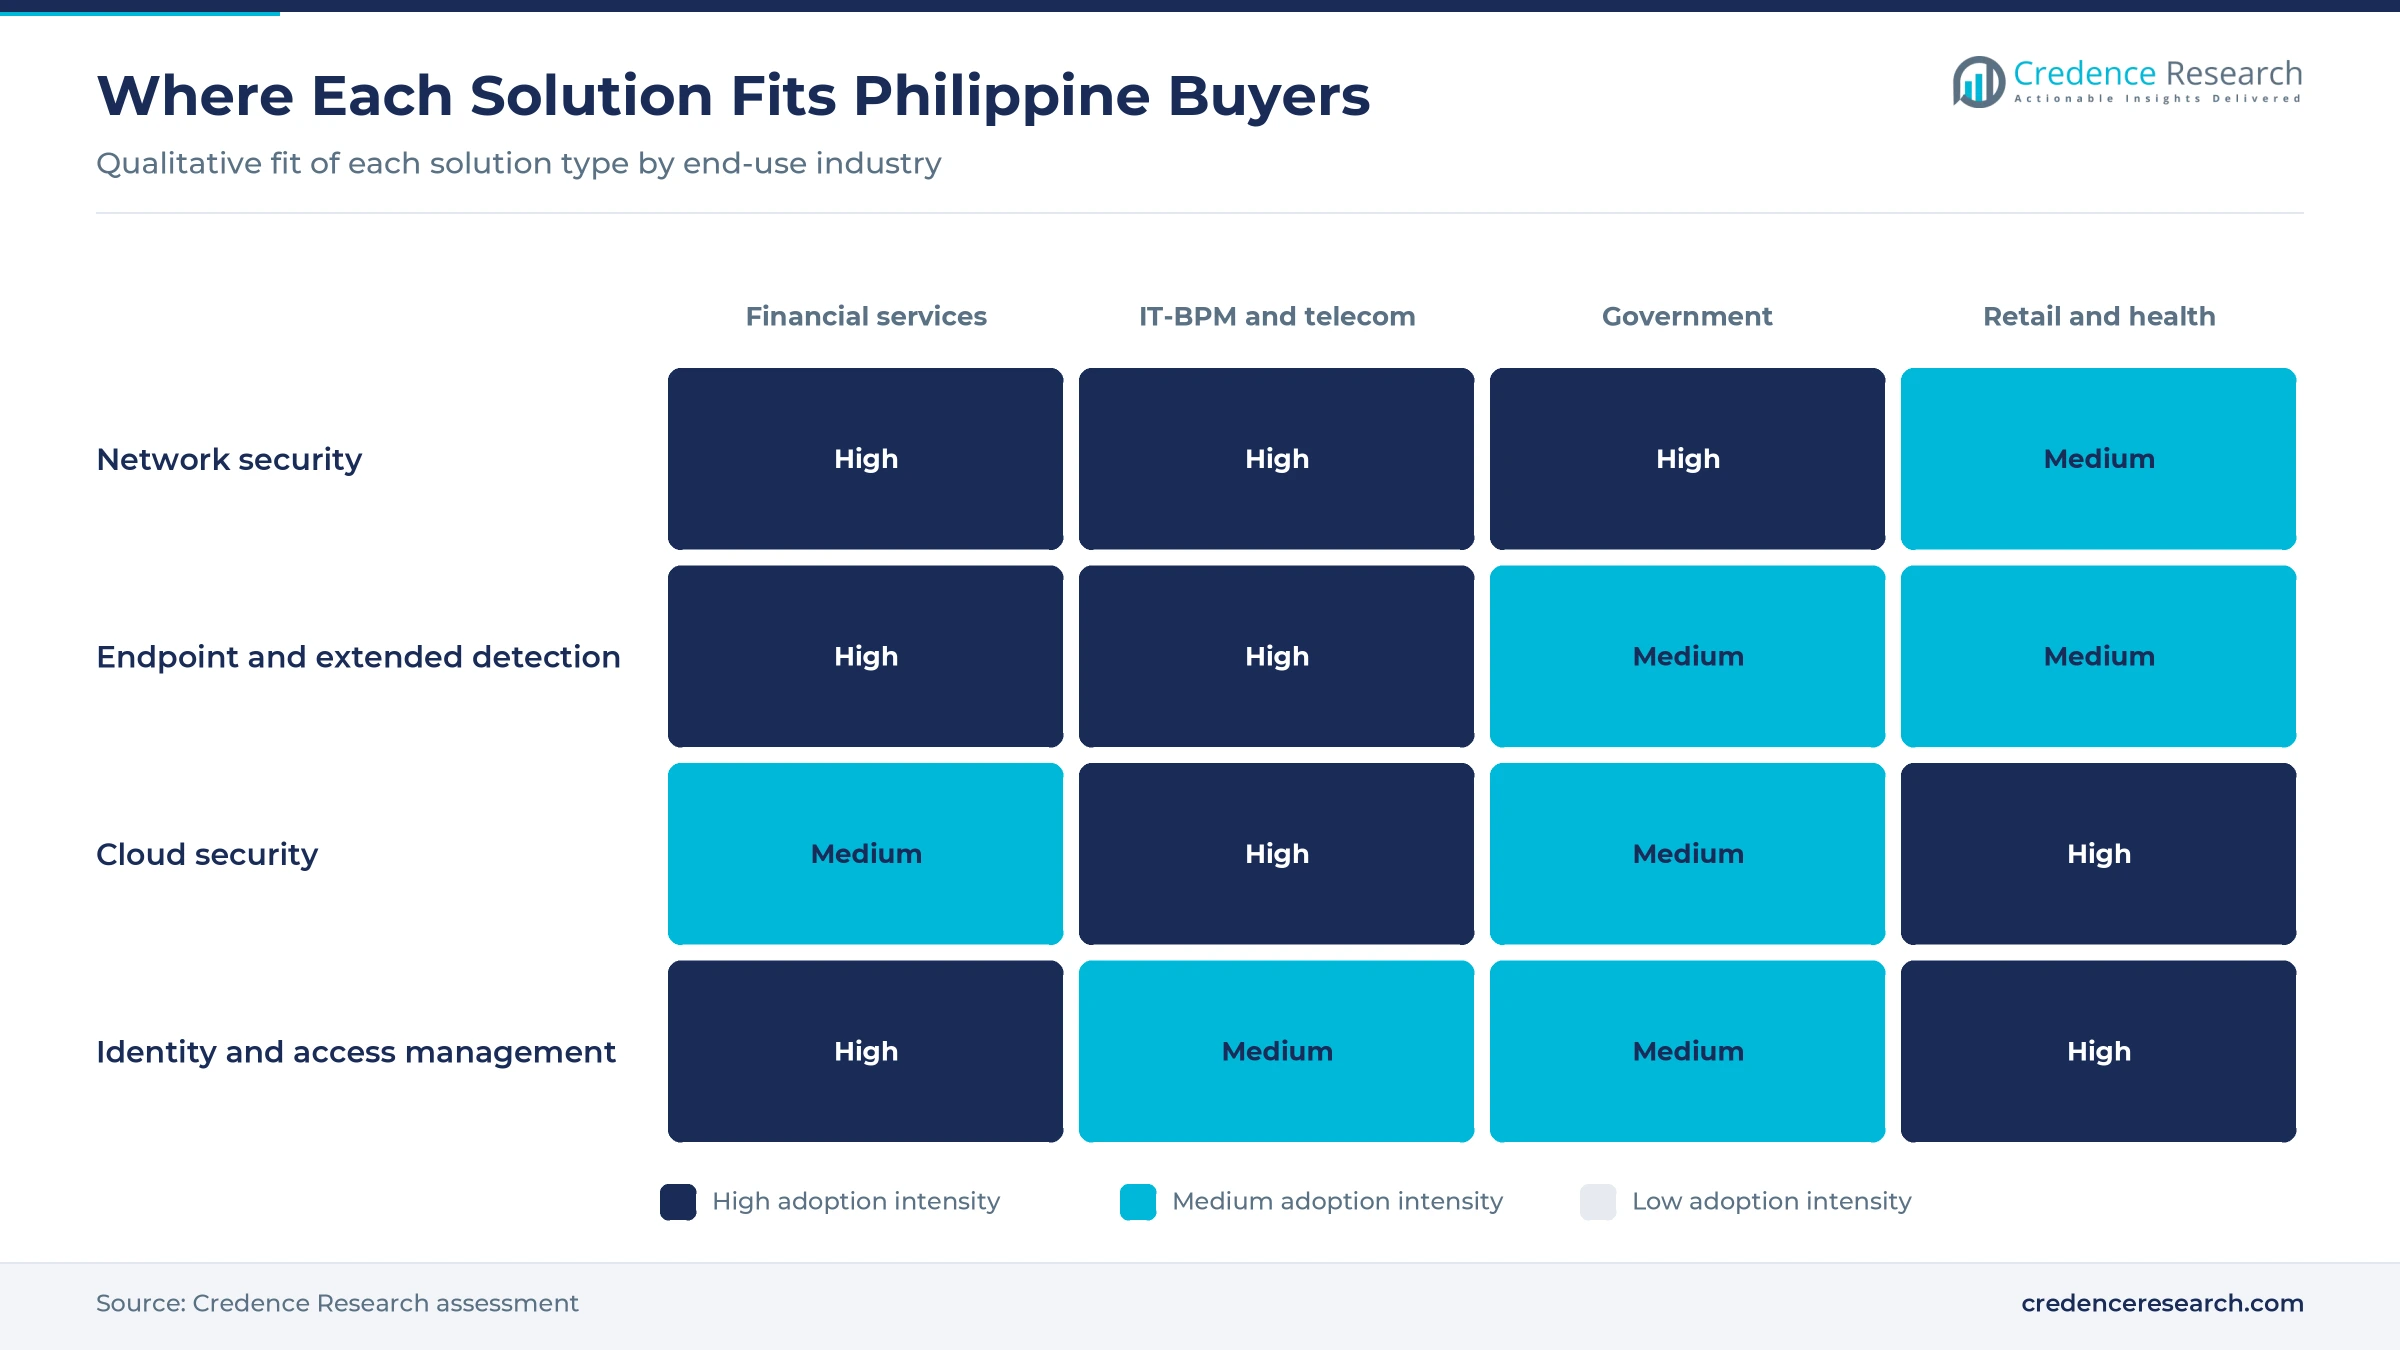
Based on solution type, the market is categorized into network security, endpoint and extended detection, cloud security and identity and access management. Network Security led with 35.0% of 2025 value because carriers, banks and agencies still anchor budgets on firewalls and secure gateways, and the Konektadong Pinoy Act, which lapsed into law Aug. 24, 2025, requires data transmission operators to obtain ISO-based or DICT cybersecurity certification within two years of registration. Cloud Security grows fastest at 12.2% a year as workloads move to new capacity, with members of the Data Center Operators of the Philippines running nearly 500 MW in February 2026. Firewall vendors that bundle cloud controls into their platforms keep their share.
How fast are buyers moving security to the cloud?
Based on deployment model, the market is categorized into on-premises, public cloud, private cloud and hybrid cloud. On-Premises deployments led with 37.0% of 2025 value because banks and agencies still run security inside their own server rooms, and Davao City alone proposed in August 2026 to merge 17 to 19 isolated departmental server rooms into one central data center. Public Cloud grows fastest at 12.1% a year as hyperscale supply deepens, since Amazon Web Services is exploring a Philippine cloud region with an investment of up to USD 5 billion over 15 years. Cloud-delivered controls will follow those workloads as tenants move out of in-house rooms.
Which industries carry the heaviest security budgets?
Based on end-use industry, the market is categorized into financial services, IT-BPM and telecommunications, government and public services, and retail, healthcare and digital commerce. Financial Services led with 32.0% of 2025 value because losses are largest there, as BSP-supervised institutions lost P5.82 billion to cyberattacks in 2024, according to figures cited at a Makati Business Club and IBM roundtable in September 2025. Government and Public Services grows fastest at 11.9% a year as the House sponsor of the DICT budget said in September 2025 that lawmakers had raised its 2026 security allocation by P1 billion, with P812 million for the National Security Operations Center. Agency tenders will therefore set the pace for local integrators.
Why are managed retainers gaining on seat licenses?
Based on pricing model, the market is categorized into per-user subscription, per-endpoint subscription, usage-based cloud security and managed-service retainer. Per-User Subscription pricing led with 33.0% of 2025 value because identity and productivity security is sold by the seat, with Microsoft listing Entra ID P1 at USD 7 per user a month in November 2026. Managed-Service Retainer contracts grow fastest at 11.8% a year as buyers outsource monitoring, and Globe Business partnered with Singapore-based Blackpanda in September 2025 to sell IR-1 incident response subscriptions nationwide. Retainers suit firms that employ few or no in-house security analysts.
| Segment Group | Leading Sub-segment | Share, 2025 | Fastest-growing Sub-segment | CAGR, 2026–2035 |
|---|---|---|---|---|
| By Solution Type | Network Security | 35.0% | Cloud Security | 12.2% |
| By Deployment Model | On-Premises | 37.0% | Public Cloud | 12.1% |
| By End-Use Industry | Financial Services | 32.0% | Government and Public Services | 11.9% |
| By Pricing Model | Per-User Subscription | 33.0% | Managed-Service Retainer | 11.8% |
Seat licenses set entry prices, retainers set big tickets
Philippine buyers pay for security in three ways, by the seat, by the device and by the retainer. Seat prices are set globally in U.S. dollars, so Microsoft’s identity and detection suites list at USD 7 to 12 per user a month, and the peso exchange rate moves local cost more than vendor list changes do. Incident response is the expensive end, since traditional retainers run USD 25,000 to 100,000, which prices out most mid-market firms. Telecom groups and managed providers close that gap by pooling analysts across many clients, which is why bundled subscriptions win small buyers while large banks negotiate enterprise agreements directly.
| Offer | Typical price or fee | Basis |
|---|---|---|
| Microsoft Entra ID P1, identity and access | USD 7.00 per user a month, billed yearly | Microsoft U.S. list price, viewed November 2026 |
| Microsoft Entra ID P2, identity protection and governance | USD 10.00 per user a month, billed yearly | Microsoft U.S. list price, viewed November 2026 |
| Microsoft Defender Suite, extended detection and response | USD 12.00 per user a month, billed yearly | Microsoft U.S. list price, viewed November 2026 |
| Microsoft Entra Suite, identity plus network access | USD 12.00 per user a month, billed yearly | Microsoft U.S. list price, viewed November 2026 |
| Traditional incident response retainer | USD 25,000 to 100,000 (about P1.5 million to P6 million) | Daily Tribune, September 2025 |
| Ad hoc incident response | Up to USD 500 per hour | Daily Tribune, September 2025 |
Request a Free Sample
Fill in your details and we'll send you a free sample report.
- Sample data tables & charts
- Research methodology
Payments, regulation and data centers drive spending
Digital payments and anti-scam rules push banks to spend
The move of everyday payments to digital channels widens the attack surface that banks, e-wallets and merchants must defend. Digital transactions made up 57.4% of retail payment volume in 2024, up from 52.8% a year earlier, according to Bangko Sentral ng Pilipinas data reported by BitPinas, so more of the country’s commerce now runs through systems that attackers can reach remotely. Fraud has followed the money, since the Cybercrime Investigation and Coordinating Center logged 18,633 complaints in 2025, with consumer fraud the largest category, GMA News reported in January 2026. Republic Act No. 12010, the Anti-Financial Account Scamming Act signed in July 2024, requires supervised institutions to strengthen fraud prevention and lets them temporarily hold disputed funds. These pressures put fraud tools first in bank budgets as digital payments keep growing.
National plan and privacy rules make security mandatory
Public policy turns security from an optional purchase into a compliance obligation for agencies and regulated firms. Executive Order No. 58, signed April 4, 2024, directs national agencies and government-owned corporations to adopt cybersecurity plans consistent with the National Cybersecurity Plan 2023–2028 and requires the DICT to report progress twice a year. The National Privacy Commission’s Advisory No. 2026-02 of May 2026 requires a full breach report within five days of discovery, Baker McKenzie noted in June 2026. Progress is measurable, as the country rose to Tier 2 with 93.49 points in the ITU Global Cybersecurity Index 2024, up from 77 in 2020 and 1.51 points short of Tier 1, The Manila Times reported. Each requirement creates recurring spending on monitoring, audits and response that does not depend on a single incident.
Data centers and IT-BPM growth widen what must be protected
New data center capacity and a larger IT-BPM workforce add systems, identities and client contracts that require protection. IT-BPM export revenues exceeded USD 40 billion in 2025, up 5%, and the IT and Business Process Association of the Philippines projects about 1.97 million workers by the end of 2026, the Philippine Daily Inquirer reported. Foreign clients audit these operations against their own standards, which pushes providers to buy endpoint, identity and monitoring tools. The DICT also targets 1.5 GW of new data center capacity by the end of 2027, the Manila Bulletin reported in February 2026. Amazon Web Services already runs a Manila Local Zone, and Globe signed a multi-year collaboration with AWS on Nov. 6, 2025. Each new campus adds tenants that need cloud and network controls.
A sharp rise in phishing and ransomware raises urgency
Attack volumes are rising faster than most organizations can absorb, which turns security from a budget line into an operating priority. Check Point Software Technologies counted 3,824 phishing websites targeting the Philippines in 2025, up 423% from 731 in 2024, The Philippine Star reported in February 2026, and third-party breach incidents rose from 8 to 29. Ransomware is accelerating, since 31 public claims hit Philippine organizations from January to August 2026, more than the 26 logged across 2024 and 2025 combined, according to the company’s 2026 threat report as covered by the Daily Tribune. Government agencies recorded the highest attack volume, with 72 incidents. Rising incident counts lift spending on detection and response, and they favor suppliers that can offer round-the-clock monitoring.
Passwordless login and telecom services reshape demand
Shift from one-time passwords to biometric and passwordless login
Authentication is shifting away from codes sent by text or email, which scammers intercept easily. Under BSP Circular No. 1213, banks and e-wallets averaging more than P75 million in monthly online transactions had to adopt biometric, behavioral or passwordless methods for high-risk transactions by June 25, 2026. The same rules required covered institutions to upgrade fraud management systems with behavioral anomaly, geolocation and device-change monitoring. In March 2026, the central bank proposed server-side biometric authentication for high-risk transactions and major account changes, BusinessWorld reported. This shift moves budgets toward identity, device intelligence and fraud analytics, where vendors with local integration partners have an edge over those selling from regional offices.
Rise of telecom-led managed detection and response
Telecom groups are emerging as the main channel for security services, because they already own the client relationship and network visibility. ePLDT, the ICT arm of the PLDT Group, was recognized as a Microsoft Solutions Partner for Security in November 2025 and offers threat detection, incident response and remediation on Microsoft tools, InsiderPH reported. Globe Business sells detection and response built on the Secureworks Red Cloak analytics platform, Malaya Business Insight reported. Demand for outsourced monitoring is strong, as a Sophos survey published in September 2025 found that 89% of Philippine organizations experienced cybersecurity burnout, losing an average of 4.2 hours per employee each week. Bundling security with connectivity lowers acquisition cost for carriers, so managed security services should keep gaining share of new contracts.
Opening for security operations services in IT-BPM hubs
IT-BPM providers offer an opening for managed security, because their clients demand round-the-clock monitoring that most providers cannot staff alone. Attacks on Philippine BPO firms rose 217% year over year, according to an ASEAN threat report cited by ZigZag Philippines in August 2025. Pressure is broad, since Cisco’s 2025 Cybersecurity Readiness Index found that 54% of Philippine organizations faced cyberattacks in the past year, and ZigZag Philippines launched a managed security operations center service for this demand in August 2025. EY Global Delivery Services launched an AI-powered cybersecurity center in Cebu, the Daily Tribune reported on July 1, 2026, built on CrowdStrike, Zscaler, Tanium and Cyble technologies. Providers that pair local analysts with automation can win domestic contracts and offshore delivery work at once.
Opening for securing AI tools and industrial systems
AI adoption and industrial digitization open a second growth pool beyond classic IT security. The same Cisco index found that 85% of Philippine organizations had an AI-related security incident in the past year, while only 6% reached the mature readiness level, up from 1%. Palo Alto Networks rolled out Prisma AIRS 3.0 and Prisma Browser for Business across ASEAN markets including the Philippines in April 2026, Context.ph reported. Industrial systems are exposed too, as Kaspersky ICS CERT found malicious objects blocked on 19.09% of Philippine industrial control computers in the second quarter of 2025. Vendors that secure AI agents, browsers and plant networks can sell into budgets that barely existed three years ago.
Talent gaps and thin budgets slow wider protection
Can the country close its security talent gap?
The shortage of skilled staff is the main brake on adoption, because tools fail without analysts to run them. Fortinet’s 2024 Cybersecurity Skills Gap report found that 94% of Philippine organizations suffered at least one breach in 2023 and that 77% linked breaches partly to missing skills. A Fortinet-commissioned survey published in June 2025 found fewer than one security expert per 100 employees. Training deals, such as Fortinet’s January 2025 agreement with Manila Central University, help but take years to scale.
Do tight budgets slow mid-market buyers?
Budgets remain thin outside banks and large groups, which limits how much protection most firms can buy. The same Fortinet survey found that security takes about 15% of IT budgets, equal to roughly 1.4% of revenue, among surveyed organizations. Dollar-denominated licenses and incident response fees of up to USD 500 an hour weigh heavily on peso budgets. Mid-market firms therefore delay upgrades or buy single tools, and carrier bundles are the most practical way to widen coverage.
Can public networks keep pace with organized ransomware groups?
Government networks are the most attacked and often the least modernized, which leaves public data exposed. Check Point’s 2026 report counted 15 ransomware groups posting claims against Philippine targets, with Qilin alone behind 29% of cases. Many local governments still run scattered departmental systems, the gap that the Davao City consolidation noted above is meant to close. Shared operations centers and the national public key infrastructure offer agencies the fastest fix.
Could compliance deadlines strain smaller banks and e-wallets?
Regulatory deadlines compress upgrade cycles, which strains institutions with small IT teams. The BSP gave covered institutions until June 2026 to strengthen fraud management systems after anti-scam implementing rules took effect June 25, 2025, and officials kept the deadline firm despite bank requests for extensions, BusinessWorld reported in March 2026. Rural and thrift banks below the P75 million threshold must still assess product risks regularly. Shared platforms and vendor-hosted fraud services offer smaller lenders the fastest route to compliance.
Metro Manila leads while its neighbors grow fastest
| Region | Value, 2025 (USD million) | Share, 2025 | CAGR, 2026–2035 |
|---|---|---|---|
| Metro Manila | 87.1 | 34.9% | 10.3% |
| CALABARZON and Central Luzon | 72.4 | 29.0% | 11.4% |
| Cebu and Central Visayas | 49.1 | 19.7% | 11.1% |
| Davao and Mindanao | 40.9 | 16.4% | 10.8% |
Metro Manila leads on regulators, banks and head offices
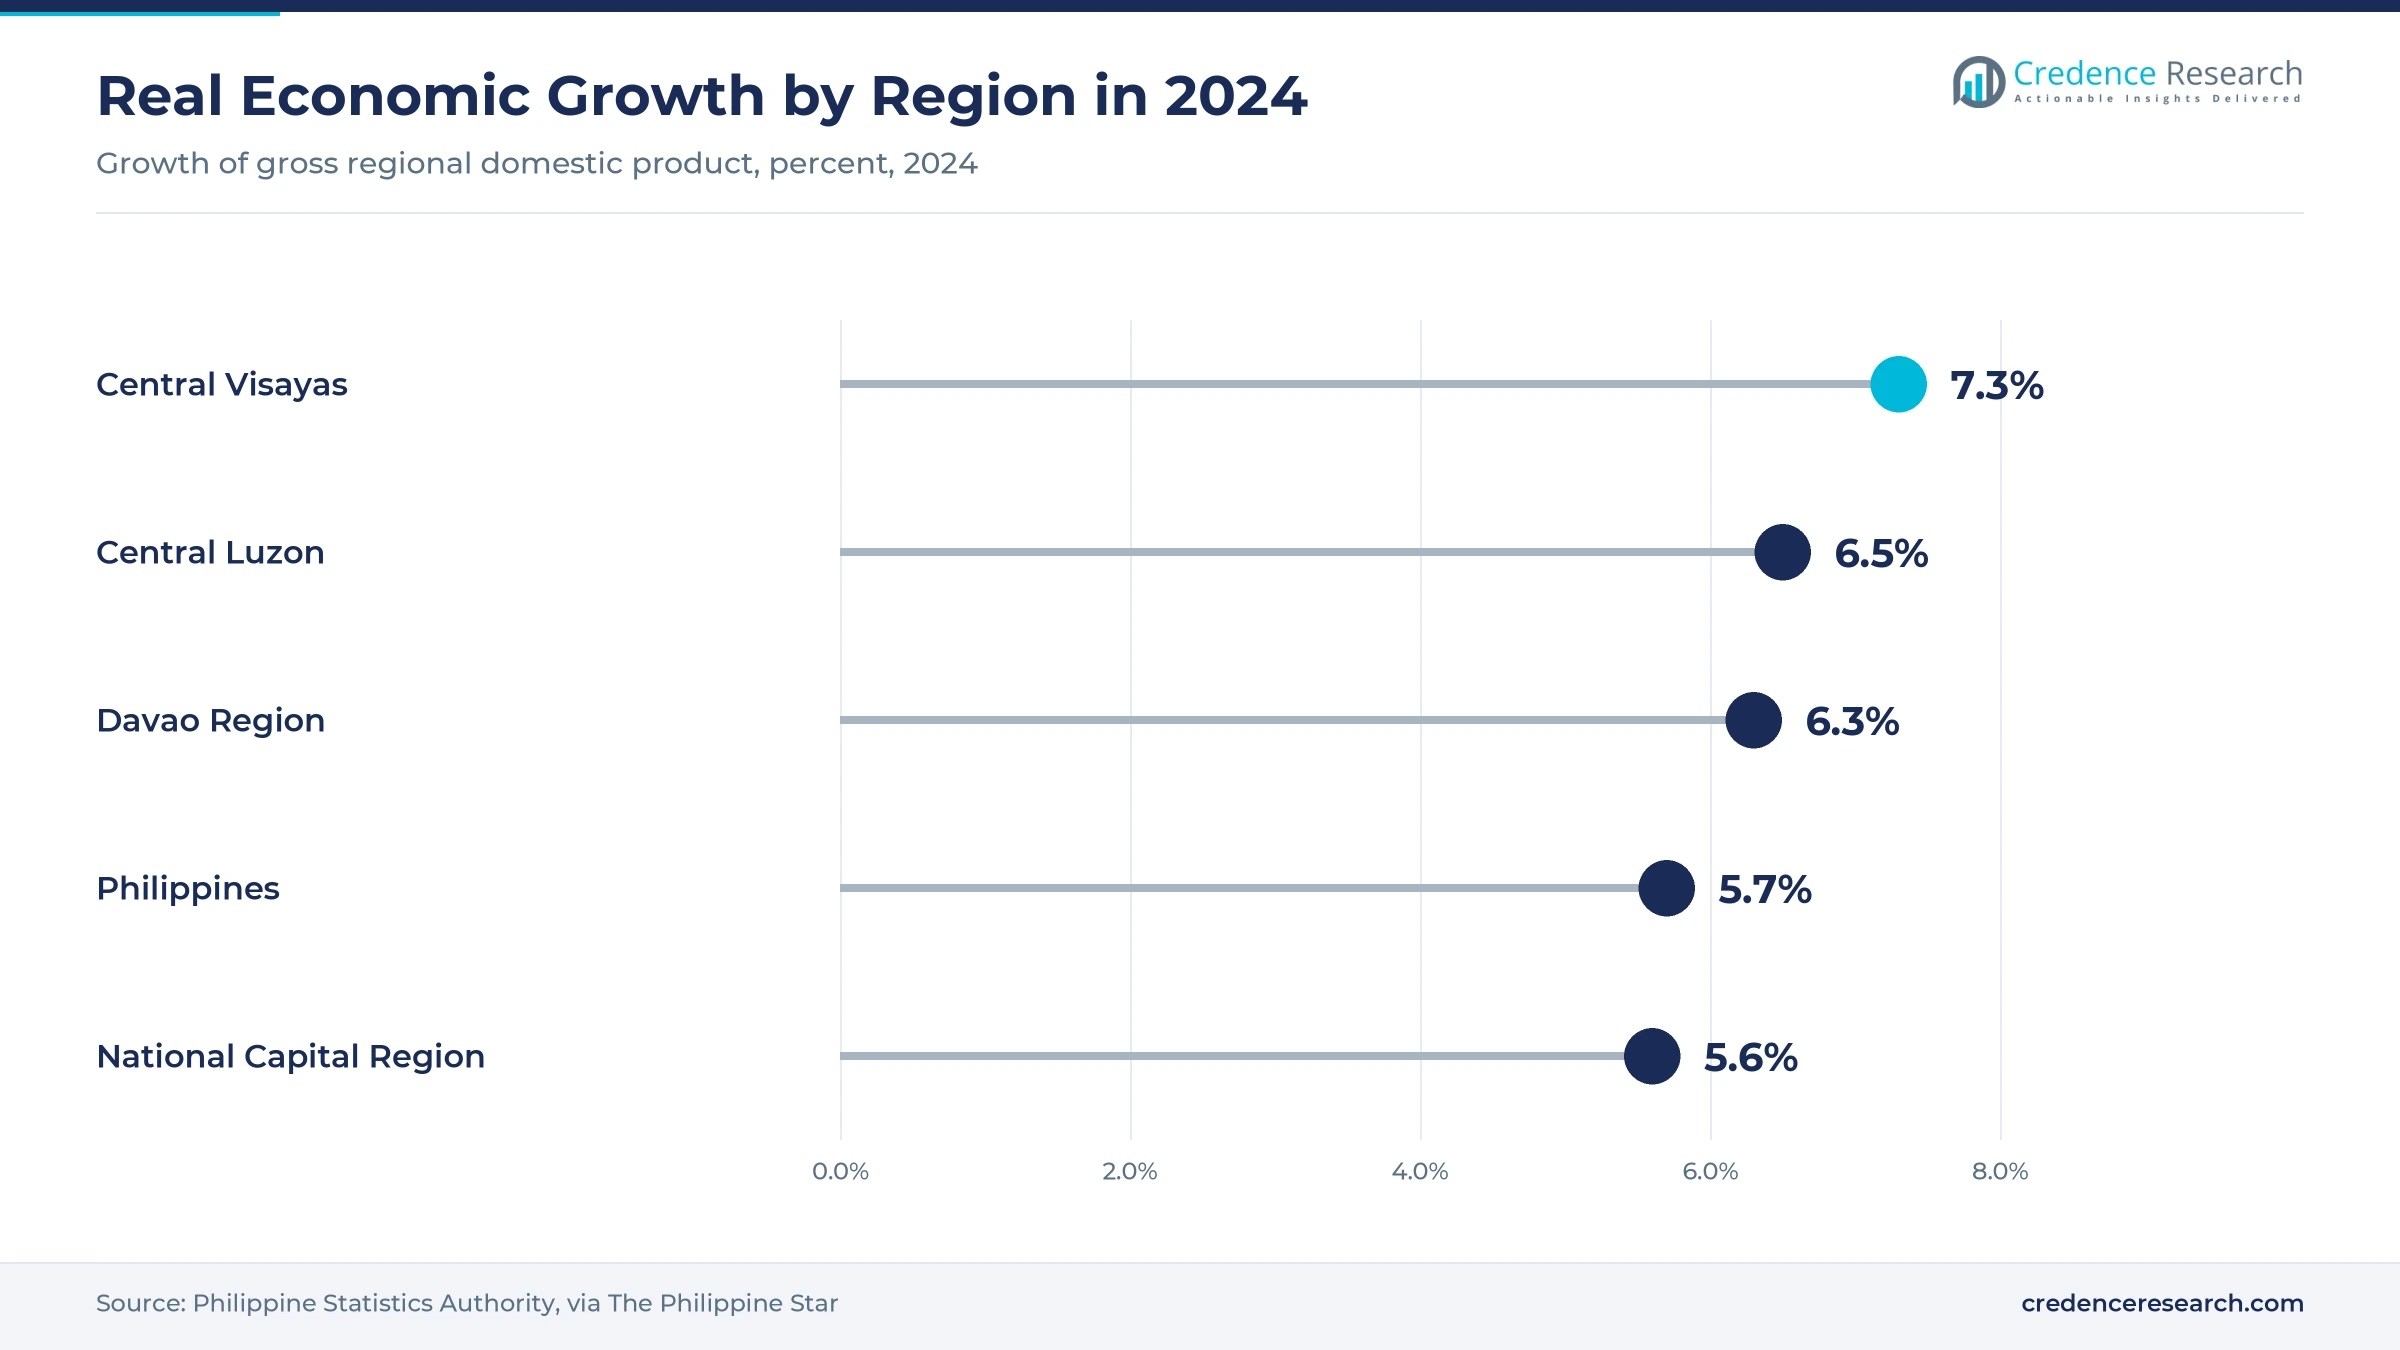
Metro Manila held a 34.9% share of 2025 value and grows at 10.3% a year. The National Capital Region produced 31.2% of national output in 2024 and grew 5.6%, according to the Philippine Statistics Authority, and it hosts the BSP, the DICT and the head offices of major banks, e-wallets and telecom groups. Most enterprise security contracts are signed here even when systems run elsewhere. Vendors should keep senior sales and incident response teams in the capital, because large banks and agencies buy where regulators sit.
CALABARZON and Central Luzon grow fastest on data center campuses
CALABARZON and Central Luzon held a 29.0% share of 2025 value and grow fastest at 11.4% a year. The two regions produced 14.7% and 11.1% of 2024 output, PSA data show and Central Luzon grew 6.5%. PLDT’s VITRO data center in Santa Rosa, Laguna, inaugurated April 24, 2025, is described as the first AI-ready hyperscale data center in the country, and PLDT plans a 100 MW campus in General Trias, Cavite, from 2026 to 2028. Each campus brings colocation tenants that buy network, cloud and access security.
Cebu and Central Visayas build an analyst base
Cebu and Central Visayas held a 19.7% share of 2025 value and grow at 11.1% a year. Central Visayas grew 7.3% in 2024, the fastest pace among the regions in this report, PSA data show. Metro Cebu hosts IT-BPM parks whose clients audit security, and the EY cybersecurity center noted above adds a local pool of analysts. Integrators that place engineers in Cebu can serve domestic buyers and offshore delivery centers without flying teams from Manila.
Davao and Mindanao move through local government budgets
Davao and Mindanao held a 16.4% share of 2025 value and grow at 10.8% a year. Davao Region grew 6.3% in 2024, according to the PSA, which supports spending by banks, retailers and local governments in the south. The Davao City server room consolidation noted above, discussed by the city council on Aug. 25, 2026, will require firewalls, backup and incident response under the Data Privacy Act. Public buyers here move through ordinances and local budgets, so suppliers need patience and local partners.
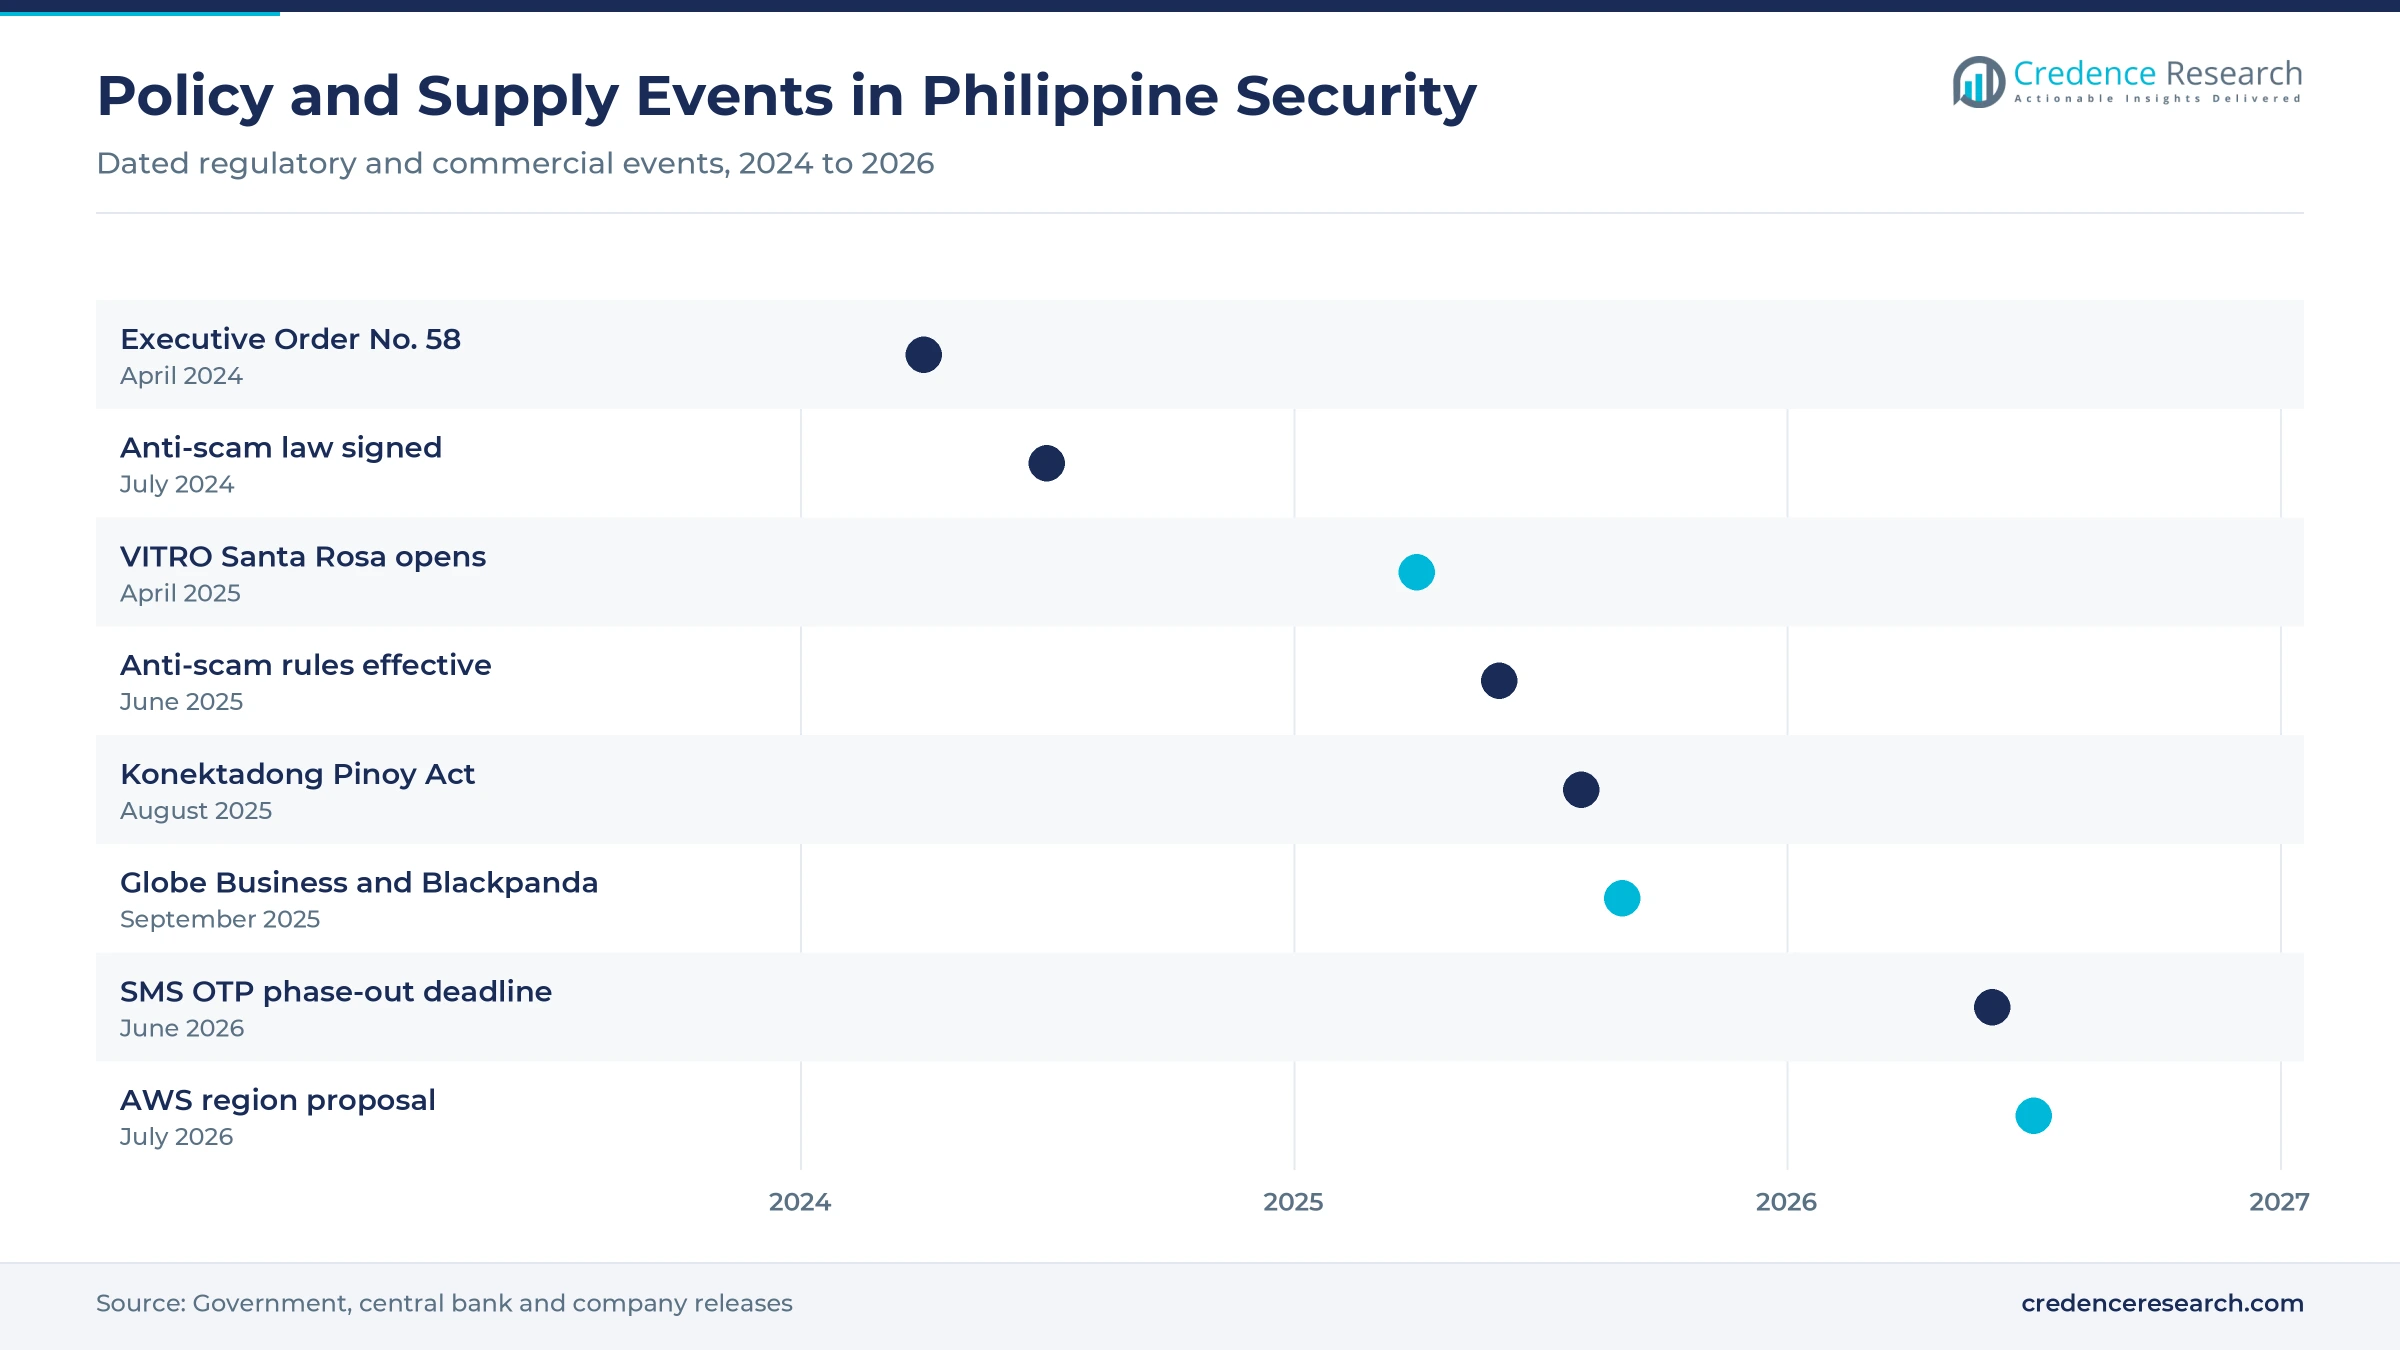
Rules, telecom deals and AI tools mark 2024 to 2026
| Development | Status and market relevance |
|---|---|
| In April 2024, President Ferdinand R. Marcos Jr. signed Executive Order No. 58 adopting the National Cybersecurity Plan 2023–2028. | In force; agencies must adopt matching security plans |
| In June 2025, the BSP issued implementing rules for the Anti-Financial Account Scamming Act, effective June 25, 2025. | In force; fraud management upgrades were due by June 2026 |
| In September 2025, Globe Business partnered with Blackpanda to offer IR-1 incident response subscriptions nationwide. | Commercial; widens access to response services for mid-market firms |
| In November 2025, ePLDT was recognized as a Microsoft Solutions Partner for Security. | Commercial; strengthens telecom-led managed security |
| In April 2026, Palo Alto Networks rolled out Prisma AIRS 3.0 and Prisma Browser for Business across ASEAN, including the Philippines. | Launched; extends AI and browser security to local buyers |
Biometrics, XDR and cloud access shape buying choices
- Server-side biometrics verify customers on bank servers rather than on the device, which addresses the interception risk that pushed regulators away from text codes.
- Extended detection and response correlates endpoint, email and identity signals in one console, which lets small teams handle alert volumes they could not triage by hand.
- Secure access service edge moves firewall and web filtering into the cloud, which suits hybrid IT-BPM workforces and branch networks spread across the islands.
- AI security controls monitor prompts, agents and data flows in generative AI tools, a need that grows as staff adopt AI without approval.
Need a Custom Version of This Report?
Tailor the scope, geography, or segments to your exact requirements.
- Custom geography or segment scope
- Direct access to our analyst team
Global platforms reach buyers through local carriers
Competition in the Philippines cybersecurity market splits between global platform vendors and local telecom service providers. Fortinet and Palo Alto Networks compete hardest for firewall and secure access projects, while Cisco brings networking scale and an integrated security portfolio. Microsoft gains through identity and detection suites bundled with productivity licenses, and TrendAI, the enterprise business of Trend Micro, draws on long ties with the DICT, including training for staff at the 32 security operations centers under the national SOC program. Check Point, Sophos and IBM serve banks, mid-market firms and large enterprises with threat prevention, endpoint and consulting offers. ePLDT and Globe Business resell these platforms with monitoring and connectivity, which gives them the widest reach outside top-tier accounts. Suppliers win on local analyst coverage, response time and compliance support more than on list price.
Who controls supply, and where are the margins thickest?
Philippines cybersecurity supply runs through three layers that each take a different share of the buyer’s spending. Global platform vendors such as Fortinet, Palo Alto Networks, Cisco, Microsoft, Check Point and TrendAI own the technology and capture license margins, while local distributors such as MEC Networks and integrators handle deployment. Telecom groups ePLDT and Globe Business form the third layer, reselling platforms with monitoring and connectivity, and they hold the strongest position with mid-market buyers. Concentration is moderate among platform vendors but highly fragmented among local integrators. Barriers are highest in round-the-clock monitoring, where analyst headcount and certifications decide who can bid, and margins are richest in recurring managed contracts rather than one-off hardware sales.
Which suppliers do Philippine security buyers shortlist?
| Company | Type | Role in the market |
|---|---|---|
| Fortinet | Platform vendor | Firewalls, secure access and training, sold through local distributor MEC Networks |
| Palo Alto Networks | Platform vendor | Network, cloud and AI security platforms, including Prisma SASE and Prisma AIRS |
| TrendAI (Trend Micro) | Platform vendor | Vision One endpoint, cloud and network security; DICT training partner |
| Cisco | Platform vendor | Network security and integrated security portfolio for enterprises and carriers |
| Microsoft | Platform vendor | Entra identity and Defender detection suites sold by user subscription |
| Check Point Software Technologies | Platform vendor | Firewalls and threat prevention, plus cloud and email security for enterprises and agencies |
| IBM | Software and services | Identity security, cybersecurity consulting and services for large enterprises |
| Sophos | Endpoint specialist | Endpoint protection, firewalls and managed detection for mid-market firms |
| ePLDT (PLDT) | Telecom service provider | Managed security and Microsoft-based detection and response for enterprise clients |
| Globe Business (Globe Telecom) | Telecom service provider | Managed detection, incident response and Blackpanda IR-1 subscriptions |
Regulatory deadlines will steer budgets to 2030
Credence Research’s view is that regulation, more than threat headlines, will decide where Philippines cybersecurity budgets go through 2030. The anti-scam rules forced banks and e-wallets to buy authentication and fraud analytics on a fixed timetable, and similar obligations for agencies and data transmission operators are next. Government and public services spending grows fastest, at 11.9% a year, as the national plan reaches agencies and local governments. Suppliers that combine local analysts, telecom distribution and compliance reporting will capture most new contracts, while vendors selling single products face price pressure.
National output and security budgets anchor the estimate
The Philippines cybersecurity estimate uses 2025 as the base year and forecasts values to 2035. Market values come from the Credence Research model, and segment, pricing-model and regional splits are Credence Research estimates. The size was cross-checked against national output, the share of IT budgets that surveyed firms assign to security, and vendor list prices. Evidence comes from the BSP, the DICT, the Philippine Statistics Authority, ITU, executive orders and laws, company announcements and national press. No interviews or surveys were conducted, and consumer antivirus and physical security are excluded.
Renewals, audits and managed services carry growth
Philippines cybersecurity spending should reach USD 721.2 million by 2035 because the rules adopted from 2024 to 2026 keep generating renewals, audits and upgrades long after their first deadlines. Cloud Security should expand at 12.2% a year as hyperscale campuses in Laguna and Cavite fill and as workloads leave in-house server rooms. Managed retainers will widen coverage among mid-market firms that cannot hire analysts. The main risks are a thin talent pipeline and dollar-priced licenses, although wider training and peso-denominated bundles from carriers could ease both.
What decides whether growth lands low, mid or high?
The range of outcomes turns on enforcement and talent rather than on threat volume, which is rising in every case. A downside path follows if regulators relax deadlines and peso weakness delays dollar-priced renewals. The base case assumes steady enforcement of the anti-scam rules and continued data center construction. An upside path needs the proposed AWS region to proceed, wider agency adoption of the national plan and faster growth in certified analysts, which together would bring mid-market firms into managed contracts sooner.
| Scenario | CAGR, 2026–2035 | Value, 2035 | What has to hold |
|---|---|---|---|
| Downside | 8.9% | USD 611.7 million | Deadlines relax, the peso weakens and mid-market buyers delay renewals of dollar-priced licenses |
| Base | 10.91% | USD 721.2 million | Anti-scam rules stay enforced and data center construction continues on current schedules |
| Upside | 12.4% | USD 813.2 million | A local AWS region proceeds while agency plans and analyst training scale faster |
Frequently Asked Questions
How big is the Philippines cybersecurity market?
Which region leads security spending in the Philippines?
Which region grows fastest?
Which industry spends the most on security?
What did BSP Circular No. 1213 change?
How much do security subscriptions cost?
What is the biggest challenge for buyers?
Which companies are active in the market?
Table of Content
Chapter 1 Market Segmentation
- 1.1 Segmentation Framework
- 1.1.1 Product and Service Classification
- 1.1.2 Application and End-Use Classification
- 1.1.3 Technology and Solution Classification
- 1.1.4 Customer and Distribution Channel Classification
- 1.1.5 Geographic Segmentation
- 1.1.6 Market Segment Definitions and Boundaries
- 1.2 By Solution Type
- 1.2.1 Network Security
- 1.2.2 Endpoint and Extended Detection
- 1.2.3 Cloud Security
- 1.2.4 Identity and Access Management
- 1.3 By Deployment Model
- 1.3.1 On-Premises
- 1.3.2 Public Cloud
- 1.3.3 Private Cloud
- 1.3.4 Hybrid Cloud
- 1.4 By End-Use Industry
- 1.4.1 Financial Services
- 1.4.2 IT-BPM and Telecommunications
- 1.4.3 Government and Public Services
- 1.4.4 Retail, Healthcare and Digital Commerce
- 1.5 By Pricing Model
- 1.5.1 Per-User Subscription
- 1.5.2 Per-Endpoint Subscription
- 1.5.3 Usage-Based Cloud Security
- 1.5.4 Managed-Service Retainer
Chapter 2 Introduction
- 2.1 Report Objectives and Scope
- 2.2 Product Definition and Industry Terminology
- 2.3 Market Inclusions and Exclusions
- 2.4 Research Process
- 2.4.1 Primary Research and Expert Interviews
- 2.4.2 Secondary Research and Source Review
- 2.4.3 Top-Down and Bottom-Up Estimation
- 2.4.4 Data Triangulation and Verification
- 2.5 Market Size Measurement Basis
- 2.5.1 2025: USD 249.5 million → 2035: USD 721.2 million
- 2.6 Historical and Forecast Reference Periods
- 2.6.1 Historical Period: 2018-2025
- 2.6.2 Base Year: 2025
- 2.6.3 Forecast Period: 2025-2035
- 2.7 Research Assumptions and Limitations
Chapter 3 Executive Summary
- 3.1 Market Snapshot and Key Findings
- 3.2 Base-Year Market Size, 2025
- 3.3 Forecast Market Size, 2035
- 3.4 Revenue and Volume Growth Outlook
- 3.5 Key Demand and Supply Indicators
- 3.6 Leading Market Segments
- 3.7 Fastest-Growing Market Opportunities
- 3.8 Regional Performance Highlights
- 3.9 Technology and Industry Transformation
- 3.10 Competitive Landscape Summary
- 3.11 Analyst View and Strategic Implications
Chapter 4 Philippines Cybersecurity Market Trends and Developments
- 4.1 Historical Industry Development, 2018-2025
- 4.2 Recent Market Trends and Developments
- 4.3 Demand and Customer Behavior Trends
- 4.4 Technology and Product Innovation
- 4.5 Artificial Intelligence, Automation and Digitalization
- 4.6 Local Manufacturing and Supply Chain Realignment
- 4.7 Industry Partnerships, Mergers and Acquisitions
- 4.8 Sustainability and Circular Economy Developments
- 4.9 Government and Private Sector Investment Trends
- 4.10 Emerging Business Models and Commercialization
- 4.11 Industry Developments and Announcements
Chapter 5 Philippines Cybersecurity Market Supply and Demand Analysis
- 5.1 Demand Trend and Consumption Analysis, 2018-2025
- 5.2 Demand Forecast, 2025-2035
- 5.3 Supply Chain Structure and Procurement Trends
- 5.4 Supply-Demand Gap and Bottlenecks
- 5.5 Import Dependence and Sourcing Structure
- 5.6 Regional Supply and Demand Concentration
Chapter 6 Philippines Cybersecurity Market Pricing Analysis
- 6.1 Pricing Structure and Measurement
- 6.2 Historical Pricing Trends, 2018-2025
- 6.3 Pricing Outlook, 2025-2035
- 6.4 Pricing by Product and Market Segment
- 6.5 Geographic Pricing Differences
- 6.6 Key Input, Energy, Labor and Logistics Costs
- 6.7 Contract Pricing and Purchasing Models
- 6.8 Pricing Sensitivity and Competitive Positioning
- 6.9 Price, Margin and Profitability Implications
Chapter 7 Philippines Cybersecurity Market Dynamics
- 7.1 Market Growth Drivers
- 7.1.1 Demand-Side Drivers
- 7.1.2 Technology and Innovation Drivers
- 7.1.3 Infrastructure and Investment Drivers
- 7.1.4 Regulatory and Policy Drivers
- 7.2 Market Restraints
- 7.2.1 Cost and Affordability Constraints
- 7.2.2 Technology and Adoption Barriers
- 7.2.3 Supply Chain and Operational Constraints
- 7.3 Market Challenges
- 7.3.1 Competitive Pressure and Margin Erosion
- 7.3.2 Skills, Infrastructure and Implementation Gaps
- 7.4 Emerging Market Opportunities
- 7.5 Market Dynamics Impact and Time-Horizon Assessment
Chapter 8 Philippines Cybersecurity Value Chain Analysis
- 8.1 Industry Value Chain Overview
- 8.2 Upstream Suppliers and Critical Inputs
- 8.3 Technology and Component Providers
- 8.4 Manufacturing or Service Delivery
- 8.5 Distribution, Channel Partners and Integrators
- 8.6 Downstream Applications and End Users
- 8.7 Value Addition and Profit Pools
- 8.8 Vertical Integration and Outsourcing
- 8.9 Supplier Concentration and Risk
- 8.10 Supply Chain Localization and Resilience
Chapter 9 Philippines Cybersecurity Market Regulations and Policies
- 9.1 Relevant Laws, Standards and Compliance Frameworks
- 9.2 Product, Service, Safety and Quality Requirements
- 9.3 Government Policies, Incentives and Subsidies
- 9.4 Imports, Exports and Trade Barriers
- 9.5 Public Procurement and Local Content Requirements
- 9.6 Data Protection, AI and Cybersecurity Compliance
- 9.7 Upcoming Policy Changes and Market Implications
Chapter 10 Philippines Cybersecurity Market Hotspots and Opportunities
- 10.1 Market Opportunity Mapping and Growth Hotspots
- 10.2 High-Growth Applications and Customer Groups
- 10.3 Underserved Markets and White-Space Opportunities
- 10.4 Emerging Technology and Product Opportunities
- 10.5 New Capacity and Investment Hotspots
- 10.6 Market Entry and Expansion Opportunities
- 10.7 Distribution and Partnership Opportunities
- 10.8 Near-Term and Long-Term Commercial Potential
- 10.9 Opportunity Attractiveness and Execution Risks
Chapter 11 Philippines Cybersecurity Market Outlook, 2025-2035
- 11.1 Market Size and Analysis
- 11.1.1 Revenue (Market Measurement: 2025: USD 249.5 million → 2035: USD 721.2 million)
- 11.1.2 Historical Market Size, 2018-2025
- 11.1.3 Base-Year Market Size, 2025
- 11.2 Market Forecast, 2025-2035
- 11.2.1 Revenue Forecast to 2035
- 11.2.2 CAGR and Year-on-Year Growth
- 11.2.3 Incremental Revenue Opportunity
- 11.3 Forecast Assumptions and Scenario Analysis
- 11.3.1 Base-Case Forecast
- 11.3.2 Optimistic and Conservative Scenarios
- 11.3.3 Technology, Pricing and Policy Sensitivities
- 11.4 Market Attractiveness and Growth Outlook
Chapter 12 Philippines Cybersecurity Market Segmentation and Outlook
- 12.1 Segmentation Summary and Market Shares, 2025
- 12.2 Largest and Fastest-Growing Segments
- 12.3 By Solution Type - Market Size and Forecast, 2025-2035
- 12.3.1 Segment Definition and Scope
- 12.3.2 Historical Market Size, 2018-2025
- 12.3.3 Revenue Forecast, 2025-2035
- 12.3.4 Base-Year Market Share, 2025
- 12.3.5 Segment CAGR and Growth Drivers
- 12.3.6 Subsegment Market Size and Forecast
- 12.3.6.1 Network Security
- 12.3.6.2 Endpoint and Extended Detection
- 12.3.6.3 Cloud Security
- 12.3.6.4 Identity and Access Management
- 12.3.7 Subsegment Pricing and Adoption Trends
- 12.3.8 Leading Suppliers and Competition
- 12.3.9 Regional Demand and Opportunities
- 12.4 By Deployment Model - Market Size and Forecast, 2025-2035
- 12.4.1 Segment Definition and Scope
- 12.4.2 Historical Market Size, 2018-2025
- 12.4.3 Revenue Forecast, 2025-2035
- 12.4.4 Base-Year Market Share, 2025
- 12.4.5 Segment CAGR and Growth Drivers
- 12.4.6 Subsegment Market Size and Forecast
- 12.4.6.1 On-Premises
- 12.4.6.2 Public Cloud
- 12.4.6.3 Private Cloud
- 12.4.6.4 Hybrid Cloud
- 12.4.7 Subsegment Pricing and Adoption Trends
- 12.4.8 Leading Suppliers and Competition
- 12.4.9 Regional Demand and Opportunities
- 12.5 By End-Use Industry - Market Size and Forecast, 2025-2035
- 12.5.1 Segment Definition and Scope
- 12.5.2 Historical Market Size, 2018-2025
- 12.5.3 Revenue Forecast, 2025-2035
- 12.5.4 Base-Year Market Share, 2025
- 12.5.5 Segment CAGR and Growth Drivers
- 12.5.6 Subsegment Market Size and Forecast
- 12.5.6.1 Financial Services
- 12.5.6.2 IT-BPM and Telecommunications
- 12.5.6.3 Government and Public Services
- 12.5.6.4 Retail, Healthcare and Digital Commerce
- 12.5.7 Subsegment Pricing and Adoption Trends
- 12.5.8 Leading Suppliers and Competition
- 12.5.9 Regional Demand and Opportunities
- 12.6 By Pricing Model - Market Size and Forecast, 2025-2035
- 12.6.1 Segment Definition and Scope
- 12.6.2 Historical Market Size, 2018-2025
- 12.6.3 Revenue Forecast, 2025-2035
- 12.6.4 Base-Year Market Share, 2025
- 12.6.5 Segment CAGR and Growth Drivers
- 12.6.6 Subsegment Market Size and Forecast
- 12.6.6.1 Per-User Subscription
- 12.6.6.2 Per-Endpoint Subscription
- 12.6.6.3 Usage-Based Cloud Security
- 12.6.6.4 Managed-Service Retainer
- 12.6.7 Subsegment Pricing and Adoption Trends
- 12.6.8 Leading Suppliers and Competition
- 12.6.9 Regional Demand and Opportunities
- 12.7 Segment Growth Comparison
- 12.8 Segment Attractiveness and Priority Matrix
Chapter 13 Philippines Cybersecurity End-Use and Application Market Outlook
- 13.1 End-Use Industry and Customer Demand Structure
- 13.2 Leading Applications and Customer Groups
- 13.3 End-Use Market Size, Share and Forecast
- 13.4 Major End-Use Industry Deep Dives
- 13.4.1 Customer Requirements and Use Cases
- 13.4.2 Demand and Replacement Cycles
- 13.4.3 Technical and Regulatory Considerations
- 13.4.4 Purchasing and Procurement Models
- 13.4.5 Leading Vendors and Distribution Channels
- 13.4.6 Forecast and Commercial Opportunities
- 13.5 Emerging Applications and Cross-Segment Demand
- 13.6 End-Use Industry Investment Priorities
Chapter 14 Philippines Cybersecurity Geographic Market Outlook, 2025-2035
- 14.1 Domestic Market Distribution and Demand Clusters
- 14.2 State- or Province-Wise Market Size and Forecast, 2025-2035
- 14.3 City and Metropolitan Market Outlook
- 14.4 Industrial, Manufacturing and Commercial Clusters
- 14.5 Geographic Concentration of Key End Users
- 14.6 Local Pricing and Purchasing Differences
- 14.7 Domestic Production Facilities and Capacity Map
- 14.8 Local Infrastructure and Project Pipeline
- 14.9 State-Level Policy and Incentive Differences
- 14.10 Subnational Investment Hotspots and Opportunities
- 14.11 Distribution and Logistics Networks
- 14.12 Domestic Competitive Footprint
Chapter 15 Philippines Cybersecurity Technology, Innovation and Sustainability Outlook
- 15.1 Technology Landscape and Maturity
- 15.2 Product, Process and Service Innovation
- 15.3 AI, Automation and Digital Tools in the Industry
- 15.4 Technology Adoption and Performance Benchmarking
- 15.5 Innovation Pipeline and R&D Investment
- 15.6 Patent and Intellectual Property Trends
- 15.7 Energy Efficiency and Resource Management
- 15.8 Sustainability, Recycling and Circularity
- 15.9 Technology Roadmap, 2025-2035
- 15.10 Risks of Obsolescence and Technology Substitution
Chapter 16 Philippines Cybersecurity Market Key Strategic Imperatives
- 16.1 Growth and Market Entry Priorities
- 16.2 High-Return Products and Segments
- 16.3 Pricing, Profitability and Cost Optimization
- 16.4 Technology Investment and Product Differentiation
- 16.5 Supply Chain Localization and Resilience
- 16.6 Distribution and Customer Acquisition
- 16.7 Partnership, Acquisition and Capacity Strategy
- 16.8 Regional Expansion Priorities
- 16.9 Short-, Medium- and Long-Term Actions
Chapter 17 Competition Outlook
- 17.1 Industry Competition Characteristics
- 17.2 Market Structure and Concentration
- 17.3 Market Share and Competitive Positioning, 2025
- 17.4 Company-Wise Revenue and Product Benchmarking
- 17.5 Production and Service Capacity Benchmarking
- 17.6 Technology, Pricing and Differentiation
- 17.7 Regional Footprint and Distribution Strength
- 17.8 Mergers, Acquisitions and Strategic Alliances
- 17.9 New Entrants and Competitive Threats
- 17.10 Porter's Five Forces and Industry Attractiveness
- 17.11 Competitive Outlook, 2025-2035
Chapter 18 Company Profiles
- 18.1 Company Coverage and Selection Criteria
- 18.2 Fortinet
- 18.2.1 Business Description
- 18.2.2 Company Ownership and Geographic Presence
- 18.2.3 Product and Service Portfolio
- 18.2.4 Manufacturing and Operating Footprint
- 18.2.5 Financial Performance and Investment
- 18.2.6 Market Share and Competitive Position
- 18.2.7 Technology and Innovation Capabilities
- 18.2.8 Strategic Alliances or Partnerships
- 18.2.9 Recent Developments
- 18.2.10 Growth Strategy and Outlook
- 18.3 Palo Alto Networks
- 18.4 TrendAI (Trend Micro)
- 18.5 Cisco
- 18.6 Microsoft
- 18.7 Check Point Software Technologies
- 18.8 IBM
- 18.9 Sophos
- 18.10 ePLDT (PLDT)
- 18.11 Globe Business (Globe Telecom)
- 18.12 Other Relevant Market Participants
Note: Every listed company is profiled on the structure shown under the first company. The company list is preliminary and may change based on research findings, market developments, data availability and client requirements.
Chapter 19 Disclaimer
- 19.1 Research and Forecast Disclaimer
- 19.2 Data Source and Estimation Limitations
Note: The depth of individual sections depends on data availability for this market. Volume, capacity, trade and other unit-based metrics are included where applicable.

